pfp sampler 1787
TRANSCRIPT
PREPARED FOR:
February 18, 2016
Personal Financial Analysis
Roger Lalonde and Joanne Moreau
Initial Analysis
Robert Martin
Financial Consultant
Investors Group Financial Services Inc.
(204) 555-9999
www.investorsgroup.com
BRENDA PHELAN, Consultant
Investors Group Financial Services Inc.
Tel: (519) 650-7250
SAMPLE
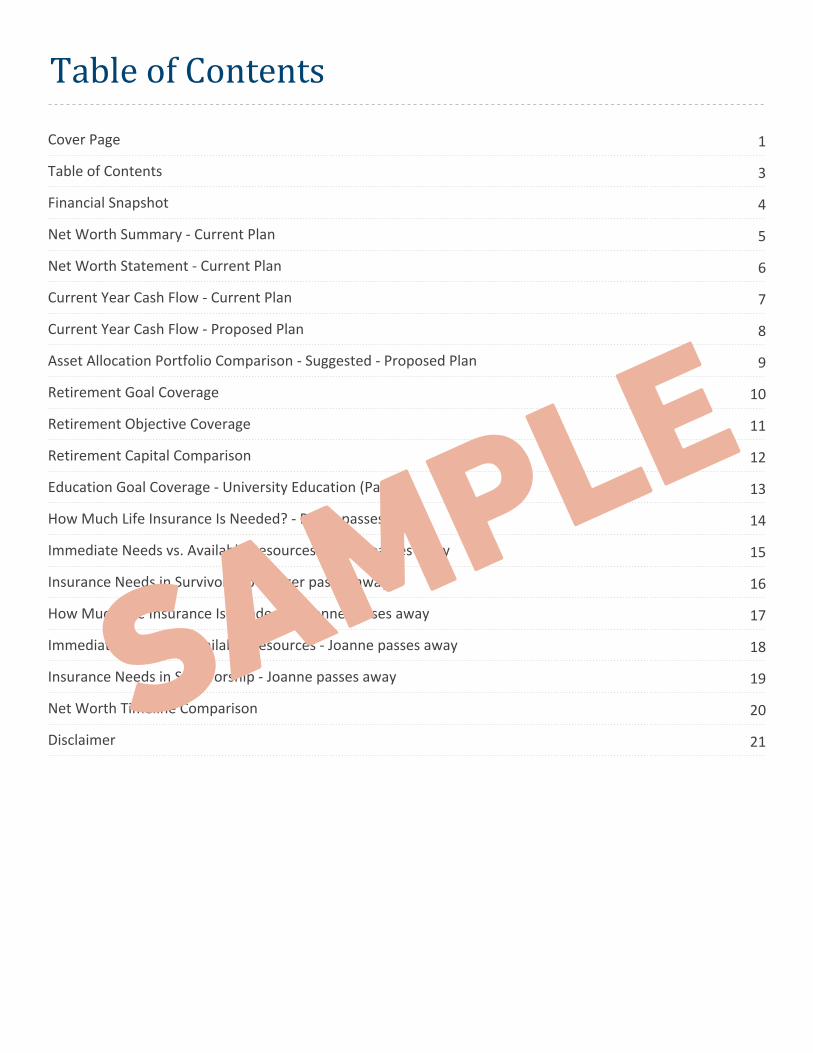
Table of Contents
1Cover Page
3Table of Contents
4Financial Snapshot
5Net Worth Summary - Current Plan
6Net Worth Statement - Current Plan
7Current Year Cash Flow - Current Plan
8Current Year Cash Flow - Proposed Plan
9Asset Allocation Portfolio Comparison - Suggested - Proposed Plan
10Retirement Goal Coverage
11Retirement Objective Coverage
12Retirement Capital Comparison
13Education Goal Coverage - University Education (Paul)
14How Much Life Insurance Is Needed? - Roger passes away
15Immediate Needs vs. Available Resources - Roger passes away
16Insurance Needs in Survivorship - Roger passes away
17How Much Life Insurance Is Needed? - Joanne passes away
18Immediate Needs vs. Available Resources - Joanne passes away
19Insurance Needs in Survivorship - Joanne passes away
20Net Worth Timeline Comparison
21DisclaimerSAMPLE
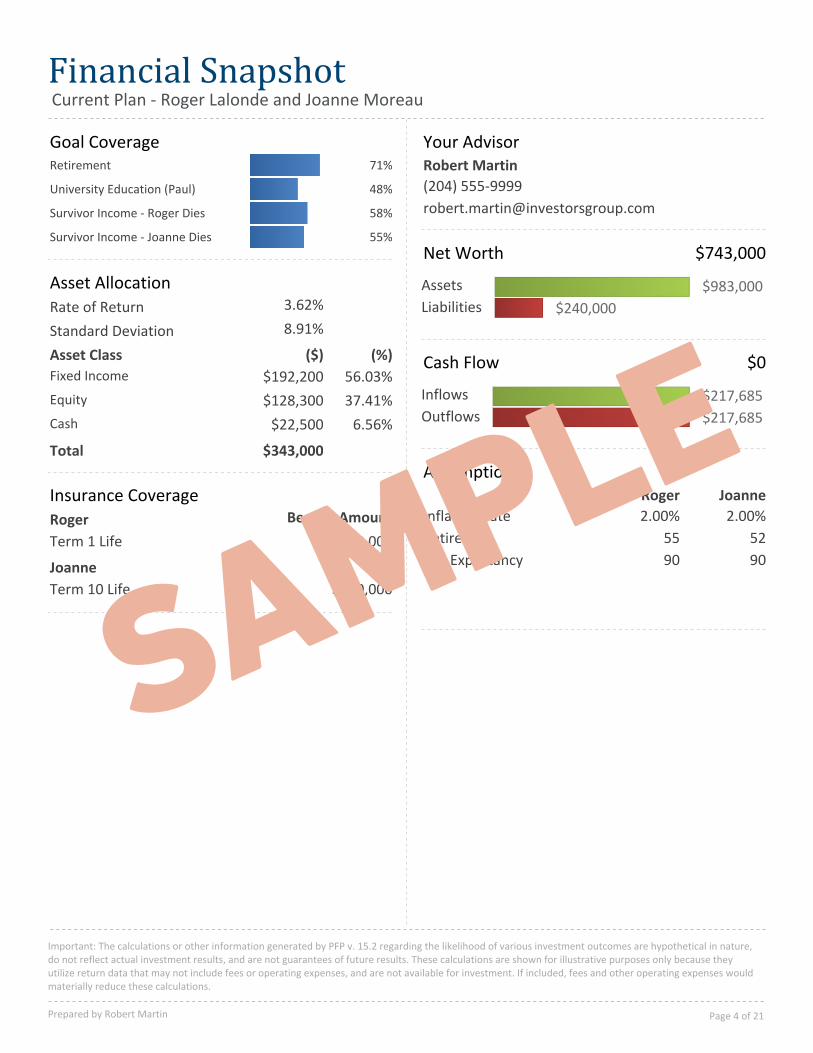
Financial SnapshotCurrent Plan - Roger Lalonde and Joanne Moreau
Your AdvisorRobert Martin
(204) 555-9999
Net Worth
$240,000
$983,000Assets
Liabilities
$743,000
Cash Flow $0
$217,685
$217,685Inflows
Outflows
Assumptions
9090Life Expectancy
5255Retire At
2.00%2.00%Inflation Rate
JoanneRoger
Goal Coverage71%Retirement
48%University Education (Paul)
58%Survivor Income - Roger Dies
55%Survivor Income - Joanne Dies
Asset Allocation
8.91%Standard Deviation
3.62%Rate of Return
(%)($)Asset Class
56.03%$192,200Fixed Income
37.41%$128,300Equity
6.56%$22,500Cash
$343,000Total
Insurance CoverageBenefit AmountRoger
$240,000Term 1 Life
Joanne
$250,000Term 10 Life
Important: The calculations or other information generated by PFP v. 15.2 regarding the likelihood of various investment outcomes are hypothetical in nature,do not reflect actual investment results, and are not guarantees of future results. These calculations are shown for illustrative purposes only because theyutilize return data that may not include fees or operating expenses, and are not available for investment. If included, fees and other operating expenses wouldmaterially reduce these calculations.
Prepared by Robert Martin Page 4 of 21
SAMPLE
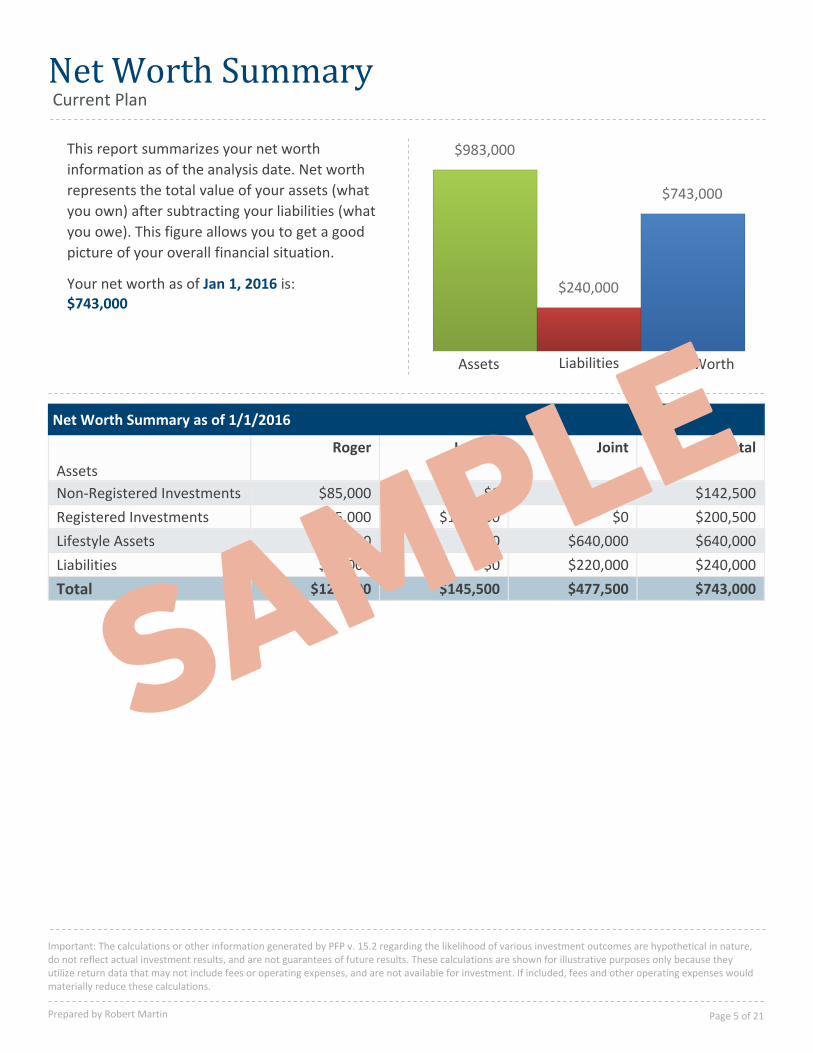
Net Worth SummaryCurrent Plan
Liabilities Net WorthAssets
This report summarizes your net worth
information as of the analysis date. Net worth
represents the total value of your assets (what
you own) after subtracting your liabilities (what
you owe). This figure allows you to get a good
picture of your overall financial situation.
Your net worth as of Jan 1, 2016 is:$743,000
$983,000
$240,000
$743,000
$743,000$477,500$145,500$120,000Total
$240,000$220,000$0$20,000Liabilities
$640,000$640,000$0$0Lifestyle Assets
$200,500$0$145,500$55,000Registered Investments
$142,500$57,500$0$85,000Non-Registered Investments
TotalJointJoanneRoger
Assets
Net Worth Summary as of 1/1/2016
Important: The calculations or other information generated by PFP v. 15.2 regarding the likelihood of various investment outcomes are hypothetical in nature,do not reflect actual investment results, and are not guarantees of future results. These calculations are shown for illustrative purposes only because theyutilize return data that may not include fees or operating expenses, and are not available for investment. If included, fees and other operating expenses wouldmaterially reduce these calculations.
Prepared by Robert Martin Page 5 of 21
SAMPLE
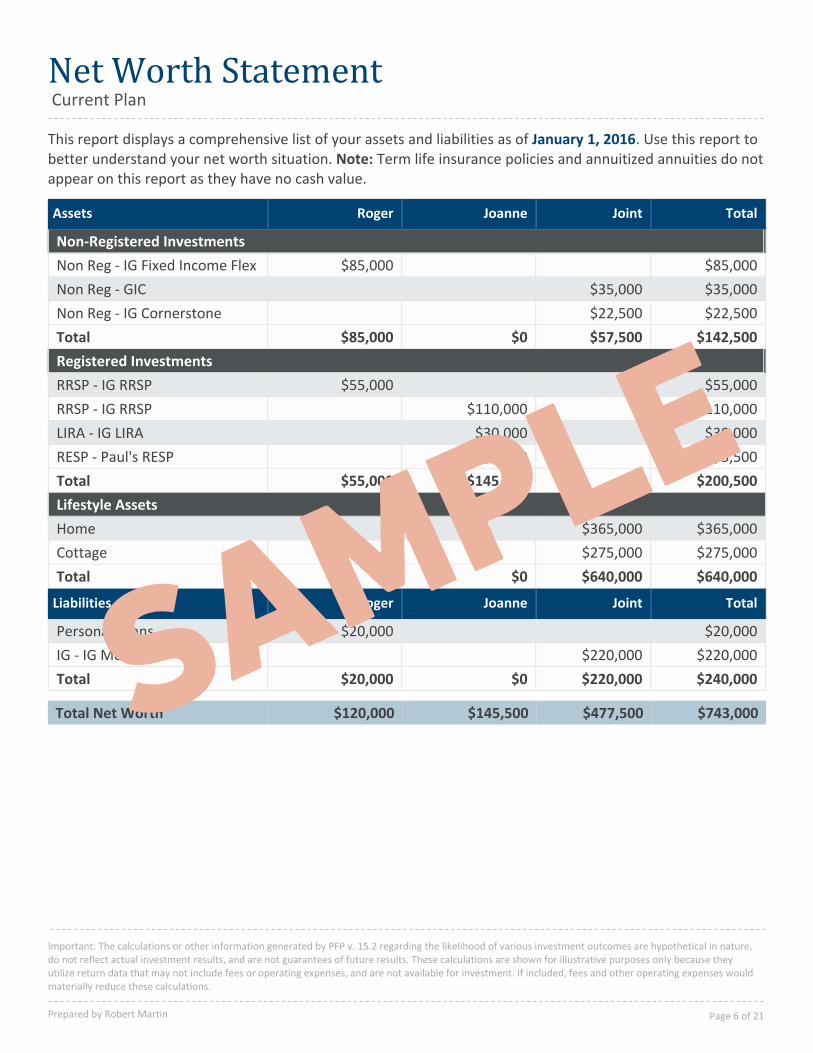
Net Worth StatementCurrent Plan
This report displays a comprehensive list of your assets and liabilities as of January 1, 2016. Use this report to better understand your net worth situation. Note: Term life insurance policies and annuitized annuities do not appear on this report as they have no cash value.
TotalJointJoanneRogerAssets
Non-Registered Investments
$85,000$85,000Non Reg - IG Fixed Income Flex
$35,000$35,000Non Reg - GIC
$22,500$22,500Non Reg - IG Cornerstone
$142,500$57,500$0$85,000Total
Registered Investments
$55,000$55,000RRSP - IG RRSP
$110,000$110,000RRSP - IG RRSP
$30,000$30,000LIRA - IG LIRA
$5,500$5,500RESP - Paul's RESP
$200,500$0$145,500$55,000Total
Lifestyle Assets
$365,000$365,000Home
$275,000$275,000Cottage
$640,000$640,000$0$0Total
TotalJointJoanneRogerLiabilities
$20,000$20,000Personal Loans
$220,000$220,000IG - IG Mortgage
$240,000$220,000$0$20,000Total
$743,000$477,500$145,500$120,000Total Net Worth
Important: The calculations or other information generated by PFP v. 15.2 regarding the likelihood of various investment outcomes are hypothetical in nature,do not reflect actual investment results, and are not guarantees of future results. These calculations are shown for illustrative purposes only because theyutilize return data that may not include fees or operating expenses, and are not available for investment. If included, fees and other operating expenses wouldmaterially reduce these calculations.
Prepared by Robert Martin Page 6 of 21
SAMPLE
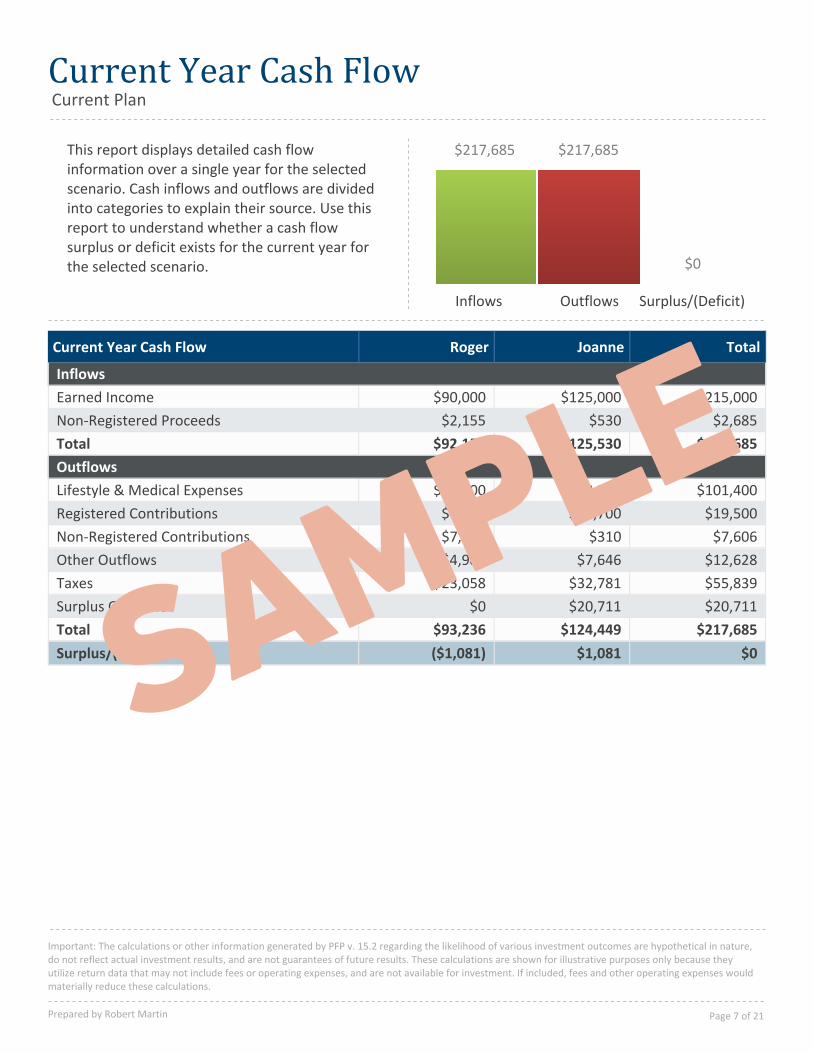
Current Year Cash FlowCurrent Plan
$217,685 $217,685
$0
Surplus/(Deficit)OutflowsInflows
This report displays detailed cash flowinformation over a single year for the selectedscenario. Cash inflows and outflows are dividedinto categories to explain their source. Use thisreport to understand whether a cash flowsurplus or deficit exists for the current year forthe selected scenario.
$0$1,081($1,081)Surplus/(Deficit)
$217,685$124,449$93,236Total
$20,711$20,711$0Surplus Outflows
$55,839$32,781$23,058Taxes
$12,628$7,646$4,982Other Outflows
$7,606$310$7,295Non-Registered Contributions
$19,500$14,700$4,800Registered Contributions
$101,400$48,300$53,100Lifestyle & Medical Expenses
Outflows
$217,685$125,530$92,155Total
$2,685$530$2,155Non-Registered Proceeds
$215,000$125,000$90,000Earned Income
Inflows
TotalJoanneRogerCurrent Year Cash Flow
Important: The calculations or other information generated by PFP v. 15.2 regarding the likelihood of various investment outcomes are hypothetical in nature,do not reflect actual investment results, and are not guarantees of future results. These calculations are shown for illustrative purposes only because theyutilize return data that may not include fees or operating expenses, and are not available for investment. If included, fees and other operating expenses wouldmaterially reduce these calculations.
Prepared by Robert Martin Page 7 of 21
SAMPLE
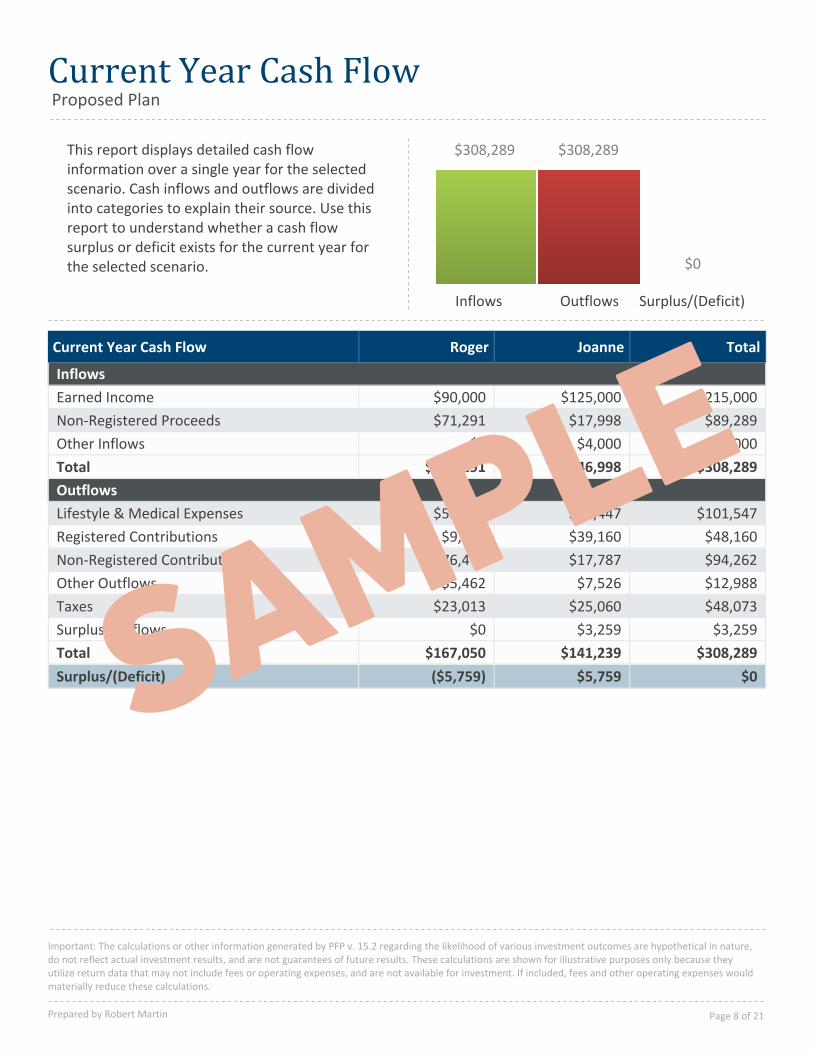
Current Year Cash FlowProposed Plan
$308,289 $308,289
$0
Surplus/(Deficit)OutflowsInflows
This report displays detailed cash flowinformation over a single year for the selectedscenario. Cash inflows and outflows are dividedinto categories to explain their source. Use thisreport to understand whether a cash flowsurplus or deficit exists for the current year forthe selected scenario.
$0$5,759($5,759)Surplus/(Deficit)
$308,289$141,239$167,050Total
$3,259$3,259$0Surplus Outflows
$48,073$25,060$23,013Taxes
$12,988$7,526$5,462Other Outflows
$94,262$17,787$76,475Non-Registered Contributions
$48,160$39,160$9,000Registered Contributions
$101,547$48,447$53,100Lifestyle & Medical Expenses
Outflows
$308,289$146,998$161,291Total
$4,000$4,000$0Other Inflows
$89,289$17,998$71,291Non-Registered Proceeds
$215,000$125,000$90,000Earned Income
Inflows
TotalJoanneRogerCurrent Year Cash Flow
Important: The calculations or other information generated by PFP v. 15.2 regarding the likelihood of various investment outcomes are hypothetical in nature,do not reflect actual investment results, and are not guarantees of future results. These calculations are shown for illustrative purposes only because theyutilize return data that may not include fees or operating expenses, and are not available for investment. If included, fees and other operating expenses wouldmaterially reduce these calculations.
Prepared by Robert Martin Page 8 of 21
SAMPLE
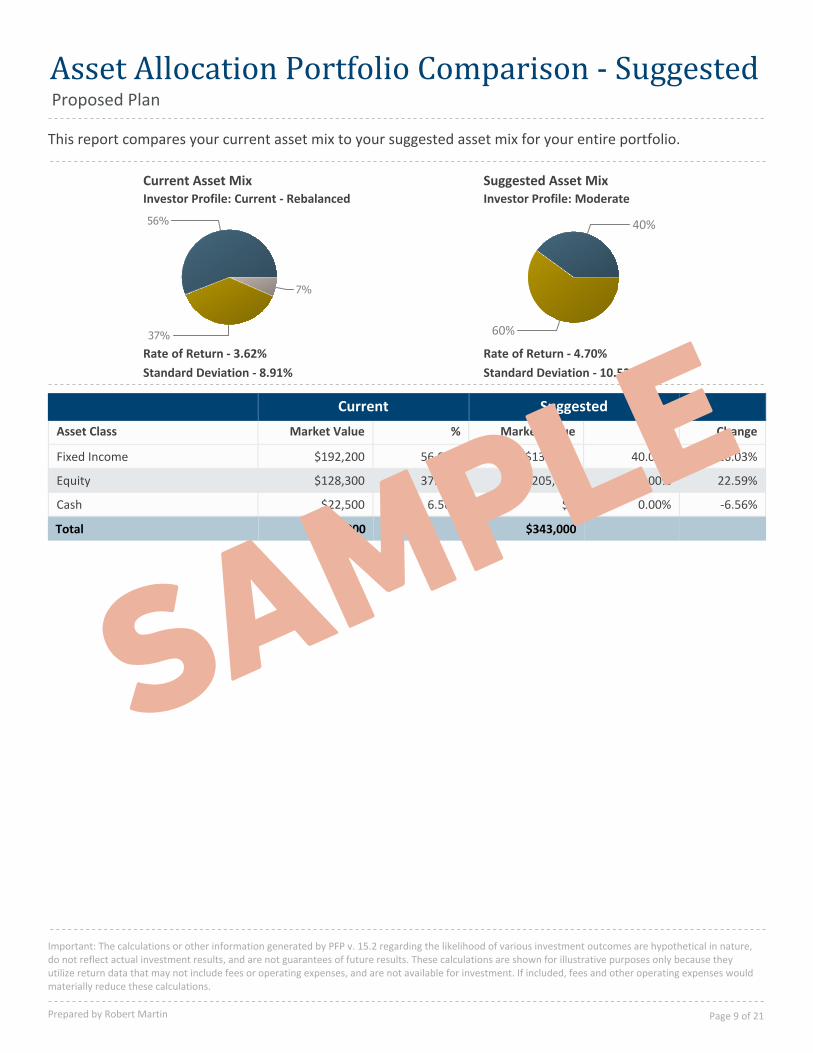
Asset Allocation Portfolio Comparison - SuggestedProposed Plan
This report compares your current asset mix to your suggested asset mix for your entire portfolio.
Standard Deviation - 10.52%
Rate of Return - 4.70%
Standard Deviation - 8.91%
Rate of Return - 3.62%
Current Asset Mix
56%
37%
7%
40%
60%
Suggested Asset MixInvestor Profile: Current - Rebalanced Investor Profile: Moderate
Change%Market Value%Market ValueAsset Class
SuggestedCurrent
-16.03%40.00%$137,20056.03%$192,200Fixed Income
22.59%60.00%$205,80037.41%$128,300Equity
-6.56%0.00%$06.56%$22,500Cash
$343,000$343,000Total
Important: The calculations or other information generated by PFP v. 15.2 regarding the likelihood of various investment outcomes are hypothetical in nature,do not reflect actual investment results, and are not guarantees of future results. These calculations are shown for illustrative purposes only because theyutilize return data that may not include fees or operating expenses, and are not available for investment. If included, fees and other operating expenses wouldmaterially reduce these calculations.
Prepared by Robert Martin Page 9 of 21
SAMPLE
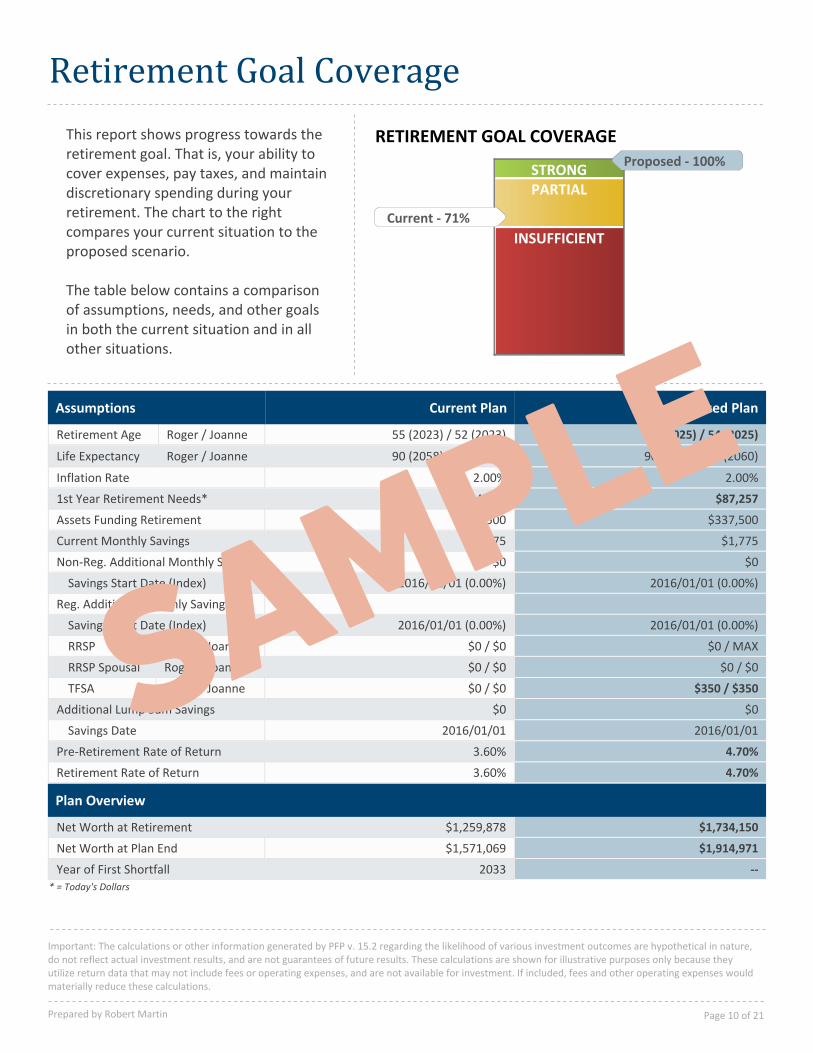
Retirement Goal Coverage
STRONGPARTIAL
INSUFFICIENT
Current - 71%
Proposed - 100%
RETIREMENT GOAL COVERAGEThis report shows progress towards theretirement goal. That is, your ability tocover expenses, pay taxes, and maintaindiscretionary spending during yourretirement. The chart to the rightcompares your current situation to theproposed scenario.
The table below contains a comparisonof assumptions, needs, and other goalsin both the current situation and in allother situations.
--2033Year of First Shortfall
$1,914,971$1,571,069Net Worth at Plan End
$1,734,150$1,259,878Net Worth at Retirement
Plan Overview
4.70%3.60%Retirement Rate of Return
4.70%3.60%Pre-Retirement Rate of Return
2016/01/012016/01/01Savings Date
$0$0Additional Lump Sum Savings
$350 / $350$0 / $0Roger / JoanneTFSA
$0 / $0$0 / $0Roger / JoanneRRSP Spousal
$0 / MAX$0 / $0Roger / JoanneRRSP
2016/01/01 (0.00%)2016/01/01 (0.00%)Savings Start Date (Index)
Reg. Additional Monthly Savings
2016/01/01 (0.00%)2016/01/01 (0.00%)Savings Start Date (Index)
$0$0Non-Reg. Additional Monthly Savings
$1,775$1,775Current Monthly Savings
$337,500$337,500Assets Funding Retirement
$87,257$94,4921st Year Retirement Needs*
2.00%2.00%Inflation Rate
90 (2058) / 90 (2060)90 (2058) / 90 (2060)Roger / JoanneLife Expectancy
57 (2025) / 54 (2025)55 (2023) / 52 (2023)Roger / JoanneRetirement Age
Proposed PlanCurrent PlanAssumptions
* = Today's Dollars
Important: The calculations or other information generated by PFP v. 15.2 regarding the likelihood of various investment outcomes are hypothetical in nature,do not reflect actual investment results, and are not guarantees of future results. These calculations are shown for illustrative purposes only because theyutilize return data that may not include fees or operating expenses, and are not available for investment. If included, fees and other operating expenses wouldmaterially reduce these calculations.
Prepared by Robert Martin Page 10 of 21
SAMPLE
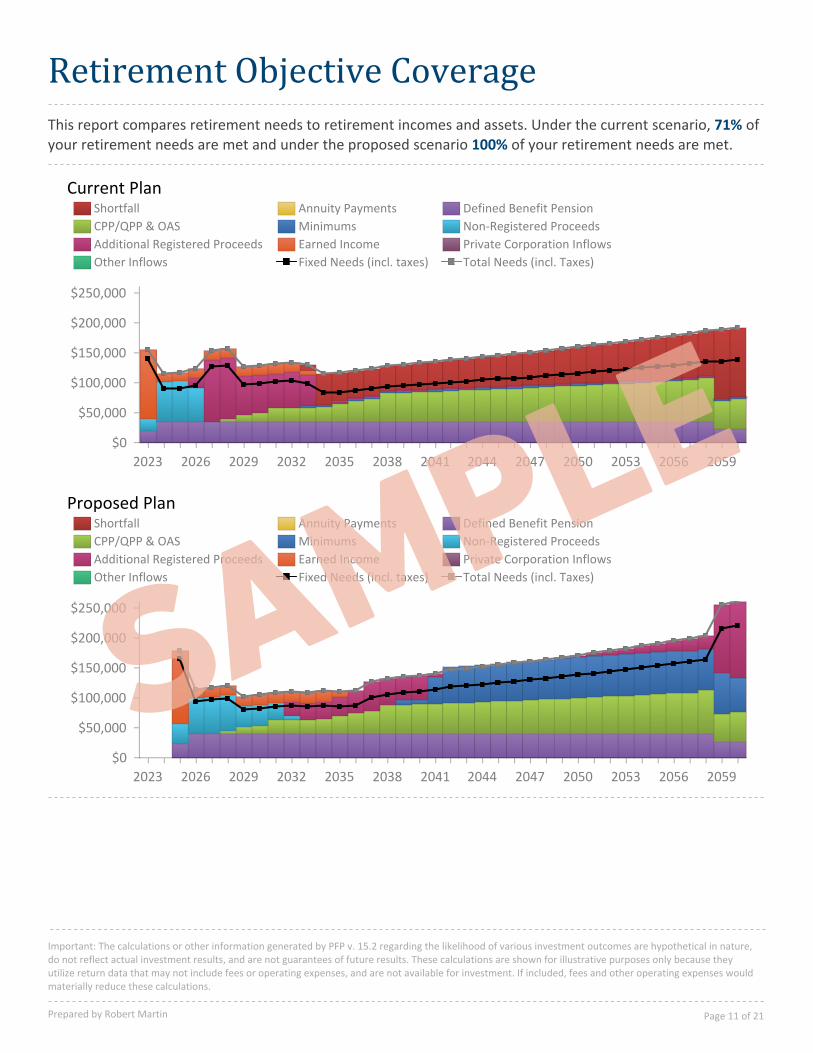
Retirement Objective Coverage
This report compares retirement needs to retirement incomes and assets. Under the current scenario, 71% of your retirement needs are met and under the proposed scenario 100% of your retirement needs are met.
2023 2026 2029 2032 2035 2038 2041 2044 2047 2050 2053 2056 2059
$0
$50,000
$100,000
$150,000
$200,000
$250,000
Shortfall Annuity Payments Defined Benefit Pension
CPP/QPP & OAS Minimums Non-Registered Proceeds
Additional Registered Proceeds Earned Income Private Corporation Inflows
Other Inflows Fixed Needs (incl. taxes) Total Needs (incl. Taxes)
Current Plan
2023 2026 2029 2032 2035 2038 2041 2044 2047 2050 2053 2056 2059
$0
$50,000
$100,000
$150,000
$200,000
$250,000
Shortfall Annuity Payments Defined Benefit Pension
CPP/QPP & OAS Minimums Non-Registered Proceeds
Additional Registered Proceeds Earned Income Private Corporation Inflows
Other Inflows Fixed Needs (incl. taxes) Total Needs (incl. Taxes)
Proposed Plan
Important: The calculations or other information generated by PFP v. 15.2 regarding the likelihood of various investment outcomes are hypothetical in nature,do not reflect actual investment results, and are not guarantees of future results. These calculations are shown for illustrative purposes only because theyutilize return data that may not include fees or operating expenses, and are not available for investment. If included, fees and other operating expenses wouldmaterially reduce these calculations.
Prepared by Robert Martin Page 11 of 21
SAMPLE
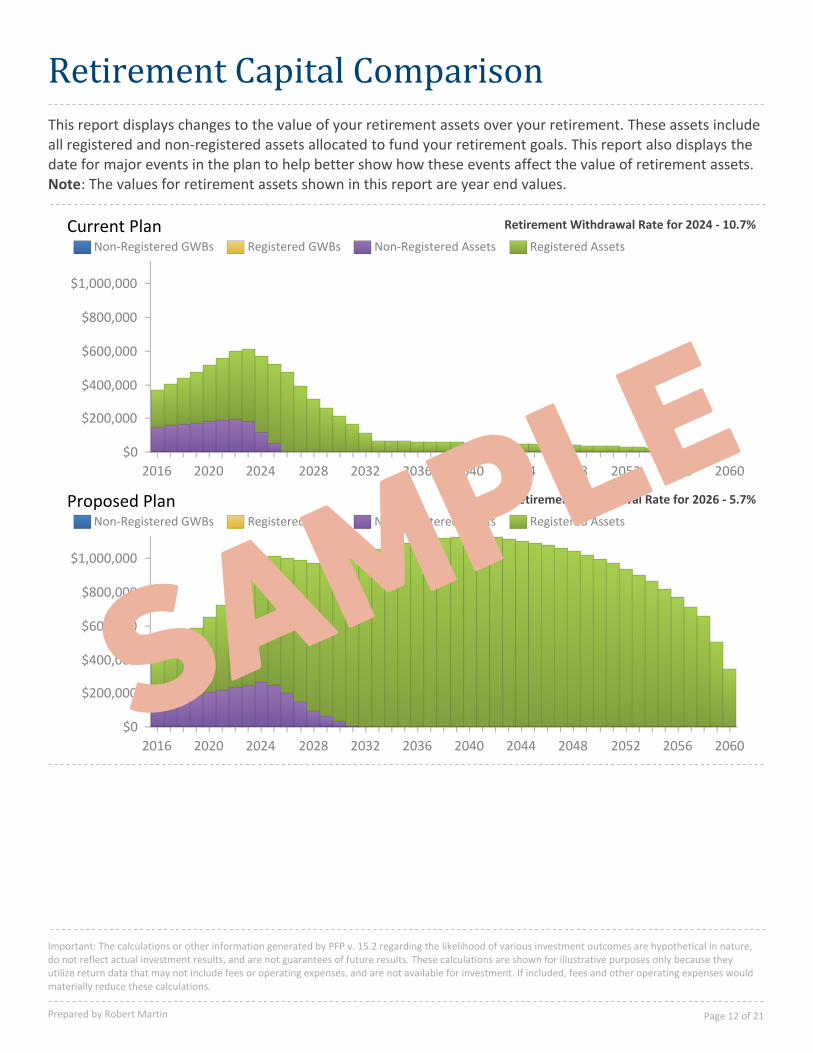
Retirement Capital Comparison
Retirement Withdrawal Rate for 2026 - 5.7%
2016 2020 2024 2028 2032 2036 2040 2044 2048 2052 2056 2060
$0
$200,000
$400,000
$600,000
$800,000
$1,000,000
Non-Registered GWBs Registered GWBs Non-Registered Assets Registered Assets
Current Plan
Proposed Plan
2016 2020 2024 2028 2032 2036 2040 2044 2048 2052 2056 2060
$0
$200,000
$400,000
$600,000
$800,000
$1,000,000
Non-Registered GWBs Registered GWBs Non-Registered Assets Registered Assets
Retirement Withdrawal Rate for 2024 - 10.7%
This report displays changes to the value of your retirement assets over your retirement. These assets include all registered and non-registered assets allocated to fund your retirement goals. This report also displays the date for major events in the plan to help better show how these events affect the value of retirement assets. Note: The values for retirement assets shown in this report are year end values.
Important: The calculations or other information generated by PFP v. 15.2 regarding the likelihood of various investment outcomes are hypothetical in nature,do not reflect actual investment results, and are not guarantees of future results. These calculations are shown for illustrative purposes only because theyutilize return data that may not include fees or operating expenses, and are not available for investment. If included, fees and other operating expenses wouldmaterially reduce these calculations.
Prepared by Robert Martin Page 12 of 21
SAMPLE
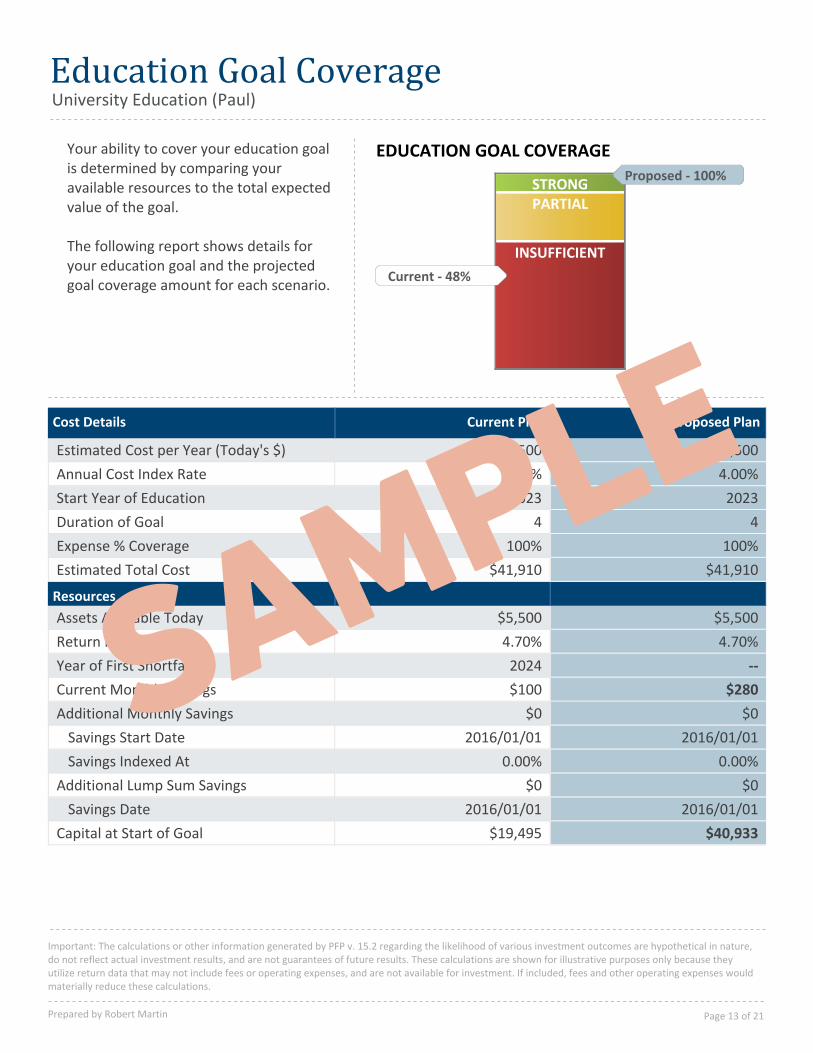
Education Goal CoverageUniversity Education (Paul)
STRONGPARTIAL
INSUFFICIENT
Current - 48%
Proposed - 100%
EDUCATION GOAL COVERAGEYour ability to cover your education goalis determined by comparing youravailable resources to the total expectedvalue of the goal.
The following report shows details foryour education goal and the projectedgoal coverage amount for each scenario.
$40,933$19,495Capital at Start of Goal
2016/01/012016/01/01Savings Date
$0$0Additional Lump Sum Savings
0.00%0.00%Savings Indexed At
2016/01/012016/01/01Savings Start Date
$0$0Additional Monthly Savings
$280$100Current Monthly Savings
--2024Year of First Shortfall
4.70%4.70%Return Rate on Assets
$5,500$5,500Assets Available Today
Resources
$41,910$41,910Estimated Total Cost
100%100%Expense % Coverage
44Duration of Goal
20232023Start Year of Education
4.00%4.00%Annual Cost Index Rate
$7,500$7,500Estimated Cost per Year (Today's $)
Proposed PlanCurrent PlanCost Details
Important: The calculations or other information generated by PFP v. 15.2 regarding the likelihood of various investment outcomes are hypothetical in nature,do not reflect actual investment results, and are not guarantees of future results. These calculations are shown for illustrative purposes only because theyutilize return data that may not include fees or operating expenses, and are not available for investment. If included, fees and other operating expenses wouldmaterially reduce these calculations.
Prepared by Robert Martin Page 13 of 21
SAMPLE

Roger passes awayHow Much Life Insurance Is Needed?
You may require additional life insuranceif your current level of insurance andother available assets do not meet yourtotal life insurance needs. To increase thelikelihood of reaching your financial goals,matching insurance coverage withinsurance need is highly recommended.
Your additional recommended lifeinsurance is determined by adding anyimmediate needs created at the time ofpassing to any survivorship needs thatthis passing creates and subtracting anyassets available to offset these needs.
SURVIVOR INCOME GOAL COVERAGE
STRONGPARTIAL
INSUFFICIENTCurrent - 58%
Proposed - 100%
$0$538,251Additional Insurance Recommended
$0$503,251Additional Insurance Needed for Survivorship
$0($617,750)Total Future Deficits
$1,614,398$872,584Future Inflows
$1,614,398$1,490,334Future Outflows
Insurance Needs in Survivorship
$0$35,000Additional Insurance Needed for ImmediateNeeds
$275,000$240,000Resources Used Immediately
$275,000$275,000Immediate Needs
Immediate Needs vs. Resources Available
Proposed PlanCurrent PlanAdditional Insurance Recommended
Important: The calculations or other information generated by PFP v. 15.2 regarding the likelihood of various investment outcomes are hypothetical in nature,do not reflect actual investment results, and are not guarantees of future results. These calculations are shown for illustrative purposes only because theyutilize return data that may not include fees or operating expenses, and are not available for investment. If included, fees and other operating expenses wouldmaterially reduce these calculations.
Prepared by Robert Martin Page 14 of 21
SAMPLE

Can we meet our survivorship needs if Roger passes away?Immediate Needs vs. Available Resources
When a loved one passes they often leave behindliabilities and expenses. It is important to coverthese needs in order to adequately manage futurecash expenditures.
Some or all of these needs can be offset by makingresources available. Life insurance may be themost important of these resources, although youcan make other resources available to help covercosts.
CURRENT PLAN NEEDS VS. RESOURCES
$0
$100,000
$200,000
$300,000
Needs Resources
$640,000$240,000Total Available Resources
$640,000$240,000Life Insurance HeldAvailable Resources
$275,000$275,000Total Immediate Needs
$260,000$260,000Liabilities
$15,000$15,000Lump Sum Needs
Proposed PlanCurrent PlanImmediate Needs
Important: The calculations or other information generated by PFP v. 15.2 regarding the likelihood of various investment outcomes are hypothetical in nature,do not reflect actual investment results, and are not guarantees of future results. These calculations are shown for illustrative purposes only because theyutilize return data that may not include fees or operating expenses, and are not available for investment. If included, fees and other operating expenses wouldmaterially reduce these calculations.
Prepared by Robert Martin Page 15 of 21
SAMPLE
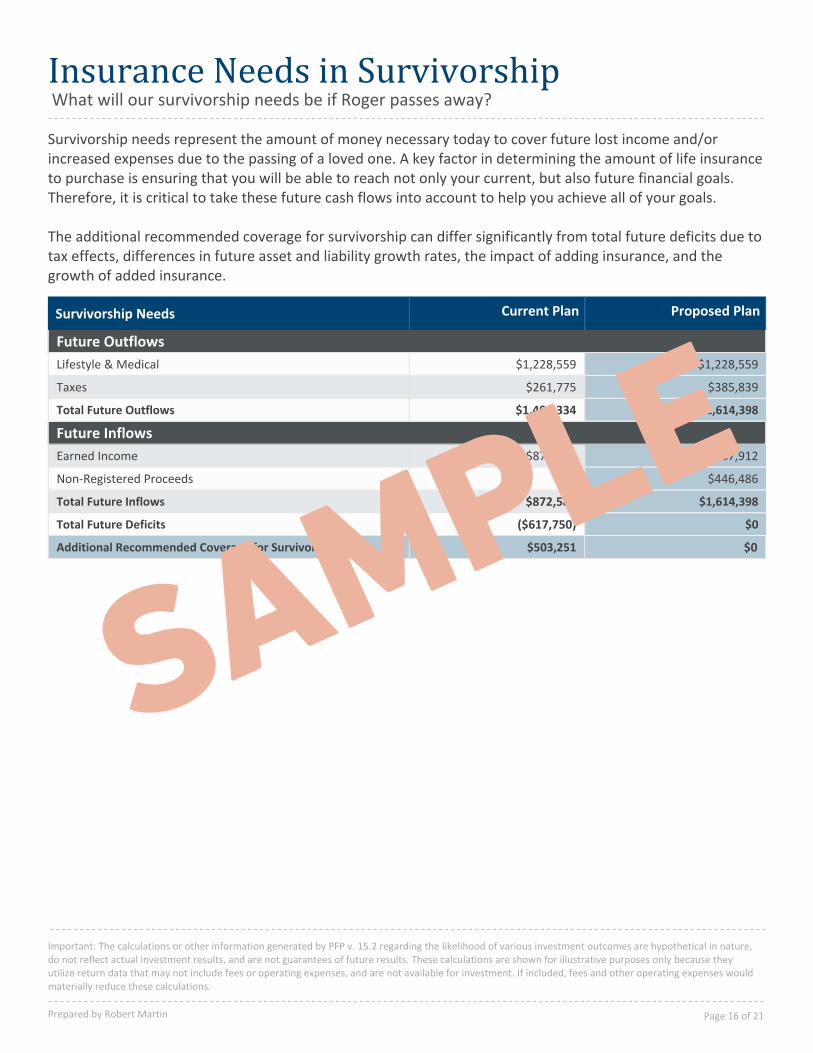
What will our survivorship needs be if Roger passes away?Insurance Needs in Survivorship
Survivorship needs represent the amount of money necessary today to cover future lost income and/orincreased expenses due to the passing of a loved one. A key factor in determining the amount of life insuranceto purchase is ensuring that you will be able to reach not only your current, but also future financial goals.Therefore, it is critical to take these future cash flows into account to help you achieve all of your goals.
The additional recommended coverage for survivorship can differ significantly from total future deficits due totax effects, differences in future asset and liability growth rates, the impact of adding insurance, and thegrowth of added insurance.
$0$503,251Additional Recommended Coverage for Survivorship
$0($617,750)Total Future Deficits
$1,614,398$872,584Total Future Inflows
$446,486$0Non-Registered Proceeds
$1,167,912$872,584Earned Income
Future Inflows
$1,614,398$1,490,334Total Future Outflows
$385,839$261,775Taxes
$1,228,559$1,228,559Lifestyle & Medical
Future Outflows
Proposed PlanCurrent PlanSurvivorship Needs
Important: The calculations or other information generated by PFP v. 15.2 regarding the likelihood of various investment outcomes are hypothetical in nature,do not reflect actual investment results, and are not guarantees of future results. These calculations are shown for illustrative purposes only because theyutilize return data that may not include fees or operating expenses, and are not available for investment. If included, fees and other operating expenses wouldmaterially reduce these calculations.
Prepared by Robert Martin Page 16 of 21
SAMPLE
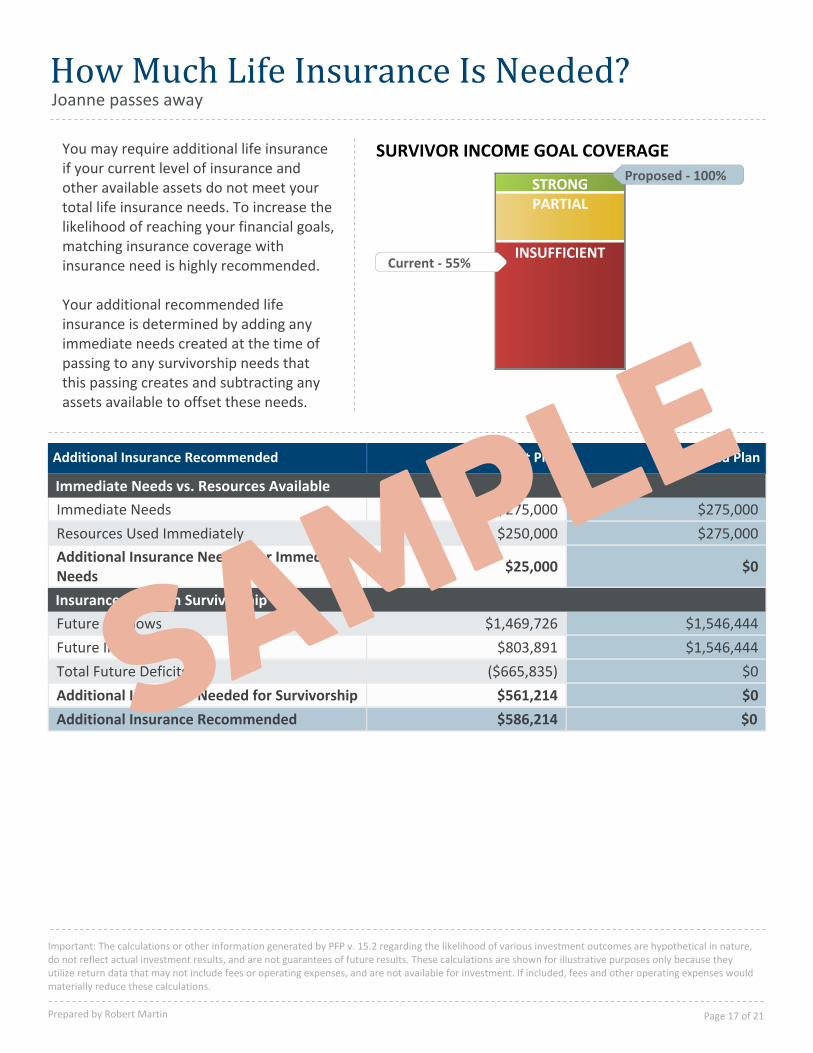
Joanne passes awayHow Much Life Insurance Is Needed?
You may require additional life insuranceif your current level of insurance andother available assets do not meet yourtotal life insurance needs. To increase thelikelihood of reaching your financial goals,matching insurance coverage withinsurance need is highly recommended.
Your additional recommended lifeinsurance is determined by adding anyimmediate needs created at the time ofpassing to any survivorship needs thatthis passing creates and subtracting anyassets available to offset these needs.
SURVIVOR INCOME GOAL COVERAGE
STRONGPARTIAL
INSUFFICIENTCurrent - 55%
Proposed - 100%
$0$586,214Additional Insurance Recommended
$0$561,214Additional Insurance Needed for Survivorship
$0($665,835)Total Future Deficits
$1,546,444$803,891Future Inflows
$1,546,444$1,469,726Future Outflows
Insurance Needs in Survivorship
$0$25,000Additional Insurance Needed for ImmediateNeeds
$275,000$250,000Resources Used Immediately
$275,000$275,000Immediate Needs
Immediate Needs vs. Resources Available
Proposed PlanCurrent PlanAdditional Insurance Recommended
Important: The calculations or other information generated by PFP v. 15.2 regarding the likelihood of various investment outcomes are hypothetical in nature,do not reflect actual investment results, and are not guarantees of future results. These calculations are shown for illustrative purposes only because theyutilize return data that may not include fees or operating expenses, and are not available for investment. If included, fees and other operating expenses wouldmaterially reduce these calculations.
Prepared by Robert Martin Page 17 of 21
SAMPLE
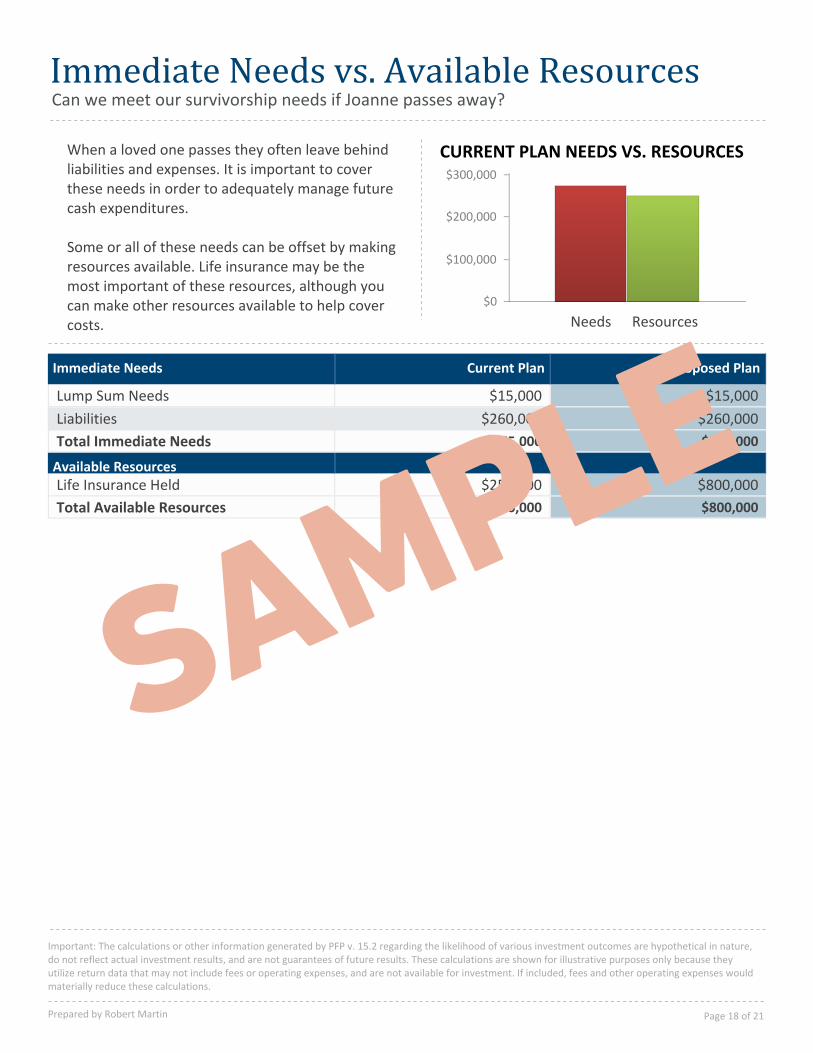
Can we meet our survivorship needs if Joanne passes away?Immediate Needs vs. Available Resources
When a loved one passes they often leave behindliabilities and expenses. It is important to coverthese needs in order to adequately manage futurecash expenditures.
Some or all of these needs can be offset by makingresources available. Life insurance may be themost important of these resources, although youcan make other resources available to help covercosts.
CURRENT PLAN NEEDS VS. RESOURCES
$0
$100,000
$200,000
$300,000
Needs Resources
$800,000$250,000Total Available Resources
$800,000$250,000Life Insurance HeldAvailable Resources
$275,000$275,000Total Immediate Needs
$260,000$260,000Liabilities
$15,000$15,000Lump Sum Needs
Proposed PlanCurrent PlanImmediate Needs
Important: The calculations or other information generated by PFP v. 15.2 regarding the likelihood of various investment outcomes are hypothetical in nature,do not reflect actual investment results, and are not guarantees of future results. These calculations are shown for illustrative purposes only because theyutilize return data that may not include fees or operating expenses, and are not available for investment. If included, fees and other operating expenses wouldmaterially reduce these calculations.
Prepared by Robert Martin Page 18 of 21
SAMPLE
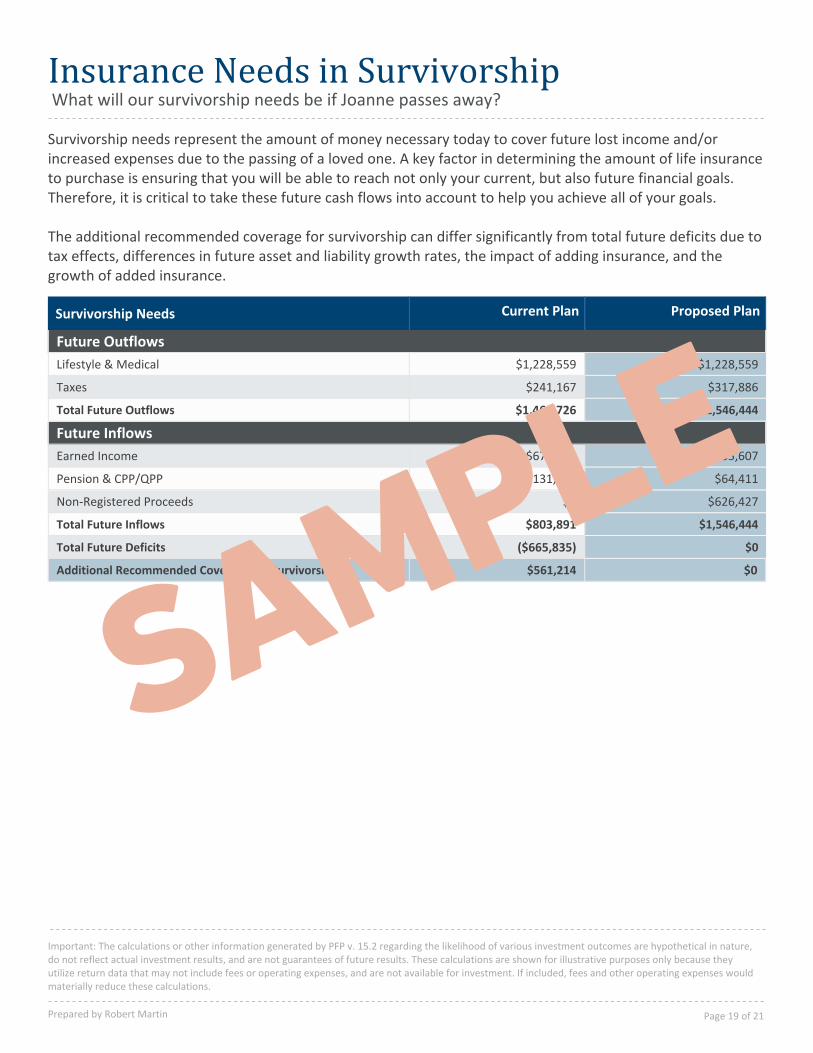
What will our survivorship needs be if Joanne passes away?Insurance Needs in Survivorship
Survivorship needs represent the amount of money necessary today to cover future lost income and/orincreased expenses due to the passing of a loved one. A key factor in determining the amount of life insuranceto purchase is ensuring that you will be able to reach not only your current, but also future financial goals.Therefore, it is critical to take these future cash flows into account to help you achieve all of your goals.
The additional recommended coverage for survivorship can differ significantly from total future deficits due totax effects, differences in future asset and liability growth rates, the impact of adding insurance, and thegrowth of added insurance.
$0$561,214Additional Recommended Coverage for Survivorship
$0($665,835)Total Future Deficits
$1,546,444$803,891Total Future Inflows
$626,427$0Non-Registered Proceeds
$64,411$131,012Pension & CPP/QPP
$855,607$672,879Earned Income
Future Inflows
$1,546,444$1,469,726Total Future Outflows
$317,886$241,167Taxes
$1,228,559$1,228,559Lifestyle & Medical
Future Outflows
Proposed PlanCurrent PlanSurvivorship Needs
Important: The calculations or other information generated by PFP v. 15.2 regarding the likelihood of various investment outcomes are hypothetical in nature,do not reflect actual investment results, and are not guarantees of future results. These calculations are shown for illustrative purposes only because theyutilize return data that may not include fees or operating expenses, and are not available for investment. If included, fees and other operating expenses wouldmaterially reduce these calculations.
Prepared by Robert Martin Page 19 of 21
SAMPLE
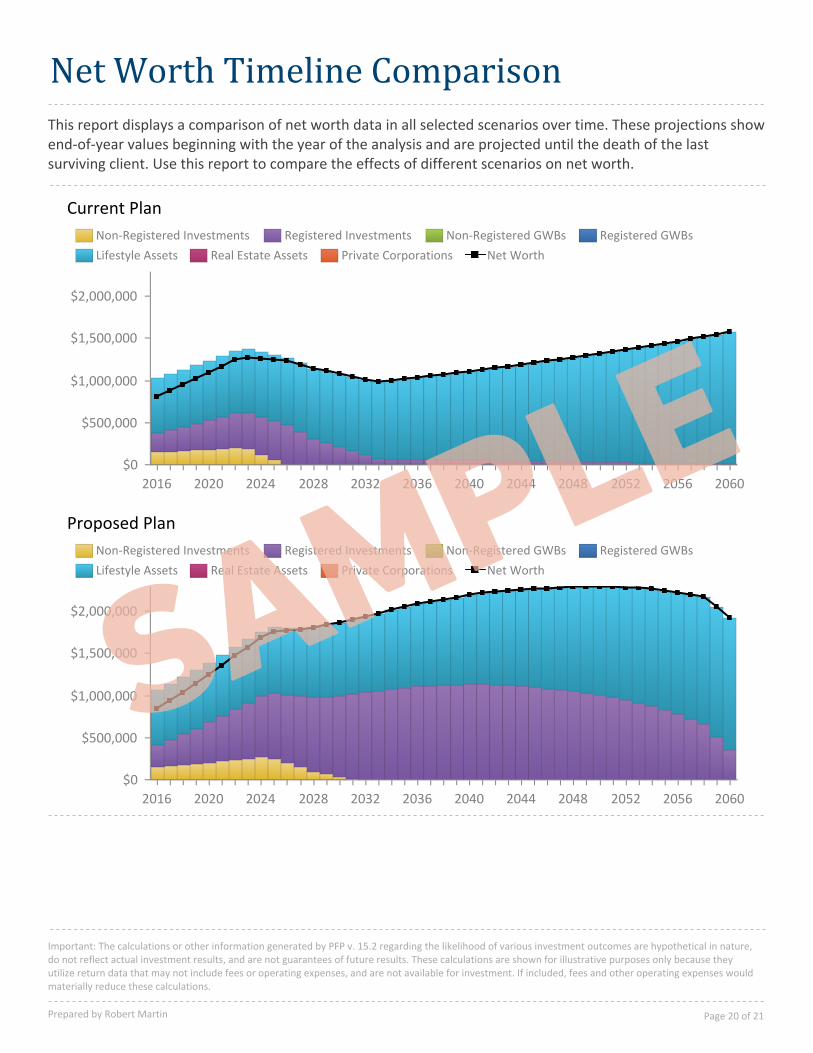
Net Worth Timeline Comparison
Proposed Plan
Current Plan
2016 2020 2024 2028 2032 2036 2040 2044 2048 2052 2056 2060
$0
$500,000
$1,000,000
$1,500,000
$2,000,000
Non-Registered Investments Registered Investments Non-Registered GWBs Registered GWBs
Lifestyle Assets Real Estate Assets Private Corporations Net Worth
2016 2020 2024 2028 2032 2036 2040 2044 2048 2052 2056 2060
$0
$500,000
$1,000,000
$1,500,000
$2,000,000
Non-Registered Investments Registered Investments Non-Registered GWBs Registered GWBs
Lifestyle Assets Real Estate Assets Private Corporations Net Worth
This report displays a comparison of net worth data in all selected scenarios over time. These projections showend-of-year values beginning with the year of the analysis and are projected until the death of the lastsurviving client. Use this report to compare the effects of different scenarios on net worth.
Important: The calculations or other information generated by PFP v. 15.2 regarding the likelihood of various investment outcomes are hypothetical in nature,do not reflect actual investment results, and are not guarantees of future results. These calculations are shown for illustrative purposes only because theyutilize return data that may not include fees or operating expenses, and are not available for investment. If included, fees and other operating expenses wouldmaterially reduce these calculations.
Prepared by Robert Martin Page 20 of 21
SAMPLE
Assumptions and Limitations
This report is hypothetical in nature and is intended to help you in making decisions on your financial future. It is based on information that you have provided. Accordingly, the usefulness of this report depends on the accuracy and completeness of this information. Please review to ensure the information and assumptions are accurate and reasonable.
Financial projections should be reviewed on a regular basis, at least annually or when any major life event occurs, such as a change of relationship status or change in family members.
The rate of return shown is used only to illustrate the effects of the compound growth rate and is not intended to reflect future values or returns on investment. Actual investment outcomes are the result of numerous variables and external factors which cannot be predicted; therefore, projections may not reflect actual investment return results, and are not guarantees of future results. Historical data is used to produce future assumptions used in the analysis, such as rates of return. Past performance is not a guarantee or predictor of future performance. Small changes in assumptions, such as inflation or return rates, can have a significant impact on the outcome of this plan.
The projections in this report are based on return assumptions which may not include commissions, fees or expenses. If included, fees and other operating expenses would materially reduce these calculations.
Federal and provincial income tax laws are complex and subject to continuous change. Financial planning projections have limited capability to model any individual’s tax liability, particularly future tax liability, as future tax laws may be significantly different from current tax laws. This report should not be construed as providing legal, accounting or tax advice. It is your responsibility to consult with appropriate professionals in those areas either independently or in conjunction with this process.
Confidentiality
Investors Group is committed to keeping your personal information confidential. The information collected when creating this report may be used by Investors Group and shared with its affiliates to inform you of investment opportunities, provide additional financial information to you from time to time, or other internal purposes.
Other Important Information
Investment products and services are offered through Investors Group Financial Services Inc. (in Québec, a Financial Services firm) and Investors Group Securities Inc. (in Québec, a firm in Financial Planning). Investors Group Securities Inc. is a member of the Canadian Investor Protection Fund.
Insurance products and services distributed through I.G. Insurance Services Inc. (in Québec, a Financial Services Firm). Insurance license sponsored by The Great-West Life Assurance Company (outside of Québec).
Commissions, fees and expenses may be associated with mutual fund investments. Read the prospectus before investing. Mutual funds are not guaranteed, values change frequently and past performance may not be repeated.
Trademarks, including Investors Group, are owned by IGM Financial Inc. and licensed to its subsidiary corporations.
Important: The calculations or other information generated by PFP v. 15.2 regarding the likelihood of various investment outcomes are hypothetical in nature,do not reflect actual investment results, and are not guarantees of future results. These calculations are shown for illustrative purposes only because theyutilize return data that may not include fees or operating expenses, and are not available for investment. If included, fees and other operating expenses wouldmaterially reduce these calculations.
Prepared by Robert Martin Page 21 of 21
SAMPLE