petrogenesis of the back-arc east scotia ridge, south ... · journal of petrology volume 43 number...
TRANSCRIPT

JOURNAL OF PETROLOGY VOLUME 43 NUMBER 8 PAGES 1435–1467 2002
Petrogenesis of the Back-arc East ScotiaRidge, South Atlantic Ocean
S. FRETZDORFF1∗, R. A. LIVERMORE2, C. W. DEVEY3, P. T. LEAT2
AND P. STOFFERS1
1INSTITUTE OF GEOSCIENCES, UNIVERSITY OF KIEL, OLSHAUSENSTRASSE 40, 24118 KIEL, GERMANY2BRITISH ANTARCTIC SURVEY, HIGH CROSS, MADINGLEY ROAD, CAMBRIDGE CB3 0ET, UK3FACHBEREICH 5—GEOWISSENSCHAFTEN, UNIVERSITY OF BREMEN, POSTFACH 330 440, 28334 BREMEN, GERMANY
RECEIVED JANUARY 3, 2001; REVISED TYPESCRIPT ACCEPTED JANUARY 22, 2002
The East Scotia Ridge is an active back-arc spreading centre located petrogenesis, e.g. basalts erupted in the Mariana Troughand the Lau Basin (e.g. Hawkins, 1976; Hawkins &to the west of the South Sandwich island arc in the South AtlanticMelchior, 1985; Volpe et al., 1987; Stern et al., 1990;Ocean, consisting of nine main segments, E1 (north) to E9 (south).Gribble et al., 1998; Turner & Hawkesworth, 1998; PeateMajor and trace element and Sr–Nd–Pb isotope compositions areet al., 2001). These characteristics provide evidence forpresented, together with water contents, for lavas sampled along theprior depletion of the mantle source and enrichment inactive ridge axis. Magmatism along the East Scotia Ridge isH2O and elements such as Ba, Th, U and Pb, thought tochemically heterogeneous, but there is a common mid-ocean ridgebe transported into the mantle wedge from the subductingbasalt (MORB)-type source component for all the magmas. Anslab via sediment melts or aqueous fluids (Stern et al.,almost unmodified MORB-source mantle appears to underlie the1990; Saunders et al., 1991; Woodhead et al., 1993;central part of the back-arc. Subduction components are found atStolper & Newman, 1994; Pearce et al., 1995; Gribble etthe northern and southern ends of the ridge, and there is a markedal., 1998). Back-arc basins can therefore be used to modelsediment melt input of up to 2% in segment E4. Enriched (plume)the transport of slab components into the mantle wedgemantle is present beneath segment E2 at the northern end of theover much wider areas in subduction zone environmentsridge, suggesting that plume mantle is flowing westward around thethan can be achieved by studying volcanic arcs alone, andedges of the subducting slab. The southern part of segment E8 iscan be used to test models of mantle wedge convection.unique in that its magma source is similar to sub-arc depletedFurthermore, the transitional character of back-arc bas-mantle.alts from MORB to arc-like provides critical evidence ofthe relative roles of decompression vs volatile fluxedmelting of mantle (Gribble et al., 1998).
KEY WORDS: geochemistry; petrogenesis; volcanism; back-arc; subduction The East Scotia Ridge, an active back-arc spreadingcentre behind the South Sandwich island arc in the SouthAtlantic Ocean (Fig. 1), is an interesting place to studysubduction-related processes for several reasons: (1) its
INTRODUCTION simple tectonic setting as part of an intra-oceanic arc,Fractional melting of mantle peridotite is the primary without the influence of continental crust; (2) its closesource of back-arc magmas and it has been postulated proximity to the active island arc, suggesting the pos-that the major source component should be similar to sibility of a strong subduction influence on the back-arcthat of mid-ocean ridge basalt (MORB, e.g. Hawkins, mantle source (Livermore et al., 1997); (3) the well-defined1976; Saunders & Tarney, 1979). However, most back- chemical signature of the associated island arc (Pearce etarc basin basalts have geochemical characteristics that al., 1995) and of the sediments subducting at the South
Sandwich trench (Barreiro, 1983; Ben Othman et al.,show that subduction processes are also involved in their
∗Corresponding author. Telephone:++49 431 880 2085. Fax:++49431 880 4376. E-mail: [email protected] Oxford University Press 2002

JOURNAL OF PETROLOGY VOLUME 43 NUMBER 8 AUGUST 2002
1989; Plank & Langmuir, 1998). Recent campaigns by there is no significant sediment accretion at the trench(Vanneste & Larter, 2002).the British Antarctic Survey (Livermore et al., 1999) and
the University of Kiel now provide sampling of the neo- The South Sandwich arc consists of 11 main islandsforming a distinctly curved island arc, 500 km in length.volcanic zone within each segment of the East Scotia
Ridge. In this paper, we present major and trace element Most of the islands have abundant evidence of recentvolcanic activity, and all are entirely volcanic in origin.compositions together with Sr–Nd–Pb isotope data for
basalt samples dredged from the ridge axis, to identify The volcanoes belong to the tholeiitic and (relativelyrare) calc-alkaline series, and the arc is regarded as apetrogenetic processes controlling geochemical variations
and to identify the components contributing to the classic example of the primitive stages of island arcdevelopment (Baker, 1968, 1990; Pearce et al., 1995). Allmagma source of the East Scotia Ridge lavas.the arc magmas are depleted in high field strengthelements (HFSE) such as Ti, Zr, Hf, Nb and Ta, andheavy rare earth elements (HREE), relative to normalMORB, and are therefore thought to be derived from
TECTONIC SETTING mantle wedge material that had experienced melt ex-The East Scotia Ridge is situated some 250–300 km to traction before the magma generation events (Hawkes-the west of the South Sandwich trench (Fig. 1). It was worth et al., 1977; Pearce et al., 1995). All the magmasmapped for the first time in 1995 using the HAWAII- are enriched (relative to MORB) in highly incompatibleMR1 swath sonar (Livermore et al., 1995) and shown to fluid-mobile trace elements, such as Pb, U, Ba and Rb,consist of nine segments, separated by non-transform derived from the subducting plate. Pearce et al. (1995)offsets. Spreading rates of 60–70 km/Myr place it in suggested that variations in incompatible trace elementthe intermediate range of spreading centres, transitional abundances were a result of dynamic melting processesbetween ‘fast’ (axial high) and ‘slow’ (median valley) within the sub-arc mantle and that the Nd and Sr isotopemorphologies. Six segments, E3–E8, are characterized covariations of the island arc sample suite indicate theby faulted median valleys similar to those observed at involvement of a subduction component derived fromthe Mid-Atlantic Ridge, whereas segments E2 and E9 the subducted sediment and altered oceanic crust. Weboth display axial volcanic ridges (Fig. 2), and are prop- argue below that the sediment-derived component hasagating into the back-arc region (Livermore et al., 1997; locally influenced the back-arc magmatism.Bruguier & Livermore, 2001). Segment E1 extends north-ward into the South Sandwich trench in the form of atrough with water depths of up to 5500 m. Side-scan
Previous geochemical studiesimages of this segment show it to be surrounded by aPrevious investigations of lavas from the East Scotiamuch more chaotic backscatter pattern compared withRidge were confined to eight dredge sites (D20–D24,the rest of the East Scotia Ridge, indicating recentD56, D57, D60) sampled by R.R.S. Shackleton in 1974establishment of E1 and/or a more disordered mode ofand 1981, as well as volcanic rocks from the axis andextension (Livermore et al., 1997). There is a distinctthe lateral flanks of segment E2 and the northern partalong-axis trend in axial depth, from maxima of >4000 mof E3, sampled by R.R.S. James Clark Ross in 1996 (Fig.in segments E5 and E6, to minima of >2600 m in E22). Dredge sites were located on the northern tip ofand E9. These characteristics have provided support forsegment E3 (D20), east of the southern tip of E2 (D21),models involving the shallow inflow of Atlantic mantlewest of segment E5 (D22), close to the northern tip ofaround the ends of the subducting slab (Livermore et al.,segment E9 (D24), in the centre of segment E9 (D23),1997).and east of the northernmost segment E1 (D56). ApartThe South American plate is subducting beneath thefrom the recently sampled segment E2 and the northernSandwich plate at a rate of 70–85 km/Myr (Pelayo &part of E3, only the dredge stations D20 and D23 areWiens, 1989). Earthquake data indicate that the sub-located in the neo-volcanic axis of the East Scotia Ridge.ducting plate dips at 45–55° to the west, probably steep-The petrographic characteristics, major and trace ele-ening slightly in the southern part of the subduction zonement geochemistry, volatile content, and Sr, Nd, Pb, O(Brett, 1977). The age of the subducting plate is 28–35 Ma
below the southern part of the arc, and 50–60 Ma below and C isotope compositions of lavas dredged at the fourlocations D20 and D22–24 have been reported in earlierthe northern part of the arc (Sclater et al., 1976; Barker &
Lawver, 1988). The sedimentary cover on the subducting studies (Hawkesworth et al., 1977; Tarney et al., 1977;Saunders & Tarney, 1979; Muenow et al., 1980; Cohenplate consists of some 200 m of siliceous sediments in
the south, and some 400 m of calcareous and siliceous & O’Nions, 1982a; Saunders et al., 1982; Mattey et al.,1984; Newman & Stolper, 1996; Eiler et al., 2000).sediments in the north (Barker, 1995). More than 95%
of this sediment input to the trench is subducted, and These studies showed that the lavas have an intermediate
1436

FRETZDORFF et al. PETROGENESIS OF EAST SCOTIA RIDGE
Fig. 1. (a) Tectonic setting of the East Scotia Ridge within the Scotia Sea area. (b) Sketch map of the South Sandwich subduction zone withthe location of the East Scotia Ridge segments (E1–E9) and South Sandwich Islands (after Leat et al., 2000). The arrows mark the spreadingdirection along the East Scotia Ridge and the relative movement of the subducting plate.
geochemical composition between MORB and island- Most of the back-arc lavas have lower 206Pb/204Pbratios than those of the South American–Antarctic Ridgearc tholeiite, leading to the suggestion that fluids and/
or sediments derived from the subducting slab influence (Pearce et al., 2001). The characteristic geochemical sig-nature of the South American–Antarctic Ridge basaltsthe mantle source of the East Scotia Ridge basalts (e.g.
Saunders & Tarney, 1979; Tarney et al., 1981; Saunders is interpreted to be the result of a westward asthenosphericflow of enriched mantle from the Bouvet plume alonget al., 1982). More recently, Pearce et al. (2001) reanalysed
a suite of samples from dredge sites on segments E3 and the ridge axis (e.g. Le Roex et al., 1985). Pearce et al.(2001) suggested that this Bouvet plume component isE9. They showed that the back-arc lavas have Pb and
Nd isotope characteristics of South Atlantic, rather than also present in the East Scotia Ridge mantle source as aresult of asthenospheric inflow into the back-arc regionPacific mantle. This implies that any outflow of Pacific
MORB through the Drake Passage as suggested by from the north and south. Leat et al. (2000) carried outa detailed geochemical study of the E2 segment. TheirAlvarez (1982) does not extend as far as the East Scotia
Ridge. results support the interpretation of Pearce et al (2001)
1437

JOURNAL OF PETROLOGY VOLUME 43 NUMBER 8 AUGUST 2002
Fig. 2. HAWAII-MR1 bathymetry of the East Scotia Ridge, showing sample locations occupied during British Antarctic Survey (BAS) cruisesJR09 (dredged samples: red triangles), JR12 (wax core samples: red circles; dredged samples: red triangles), JR39b (wax core samples: yellowcircles) and the German Polarstern cruise PS47 (dredged samples: red squares).
1438

FRETZDORFF et al. PETROGENESIS OF EAST SCOTIA RIDGE
that material from the Bouvet mantle plume is migrating with an accelerating voltage of 15kV was used. The beamwas defocused to 5 �m to minimize Na loss duringwestwards into the back-arc, and showed that lavas from
the flanks of segment E2 have a higher plume influence measurements. Glass analyses reported are the averagesof more than five individual spot analyses (Table 1)than axial lavas. Furthermore, they demonstrated the
contribution of a slab-derived component to most E2 with relative standard deviations smaller than ±0·5%.International glass standards ( JDF-D2, CFA47 2) werelavas.measured after every 20 analyses to check precision,which is better than ±0·7%.
H2O analyses were obtained by Fourier transformSamplinginfrared (FTIR) spectroscopy at the University of KielSampling stations on the active part of the back-arcusing the methods and calibration described by Stolperspreading ridge were selected on the basis of detailed(1982). Double-polished glass thin sections, 100–250 �mside-scan sonar and bathymetric data (Livermore et al.,thick, were analysed with a Bruker IFS 66v/S FTIR1995; Fig. 2). In 1997–1998, sampling of segments E3–E7spectrometer equipped with a Bruker A 590 Infraredwas carried out using a drum-shaped dredge during R.V.Microscope with a mercury–cadmium–telluride detector.
Polarstern cruise PS47 (ANT XV/II), with general dredgeOptically clear areas of known thickness (±5 �m) weredirection along the spreading axis. Fresh volcanic ma-measured with aperture size of 120 �m diameter withterial, e.g. pillow lavas, sheet flows and lava tubes, most256 scans per spot. Concentrations were calculated usingof which preserved fresh glassy margins, were recoveredthe Beer–Lambert law (e.g. Stolper, 1982) with assumedduring the 10 dredge deployments during cruise PS47densities of 2·7 g/cm3. Replicate analyses of different(Fig. 2). During R.R.S. James Clark Ross cruise JR39b inglass fragments from the same specimen were typically1999, fresh volcanic glass fragments were obtained at 28reproducible to ±10%. Comparison of the H2O con-sites from segments E2 to E9 using a wax corer (Livermorecentrations of two basalt glasses (EN112 4D-10; P1505-et al., 1999). These fresh volcanic samples, when combined1) analysed by FTIR spectroscopy at the University ofwith previous high-density sampling of segment E2 (LeatTulsa (USA) (Michael, 1995) with the FTIR analyses atet al., 2000) during cruise JR12, provide complete cov-University of Kiel show reproducibility better than±5%.erage of the East Scotia Ridge neo-volcanic zone (Fig.
Trace element concentrations were determined by2, coordinates listed in Table 1).inductively coupled plasma mass spectrometry (ICP-MS)with a VG PlasmaQuad PQ1 system at the Universityof Kiel, using preparation and measurement methods
ANALYTICAL METHODS described by Garbe-Schonberg (1993). Analytical ac-curacy and reproducibility are estimated from meas-Macroscopic criteria (vesicularity; size, abundance andurements of international rock standards BHVO-1 andvariety of minerals) were used to select different rockBIR, and duplicate analyses of samples (Table 1). Thetypes from each dredge haul, from which glassy pillowaccuracy of the standards is within±10% of the suggestedrims were separated under a binocular microscope andworking values ( Jenner et al., 1990; Govindaraju, 1994),washed several times in ultra-pure water. Glass fragmentsbut generally better than ±5% for rare earth elementsin wax cups from the wax corer were removed from the(REE). Duplicate analyses show reproducibility to bewax with tweezers. The fragments were then placed intobetter than 3%, except for the transition metals (e.g. Cr,a beaker with water in a microwave oven for 2 min toNi, Cu, Zn, Ga) and elements with very low con-melt the wax. The beaker was cooled and the waxcentrations (e.g. Cs), which show deviations of up to 20%removed. The sample was then washed several times in(Table 1).ultra-pure water.
Sr, Nd and Pb isotope ratios of volcanic glasses wereAnalyses of minerals were made at the University ofmeasured on a MAT262-RPQ2+ thermal ionizationKiel (Institut fur Geowissenschaften) with a Camecamass spectrometer at GEOMAR in static mode. GlassCAMEBAX electron microprobe running at a beamchips were leached for 1 h in 6N HCl before samplecurrent of 12·5 nA and acceleration voltage of 14–15 kV.dissolution, and analytical procedures followed those de-Usually, the beam width was about 1–2 �m, and wasscribed by Hoernle & Tilton (1991). 87Sr/86Sr ratios weredefocused for plagioclase analyses. Synthetic and naturalnormalized to 86Sr/88Sr= 0·1194 within-run and 143Nd/standards were used to calibrate the microprobe. Repeat144Nd ratios to 146Nd/144Nd = 0·7219. The long-termmeasurements show that the relative standard deviationsreproducibility of NBS 987 in this laboratory is 87Sr/are smaller than ±0·5%, indicating a good re-86Sr = 0·710254 ± 17 (n = 83) and of La Jolla 143Nd/producibility for all major elements. The major element144Nd= 0·511845± 11 (n= 123). The in-house SPEXconcentrations of the volcanic glass samples were de-monitor, calibrated against La Jolla with 143Nd/144Nd=termined with a Cameca SX50 electron microprobe at
GEOMAR (Kiel) (Table 1). A beam current of 10 nA 0·511706± 12 (n= 9), yielded 143Nd/144Nd= 0·511705
1439

JOURNAL OF PETROLOGY VOLUME 43 NUMBER 8 AUGUST 2002
Table 1: Location, water depth and geochemical analyses of the East Scotia Ridge volcanic glasses
Segment: E2 E2 E2 E3 E3 E3 E3 E3 E3 E3 E3
Sample: wx44 wx42 wx43 96DS-1 96DS-2 96DS-3 96DS-4 wx45 97DS-1 97DS-2 97DS-4
Lat. (S): 56°02·01′ 56°06·03′ 56°09·40′ 56°32·3′ 56°32·3′ 56°32·3′ 56°32·3′ 56°40·00′ 56°46·6′ 56°46·6′ 56°46·6′Long. (W): 30°19·51′ 30°19·51′ 30°18·51′ 30°43·7′ 30°43·7′ 30°43·7′ 30°43·7′ 30°43·00′ 30°44·0′ 30°44·0′ 30°44·0′Depth (m): 2840 2758 2885 3880 3880 3880 3880 3730 3949 3949 3949
Major elements by electron microprobe (wt %); H2O by FTIR (wt %)nME/nH2O 10 12/4 12/3 19/3 19 21/5 15 18/8 10 9/2 10SiO2 52·70 53·40 53·08 50·26 50·22 50·64 50·27 49·65 51·55 51·58 51·87TiO2 1·69 1·61 1·99 1·23 1·24 1·54 1·24 1·32 1·71 1·69 1·71Al2O3 15·14 15·15 15·12 16·34 16·34 15·64 16·36 15·33 15·95 15·94 15·88FeO 8·94 8·93 9·95 7·82 7·78 8·62 7·84 8·31 8·23 8·13 8·05MnO 0·20 0·20 0·20 0·16 0·15 0·16 0·16 0·17 0·16 0·16 0·18MgO 4·77 4·98 4·21 8·16 8·15 7·39 8·17 8·25 6·94 6·95 6·97CaO 9·04 9·07 7·97 11·21 11·21 10·87 11·18 11·80 10·38 10·40 10·36Na2O 3·75 3·66 4·02 2·97 2·95 3·11 2·95 3·09 3·39 3·38 3·39K2O 0·49 0·52 0·47 0·13 0·12 0·16 0·12 0·11 0·21 0·21 0·23P2O5 0·36 0·37 0·42 0·26 0·27 0·29 0·27 0·26 0·35 0·33 0·37H2O n.d. 0·77 1·02 0·24 n.d. 0·43 n.d. 0·12 n.d. 0·45 n.d.Total 97·08 98·67 98·45 98·79 98·85 98·42 98·57 98·41 98·88 99·24 99·01mg-no. 52·83 53·92 47·04 68·64 68·72 64·25 68·62 67·58 63·89 64·20 64·50
Trace elements by ICP-MS (ppm)Sc 31·5 29·8 30·9 30·5 33·2 35·7 33·5Cr 70·4 54·3 10·8 302 247 324 213Co 28·3 26·3 28·1 36·3 35·8 36·3 35·0Ni 37·0 32·1 8·99 130 96·9 124 95·5Cu 46·9 49·6 36·3 52·7 48·5 59·4 45·1Zn 80·2 81·6 91·0 71·3 80·5 56·7 89·5Ga 17·4 17·4 18·7 14·5 16·0 14·7 16·7Rb 6·83 7·97 7·45 2·34 3·63 1·02 5·50Sr 234 244 211 129 130 104 148Y 27·5 27·4 33·2 22·0 29·5 24·4 33·2Zr 118 114 144 70·6 89·0 70·8 115Nb 8·53 7·79 9·72 2·45 3·44 1·58 3·93Cs 0·105 0·131 0·127 0·016 0·033 0·014 0·048Ba 107 114 117 20·2 30·9 12·3 38·3La 9·08 9·02 10·3 3·12 4·04 2·35 5·15Ce 20·7 20·7 24·3 9·26 11·9 7·40 15·4Pr 3·04 2·99 3·55 1·59 2·04 1·40 2·57Nd 13·9 13·8 16·3 8·17 10·5 7·89 13·0Sm 3·92 3·89 4·63 2·82 3·56 2·86 4·35Eu 1·36 1·34 1·59 1·05 1·25 1·07 1·48Gd 4·59 4·54 5·58 3·71 4·72 3·89 5·51Tb 0·798 0·796 0·958 0·665 0·850 0·693 0·966Dy 5·11 5·12 6·13 4·53 5·71 4·62 6·48Ho 1·09 1·08 1·30 0·925 1·18 0·986 1·34Er 3·05 3·06 3·69 2·59 3·31 2·93 3·81Tm 0·449 0·447 0·539 0·387 0·495 0·403 0·560Yb 2·97 3·00 3·55 2·59 3·30 2·63 3·71Lu 0·439 0·444 0·531 0·371 0·469 0·385 0·536Hf 3·01 2·99 3·66 2·27 2·90 2·17 3·61Ta 0·484 0·435 0·553 0·152 0·207 0·105 0·237Tl 0·032 0·037 0·034 n.d. 0·003 0·007 0·008Pb 1·17 1·49 1·29 0·448 0·492 0·376 0·682Th 0·977 0·989 1·05 0·177 0·259 0·111 0·315U 0·272 0·268 0·305 0·052 0·077 0·038 0·093
1440

FRETZDORFF et al. PETROGENESIS OF EAST SCOTIA RIDGE
Segment: E3 E3 E3 E4 E4 E4 E4 E4 E5 E5 E5
Sample: 97DS-5 wx46 98DS-1 wx47 99DS-1 99DS-3 99DS-4 100DS-1 102DS-1b wx48 104DS-1
Lat. (S): 56°46·6′ 56°51·00′ 56°55·9′ 57°02·01′ 57°03·8′ 57°03·8′ 57°03·8′ 57°11·8′ 57°15·6′ 57°25·19′ 57°29·3′Long. (W): 30°44·0′ 30°42·91′ 30°41·8′ 30°30·00′ 30°29·2′ 30°29·2′ 30°29·2′ 30°21·5′ 30°10·2′ 30°08·41′ 30°07·1′Depth (m): 3949 3790 3891 3681 3688 3688 3688 4568 4155 3683 3779
Major elements (wt %)nME/nH2O 13/3 16 14/5 18 10/3 15 14 25/6 9 21/6 18/2SiO2 51·72 50·92 52·15 50·88 54·19 53·30 53·20 51·55 52·55 49·83 51·72TiO2 1·70 1·69 1·40 1·48 1·27 1·16 1·16 1·46 1·49 1·33 1·69Al2O3 15·93 15·46 16·04 16·26 16·80 17·24 17·32 15·63 15·62 15·30 15·44FeO 8·07 8·73 7·57 7·88 6·47 6·46 6·42 7·94 8·26 8·26 8·30MnO 0·17 0·19 0·17 0·18 0·15 0·14 0·14 0·16 0·17 0·18 0·18MgO 7·02 6·63 6·83 6·35 5·85 5·94 5·97 7·42 6·10 8·13 7·02CaO 10·35 10·48 10·82 10·82 9·40 9·39 9·39 10·68 9·81 11·60 10·46Na2O 3·37 3·20 2·81 3·02 2·66 2·63 2·63 3·06 3·24 3·29 3·37K2O 0·21 0·39 0·42 0·59 0·93 0·96 0·97 0·19 0·21 0·10 0·17P2O5 0·34 0·34 0·30 0·34 0·32 0·32 0·32 0·26 0·26 0·26 0·30H2O 0·48 n.d. 1·63 n.d. 2·25 n.d. n.d. 0·69 n.d. 0·18 0·63Total 99·36 98·04 100·15 97·80 100·28 97·55 97·52 99·04 99·15 98·46 99·29mg-no. 64·59 61·45 65·44 62·83 65·50 65·87 66·09 66·22 60·77 67·36 63·94
Trace elements (ppm)Sc 38·8 29·3 34·2 26·2 24·8 31·6 29·0 33·6 31·9Cr 179 191 169 114 107 222 163 328 207Co 33·7 31·5 29·6 26·2 26·1 34·8 32·4 38·4 34·2Ni 80·8 78·9 80·2 86·2 78·7 92·5 75·1 99·0 82·5Cu 42·1 43·1 53·9 35·4 32·9 44·2 49·7 64·7 48·8Zn 67·8 80·2 70·0 63·3 61·3 76·9 132 68·9 87·8Ga 16·8 15·5 16·5 16·3 16·4 15·7 16·9 15·8 16·2Rb 7·51 10·2 11·7 25·9 26·3 3·56 4·17 0·697 2·50Sr 179 177 237 298 312 145 139 145 143Y 33·5 24·3 28·2 20·5 19·4 27·2 26·5 26·2 32·1Zr 115 80·9 110 74·6 72·5 92·7 91·0 96·5 113Nb 5·06 3·91 4·43 5·31 5·49 3·10 2·51 2·06 2·91Cs 0·131 0·136 0·222 0·420 0·426 0·039 0·072 0·013 0·026Ba 100 102 143 268 284 30·1 31·1 8·74 19·0La 5·86 4·97 5·98 8·30 8·41 4·34 4·12 2·94 4·90Ce 16·0 13·1 15·5 19·8 20·0 12·3 12·0 9·32 14·3Pr 2·59 2·08 2·42 2·72 2·70 2·05 1·98 1·69 2·45Nd 13·2 10·1 12·0 12·3 12·1 10·6 10·1 8·97 12·4Sm 4·26 3·25 3·70 3·33 3·31 3·56 3·40 3·12 4·07Eu 1·44 1·16 1·29 1·14 1·09 1·27 1·22 1·18 1·41Gd 5·40 4·18 4·55 3·77 3·64 4·59 4·35 4·05 5·22Tb 0·948 0·721 0·804 0·625 0·608 0·828 0·779 0·729 0·929Dy 6·26 4·90 5·18 4·08 3·99 5·58 5·22 4·79 6·23Ho 1·33 1·01 1·11 0·827 0·793 1·14 1·07 1·02 1·30Er 3·98 2·83 3·14 2·33 2·24 3·25 3·07 2·85 3·60Tm 0·548 0·420 0·464 0·353 0·340 0·478 0·454 0·416 0·535Yb 3·60 2·81 3·03 2·39 2·30 3·17 3·00 2·74 3·61Lu 0·532 0·408 0·450 0·351 0·345 0·470 0·445 0·401 0·520Hf 3·32 2·63 2·92 2·42 2·43 2·92 2·79 2·53 3·55Ta 0·325 0·252 0·288 0·351 0·357 0·197 0·164 0·150 0·194Tl 0·033 0·026 0·054 0·079 0·078 0·004 0·007 0·011 0·005Pb 0·865 0·820 1·12 2·06 2·11 0·627 0·886 0·469 n.d.Th 0·540 0·506 0·653 1·38 1·46 0·269 0·290 0·109 0·228U 0·156 0·137 0·186 0·341 0·349 0·083 0·092 0·048 0·083
1441

JOURNAL OF PETROLOGY VOLUME 43 NUMBER 8 AUGUST 2002
Table 1: continued
Segment: E5 E5 E5 E5 E6 E6 E6 E6 E6 E6 E6
Sample: 104DS-3 wx41 wx49 wx50 wx51 wx52 106DS-1 106DS-2 106DS-3 106DS-4 107DS-1
Lat. (S): 57°29·3′ 57°29·3′ 57°36·00′ 57°42·59′ 57°40·21′ 57°45·00′ 57°49·5′ 57°49·5′ 57°49·5′ 57°49·5′ 58°02·5′Long. (W): 30°07·1′ 30°07·99′ 30°06·62′ 30°02·36′ 29°53·96′ 29°52·50′ 29°52·0′ 29°52·0′ 29°52·0′ 29°52·0′ 29°51·0′Depth (m): 3779 3912 3995 4151 3264 4090 3973 3973 3973 3973 3531
Major elements (wt %)nME/nH2O 17/5 18 18/6 17/6 17/4 4 12/3 14/6 14/6 11/4 34/12SiO2 51·96 51·12 50·30 50·35 50·95 51·89 49·79 50·23 50·20 49·69 49·32TiO2 1·77 1·60 1·39 1·52 1·73 1·78 1·66 1·66 1·71 1·68 1·44Al2O3 15·20 16·31 16·27 15·17 15·07 14·77 14·84 15·55 15·54 15·40 16·34FeO 8·44 8·75 8·12 9·10 9·41 10·24 9·18 9·20 9·03 9·27 8·05MnO 0·20 0·20 0·18 0·20 0·20 0·23 0·21 0·18 0·18 0·19 0·15MgO 6·77 6·56 8·16 7·72 7·47 7·12 7·82 7·72 7·73 7·66 7·93CaO 10·41 10·03 11·38 11·27 11·14 11·86 10·94 10·98 10·97 10·90 11·32Na2O 3·36 3·75 3·43 3·16 3·18 3·15 2·91 2·96 2·97 2·96 3·47K2O 0·18 0·20 0·13 0·13 0·13 0·07 0·10 0·10 0·09 0·10 0·14P2O5 0·30 0·34 0·30 0·29 0·32 0·34 0·26 0·30 0·29 0·29 0·27H2O 0·64 n.d. 0·23 0·29 0·36 n.d. 0·20 0·19 0·17 0·16 0·25Total 99·22 98·87 99·89 99·20 99·96 101·45 97·90 99·06 98·86 98·29 98·68mg-no. 62·74 61·14 67·82 64·02 62·49 59·32 64·13 63·76 64·24 63·44 67·38
Trace elements (ppm)Sc 31·2 33·7 30·7 36·9 34·5 29·9 32·1 29·8Cr 205 205 250 292 267 227 231 251Co 34·3 33·4 36·7 38·2 37·8 37·8 38·7 38·5Ni 82·7 89·1 119 116 119 99·8 98·5 91·6Cu 46·2 50·5 58·3 58·4 60·5 47·1 47·1 60·6Zn 78·9 80·6 64·6 78·5 83·4 113 83·5 69·9Ga 16·1 17·2 15·0 16·3 16·5 15·8 16·1 15·4Rb 2·21 2·46 0·859 1·06 2·34 1·28 1·37 1·37Sr 141 155 179 141 119 99·2 104 179Y 30·3 33·8 24·2 29·5 34·1 31·2 32·1 24·4Zr 112 134 107 108 118 92·5 93·6 90·7Nb 2·99 3·20 2·60 2·43 2·28 1·94 1·94 2·45Cs 0·018 0·057 0·011 0·023 0·052 0·002 0·003 0·006Ba 18·0 25·1 11·7 15·4 26·1 10·9 10·3 12·1La 4·67 4·83 3·90 3·61 3·81 3·23 3·22 3·88Ce 14·5 14·2 11·8 11·0 11·7 10·5 10·8 11·6Pr 2·43 2·43 1·97 1·93 2·10 1·94 1·98 1·98Nd 12·3 12·3 10·0 10·0 11·1 10·4 10·7 10·0Sm 4·00 4·02 3·21 3·46 3·90 3·76 3·86 3·38Eu 1·40 1·44 1·17 1·21 1·34 1·30 1·34 1·23Gd 5·20 5·22 4·03 4·52 5·10 5·04 5·14 4·20Tb 0·913 0·934 0·717 0·826 0·939 0·921 0·948 0·746Dy 6·11 6·11 4·65 5·51 6·20 6·28 6·47 4·98Ho 1·26 1·31 0·984 1·19 1·34 1·30 1·33 1·00Er 3·54 3·69 2·79 3·35 3·79 3·66 3·77 2·80Tm 0·538 0·546 0·404 0·491 0·558 0·543 0·559 0·414Yb 3·51 3·59 2·60 3·25 3·64 3·65 3·77 2·75Lu 0·511 0·530 0·380 0·482 0·540 0·529 0·562 0·403Hf 3·48 3·30 2·58 2·78 3·20 3·14 3·21 2·75Ta 0·198 0·216 0·189 0·170 0·153 0·128 0·128 0·157Tl 0·006 0·022 0·011 0·012 0·039 n.d. n.d. n.d.Pb n.d. 0·828 0·553 0·526 1·57 0·463 0·445 0·565Th 0·224 0·265 0·148 0·147 0·261 0·134 0·119 0·152U 0·086 0·104 0·061 0·062 0·070 0·052 0·039 0·056
1442

FRETZDORFF et al. PETROGENESIS OF EAST SCOTIA RIDGE
Segment: E6 E6 E6 E6 E7 E7 E7 E7 E7 E7 E7
Sample: 107DS-3 107DS-4 wx53 108DS-1 wx54b 109DS-1 109DS-2 109DS-3 109DS-4 109DS-5 109DS-6
Lat. (S): 58°02·5′ 58°02·5′ 58°10·21′ 58°19·5′ 58°22·97′ 58°36·6′ 58°36·6′ 58°36·6′ 58°36·6′ 58°36·6′ 58°36·6′Long. (W): 29°51·0′ 29°51·0′ 29°49·52′ 29°51·6′ 29°57·23′ 29°57·7′ 29°57·7′ 29°57·7′ 29°57·7′ 29°57·7′ 29°57·7′Depth (m): 3531 3531 3550 3999 3570 3636 3636 3636 3636 3636 3636
Major elements (wt %)nME/nH2O 22/4 20/3 6 25/4 22/2 22 16/4 17/4 23 23 18SiO2 50·31 49·70 50·12 50·63 51·19 50·38 50·49 51·15 50·67 50·24 49·97TiO2 1·45 1·45 1·11 1·68 2·11 1·47 1·50 1·61 1·49 1·51 1·49Al2O3 15·16 16·31 16·89 15·24 14·46 15·58 15·61 15·21 15·61 15·44 15·55FeO 8·75 8·07 7·23 8·74 10·51 8·75 8·71 9·48 8·68 8·74 8·71MnO 0·19 0·17 0·15 0·18 0·21 0·18 0·16 0·19 0·18 0·19 0·17MgO 8·10 7·86 8·56 7·68 7·25 7·75 7·56 7·65 7·81 7·60 7·72CaO 11·95 11·29 11·20 11·14 10·63 11·24 11·28 11·35 11·25 11·24 11·25Na2O 2·42 3·46 2·78 2·95 3·21 3·49 3·51 2·80 3·48 3·47 3·48K2O 0·15 0·15 0·44 0·17 0·17 0·11 0·12 0·17 0·11 0·14 0·11P2O5 0·27 0·27 0·31 0·28 0·37 0·27 0·27 0·28 0·26 0·27 0·27H2O 0·28 0·25 n.d. 0·24 0·26 n.d. 0·23 0·21 n.d. n.d. n.d.Total 99·02 98·99 98·78 98·94 100·38 99·23 99·43 100·11 99·54 98·84 98·72mg-no. 66·01 67·13 71·31 64·82 59·15 65·02 64·53 62·85 65·37 64·58 65·03
Trace elements (ppm)Sc 29·1 34·5 31·3 37·7 29·1 30·0Cr 278 305 252 198 253 255Co 38·9 36·3 36·7 36·5 36·9 37·8Ni 104 76·1 84·8 90·8 86·0 96·0Cu 52·5 64·7 47·1 47·0 53·7 48·2Zn 86·5 90·3 86·3 97·9 79·4 82·5Ga 15·1 15·3 16·1 17·9 14·9 15·5Rb 2·15 1·19 2·68 2·03 1·26 2·59Sr 84·9 127 118 120 136 100Y 25·7 27·8 30·5 43·0 25·0 28·7Zr 66·9 94·3 98·1 156 90·2 82·4Nb 2·67 2·26 3·23 3·47 1·87 3·11Cs 0·013 0·021 0·017 0·033 0·000 0·012Ba 19·9 15·1 20·8 21·7 11·5 22·4La 2·85 2·98 3·97 5·07 3·26 3·45Ce 8·31 9·22 12·0 15·4 10·8 10·3Pr 1·45 1·69 2·07 2·78 1·95 1·80Nd 7·98 8·97 11·1 14·6 10·2 9·66Sm 2·98 3·15 3·91 5·14 3·41 3·48Eu 1·05 1·15 1·35 1·70 1·25 1·23Gd 4·09 4·18 5·11 6·60 4·39 4·72Tb 0·760 0·762 0·923 1·21 0·772 0·863Dy 5·21 4·99 6·27 8·00 5·18 5·90Ho 1·09 1·07 1·28 1·71 1·06 1·22Er 3·07 3·00 3·64 4·87 2·92 3·46Tm 0·455 0·436 0·535 0·719 0·430 0·511Yb 3·02 2·86 3·55 4·66 2·83 3·39Lu 0·437 0·422 0·524 0·694 0·409 0·494Hf 2·39 2·48 3·25 4·26 2·81 2·88Ta 0·165 0·154 0·202 0·210 0·119 0·193Tl n.d. 0·013 n.d. 0·018 n.d. n.d.Pb 0·388 0·588 0·636 0·742 0·705 0·465Th 0·188 0·138 0·211 0·236 0·116 0·202U 0·062 0·054 0·075 0·092 0·039 0·064
1443

JOURNAL OF PETROLOGY VOLUME 43 NUMBER 8 AUGUST 2002
Table 1: continued
Segment: E7 E7 E7 E7 E7 E7 E7 E7 E7 E8 E8
Sample: 109DS-7 110DS-1 110DS-2 110DS-3 110DS-4 110DS-5 110DS-6 110DS-7 wx55 wx56 wx57
Lat. (S): 58°36·6′ 58°44·2′ 58°44·2′ 58°44·2′ 58°44·2′ 58°44·2′ 58°44·2′ 58°44·2′ 58°49·88′ 58°49·81′ 59°01·82′Long. (W): 29°57·7′ 29°56·0′ 29°56·0′ 29°56·0′ 29°56·0′ 29°56·0′ 29°56·0′ 29°56·0′ 29°52·15′ 29°37·17′ 29°31·20′Depth (m): 3636 3916 3916 3916 3916 3916 3916 3916 3260 3587 3364
Major elements (wt %)nME/nH2O 25 21 15/3 20 15 19/3 11/3 13 6 16 28/2SiO2 50·78 50·83 50·70 50·66 51·17 50·89 51·49 51·24 51·36 53·09 51·26TiO2 1·60 1·96 1·94 1·97 1·95 1·95 1·94 1·97 1·46 1·72 1·59Al2O3 15·13 14·67 14·97 14·52 15·03 14·97 15·07 15·00 14·75 15·21 15·00FeO 9·45 10·03 9·39 9·93 9·35 9·36 9·25 9·36 8·95 9·98 9·56MnO 0·20 0·20 0·19 0·19 0·19 0·18 0·18 0·19 0·20 0·19 0·20MgO 7·57 6·86 6·98 6·81 6·96 6·94 7·02 6·95 7·58 5·04 7·40CaO 11·39 10·99 10·95 11·02 10·94 10·97 10·89 10·98 11·83 9·49 11·41Na2O 2·79 2·93 2·95 2·98 2·95 2·96 2·97 2·97 3·18 3·55 3·37K2O 0·17 0·26 0·26 0·27 0·25 0·27 0·25 0·26 0·25 0·21 0·15P2O5 0·28 0·35 0·35 0·32 0·37 0·34 0·36 0·36 0·28 0·31 0·32H2O n.d. n.d. 0·33 n.d. n.d. 0·35 0·40 n.d. n.d. n.d. 0·26Total 99·35 99·08 99·01 98·67 99·17 99·19 99·82 99·29 99·82 98·79 100·51mg-no. 62·69 58·94 60·92 58·98 60·96 60·86 61·41 60·91 64·00 51·45 61·88
Trace elements (ppm)Sc 27·2 37·7 35·4 37·8Cr 204 251 27·9 262Co 30·5 38·3 31·8 37·7Ni 68·7 87·0 26·8 85·3Cu 39·2 62·0 56·4 60·4Zn 95·1 126 84·0 76·0Ga 13·8 17·0 17·3 16·1Rb 3·76 1·91 2·67 1·39Sr 95·6 125 143 151Y 28·6 32·0 32·2 30·7Zr 95·2 107 121 112Nb 3·92 2·49 2·71 2·32Cs 0·027 0·049 0·058 0·021Ba 29·9 17·2 28·6 16·3La 4·37 3·39 4·17 3·76Ce 12·4 10·5 12·3 11·3Pr 2·10 1·87 2·15 1·99Nd 10·7 10·1 11·2 10·4Sm 3·62 3·59 3·75 3·58Eu 1·22 1·26 1·34 1·30Gd 4·78 4·76 4·91 4·62Tb 0·870 0·874 0·891 0·849Dy 5·90 5·84 5·88 5·59Ho 1·23 1·26 1·26 1·19Er 3·48 3·58 3·59 3·41Tm 0·519 0·524 0·527 0·497Yb 3·46 3·43 3·50 3·24Lu 0·502 0·506 0·528 0·481Hf 3·16 2·88 3·13 2·89Ta 0·227 0·223 0·157 0·150Tl 0·001 0·020 0·021 0·015Pb 0·594 0·936 0·705 0·577Th 0·264 0·165 0·219 0·159U 0·090 0·062 0·080 0·061
1444

FRETZDORFF et al. PETROGENESIS OF EAST SCOTIA RIDGE
Segment: E8 E8 E8 E8 E8 E9 E9 E9 E9 E9 E9
Sample: wx58 wx59 wx60 wx61 wx62 wx63 wx64 wx65 wx67 wx66 wx66dupl.
Lat. (S): 59°10·23′ 59°16·81′ 59°19·21′ 59°25·19′ 59°37·18′ 59°32·99′ 59°46·74′ 59°55·20′ 60°03·25′ 60°04·25′ 60°04·25′Long. (W): 29°30·08′ 29°30·60′ 29°30·29′ 29°30·01′ 29°33·00′ 30°04·79′ 30°04·80′ 30°01·21′ 29°58·21′ 29°58·01′ 29°58·01′Depth (m): 3356 2816 2705 3148 3764 3237 3346 2849 2694 2442 2442
Major elements (wt %)nME/nH2O 10/7 10 13 6 11 19 10 18/5 16/5 23/4SiO2 51·53 56·53 54·98 54·86 52·31 52·11 50·99 51·75 51·53 51·30TiO2 1·64 1·14 1·69 0·88 0·89 1·24 1·12 0·90 1·85 1·53Al2O3 14·93 14·74 15·16 15·67 16·36 16·34 15·97 16·40 15·71 15·78FeO 9·78 9·89 10·78 8·96 8·07 8·20 7·86 7·48 9·13 8·83MnO 0·20 0·20 0·22 0·18 0·17 0·18 0·18 0·17 0·17 0·18MgO 7·16 4·26 3·58 5·63 6·65 6·20 6·94 7·06 6·61 7·21CaO 11·31 8·54 7·67 10·19 11·80 10·95 11·61 12·03 10·57 11·32Na2O 3·37 3·06 3·49 2·56 2·50 3·21 3·05 2·68 3·77 3·62K2O 0·16 0·28 0·21 0·21 0·13 0·27 0·28 0·21 0·52 0·30P2O5 0·31 0·26 0·28 0·25 0·26 0·29 0·29 0·26 0·40 0·34H2O 0·24 n.d. n.d. n.d. n.d. n.d. n.d. 0·92 0·44 0·30Total 100·64 98·90 98·06 99·39 99·13 99·00 98·28 99·85 100·71 100·71mg-no. 60·58 47·47 41·08 56·85 63·36 61·33 64·92 66·44 60·31 63·16
Trace elements (ppm)Sc 37·5 36·0 33·6 37·0 37·0 31·3 26·3 33·8 35·7 38·6 40·4Cr 238 23·2 12·4 70·1 223 158 202 224 197 190 255Co 37·3 31·8 34·1 31·6 33·2 32·6 36·2 31·8 34·4 35·7 35·7Ni 91·1 18·7 19·1 35·8 61·8 69·3 104 84·7 64·8 63·1 61·8Cu 62·2 115 69·7 95·0 74·8 62·8 65·8 64·5 53·6 70·6 64·6Zn 73·4 78·2 73·3 66·7 60·1 64·3 60·3 45·7 83·2 83·4 57·5Ga 15·5 15·5 15·7 14·1 13·6 14·8 13·7 12·8 17·7 17·3 15·4Rb 1·43 3·38 2·20 2·83 1·48 3·95 2·28 2·78 8·75 4·48 4·40Sr 140 143 138 135 124 160 171 155 221 185 184Y 27·2 21·4 20·8 16·2 16·1 21·5 16·0 14·1 33·0 25·6 25·9Zr 95·3 68·0 62·8 48·1 43·9 85·6 70·7 46·0 163 82·0 105·0Nb 2·03 1·60 1·43 0·947 0·767 3·52 3·47 2·04 8·88 4·49 5·15Cs 0·027 0·117 0·074 0·082 0·054 0·087 0·046 0·060 0·141 0·076 0·068Ba 15·3 46·4 35·3 32·0 26·5 51·7 67·6 31·8 90·0 51·7 49·4La 3·15 2·67 2·24 2·08 1·53 3·90 3·28 2·52 8·46 5·82 5·43Ce 9·65 7·80 6·88 5·99 4·75 10·5 8·70 6·70 21·0 15·0 14·8Pr 1·68 1·33 1·22 1·00 0·854 1·71 1·38 1·09 3·21 2·27 2·34Nd 8·94 6·80 6·53 5·27 4·67 8·58 6·91 5·54 15·3 11·3 11·6Sm 3·06 2·32 2·25 1·77 1·70 2·68 2·21 1·78 4·54 3·49 3·62Eu 1·15 0·864 0·882 0·720 0·686 0·981 0·846 0·715 1·58 1·29 1·29Gd 4·09 3·04 3·04 2·39 2·28 3·34 2·69 2·31 5·44 4·40 4·48Tb 0·745 0·554 0·562 0·439 0·426 0·606 0·480 0·404 0·960 0·775 0·776Dy 4·89 3·74 3·73 2·93 2·84 3·96 3·13 2·67 6·12 5·04 5·11Ho 1·05 0·801 0·816 0·641 0·613 0·844 0·648 0·567 1·29 1·06 1·07Er 2·99 2·31 2·32 1·85 1·79 2·34 1·83 1·68 3·56 3·19 3·16Tm 0·444 0·350 0·345 0·276 0·265 0·347 0·263 0·232 0·517 0·437 0·432Yb 2·89 2·32 2·32 1·83 1·77 2·27 1·70 1·52 3·37 2·90 2·79Lu 0·432 0·359 0·341 0·275 0·262 0·340 0·251 0·227 0·493 0·420 0·410Hf 2·41 1·78 1·73 1·34 1·23 2·24 1·78 1·33 3·95 2·92 2·92Ta 0·128 0·115 0·098 0·058 0·048 0·227 0·218 0·127 0·533 0·304 0·324Tl 0·015 0·029 0·019 0·024 0·015 0·029 0·019 0·015 0·030 0·019 0·019Pb 0·556 0·888 0·682 0·886 0·566 1·70 0·628 0·568 0·995 0·670 0·673Th 0·140 0·281 0·166 0·220 0·121 0·305 0·253 0·193 0·610 0·319 0·316U 0·051 0·089 0·053 0·067 0·038 0·110 0·091 0·067 0·220 0·120 0·124
1445

JOURNAL OF PETROLOGY VOLUME 43 NUMBER 8 AUGUST 2002
Table 1: continued
Segment: E9 E9 Standards S.D. Standards S.D.Sample: wx68 wx69 JDF-D2 CFA47-2Lat. (S): 60°12·00′ 60°20·01′Long. (W): 29°52·19′ 29°42·58′Depth (m): 2817 3259
Major elements (wt %)nME/nH2O 20/5 19/9 n = 17 n = 28SiO2 51·29 51·33 50·62 0·74 61·47 0·47TiO2 1·71 1·58 1·91 0·05 0·43 0·04Al2O3 14·71 15·67 13·70 0·19 18·57 0·20FeO 9·61 8·69 12·02 0·41 2·72 0·08MnO 0·21 0·18 0·23 0·03 0·18 0·04MgO 6·66 7·22 6·61 0·10 0·41 0·02CaO 11·26 11·02 10·79 0·13 1·83 0·15Na2O 3·64 3·50 2·79 0·03 5·33 0·05K2O 0·33 0·37 0·21 0·02 7·92 0·09P2O5 0·34 0·33 0·33 0·03 0·11 0·03H2O 0·31 0·34Total 100·06 100·24 99·21 98·97mg-no. 59·22 63·54
Trace elements (ppm) BHVO-1 (n = 3) BIR (n = 3)Sc 38·9 32·9 30·5 2·77 43·0 1·69Cr 151 200 277 11·16 365 10·99Co 37·6 34·0 42·8 0·91 50·2 0·21Ni 57·0 72·0 114 2·5 165 2·93Cu 66·2 59·0 133 5·07 113 2·54Zn 82·0 76·0 107 7·06 72·2 8·63Ga 17·0 16·5 21·3 0·40 15·1 0·04Rb 4·96 6·22 9·39 1·79 0·31 0·01Sr 177 189 402 7·91 110 2·58Y 29·7 27·6 24·4 0·98 14·4 0·62Zr 123 128 179 15·61 15·2 1·20Nb 5·38 6·04 16·8 0·57 0·535 0·01Cs 0·076 0·100 0·108 0·01 0·007 0·000Ba 53·4 65·4 133 1·75 6·53 0·20La 5·67 6·23 14·9 0·29 0·633 0·01Ce 14·9 15·7 35·6 1·22 1·84 0·03Pr 2·43 2·49 5·27 0·11 0·376 0·004Nd 12·1 12·0 23·8 0·25 2·31 0·05Sm 3·85 3·73 6·03 0·06 1·13 0·04Eu 1·39 1·32 2·02 0·004 0·505 0·001Gd 4·73 4·54 6·00 0·06 1·76 0·02Tb 0·858 0·805 0·937 0·01 0·357 0·01Dy 5·51 5·20 5·22 0·14 2·53 0·04Ho 1·17 1·09 0·982 0·02 0·56 0·005Er 3·29 3·06 2·45 0·03 1·63 0·01Tm 0·481 0·444 0·323 0·003 0·247 0·002Yb 3·13 2·90 1·97 0·03 1·63 0·01Lu 0·456 0·428 0·276 0·004 0·246 0·002Hf 3·12 3·10 4·64 0·17 0·595 0·04Ta 0·329 0·355 1·02 0·04 0·039 0·001Tl 0·024 0·021 0·045 0·01 0·009 0·01Pb 0·733 0·786 1·99 0·03 2·99 0·04Th 0·381 0·448 1·16 0·04 0·031 0·000U 0·132 0·152 0·416 0·01 0·011 0·01
wx, samples recovered by wax coring on cruise JR39b; DS, samples dredged on cruise PS47; nME, number of major elementanalyses; nH2O, number of FTIR analyses; n.d., not detected.
1446

FRETZDORFF et al. PETROGENESIS OF EAST SCOTIA RIDGE
Table 2: Sr–Nd–Pb isotope ratios of the East Scotia Ridge volcanic glasses analysed by TIMS
Segment Sample 87Sr/86Sr ± 143Nd/144Nd ± 206Pb/204Pb ± 207Pb/204Pb ± 208Pb/204Pb ±
E3 96DS-1 0·702583 5 0·513104 6 18·047 4 15·475 3 37·578 8
E3 wx45 0·702636 7 0·513098 8 18·007 2 15·482 2 37·581 5
E3 97DS-1 0·702666 7 0·513101 11 18·039 2 15·487 2 37·652 4
E3 wx46 0·703035 8 0·513042 9 18·163 1 15·512 1 37·886 3
E3 98DS-1 0·703122 7 0·513023 13 18·206 3 15·523 2 37·973 5
E4 wx47 0·703288 8 0·513004 7 18·255 1 15·530 1 38·051 2
E4 99DS-1 0·703481 6 0·512915 6 18·463 2 15·587 2 38·405 5
E4 99DS-4 0·703497 5 0·512923 7 18·453 2 15·570 1 38·359 4
E4 100DS-1 0·702768 7 0·513067 8 18·093 2 15·507 2 37·743 5
E5 wx48 0·702511 9 0·513121 5 18·025 4 15·496 3 37·571 8
E5 104DS-1 0·702554 8 0·513105 7 18·072 1 15·483 1 37·607 3
E5 wx49 0·702489 7 0·513113 4 17·999 5 15·477 4 37·515 9
E5 wx50 0·702540 8 0·513075 9 18·083 2 15·474 2 37·574 4
E6 106DS-1 0·702622 6 0·513129 7 17·832 3 15·463 3 37·399 7
E6 107DS-1 0·702498 9 0·513111 11 17·838 2 15·463 1 37·370 4
E6 107DS-3 0·702749 7 0·513112 7 17·904 3 15·476 2 37·517 6
E6 108DS-1 0·702824 7 0·513084 8 17·871 2 15·475 2 37·465 5
E7 wx54b 0·702649 8 0·513120 5 17·869 7 15·497 6 37·514 14
E7 109DS-1 0·702517 8 0·513143 4 17·869 4 15·450 3 37·391 8
E7 110DS-3 0·702829 7 0·513081 6 17·885 4 15·473 3 37·506 8
E8 wx56 0·702807 8 0·513105 8 17·946 2 15·484 2 37·619 5
E8 wx60 0·702911 9 0·513101 6 18·231 3 15·537 3 38·010 6
E8 wx62 0·702869 9 0·513072 5 18·276 2 15·535 2 38·035 4
E9 wx63 0·702982 8 0·513034 7 18·213 2 15·539 2 37·984 5
E9 wx64 0·703038 8 0·513031 7 18·091 5 15·517 4 37·821 10
E9 wx65 0·703039 9 0·513009 9 18·198 2 15·548 2 38·010 5
E9 wx67 0·703102 8 0·513001 9 17·992 3 15·505 2 37·675 6
E9 wx68 0·702940 10 0·513063 7 17·919 7 15·487 6 37·590 14
E9 wx69 0·703100 7 0·513016 8 17·935 2 15·513 2 37·659 4
± 11 (n = 11) over the course of this study. The lavas from segments E3–E7 in Table 3. Individual minerallong-term reproducibility of NBS 981 (n = 63) in this analyses are not presented here, but can be downloadedlaboratory is 206Pb/204Pb = 16·896 ± 5, 207Pb/204Pb = from the Journal of Petrology Web site at http://www.15·437 ± 7 and 208Pb/204Pb = 36·524 ± 21. During petrology.oupjournals.org. The phenocrysts are dom-the course of this study, NBS 981 analyses (n = 8) gave inated by plagioclase and olivine phenocrysts with sub-206Pb/204Pb = 16·893 ± 10, 207Pb/204Pb = 15·433 ± ordinate clinopyroxene, chrome spinel and magnetite.13 and 208Pb/204Pb= 36·514± 41, and were corrected The most visible differences between the samples are into the values of Todt et al. (1996). Total chemistry Pb both their phenocryst contents and their vesicularity.blanks were <0·3 ng and thus negligible. In Table 2 we Samples from segment E3 (96DS, 97DS, 98DS) containshow the isotope analyses of selected East Scotia Ridge some plagioclase and olivine phenocrysts (5%) and fewsamples and the 2� standard deviations. vesicles, whereas the lavas from segment E4 (99DS,
100DS) are highly vesicular, but have an almost aphyricgroundmass and sparse olivine and plagioclase pheno-crysts (<3%). Most of the samples from dredge locationsRESULTSin segments E5 (104DS), E6 (106DS, 107DS) and E7
Petrography and mineral chemistry (109DS, 110DS) are slightly vesicular and exhibit a farhigher plagioclase phenocryst content (30%) than theWe present a general summary of the major petrographic
features and mineralogical characteristics of the dredged other segments.
1447

JOURNAL OF PETROLOGY VOLUME 43 NUMBER 8 AUGUST 2002
Table 3: Petrographic description of the dredged samples
Segment Sample Rock description
E3 96DS-1 tube lava with glassy rim (up to 1 cm thick), slightly vesicular, few olivine and feldspar
phenocrysts
96DS-2 lava fragment with glassy rim (up to 1 cm thick), few small vesicles, few feldspar phenocrysts
96DS-3 small piece of lava with ropy surface, glassy rim with devitrification, oxidation on the ropy
surface, few feldspar phenocrysts
96DS-4 small piece of lava, glassy rim (0·5 cm), devitrification, slightly vesicular, few feldspar
phenocrysts
97DS-1 glass-rimmed piece, aphyric with rare patches of feldspar phenocrysts
97DS-2 small basaltic pillow, glass rimmed (0·5 cm), feldspar phenocrysts up to 6 mm, fractured
interior, devitrified glass, alteration beneath glass
97DS-3 glassy fragment, rare feldspar microphenocrysts, initial stage of devitrification
97DS-4 glassy fragment, 10% devitrification on base
97DS-5 small pillow with glassy rim (0·2 cm), 15–20% devitrification, strongly feldspar phyric
(up to 0·5 cm)
98DS-1 large piece of a pillow, glassy rim up to 0·5 cm, slightly vesicular, some vesicles glass-
coated, some feldspar phenocrysts
E4 99DS-1 pillow fragment with thin glass crust, vesicles (up to 1 cm), aphyric
99DS-2 inner part of a pillow, large vesicles (up to 2 cm), aphyric
99DS-3 pillow, vesicle-rich, some tube-formed (up to 2 cm), glassy rim (up to 1 cm thick), aphyric
99DS-4 glassy piece of sheet flow, aphyric
100DS-1 pillow fragment with glass crust, slightly vesicular (mm size)
E5 102DS-1 small fragment with glassy rim with pervasive devitrification, feldspar microphenocrysts
in less glassy material
104DS-1 large basaltic block with 0·8 cm thick glass rim (aphyric), interior is strongly feldspar-
phyric (15%)
104DS-3 lava tube fragment with glassy rim (0·8 cm), glass and interior contain feldspar phenocrysts
E6 106DS-1 pillow fragment with glassy rim (up to 1 cm thick), Fe hydroxide alteration on fracture
planes
106DS-2 piece of pillow with thin glass rim, fresh dark grey colour, feldspar phenocrysts
106DS-3 thick glassy piece, slightly altered with brownish grey colour
106DS-4 piece of pillow with glassy rim (up to 0·5 cm) alterated fracture planes with Fe
hydroxides, inner parts of rock free of alteration, some feldspar phenocrysts
107DS-1 pillow fragment with glassy rim (up to 1 cm thick), aphyric, slightly vesicular, rare
feldspar phenocrysts
107DS-3 glass-rimed (up to 0·5 cm thick) lava piece, slightly vesicular, aphyric
107DS-4 glass-rimmed (up to 1 cm) lava fragment, slightly vesicular, aphyric
108DS-1 small fragment of weakly devitrified, aphyric glass
E7 109DS-1 piece of lava tube, glassy rim (0·3 cm), aphyric
109DS-2 glass-rimmed (up to 0·5 cm) weakly vesicular flow fragment
109DS-3 glassy crust, aphyric with small vesicles
109DS-4 lava tube fragment with glassy rim (0·3 cm), aphyric
109DS-5 see 109DS-4
109DS-6 see 109DS-4
109DS-7 flow fragment slightly glassy and vesicular, Fe hydroxide staining
110DS-1 pillow lava lobe with glassy rim (0·6 cm), slightly vesicular interior, weakly feldspar phyric
110DS-2 pillow fragment weakly devitrified glass rim (0·5 cm), slightly vesicular interior, aphyric
110DS-3 lava fragment with ropy surface structure, thin glass crust, interior slightly vesicular, aphyric
110DS-4 see 110DS-3
110DS-5 similar to 110DS-3, but more channelled surface—almost ropy
110DS-6 piece of lava tube with glassy rim (up to 0·3 cm thick), contains rare feldspar phenocrysts
110DS-7 see 110DS-6
1448

FRETZDORFF et al. PETROGENESIS OF EAST SCOTIA RIDGE
Olivine phenocrysts are mostly rounded or highly contain up to 2·2 wt % H2O (Table 1). It was not possibleskeletal crystals. Subordinate olivine is present in the to measure the H2O content of all the volcanic glassesmatrix and glass rims. Generally, individual olivine along the back-arc, because of the presence of vesiclesphenocrysts show a comparable range of Fo89 (cores) to and microcrystals. We measured the H2O content ofFo83 (rims). There are no distinct chemical differences only two E2 samples from the centre of the segmentbetween phenocrysts and matrix minerals. Calculations (WX42, WX43; Table 1).show that most olivines are in equilibrium with the matrix Selected volcanic glass samples were analysed for traceglass at atmospheric pressure for a Fe/Mg KD of 0·3 elements and compositions are listed in Table 1. Com-(Roeder & Emslie, 1970; Ulmer, 1989). parison of the relative abundances of highly and mod-
Plagioclase phenocrysts are up to 5 mm long in volcanic erately incompatible trace elements along the East Scotiarocks from segments E5–E7 and with smaller sizes of up Ridge is facilitated by using N-MORB-normalized (Hof-to 2 mm in the lavas of segments E3 and E4. Some mann, 1988) abundance profiles (Fig. 5). Relative to N-phenocrysts show zonation from calcic cores to more MORB, the East Scotia Ridge volcanic glasses havesodic rims. Core compositions fall in the range An92–85 higher abundances of large ion lithophile elements (LILE)and rims, as well as unzoned phenocrysts, have An such as K, Pb, Rb and Ba, but are less enriched thancontents of 78–87. Matrix plagioclase crystals are the bulk South Atlantic sediment (from Plank & Langmuir,least calcic with the range An70–82. 1998). In contrast, the bulk sediment pattern has lower
Generally, opaque minerals are scarce in East Scotia HREE abundances than the back-arc magmas. TraceRidge lavas. Titanomagnetite, magnetite and chrome element patterns of the South Sandwich Islands samplesspinels mostly form inclusions in olivine phenocrysts in are sub-parallel to those of the back-arc glasses, althoughthe lavas of segments E3 and E4. The cr-number in the the island arc magmas tend to be more depleted in Nb,spinels ranges from 62 to 66. Ta, Zr and Hf.
Isotopic data for selected East Scotia Ridge samplesare given in Table 2. The back-arc magmas are lessradiogenic in terms of Sr and Pb than those from the
Magmatic geochemistry South Sandwich Islands (for discussion, see section oncomponents contributing to the back-arc source and FigsMajor element analyses of the dredged and wax core15 and 16) and in the case of segments E6 and E7 showsamples are presented in Table 1. Figure 3 shows all theisotopic ratios as low as an average MORB (from CohenEast Scotia Ridge lavas as well as the chemical trends of& O’Nions, 1982b). The Nd isotopic ratios of the back-the subduction-related magmas from the South Sandwicharc magmas are comparable with those from the islandIslands in the K2O–SiO2 classification diagram of Pec-arc. Both island arc and back-arc are much less radiogeniccerillo & Taylor (1976). The majority of the back-arcin Sr and more radiogenic in Nd compared with bulksamples range from basalt to basaltic andesite and areSouth Atlantic sediment. The Pb isotopes in the sedimentsprimarily low-K tholeiites, although some show medium-are similar to those in the island-arc magmas and lie atK compositions. For a given SiO2 abundance, samplesthe radiogenic extreme of the back-arc magma fields.from segments E2 and E4 are significantly enriched in
K2O relative to the other segments. MgO contents forthe majority of segments lie in the restricted range of6–9 wt % and have mg-number between 60 and 70.
MODELLING FRACTIONALHowever, segments E2 and E8 have yielded samples withCRYSTALLIZATIONMgO contents as low as 3 wt % and with mg-number as
low as 40. These two segments also show systematic The large range of major element compositions coveredvariations of CaO with MgO (Fig. 4a). In the plot of by the samples from segments E2 and E8 (see, forAl2O3 against MgO, each segment forms a distinct trend, example, Figs 3 and 4) can be modelled at least partiallyparallel to those from the other segments and to the as the product of simple crystal fractionation. Un-Mid-Atlantic Ridge (Fig. 4b). fortunately, as these segments were sampled only with a
Water contents of selected East Scotia Ridge magmas wax corer, it is impossible to check our results againstcover the range of 0·2–2·3 wt % (Table 1). Water contents the petrography of the lavas. We have performed crystalof MORB vary between 0·05 and 1·3 wt % (Michael, fractionation calculations using the least-squares GPP1995), although most N-MORB have contents between program of Geist et al. (1989) and mineral compositions0·1 and 0·4 wt % (Michael & Chase, 1987; Dixon et al., measured on phenocrysts from other segments. The1988; J. E. Dixon, personal communication, 2001). All calculated fractionation trends are shown in the CaO vssamples from East Scotia Ridge segments E6 and E7 MgO diagram (Fig. 4a), together with the mineral con-show H2O contents within this N-MORB range. Some tents of the cumulate. The trends can be modelled as
the result of either one- (E2) or two-stage (E8) crystalsamples from segments E2, E3, E4 and E9, however,
1449

JOURNAL OF PETROLOGY VOLUME 43 NUMBER 8 AUGUST 2002
Fig. 3. K2O vs SiO2 diagram for volcanic glasses from the East Scotia Ridge. Data for the E2 segment samples are, apart from WX42–WX44(Table 1), from Leat et al. (2000). Generalized trends for the low-K tholeiite, tholeiite and calc-alkaline series from the South Sandwich islandarc (Pearce et al., 1995) are indicated by dashed lines. Series boundaries and nomenclature from Peccerillo & Taylor (1976).
fractionation. Olivine, plagioclase, and subordinate fractional crystallization processes that may have affectedthe lavas.chrome spinel can produce the trend between 9 and
7 wt % MgO in the E8 magmas, whereas below 7 wt % The East Scotia Ridge lavas have high Al2O3 for agiven MgO content compared with the Mid-AtlanticMgO the decrease in CaO in both E2 and E8 reflects
the appearance of clinopyroxene in the fractionating Ridge (MAR) glasses (Fig. 4b). High Al2O3 concentrationscompared with MORB have also been observed in otherassemblage.
One of the most differentiated glass samples of segment back-arc regions (e.g. Mariana Trough, Sumisu–Torishima back-arc rifts) and have been attributed toE2 (WX33, Leat et al., 2000) could be produced from
the assumed parental basalt (WX21, Leat et al., 2000) the greater H2O content in back-arc magmas duringcrystallization (Sinton & Fryer, 1987; Fryer et al., 1990).by a total of >50% fractional crystallization: 27·3%
clinopyroxene, 20·8% plagioclase, 2·4% olivine, 0·5% The differences in Al2O3 contents between segmentsshown in Fig. 4b may reflect either the effect of varyingchrome spinel (R2 = 0·24). The first step fractionation
model for samples from segment E8 yielded >10% amounts of water on plagioclase crystallization or differ-ences in Al2O3 contents of magmas in different segments.crystal fractionation from the assumed parental (WX58)
to daughter magma composition (WX62): 5% plagioclase, Experimental work (Gaetani & Grove, 1998) has shownthat varying amounts of water in the source at the time3·5% olivine, 0·8% chrome spinel (R2 = 0·33). During
the second step fractionation, the most differentiated glass of melting will not affect the Al content of the primarymagma and so an investigation of the relationship be-sample of segment E8 (WX60) could be produced by
>40% fractional crystallization: 19·5% plagioclase, tween Al and H2O in the magmas should be able todistinguish between these two possibilities. Moreover,17·5% clinopyroxene, 4·4% olivine, 0·1% chrome spinel
(R2 = 0·11). the measured H2O content of the glasses should reflectunperturbed magmatic values, as degassing during ascentIt is important to note that elevated water contents
increase the mineral–liquid Kd of plagioclase and suppress and eruption has little effect on dissolved H2O contentsunless eruption depths are less than a few hundred metresplagioclase crystallization (e.g. Eggler & Burnham, 1973;
Michael & Chase, 1987; Sisson & Grove, 1993; Hergt (e.g. Stolper & Newman, 1994). This is confirmed forthe East Scotia Ridge by our observations that there is& Farley, 1994). At present, these effects cannot be
quantified in a rigorous way and so the calculations no correlation between eruption depth and measuredwater contents in the glasses.discussed above should only be taken as indicative of the
1450

FRETZDORFF et al. PETROGENESIS OF EAST SCOTIA RIDGE
Fig. 4. Variation of CaO and Al2O3 (wt %) vs wt % MgO for samples from the East Scotia Ridge. In (a), the continuous and dashed linesrepresent calculated liquid compositions from crystal fractionation models determined with the GPP program of Geist et al. (1985). In (b), thecontinuous lines with arrows show the crystal fractionation trends of the E2 (Leat et al., 2000), E3, E7 and E8 segments, and Mid-Atlantic Ridgelavas (MAR: Schilling et al., 1983). Each segment forms a distinct trend, parallel to those from the other segments and to the Mid-AtlanticRidge. The dashed line with an arrow is perpendicular to the fractionation trends and may reflect either the effect of varying amounts of wateron plagioclase crystallization or different Al2O3 contents in primary magmas of each segment (see text for details).
First, however, we must remove the effects of low- and so do not expect the effects of crystal fractionationon water contents to be large. We used the quantifiedpressure crystal fractionation on Al2O3 and H2O in the
erupted magmas. For Al2O3, this involves calculating Al8 fractionation assemblages calculated above and the Ray-leigh distillation equation (see, e.g. Cox et al., 1979) to(Al2O3 content of the magma recalculated to 8 wt %
MgO along the fractionation vector for each segment) work out the effects of fractionation on magmatic watercontents, assuming complete incompatibility of water inin a manner similar to the Fe8 or Na8 values of Klein &
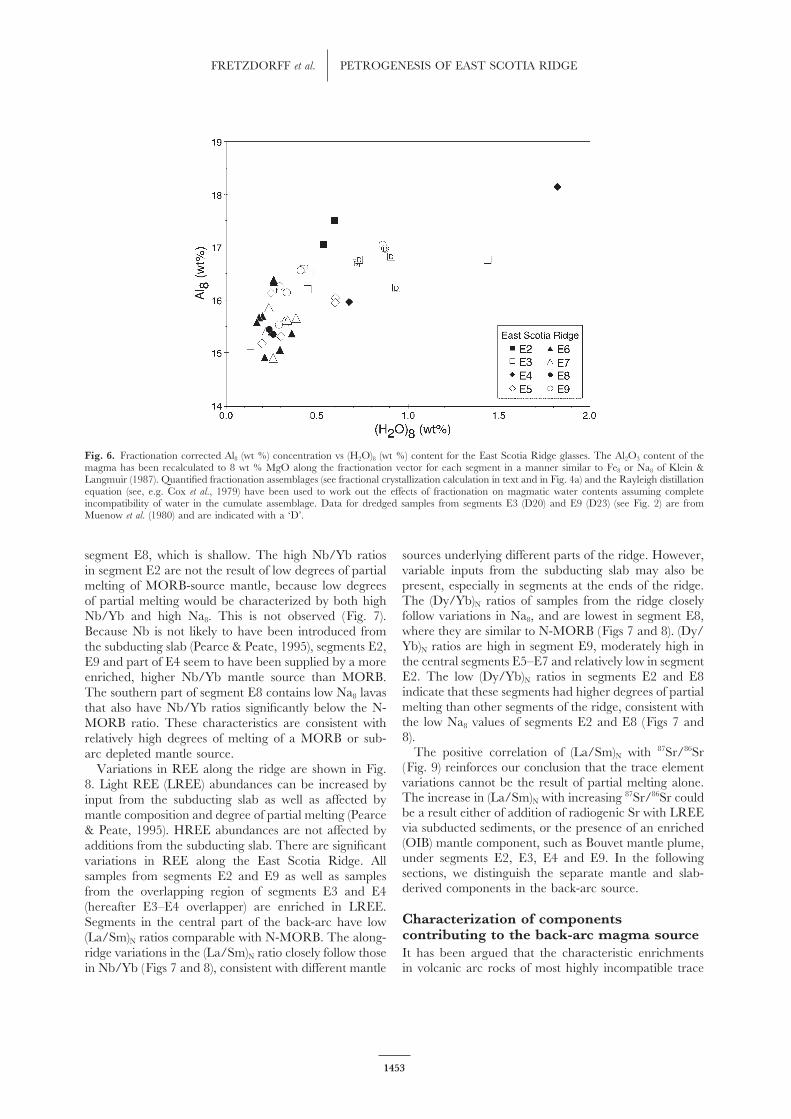
Langmuir (1987). We chose samples for H2O de- the cumulate assemblage. Figure 6 shows the relationshipbetween (H2O)8 and Al8. We see a positive correlationterminations that are relatively primitive (>6% MgO),
1451

JOURNAL OF PETROLOGY VOLUME 43 NUMBER 8 AUGUST 2002
Fig. 5. N-MORB-normalized (Hofmann, 1988) trace element patterns for selected volcanic glasses from the East Scotia Ridge. Data for theE2 segment (apart from WX42–WX44) are from Leat et al. (2000) and the shaded area represents the range of trace element abundances inSouth Sandwich island arc lavas (Pearce et al., 1995). The thick continuous line represents the composition for bulk South Atlantic sediment(n = 15) from Plank & Langmuir (1998).
between these two parameters which, in view of the is not always a reliable indicator of the presence of apersistent magma chamber.possibilities outlined above, we interpret as reflecting the
effect of magmatic water content on plagioclase solubilityin the melt. Michael & Chase (1987) have shown thatthe MORB crystallization sequence is olivine → olivine CHEMICAL VARIATIONS AND+ plagioclase→ olivine+ plagioclase+ clinopyroxene.
CHARACTERIZATION OFOur interpretation of the correlation between (H2O)8 andAl8 is that magmas with higher water contents progress COMPONENTS ALONG THE RIDGEfurther along the olivine-only fractionation path (shown Chemical variations along the ridgein Fig. 4b) and so reach higher Al2O3 contents before There are systematic variations in composition of lavasplagioclase starts to precipitate. along the East Scotia Ridge. Na8 values, which indicate
In general, segments E2 and E8 are most strongly degree of mantle partial melting (Klein & Langmuir,affected by fractional crystallization processes, with 1987), are roughly positively correlated with axial depthdifferentiated samples reaching MgO contents as low as along the ridge, in that the highest Na8 samples are3 wt %. Interestingly, the samples with lowest MgO generally from deeper parts of the ridge (Fig. 7a), andconcentrations erupt near the topographic highs at the shallow segments E2 and E8 have low Na8 values. Mostcentres of these two segments. Surprisingly, lavas of samples from the central segments E4–E7 have relativelysegment E9, which shows a very pronounced topographic high and roughly constant Na8. Segment E9 also hashigh, are not strongly fractionated. Geophysical in- high Na8, although it is as shallow as segment E2. Thevestigations of segment E2 (Livermore et al., 1997) showed relationships between segments E2–E8 indicate that axialthat there is a melt lens situated directly beneath the morphology may have been grossly controlled by degreetopographic high at the segment centre,>3 km beneath of partial melting. Nb/Yb, a ratio unaffected by additionsthe sea floor. Leat et al. (2000) suggested that the highly from the subducting slab, but sensitive to the degree offractionated magmas observed on the high probably partial melting, is approximately positively correlatedformed within the seismically imaged melt lens. If this is with axial depth (Fig. 7b). Lavas with generally low, N-the case, then we might expect further melt lenses to MORB-like, Nb/Yb ratios dominate in rift-like segmentsexist beneath the topographic highs on segments E8 and E5–E7 near the centre of the ridge, whereas high Nb/E9. The absence of highly fractionated magmas on E9, Yb lavas occur in the shallow, inflated segments E2 anddespite the existence of a pronounced axial high (Bruguier E9. However, high Nb/Yb samples have also erupted in
segment E4, which is rift-like and deep, but not in& Livermore, 2001), suggests that sea-floor topography
1452
FRETZDORFF et al. PETROGENESIS OF EAST SCOTIA RIDGE
Fig. 6. Fractionation corrected Al8 (wt %) concentration vs (H2O)8 (wt %) content for the East Scotia Ridge glasses. The Al2O3 content of themagma has been recalculated to 8 wt % MgO along the fractionation vector for each segment in a manner similar to Fe8 or Na8 of Klein &Langmuir (1987). Quantified fractionation assemblages (see fractional crystallization calculation in text and in Fig. 4a) and the Rayleigh distillationequation (see, e.g. Cox et al., 1979) have been used to work out the effects of fractionation on magmatic water contents assuming completeincompatibility of water in the cumulate assemblage. Data for dredged samples from segments E3 (D20) and E9 (D23) (see Fig. 2) are fromMuenow et al. (1980) and are indicated with a ‘D’.
segment E8, which is shallow. The high Nb/Yb ratios sources underlying different parts of the ridge. However,variable inputs from the subducting slab may also bein segment E2 are not the result of low degrees of partialpresent, especially in segments at the ends of the ridge.melting of MORB-source mantle, because low degreesThe (Dy/Yb)N ratios of samples from the ridge closelyof partial melting would be characterized by both highfollow variations in Na8, and are lowest in segment E8,Nb/Yb and high Na8. This is not observed (Fig. 7).where they are similar to N-MORB (Figs 7 and 8). (Dy/Because Nb is not likely to have been introduced fromYb)N ratios are high in segment E9, moderately high inthe subducting slab (Pearce & Peate, 1995), segments E2,the central segments E5–E7 and relatively low in segmentE9 and part of E4 seem to have been supplied by a moreE2. The low (Dy/Yb)N ratios in segments E2 and E8enriched, higher Nb/Yb mantle source than MORB.indicate that these segments had higher degrees of partialThe southern part of segment E8 contains low Na8 lavasmelting than other segments of the ridge, consistent withthat also have Nb/Yb ratios significantly below the N-the low Na8 values of segments E2 and E8 (Figs 7 andMORB ratio. These characteristics are consistent with8).relatively high degrees of melting of a MORB or sub-
The positive correlation of (La/Sm)N with 87Sr/86Srarc depleted mantle source.(Fig. 9) reinforces our conclusion that the trace elementVariations in REE along the ridge are shown in Fig.variations cannot be the result of partial melting alone.8. Light REE (LREE) abundances can be increased byThe increase in (La/Sm)N with increasing 87Sr/86Sr couldinput from the subducting slab as well as affected bybe a result either of addition of radiogenic Sr with LREEmantle composition and degree of partial melting (Pearcevia subducted sediments, or the presence of an enriched& Peate, 1995). HREE abundances are not affected by(OIB) mantle component, such as Bouvet mantle plume,additions from the subducting slab. There are significantunder segments E2, E3, E4 and E9. In the followingvariations in REE along the East Scotia Ridge. Allsections, we distinguish the separate mantle and slab-samples from segments E2 and E9 as well as samplesderived components in the back-arc source.from the overlapping region of segments E3 and E4
(hereafter E3–E4 overlapper) are enriched in LREE.Characterization of componentsSegments in the central part of the back-arc have lowcontributing to the back-arc magma source(La/Sm)N ratios comparable with N-MORB. The along-
ridge variations in the (La/Sm)N ratio closely follow those It has been argued that the characteristic enrichmentsin volcanic arc rocks of most highly incompatible tracein Nb/Yb (Figs 7 and 8), consistent with different mantle
1453

JOURNAL OF PETROLOGY VOLUME 43 NUMBER 8 AUGUST 2002
Fig. 7. (a) Na8 composition [calculated after Klein & Langmuir (1987); see also Fig. 5] and (b) Nb/Yb ratios and water depth as a function oflatitude along the East Scotia Ridge. In (a) the dashed line represents the average Na8 composition of South Atlantic MORB (Klein & Langmuir,1987) and in (b) the N-MORB average of Hofmann (1988). E2 segment data are, apart from WX42–WX44 (Table 1), from Leat et al. (2000).
elements (relative to MORB) result from the contribution Th, and may consist of variable proportions derived fromdehydration of basaltic crust and from dewatering ofof at least two components: sediment or sediment melt
and aqueous fluid (Ellam & Hawkesworth, 1988; Ryan sediments (Ishikawa & Tera, 1999; Class et al., 2000).Cross-arc geochemical traverses indicate that the fluidet al., 1995; Turner et al., 1996; Elliot et al., 1997; Turner
& Hawkesworth, 1997; Class et al., 2000). The sediment component dominates at the volcanic front, where hy-dration of the mantle causes the greatest amount ofcomponent is characterized by high La/Yb, La/Sm and
Th/Nb, and is variously regarded as addition of bulk melting of the mantle wedge (Ryan et al., 1995). Thissuggests that subduction components in back-arc spread-sediment or partial melt of subducted sedimentary rocks.
The slab-derived fluid has high B, B/Be, U/Th and Ba/ ing centres may be poor in the fluid component.
1454

FRETZDORFF et al. PETROGENESIS OF EAST SCOTIA RIDGE
Fig. 8. (a), (b) Chondrite-normalized (Sun & McDonough, 1989) REE ratios and water depth as a function of latitude along the East ScotiaRidge. The vertical lines mark the boundaries of the main ridge segments. In (a) and (b), dashed lines show the N-MORB average of Hofmann(1988). (For E2 segment data, see Fig. 7.)
The addition of subduction components to a mantle to a local composition to isolate particular components.In Fig. 10, we have compared lavas from segments E2–E9source can be assessed by comparing abundances of trace
elements in lavas to a reference composition. Pearce & with sample WX48, which has N-MORB-like valuesof (La/Sm)N, Nb/Yb, H2O and 87Sr/86Sr (0·58, 0·75,Peate (1995) compared arc lavas with a global MORB
array and estimated the percentage contribution from 0·18 wt % and 0·702511, respectively) (Tables 1 and 2).Enrichment factors were calculated by dividing measuredsubducted material for various elements. They found
that LILE such as Ba, Rb, K, Pb, Th, U and Sr are element/Yb ratios by the element/Yb ratio of sampleWX48, normalized to the Nb/Yb ratio of the sample.dominated by subducted material, having a subduction
zone contribution of >80%. Class et al. (2000) normalized This method effectively removes the effects of fractional
1455

JOURNAL OF PETROLOGY VOLUME 43 NUMBER 8 AUGUST 2002
Fig. 9. Variation of (La/Sm)N vs 87Sr/86Sr for lavas from the East Scotia Ridge (E2: Leat et al., 2000), South American–Antarctic Ridge (Dickeyet al., 1977; Le Roex et al., 1985), South Sandwich island arc (Pearce et al., 1995), Bouvet Island (Le Roex & Erlank, 1982; Kurz et al., 1998),and the (La/Sm)N (Hofmann, 1988) and 87Sr/86Sr (Ito et al., 1987) composition of N-MORB.
crystallization and different degrees of partial melting for Nb. This was interpreted by Leat et al. (2000) as a resultof variations in the relative amounts of two differentelements of similar incompatibility to Nb. It also removes
the effects of different mantle compositions such as plume slab-derived components in the arc. The high Ba/Thcomponent was interpreted to be aqueous fluid, and thevs MORB-source mantles. The LILE are ordered in Fig.
10 according to relative importance of the subduction high Th/Nb component was suggested to be sediment.Samples from the East Scotia Ridge are scattered betweencomponent to their abundances in arcs from Ba (highest)
to Sr (lowest) as determined by Pearce & Peate (1995). MORB (and plume mantle) and the arc, and trendaway from MORB toward both arc components. AnEnrichment factors are [1 in nearly all cases. The
enrichment factors of <1 for Sr in some samples probably implication of Fig. 11 is that the two components presentin the arc also influence compositions in the back-arc.reflect removal of Sr in plagioclase during fractional
crystallization. On the basis of these calculations (Fig. Some samples from E2, E4 and E8 plot toward the highTh/Nb components, whereas most of the rest of the10), the central part of the East Scotia Ridge (segments
E5–E7) shows only a minor influence of a subduction samples trend toward the high Ba/Th component. Inthis plot, it appears that the fluid component is dominantcomponent. Samples from segment E7 consistently have
the lowest enrichment factors, below two in most cases. in most back-arc samples. If the identification of theorigin of the components is correct, the few high Th/Samples from segments E2–E5, E8 and E9 show highly
variable subduction enrichment factors varying from one Nb samples contain a significant input from sediment orsediment melt, whereas the majority of samples areto 10 and even up to 15 in segment E4, and tend to be
highest in the segments near the northern and southern dominated by aqueous fluid from the slab.The behaviour of these two possible components isends of the ridge. Samples with high enrichment factors
are interpreted to have very large contributions of LILE further assessed in Fig. 12. Both Ba/Th and Th/Nbcorrelate positively with H2O abundances. In the case offrom subducted material. There are differences in the
relative enrichment of LILE between samples within Ba/Th, this is consistent with transport of Ba in anaqueous fluid. The positive correlation of Th/Nb withsegments and from segment to segment. In general, Ba,
Rb and Th are more enriched than K, U, Pb and Sr H2O suggests that Th is transported into the mantlesource either in an aqueous fluid, or in a hydrous sediment(Fig. 10). Th is relatively more enriched in the northern
segments E2, E3 and E4 than the southern segments E8 melt. Several workers have argued that Th is transportedfrom the slab in silicate melts (e.g. Elliott et al., 1997;and E9, suggesting regional variations in the importance
of different processes or slab-derived components. Turner & Hawkesworth, 1997; Class et al., 2000). Thisis consistent with experimental data indicating that ThThe relationships of LILE in the back-arc are shown
in Fig. 11. Samples from the South Sandwich Islands is preferentially partitioned into silicate melts but notinto aqueous fluids (Brenan et al., 1995; Johnson & Plank,form a negative correlation between Ba/Th and Th/
1456

FRETZDORFF et al. PETROGENESIS OF EAST SCOTIA RIDGE
Fig. 10. Estimation of the addition of subduction-related components (Ba, Rb, K, Pb, Th, U, Sr), termed ‘enrichment factors’, to the EastScotia Ridge magma source relative to a MORB-like ‘baseline’ sample (WX48) from segment E5. Enrichment factors were calculated by dividingmeasured element/Yb ratios by the element/Yb ratio of sample WX48 normalized to the Nb/Yb ratio of the sample. This method removesthe effects of fractional crystallization, different degrees of partial melting for elements of similar incompatibility to Nb and the effects of differentmantle compositions. It should be noted that the scale of the plot showing segment E4 extends to higher values than the other diagrams. (Seetext for details.)
1999), suggesting that Th requires sediment melting to mantle source independent of subduction components(Fig. 7). In Fig. 13 we investigate the compositional effectsbe efficiently transferred to the arc. However, the partition
behaviour of Th in aqueous fluids remains uncertain of the slab-derived components and plume vs MORB-source mantles on the back-arc lavas. Trends A and B(Pearce & Peate, 1995) and some workers have suggested
that, at high temperature, Th could be transported in in Fig. 13 diverge strongly from N-MORB. Trend A ischaracterized by positive correlation of Nb/Yb with Th/an aqueous fluid (Stolper & Newman, 1994).
We have already shown, using Nb/Yb ratios, that Yb, increasing Ta/Nd at constant Th/Nb, and slightlyincreasing Th/Nd with decreasing 143Nd/144Nd. Thisthere are variations in the composition of the back-arc
1457

JOURNAL OF PETROLOGY VOLUME 43 NUMBER 8 AUGUST 2002
Fig. 11. Variation of Ba/Th vs Th/Nb ratios for lavas from the East Scotia Ridge, South Sandwich island arc (Pearce et al., 1995), BouvetIsland (Le Roex & Erlank, 1982; Weaver et al., 1987), and the composition of N-MORB (Hofmann, 1988). Ba/Th and Th/Nb ratios for samplesDR.157 and DR.158 are from D. Harrison (unpublished data, 2000; location sites shown in Fig. 2). The continuous lines with arrows areputative enrichments interpreted to have been caused by aqueous fluid (increasing Ba/Th for constant low Th/Nb ratios) and sediment addition(increasing Th/Nb for constant low Ba/Th ratios) from the subducting slab (see text for details).
trend could be the result of MORB–plume source mixing to an N-MORB-like source mantle. Some samples ofsegment E2, especially the low-Na8 group, as well asand/or variable degrees of mantle partial melting. Trend
B displays increases in Th/Yb and Th/Nb with moderate several lavas dredged on the flanks of the axial high, plotbetween the two mixing lines (Fig. 13).increases in Nb/Yb and Ta/Nd, and strong negative
correlation between Th/Nd and 143Nd/144Nd. We in- The two trends are also clearly seen in plots of U8 andNb8 vs (H2O)8 (Fig. 14). Trend A shows strong increaseterpret this trend to represent MORB–subduction com-
ponent mixing. Trend A is defined mostly by samples in U8 and Nb8 with moderate increase in (H2O)8. Thistrend is defined by most samples from segment E9 asfrom segments E2 and E9 and therefore occurs sym-
metrically at the northern and southern ends of the well as the South American–Antarctic Ridge (note: wehave no water contents for the most plume-influencedspreading centre. This supports proposals that plume-
influenced mantle is migrating into the back-arc around E2 samples, and so they do not appear in Figs 12and 14). The South American–Antarctic Ridge is notthe lateral edges of the subducting plate (Livermore et
al., 1997; Leat et al., 2000). influenced by the South Sandwich subduction system,but it has been suggested that the ambient MORB-sourceThe subduction contribution (Trend B) is seen in the
high Th/Yb and Th/Nb of samples from segments E2, mantle beneath the ridge has been modified by mantlemigrating westward from the Bouvet mantle plume (LeE3, E4 and E8. Lavas from the southern part of E8
samples are distinctive in that they have low (Dy/Yb)N Roex et al., 1985; Kurz et al., 1998). Trend B in Fig. 14shows constant, MORB-like Nb8 and increasing U8 withratios (Fig. 8) and low Nb/Yb and Ta/Nd ratios (Fig.
13). Their mantle source is therefore interpreted to have increasing (H2O)8 content, implying that magmas of thesegments concerned (E2–E5, E9) were produced fromexperienced previous partial melt extraction, and hence
depletion in incompatible elements. This is the only place sources that experienced addition of water in a subductioncomponent.in the spreading centre where previously depleted mantle
appears to have been a magma source. Such depleted To place quantitative constraints on the contributionof the various source components to the different ridgemantle is also inferred to have formed the source of all
the South Sandwich arc lavas (Pearce et al., 1995). segments, we examined the Sr–Nd–Pb isotope sys-tematics. Figures 15 and 16 show our preferred mixingSamples from segments E2, E3 and E4 are enriched in
the sediment component, trending to high Th/Nb and models between the three end-members involved in thegenesis of the East Scotia Ridge lavas: (1) N-MORB-Th/Nd ratios, at Nb/Yb and Ta/Nd ratios that are
higher than MORB. We interpret these compositions to source mantle forming the ambient asthenosphere(Cohen & O’Nions, 1982b); (2) OIB-source mantleshave been formed by addition of the sediment component
1458

FRETZDORFF et al. PETROGENESIS OF EAST SCOTIA RIDGE
Fig. 12. Variation of (a) Ba/Th and (b) Th/Nb against the (H2O)8 (wt %) content (see Fig. 6 for calculation procedure) for the East ScotiaRidge glasses.
(McDonough & Sun, 1995) similar to the source of consistent with interpretations of trace element com-positions (Figs 11, 13 and 14). The East Scotia RidgeBouvet Island magmas; (3) sediment components based
on South Atlantic bulk sediment (Barreiro, 1983; Ben samples have similar 143Nd/144Nd to, but lower 87Sr/86Srthan, the South Sandwich island arc. Apart from fourOthman et al., 1989; Plank & Langmuir, 1998) using two
different estimates of the trace element abundances of samples from the flanks of segment E2, all the East ScotiaRidge samples have lower 206Pb/204Pb than the Southsediment melt (Class et al., 2000). We also show the
composition of the Discovery mantle plume, which is Sandwich arc. Mixing curves show that the Sr, Nd andPb isotopic compositions of all the East Scotia Ridgesituated at about 44°S, close to the Mid-Atlantic Ridge
(Douglass et al., 1999), and which is a similar distance samples (apart from the high 206Pb/204Pb samples fromsegment E2) can be modelled by addition of up to>2%from the East Scotia Ridge to the Bouvet mantle plume.
In Figs 15 and 16, the East Scotia Ridge samples sediment melt to MORB-source mantle (Figs 15 and16). Most samples from the central segments E3–E7 canplot close to the MORB end-member and between the
MORB end-member and the sediment and mantle plume be modelled by addition of <0·4% sediment melt toMORB-source mantle. A group of samples from thecompositions. This indicates that the MORB component
is the most widespread magma source for the East flanks of segment E2 shows a clear involvement of acomponent having 206Pb/204Pb ratios of>19·3, believedScotia Ridge, with additional contributions from variable
amounts of the sediment and mantle plume components, to have migrated from the Bouvet mantle plume (Leat
1459

JOURNAL OF PETROLOGY VOLUME 43 NUMBER 8 AUGUST 2002
et al., 2000; Pearce et al., 2001). However, it should benoted that it is difficult to distinguish between mixing ofsediment and mixing of plume mantle components witha MORB-source mantle using Pb isotope systematics(Fig. 16).
DISTRIBUTION OF MANTLECOMPONENTSThe East Scotia Ridge is tectonically simple, and thereare some features of the distribution of magma typeswithin it that appear to be systematic (Fig. 17). Thecentral segments of the ridge are sourced from MORB-source mantle that was influenced only to a minor degreeby components from the slab. Departures from MORB-like compositions are strongest close to both northernand southern ends of the ridge. The range in watercontents of the magmas, correlating with the range intrace element abundances from MORB-like to arc-like,suggests that decompression melting dominates melt pro-duction in the central part of the ridge, and that volatile-fluxed melting is more important at the ends of the ridge.
Segment E2This segment was discussed by Leat et al. (2000), whosuggested that the segment tapped both N-MORB andplume mantle sources, and that both aqueous fluid andsubducted sediment components had contributed to therange of compositions. The mantle plume component isinterpreted to have a high 206Pb/204Pb ratio, similar toBouvet, as such compositions have been identified in adredge from one flank of the central topographic highthat dominates the segment. The segment contains someof the most evolved compositions from the East ScotiaRidge, as a result of extensive fractional crystallization,which is believed to have occurred in a seismically imagedmagma chamber (Livermore et al., 1997).
Fig. 13. Variation of Th/Yb vs Nb/Yb (a), Ta/Nd vs Th/Nb (b) and Segment E3143Nd/144Nd vs Th/Nd (c) for the East Scotia Ridge lavas (E2: Leat et Most samples from this segment are close to N-MORBal., 2000), the South Sandwich island arc (Pearce et al., 1995), Bouvet
in composition, but there is a range in compositions toIsland (Sun, 1980; Weaver et al., 1987) and bulk South Atlantic sediment(Plank & Langmuir, 1998). For samples DR.157 and DR.158, dredged high LILE and low 143Nd/144Nd. The range in Nd isotopeson the flanks of the E2 segment, data are from D. Harrison (unpublished may be modelled by addition of up to >0·7% sedimentdata, 2000; location sites shown in Fig. 2). Calculated mixing trends (Fig. 15). Lavas located at the southern end of this(grey lines) between a MORB-like end-member and enriched source
segment (E3–E4 overlapper) have high (H2O)8 contents,components (Bouvet Island: Trend A; bulk South Atlantic sediment:Trend B) are shown. It should be noted that, in (a) and (b), samples up to 1·6%. The segment is interpreted to have eruptedfrom the southern part of segment E8 tend towards the data field of magmas derived from an N-MORB source mantle thatthe South Sandwich island arc, which is suggested to be generated
has been moderately enriched by a water-rich, LILE-from sub-arc mantle modified by subduction-related components fromthe downgoing slab. bearing subduction component.
1460

FRETZDORFF et al. PETROGENESIS OF EAST SCOTIA RIDGE
Fig. 14. Variation of U8 (a) and Nb8 (b) vs (H2O)8 (wt %) content (see Fig. 6 for calculation procedure) for the East Scotia Ridge (ESR) volcanicglasses compared with (a) Mariana Trough lavas (Volpe et al., 1987; Stolper & Newman, 1994) and (b) South American–Antarctic Ridge lavas(Le Roex et al., 1985; Michael, 1995). It should be noted that two clear trends can be distinguished in both diagrams. Trend A is observed insegment E9 and South American–Antarctic Ridge lavas showing an increase of U8 and Nb8 at nearly constant water contents, whereas TrendB (samples from segments E2–E5) shows in (a) a positive correlation of H2O with U8 and in (b) constant Nb8 with increasing water content.Samples having MORB-like geochemical character are indicated. Water contents for dredged samples from segment E3 (D20; indicated with a‘D’) are from Muenow et al. (1980); U ppm from Cohen & O’Nions (1982a) and Nb ppm from Saunders & Tarney (1979) and are recalculatedto 8 wt % MgO (see Fig. 6 for calculation procedure).
Segment E4 The extremely high water content of the samples makesSegment E4 is compositionally diverse. Some samples it unlikely that all the water could have been transportedare close to unmodified N-MORB, whereas lavas from by a sediment melt phase, which suggests either that twothe E3–E4 overlapper have very high LILE enrichments, subduction components were involved (aqueous fluid andespecially Ba and Rb (Fig. 10). The latter have high sediment melt; see section ‘Characterization of com-Th/Yb, 87Sr/86Sr and 206Pb/204Pb ratios, highest water ponents contributing to the back-arc magma source’) orcontents and low 143Nd/144Nd relative to all other East that an aqueous fluid transported these elements.Scotia Ridge samples (Figs 6, 13 and 15). Sr–Nd–Pbisotope mixing calculations suggest that the samples canbe modelled by addition of 2% sediment melt to a
Segments E5–E7MORB-source mantle (Figs 15 and 16). These relativelyLavas from the central part of the East Scotia Ridge areextreme compositions are interpreted to have been gen-close to N-MORB with respect to trace element ratioserated by addition of a very water-rich subduction com-
ponent that also transported Sr, Th, Nd, Pb, Ba and Rb. such as Nb/Yb, (La/Sm)N, Th/Nb and Th/Yb. The
1461

JOURNAL OF PETROLOGY VOLUME 43 NUMBER 8 AUGUST 2002
Fig. 15. 143Nd/144Nd (a) and 87Sr/86Sr (b) vs 206Pb/204Pb for the East Scotia Ridge lavas (E2: Leat et al., 2000), South Sandwich island arc (Pearceet al., 1995), South American–Antarctic Ridge (SAAR; Dickey et al., 1977; Le Roex et al., 1985; Ito et al., 1987; Kurz et al., 1998), southern PacificMORB (Castillo et al., 1998), bulk South Atlantic sediment (Ben Othman et al., 1989; Plank & Langmuir, 1998), Bouvet Island (Sun, 1980; Weaveret al., 1987), and Discovery [average composition from Douglass et al. (1999)]. For samples DR.157 and DR.158, dredged on the flanks of the E2segment, data are from D. Harrison (unpublished data, 2000; location sites shown in Fig. 2). Data from additional E3 (D20) and E9 (D23) samples,indicated with a ‘P’, are from Pearce et al. (2001). Three end-members are suggested to be involved in the petrogenesis of the East Scotia Ridgelavas and calculated mixing trends are indicated. Literature data: ‘MORB source’ from McKenzie & O’Nions (1995) and Cohen & O’Nions(1982b); ‘plume mantle’ from Sun & McDonough (1989), McDonough & Sun (1995) and McKenzie & O’Nions (1995); ‘sediment melt’ from BenOthman et al. (1989), Plank & Langmuir (1998) and Class et al. (2000). Data used for mixing calculations in (a) MORB source–bulk sediment:206Pb/204Pb: 17·8 and 18·6; 0·05, 10 and 3 ppm; 143Nd/144Nd: 0·5132 and 0·5125; 1·2, 34 and 90 ppm; MORB source–plume mantle: 206Pb/204Pb: 17·8 and 19·5; 0·05 and 0·15 ppm; 143Nd/144Nd: 0·5132 and 0·5129; 1·2 and 1·25 ppm; MORB source + 0·4% bulk sediment–plumemantle: 206Pb/204Pb: 17·94 and 19·5; 0·06 and 0·15 ppm; 143Nd/144Nd: 0·5130 and 0·5129; 1·23 and 1·25 ppm; in (b) MORB source–bulksediment: 206Pb/204Pb: 17·8 and 18·6; 0·05 and 10·3 ppm; 87Sr/86Sr: 0·7025 and 0·7080; 14·7, 170 and 440 ppm; MORB source + 0·4% bulksediment–plume mantle: 206Pb/204Pb: 17·94 and 19·5; 0·05 and 0·15 ppm; 87Sr/86Sr: 0·7030 and 0·7035; 14·7 and 19·9 ppm.
1462

FRETZDORFF et al. PETROGENESIS OF EAST SCOTIA RIDGE
Fig. 16. 208Pb/204Pb (a) and 207Pb/204Pb (b) vs 206Pb/204Pb for the East Scotia Ridge lavas (E2; Leat et al., 2000), South Sandwich island arc(Pearce et al., 1995), South American–Antarctic Ridge (Dickey et al., 1977; Le Roex et al., 1985; Ito et al., 1987; Kurz et al., 1998), Pacific MORB(Castillo et al., 1998), bulk South Atlantic sediment (Barreiro, 1983; Ben Othman et al., 1989; Plank & Langmuir, 1998), and Bouvet Island (Sun,1980; Kurz et al., 1998), and Discovery (average composition from Douglass et al., 1999). For samples DR.157 and DR.158, dredged on theflanks of the E2 segment, data are from D. Harrison (unpublished data, 2000; location sites shown in Fig. 2). Data from additional E3 (D20)and E9 (D23) samples, indicated with a ‘P’, are from Pearce et al. (2001). Data used for mixing calculations in (a) MORB source–bulk sediment:206Pb/204Pb: 17·8 and 18·6; 0·05 and 10 ppm; 208Pb/204Pb: 37·4 and 38·6 ppm; in (b) 207Pb/204Pb: 15·45 and 15·62 ppm.
water content and the Rb and Ba concentrations are with the other segments and relatively high (Dy/Yb)Nratios. On the basis of the slightly elevated water contentsslightly higher than those of N-MORB. Furthermore,
the samples show the highest Na8 contents compared and higher Ba/Th ratios compared with N-MORB, we
1463

JOURNAL OF PETROLOGY VOLUME 43 NUMBER 8 AUGUST 2002
Fig. 17. Sketch of the South Sandwich subdution zone showing the distribution of components contributing to the source of individual back-arc segments. (See text for details.)
suggest that there is a minor influence of a subduction by high Na8, high Nb/Yb and (La/Sm)N ratios, and highNb8 and U8 abundances relative to the northern partcomponent, probably an aqueous fluid, on an N-MORB
mantle source in the central part of the ridge. (Figs 7 and 14). The relatively high magma productionand hence positive topography of this segment suggestsa high degree of mantle partial melting. This may berelated to plume mantle migrating around the southernSegment E8 end of the slab, or a relatively large influence of subducted
Lavas from the southern part of segment E8 are distinctive water in the source (Bruguier & Livermore, 2001). How-in having an apparently depleted, low Nb/Yb and (Dy/ ever, segment E9 lavas have relatively high Na8 values,Yb)N source, and strong enrichments in LILE (Figs 7b, implying small degrees of mantle partial melting. They8b and 10). The samples are similar to those of the South are also relatively poor in geochemical components de-Sandwich island arc in many trace element ratios (Fig. rived from the subducting slab. The chemical similarity13). Their low Nb/Yb and (Dy/Yb)N ratios indicate that of E9 lavas with lavas from the South American–Antarctictheir mantle source was depleted relative to MORB Ridge suggests similar mantle sources, but radiogenicowing to the extraction of a previous melt fraction. isotopes indicate that the component that sourced seg-Although, in general, mantle has already been processed ment E9 was unlikely to have been the uncontaminatedthrough the back-arc melting and then is depleted be- HIMU Bouvet component.neath arcs we see a clear involvement of such depletedmantle in the magma source of the lavas erupted in thesouthern part of segment E8 (Figs 8 and 13), whichmight be explained by high degrees of melting of a CONCLUSIONSMORB source. The high Ba/Th ratios of the samples,
(1) Sampling of segments E2–E9 of the East Scotia Ridgeevident in Figs 11 and 12, indicate that segment E8 washas shown that there are striking variations in sources ofaffected mainly by aqueous fluid rather than sedimentmagmas erupted along the ridge. Some of these variationsfrom the subduction zone.appear to be related to position within the back-arc basin,and tectonic relationship to the subducting slab.
(2) Segments E2 and E8, both near the ends of theSegment E9 ridge, erupt significantly more evolved magmas than the
others. The most evolved magmas are the productsSegment E9 lavas are variable in composition, withof >50% fractional crystallization for the most maficprogressive north–south trends (Figs 7 and 8). Samples
from the southern part of the segment are characterized observed compositions. The evolved lavas were erupted
1464

FRETZDORFF et al. PETROGENESIS OF EAST SCOTIA RIDGE
Barker, P. F. (1995). Tectonic framework of the East Scotia Sea. In:on topographic highs along the axes of segments E2 andTaylor, B. (ed.) Backarc Basins: Tectonics and Magmatism. New York:E8, and the fractionation is interpreted to have occurredPlenum, pp. 281–314.in shallow magma chambers. In the case of Segment E2,
Barker, P. F. & Lawver, L. A. (1988). South American–Antarctic platesuch an axial magma chamber has been seismically motion over the past 50 Myr, and the evolution of the Southimaged (Livermore et al., 1997). American–Antarctic ridge. Geophysical Journal 94, 377–386.
(3) The central segments of the ridge are sourced from Barreiro, B. (1983). Lead isotopic compositions of South Sandwichisland volcanic rocks and their bearing on magmagenesis in intra-MORB-source mantle that was influenced only to aoceanic island arcs. Geochimica et Cosmochimica Acta 47, 817–822.minor degree by components from the subducting slab.
Ben Othman, D., White, W. M. & Patchett, J. (1989). The geochemistry(4) The northern segment E2 is strongly influenced byof marine sediments, island arc magma genesis, and crust–mantleplume mantle, which is interpreted to be flowing west-recycling. Earth and Planetary Science Letters 94, 1–21.
ward into the back-arc around the edge of the subducting Brenan, J. M., Shaw, H. F., Ryerson, F. J. & Phinney, D. L. (1995).slab (Livermore et al., 1997; Leat et al., 2000; Pearce et Mineral–aqueous fluid partitioning of trace elements at 900°C andal., 2001). The mantle plume component is chemically 2·0 GPa: constraints on the trace element chemistry of mantle and
deep crustal fluids. Geochimica et Cosmochimica Acta 59, 3331–3350.similar to the Bouvet mantle plume, consistent withBrett, C. P. (1977). Seismicity of the South Sandwich Islands region.evidence for westward flow of mantle from Bouvet,
Geophysical Journal of the Royal Astronomical Society 51, 453–464.which has been traced geochemically along the SouthBruguier, N. J. & Livermore, R. A. (2001). Enhanced magma supplyAmerican–Antarctic Ridge (Le Roex et al., 1985; Kurz
at the southern East Scotia Ridge: evidence for mantle flow aroundet al., 1998). Evidence for a mantle plume component in the subducting slab? Earth and Planetary Science Letters 191, 129–144.segment E9 at the southern end of the East Scotia Ridge Castillo, P. R., Natland, J. H., Niu, Y. & Lonsdale, P. F. (1998). Sr,is equivocal. Nd and Pb isotopic variation along the Pacific–Antarctic risecrest,
53–57°S: implications for the composition and dynamics of the(5) Subduction components derived from the slab areSouth Pacific upper mantle. Earth and Planetary Science Letters 154,present in relatively large amounts at the ends of the109–125.ridge, and in small amounts in the central segments.
Class, C., Miller, D. M., Goldstein, S. L. & Langmuir, C. H. (2000).Contributions from the slab are chemically hetero-Distinguishing melt and fluid subduction components in Umnak
geneous, and at least two different subduction com- volcanics, Aleutian Arc. G3 1, 1999GC000010.ponents appear to be present, identified as sediment or Cohen, R. S. & O’Nions, R. K. (1982a). Identification of recycledsediment melt and an aqueous fluid. continental material in the mantle from Sr, Nd and Pb isotope
investigations. Earth and Planetary Science Letters 61, 73–84.Cohen, R. S. & O’Nions, R. K. (1982b). The lead, neodymium and
strontium isotopic structure of oceanic ridge basalts. Journal of PetrologyACKNOWLEDGEMENTS 23, 299–324.
Cox, K. G., Bell, J. D. & Pankhurst, R. J. (1979). The Interpretation ofWe thank C.-D. Garbe-Schonberg and T. Arpe forIgneous Rocks. London: George Allen & Unwin, 445 pp.their extensive help with the ICP-MS analyses, and Kaj
Dickey, J. S., Frey, A. F., Hart, S. R. & Watson, E. B. (1977).Hoernle and Folkmar Hauff for their valuable assistanceGeochemistry and petrology of the dredged basalts from the Bouvetwith the TIMS analyses. Many thanks go to Dietrich triple junction, South Atlantic. Geochimica et Cosmochimica Acta 41,
Ackermand, Nigel Bruguier, Alex Cunningham, Graham 1105–1118.Eagles, Chris German, Helge Moller, Sven Petersen, Dixon, J. E., Stolper, E. & Delaney, J. R. (1988). Infrared spectroscopicTeal Riley, Ulrich Schwarz-Schampera and the captains measurements of CO2 and H2O in Juan de Fuca Ridge basaltic
glasses. Earth and Planetary Science Letters 90, 87–104.and crews of the Polarstern and James Clark Ross for ableDouglass, J., Schilling, J.-G. & Fontignie, D. (1999). Plume–ridgeassistance with the sampling at sea. J. Pearce, R. Stern,
interaction of the Discovery and Shona mantle plume with theT. Elliott and M. Wilson are gratefully acknowledgedsouthern Mid-Atlantic Ridge (40°–55°S). Journal of Geophysical Researchfor their extremely thorough and constructive reviews.104, 2941–2962.
This work was funded in part by the Deutsche For- Eggler, D. H. & Burnham, C. W. (1973). Crystallization and frac-schungsgemeinschaft (DFG) and forms part of the British tionation trends in the system andesite–H2O–CO2–O2 at pressuresAntarctic Survey’s Oceanic Active Margins project. to 10 kb. Geological Society of American Bulletin 84, 2517–2532.
Eiler, J. M., Crawford, A., Elliot, T., Farley, K. A., Valley, J. W. &Stolper, E. M. (2000). Oxygen isotope geochemistry of oceanic-arclavas. Journal of Petrology 41, 229–256.
REFERENCES Ellam, R. M. & Hawkesworth, C. J. (1988). Elemental and isotopicvariations in subduction related basalts: evidence for a three com-Alvarez, W. (1982). Geological evidence for the geographical patternponent model. Contributions to Mineralogy and Petrology 98, 72–80.of mantle return flow and the driving mechanism of plate tectonics.
Elliott, T., Plank, T., Zindler, A., White, W. & Bourdon, B. (1997).Journal of Geophysical Research 87, 6697–6710.Element transport from slab to volcanic front at the Mariana arc.Baker, P. E. (1968). Comparative volcanology and petrology of theJournal of Geophysical Research 102, 14991–15019.Atlantic islands arcs. Bulletin Volcanologique 32, 189–206.
Fryer, P., Taylor, B., Langmuir, C. H. & Hochstaedter, A. G. (1990).Baker, P. E. (1990). South Sandwich Islands. In: LeMasurier, W. E. &Petrology and geochemistry of lavas from the Sumisu and TorishimaThomson, J. W. (eds) Volcanoes of the Antarctic Plate and Southern Oceans.
American Geophysical Union, Antarctic Research Series 48, 361–395. backarc rifts. Earth and Planetary Science Letters 100, 161–178.
1465

JOURNAL OF PETROLOGY VOLUME 43 NUMBER 8 AUGUST 2002
Gaetani, G. A. & Grove, T. L. (1998) The influence of water on Livermore, R., Larter, R. D., Cunningham, A. D., Vanneste, L.,melting of mantle peridotite. Contributions to Minerology and Petrology Hunter, R. J. & the JR09 team (1995). Hawaii-MR1 sonar survey131, 323–346. of the east Scotia ridge. BRIDGE Newsletter 8, 51–53.
Garbe-Schonberg, C.-D. (1993). Simultaneous determination of thirty- Livermore, R., Cunningham, A. D., Vanneste, L. & Larter, R. (1997).seven trace elements in twenty-eight international rock standards by Subduction influence on magma supply at the East Scotia Ridge.ICP-MS. Geostandards Newsletter 17, 81–97. Earth and Planetary Science Letters 150, 261–275.
Geist, D. J., McBirney, A. R. & Baker, B. H. (1985). GPP, a program Livermore, R., Bruguier, N., Cunningham, A. D., Domaschk, U.,package for creating and using geochemical data files. Eugene: Eagles, G., Fretzdorff, S., German, C., Maldonado, A., Morris, P.University of Oregon. & team of JCR39b (1999). JR39b: deep-towed sonar and seismic
Govindaraju, K. (1994). Compilation of working values and sample- survey on the East Scotia Ridge. InterRidge News 8, 34–37.description for 383 geostandards. Geostandards Newsletters 13, 1–158. Mattey, D. P., Carr, R. H., Wright, I. P. & Pillinger, C. T. (1984).
Gribble, R. F., Stern, R. J., Newman, S., Bloomer, S. H. & O’Hearn, Carbon isotopes in submarine basalts. Earth and Planetary Science LettersT. (1998). Chemical and isotopic composition of lavas from the 70, 196–206.northern Mariana Trough: implications for magmagenesis in back- McDonough, W. F. & Sun, S.-S. (1995). The composition of the Earth.arc basins. Journal of Petrology 39, 125–154. Chemical Geology 120, 223–253.
Hawkesworth, C. J., O’Nions, R. K., Pankhurst, R. J., Hamilton, P. McKenzie, D. & O’Nions, R. K. (1995). The source regions of oceanJ. & Evensen, N. M. (1977). A geochemical study of island-arc and islands. Journal of Petrology 36, 133–159.back-arc tholeiites from the Scotia Sea. Earth and Planetary Science Michael, P. J. (1995). Regionally distinctive sources of depleted MORB:Letters 36, 253–262.
evidence from trace elements and H2O. Earth and Planetary ScienceHawkins, J. W. (1976). Petrology and geochemistry of basaltic rocks of
Letters 131, 301–320.the Lau Basin. Earth and Planetary Science Letters 28, 283–298.
Michael, P. J. & Chase, R. L. (1987). The influence of primaryHawkins, J. W. & Melchior, J. T. (1985). Petrology of Mariana Troughmagma composition, H2O and pressure on mid-ocean ridge basaltand Lau Basin basalts. Journal of Geophysical Research 90, 11431–11468.differentiation. Contributions to Mineralogy and Petrology 96, 245–263.Hergt, J. M. & Farley, K. N. (1994). Major element, trace element, and
Muenow, D. W., Liu, N. W. K., Garcia, M. O. & Saunders, A. D.isotope (Pb, Sr, and Nd) variations in Site 834 basalts: implications for(1980). Volatiles in submarine volcanic rocks from the spreadingthe initiation of backarc opening. In: Hawkins; J., Parson, L. &axis of the East Scotia Sea back-arc basin. Earth and Planetary ScienceAllan, J. (eds) Proceedings of the Ocean Drilling Program, Scientific Results,Letters 47, 272–278.135. College Station, TX: Ocean Drilling Program, pp. 471–485.
Newman, S. & Stolper, E. (1996). Volatiles in magmas from the EastHoernle, K. A. & Tilton, G. R. (1991). Sr–Nd–Pb isotope dataScotia Sea, South Atlantic Ocean. JAG/RAS Meeting on Subductionfor Fuerteventura (Canary Islands) basal complex and subaerialZone Structure, Dynamics and Magmatism, London. London: Joint As-volcanics: applications to magma genesis and evolution. Schweizerischesociation for Geophysics, Geological Society.Mineralogische und Petrographische Mitteilungen 71, 3–18.
Pearce, J. A. & Peate, D. W. (1995). Tectonic implications of theHofmann, A. W. (1988). Chemical differentiation of the Earth: thecomposition of volcanic arc magmas. Annual Review of Earth andrelationship between mantle, continental crust, and oceanic crust.
Earth and Planetary Science Letters 90, 297–314. Planetary Science Letters 23, 251–285.Ishikawa, T. & Tera, F. (1999). Two isotopically distinct fluid com- Pearce, J. A., Baker, P. E., Harvey, P. K. & Luff, I. W. (1995).
ponents involved in the Mariana arc: evidence from Nb/B ratios Geochemical evidence for subduction fluxes, mantle melting andand B, Sr, Nd, and Pb isotope systematics. Geology 27, 83–86. fractional crystallization beneath the South Sandwich island arc.
Ito, E., White, W. M. & Gopel, C. (1987). The O, Sr, Nd and Pb Journal of Petrology 36, 1073–1109.isotope geochemistry of MORB. Chemical Geology 62, 157–176. Pearce, J. A., Leat, P. T., Barker, P. F. & Millar, I. L. (2001).
Jenner, G. A., Longerich, H. P., Jackson, S. E. & Fryer, B. J. (1990). Geochemical tracing of Pacific-to-Atlantic upper-mantle flowA powerful tool for high-precision trace element analysis in earth through the Drake Passage. Nature 410, 457–461.sciences: evidence from analysis of selected U.S.G.S. reference Peate, D. W., Kokfelt, T. F., Hawkesworth, C. J., van Calsteren, P.samples. Chemical Geology 83, 133–148. W., Hergt, J. M. & Pearce, J. A. (2001). U-series isotope data on
Johnson, M. C. & Plank, T. (1999). Dehydration and melting ex- Lau Basin glasses: the role of subduction-related fluids during meltperiments constrain the fate of subducted sediments. G3 1, generation in back-arc basins. Journal of Petrology 42, 1449–1470.1999GC000014. Peccerillo, A. & Taylor, S. R. (1976). Geochemistry of Eocene calc-
Klein, E. M. & Langmuir, C. H. (1987). Global correlation of oceanalkaline volcanic rocks from the Kastamonu area, northern Turkey.
ridge basalt chemistry with axial depth and crustal thickness. JournalContributions to Mineralogy and Petrology 58, 63–81.
of Geophysical Research 92(B8), 8089–8115.Pelayo, A. M. & Wiens, D. A. (1989). Seismotectonics and relativeKurz, M. D., Le Roex, A. P. & Dick, H. J. B. (1998). Isotope
plate motions in the Scotia Sea region. Journal of Geophysical Researchgeochemistry of the oceanic mantle near the Bouvet triple junction.94(B6), 7293–7320.
Geochimica et Cosmochimica Acta 62, 841–852.Plank, T. & Langmuir, C. H. (1998). The chemical composition ofLe Roex, A. & Erlank, A. J. (1982). Quantitative evaluation of fractional
subducting sediment and its consequences for the crust and mantle.crystallization in Bouvet Island lavas. Journal of Volcanology and Geo-Chemical Geology 145, 325–394.thermal Research 13, 309–338.
Roeder, P. L. & Emslie, R. F. (1970). Olivine–liquid equilibrium.Le Roex, A. P., Dick, H. J. B., Reid, A. M., Frey, F. A., Erlank, A. J.Contributions to Mineralogy and Petrology 29, 275–289.& Hart, S. R. (1985). Petrology and geochemistry of basalts from
Ryan, J. G., Morris, J., Tera, F., Leeman, W. P. & Tsvetkow, A.the American–Antarctic Ridge, Southern Ocean: implications for(1995). Cross-arc geochemical variations in the Kurile Arc as athe westward influence of the Bouvet mantle plume. Contributions tofunction of slab depth. Science 270, 625–627.Mineralogy and Petrology 90, 367–380.
Saunders, A. D. & Tarney, J. (1979). The geochemistry of basalts fromLeat, P. T., Livermore, R. A., Millar, I. L. & Pearce, J. A. (2000).a back-arc spreading centre in the East Scotia Sea. Geochimica etMagma supply in back-arc spreading centre segment E2, East Scotia
Ridge. Journal of Petrology 41, 845–866. Cosmochimica Acta 43, 555–572.
1466

FRETZDORFF et al. PETROGENESIS OF EAST SCOTIA RIDGE
Saunders, A. D., Tarney, J., Weaver, S. D. & Barker, P. F. (1982). arc region. In: Talwani, M. & Pitman, W. C. (eds) Maurice Ewing
Scotia Sea floor: geochemistry of basalts form the Drake Passage Series, 1: Island Arcs, Deep Sea Trenches, and Back-Arc Basins. Washington,and South Sandwich spreading centers. Antarctic Geoscience, International DC: American Geophysical Union, pp. 367–377.Union of Geological Science, Series B 4, 213–222. Tarney, J., Saunders, A. D., Mattey, D. P., Wood, D. A. & Marsh, N.
Saunders, A. D., Norry, M. J. & Tarney, J. (1991). Fluid influence G. (1981). Geochemical aspects of back-arc spreading in the Scotiaon the trace element compositions of subduction zone magmas. Sea and western Pacific. Philosophical Transactions of the Royal Society ofPhilosophical Transactions of the Royal Society of London, Series A 335, London, Series A 300, 263–285.377–392. Todt, W., Cliff, R. A., Hanser, A. & Hofmann, A. W. (1996). Evaluation
Schilling, J.-G., Zajac, M., Evans, R., Johnston, T., White, W., Devine, of a 202Pb–205Pb double spike for high precision lead isotope analyses.J. D. & Kingsley, R. (1983). Petrologic and geochemical variations In: Basu, A. & Hart, S. (eds) Earth Processes: Reading the Isotopic Code.along the Mid-Atlantic Ridge from 29°N to 73°N. American Journal Geophysical Monograph, American Geophysical Union 95, 429–437.of Science 283, 510–586. Turner, S. & Hawkesworth, C. (1997). Constraints on flux rates and
Sclater, J. G., Bowin, C. O., Hey, R., Hoskins, H., Pierce, J., Phillips, mantle dynamics beneath island arcs from Tonga–Kermadec lavaJ. & Tapscott, C. (1976). The Bouvet triple junction. Journal of geochemistry. Nature 389, 568–573.Geophysical Research 81, 1857–1869. Turner, S. & Hawkesworth, C. (1998). Using geochemistry to map
Sinton, J. M. & Fryer, P. (1987). Mariana Trough lavas from 18°N: mantle flow beneath the Lau Basin. Geology 26, 1019–1022.implications for the origin of back arc basin basalts. Journal of Turner, S., Hawkesworth, C., van Calsteren, P., Heath, E., Macdonald,Geophysical Research 92B, 12782–12802. R. & Black, S. (1996). U-series isotopes and destructive plate margin
Sisson, T. W. & Grove, T. L. (1993). Experimental investigations of magma genesis in the Lesser Antilles. Earth and Planetary Science Lettersthe role of H2O in calc-alkaline differentiation and subduction zone 142, 191–207.magmatism. Contributions to Mineralogy and Petrology 113, 143–166.
Ulmer, P. (1989). The dependence of the Fe2+–Mg cation-partitioningStern, R. J., Lin, P.-N., Morris, J. D., Jackson, M. C., Fryer, P.,
between olivine and basaltic liquid on pressure, temperature andBloomer, S. H. & Ito, E. (1990). Enriched back-arc basin basalts
composition. Contributions to Mineralogy and Petrology 101, 261–273.from the northern Mariana Trough: implications for the magmatic
Vanneste, L. E. & Larter, R. D. (2002). Sediment subduction, sub-evolution of back-arc basins. Earth and Planetary Science Letters 100,duction erosion and strain regime in the northern South Sandwich210–225.forearc. Journal of Geophysical Research (in press).Stolper, E. (1982). Water in silicate glasses: an infrared spectroscopic
Volpe, A. M., Macdougall, J. D. & Hawkins, J. W. (1987). Marianastudy. Contributions to Mineralogy and Petrology 81, 1–17.Trough basalts (MTB): trace element and Sr–Nd isotope evidenceStolper, E. & Newman, S. (1994). The role of water in the petrogenesisfor mixing between MORB-like and arc-like melts. Earth and Planetaryof Mariana trough magmas. Earth and Planetary Science Letters 121,Science Letters 82, 241–254.293–325.
Weaver, B. L., Wood, D. A., Tarney, J. & Joron, J. L. (1987).Sun, S.-S. (1980). Lead isotopic study of young volcanic rocks from mid-Geochemistry of ocean island basalts from the South Atlantic:ocean ridges, ocean islands and island arcs. Philosophical Transactions ofAscension, Bouvet, St. Helena, Gough and Tristan da Cunha. In:the Royal Society of London 297, 409–445.Fitton, J. G. & Upton, B. G. J. (eds) Alkaline Igneous Rocks. GeologicalSun, S.-S. & McDonough, W. F. (1989). Chemical and isotopic sys-Society, London, Special Publication 30, 253–267.tematics of oceanic basalts: implications for mantle composition and
Woodhead, J., Eggins, S. & Gamble, J. (1993). High field strength andprocesses. In: Saunders, A. D. & Norry, M. J. (eds) Magmatism in thetransition element systematics in island arc and back-arc basinOcean Basins. Geological Society, London, Special Publication 42, 313–345.basalts: evidence for multi-phase melt extraction and a depletedTarney, J., Saunders, A. D. & Weaver, S. D. (1977). Geochemistry of
volcanic rocks from the island arcs and marginal basins of the Scotia mantle wedge. Earth and Planetary Science Letters 114, 491–504.
1467