pesticide use and ipm adoption: does ipm reduce pesticide...
TRANSCRIPT
1
Pesticide Use and IPM Adoption: Does IPM Reduce Pesticide Use
in the United States?
Authors
Jason Maupin
Virginia Tech
Department of Agricultural and Applied Economics
George Norton
Virginia Tech
Department of Agricultural and Applied Economics
Selected Paper prepared for presentation at the Agricultural & Applied Economics
Association 2010 AAEA, CAES, & WAEA Joint Annual Meeting, Denver, Colorado,
July 25-27, 2010
Copyright 2010 by Jason Maupin and George Norton. All rights reserved. Readers may
make verbatim copies of this document for non-commercial purposes by any means,
provided that this copyright notice appears on all such copies.
2
Pesticide Use and IPM Adoption: Does IPM Reduce Pesticide Use
in the United States?
Abstract
In 2001, the United States General Accounting Office issued a report entitled
“Management Improvements Needed to Further Promote Integrated Pest Management.”
This report documents that overall agricultural pesticide usage increased from 1992 to
2000 while the use of the most toxic levels of pesticides have decreased. The USDA
suggests that these changes in pesticide use could have been caused by integrated pest
management (IPM) adoption. However, the GAO maintains that there is not enough
evidence to support this claim. This paper contributes to this debate by estimating the
relationship between pesticide use and IPM practices adopted for number of commodities
across the nation from 1996 to 2005. The paper exploits an aggregated data set that
combines surveys from different crops and different years, but it also examines specific
surveys conducted on cotton and corn crops to better control for other factors that could
affect pesticide use. The paper applies multiple definitions of IPM and uses different
spatial variables to control for environmental effects that affect pesticide use. Although
some specific strategies such as GM adoption decreased the amount of active ingredients
sprayed on cotton and corn, the results suggest that on average the adoption of IPM
strategies lead to slightly increased pesticide spending and pounds of active ingredient
sprayed per acre. This result is confirmed in both the analysis on the aggregated data as
well as the analysis of the cotton and corn data. The results also suggest that fixed
environmental factors explain a significant amount of chemical spending and pesticide
use in the United States. The significance of these factors demonstrates the importance
of research and programs that aid farmers in making intelligent pesticide use decisions at
the local level.
Keywords: Pesticide Use, Integrated Pest Management, Corn Production, Cotton
Production
Acknowledgements We gratefully acknowledge funding support from USDA/CSREES through the Southern
Region IPM program without implicating them in any errors or omissions.
We thank Bob Dubman at ERS, Brad Summa at NASS, Dave Mueller and Herman
Ellison and the Virginia Field Office of NASS for assistance in obtaining access to the
ARMS data.
We also thank Jeff Alwang, Dan Taylor, Chris Parmeter, Jaren Pope and seminar
participants at the Sixth Annual IPM Symposium for helpful comments. All remaining
errors and omissions remain our own.
3
Introduction
Since the 1970s, government officials, university researchers, and extension
specialists have worked together under the umbrella of integrated pest management
(IPM) to establish and implement improved pest management practices. These practices
are designed to provide economic benefits and reduce environmental and health risks.
The national impacts of IPM on environmental and health risks have been called into
question by federal officials. The United States General Accounting Office (GAO)
(2001) used data from the Environmental Protection Agency (EPA) and the Center for
Food and Agricultural Policy data to demonstrate that overall agricultural pesticide use
(measured by pounds of active ingredient) increased between 1992 and 2000. The report
found that the use risky pesticides as defined by EPA’s risk classifications in agriculture
decreased, but it concluded that the evidence is insufficient to support the USDA’s claim
that this reduction is due to IPM. The report cited EPA officials who suggest that
changes in pesticide use could be due to EPA’s ban on some of the most toxic pesticides,
discontinuation of certain pesticides due to liability concerns, and lack of efficacy of
some risky pesticides due to pest resistance. This suggestion is supported by a survey of
United States IPM coordinators, the majority of whom felt that the decline in risky
pesticide use was due primarily to EPA regulatory action and business decisions by
pesticide companies to withdraw risky and ineffective pesticides from the market
(Ratcliffe and Gray, 2004). The EPA also suggested that the introduction of GM crops
has reduced the reliance on the most toxic pesticides, although the report does not
recognize that the adoption of GM crops can be a component of an IPM strategy (Kogan,
1998).
4
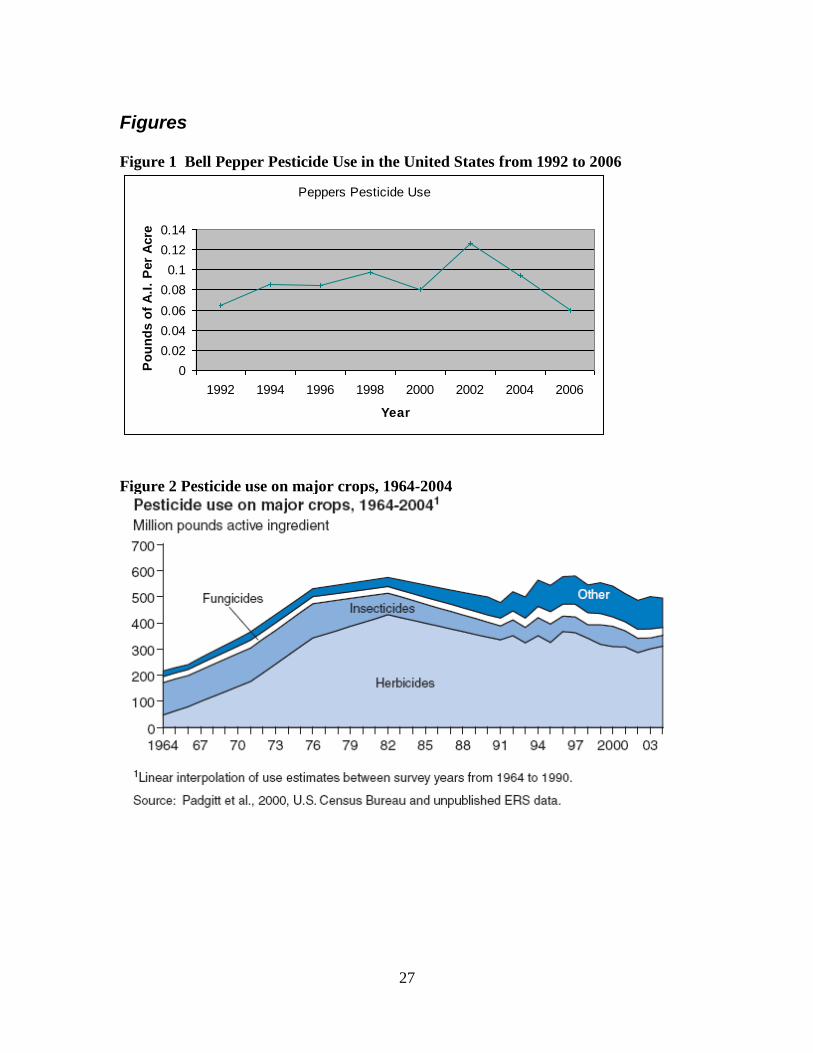
Pesticide use depends on a multitude of factors that change yearly and a simple
comparison across years may not accurately reflect true trends in pesticide use. For
example, USDA Agriculture Chemical Use Survey data on total pesticide use per acre in
bell peppers from 1992 to 2006 and plotted in Figure 1. The graph demonstrates that
there has been no distinguishable trend in pesticide use in bell peppers over that period.
Pesticide use on peppers in 1992 was higher than it was in 2006, but in 2002 and 2004
pesticide use was higher than it was in 1992. No inference can be made about a long-
term trend in pesticide use on bell peppers. This example is not unique to peppers but
applies to aggregate pesticide use as well (Figure 2) (Osteen and Livingston, 2006).
It is difficult to draw inferences about pesticide use from a simple comparison of
overall usage in two time periods. Pesticide use depends on a number of factors and
fluctuates heavily over time due to factors such as weather and pest pressures, and to
management practices such as the adoption of new technologies (Norton and Mullen,
1994).
National IPM leaders responded to the GAO report by developing a National
Roadmap for IPM. The Roadmap calls for documenting how pesticide use has changed
over time and for connecting these changes to IPM adoption. This paper responds to that
call by assessing the effects of IPM practices on farmer pesticide use for a number of
crops in the United States. It also examines the decline in risky pesticide use was due to
pesticide bans, pesticide company decisions to withdraw certain pesticides, and the
adoption of GM crops.
5
Motivation
Pesticides have helped the world meet growing food demand by increasing
agricultural productivity and reducing the effects of pest outbreaks. Unfortunately,
chemical pesticides also cause adverse environmental and health impacts. Starting with
Rachel Carson’s Silent Spring in 1962 that alerted the public to pesticides’ damaging
effect on birds through more recent studies that suggest the link between pesticides and
human maladies such as asthma and autism, pesticide risks have been scientifically
demonstrated and brought to the public’s attention (Kogan, 1998; Delaplane, Roberts, et
al., 2007; Zilberman, et al., 1991). Several researchers have calculated the costs of
banning or partially banning the use of some or all pesticides, and found that the burden
in terms of increased food costs and other welfare measures would be substantial
(Fernandez-Cornejo, et al., 1998; Zilberman, et al., 1991; Burton Jr and Martin, 1987) .
The positive and negative aspects of pesticide use create a tradeoff that all pesticide users
and pesticide regulators face when they make decisions about pesticides.
In recognition of this tradeoff, researchers since the 1970s have developed IPM
programs that specifically address this economic-environmental dilemma (Kogan, 1998;
Fitzner, 2002). IPM programs seek to account for economic benefits and environmental
costs by combining biological, cultural, and chemical pest control techniques to reduce
pest infestation to economically acceptable levels (Gianessi and Puffer, 1992). These
programs aim to improve both the economic well-being of adopters while also reducing
environmental and health risks. IPM was founded on the premise that many pesticide
users overspray chemical pesticides to the detriment of both the environment and their
own incomes (Fitzner, 2002). This dangerous overuse of pesticides has been commonly
found in agriculture, and other areas as well. It has led researchers to create IPM
6
programs for numerous commodities, locations, and target populations. For example,
recently-developed IPM programs have focused on low-income urban households who
face cock-roach infestations that lead to asthma attacks and school buildings where it was
found that overuse of pesticides could put children at risk (Spengler, et al., 2005).
Unfortunately, the impacts of these recent programs are difficult to quantify due to their
relative newness and the lack of non-agricultural pesticide use data. For these reasons,
this study focuses on agricultural pesticide use.
IPM Definitions
Despite the proliferation of IPM programs over the past thirty years, IPM
continues to be difficult to define very precisely (Royer, et al., 1999; Fitzner, 2002). IPM
programs typically involve multiple practices and can be adopted to varying degrees.
One way to describe IPM is as a “way of thinking.” Theodore Alter describes IPM this
way: “IPM is a holistic way of thinking that improves our ability to mitigate the negative
impacts of pests in agricultural production, horticulture, buildings and other situations,
while at the same time reducing costs and improving environmental quality.”
(Burlingame, 2002) (pg. 2) This description highlights the fact IPM involves an
economic-environmental tradeoff in managing pest problems. It also demonstrates that
IPM is a broad concept that is not easily quantifiable.
Researchers use broad categories of individual practices to help conceptualize
IPM. For example, some common groups of practices used in IPM programs are
prevention, avoidance, monitoring, and suppression practices (PAMS). Prevention
practices include water management practices and cleaning farm tools after fieldwork.
Avoidance practices include adjusting planting and harvest dates and adopting pest-
7
resistant crop varieties (including GM varieties) to minimize the likelihood of a pest
infestation. Monitoring practices include scouting for pests and keeping written records
to track pest populations. Suppression practices include using biological pesticides,
alternating pesticides with different mode of actions (MOA), and using other non-
chemical methods such as introducing beneficial insects. Another classification separates
IPM practices into biological, cultural, and pesticide efficiency practices (Fernandez-
Cornejo and Ferraioli, 1999). In this classification system, biological practices include
using natural enemies, resistant varieties and biological pesticides, cultural practices
include pruning and tillage methods, and pesticide-efficiency practices include scouting
pest populations and using economic thresholds. The exact practices recommended by
specific IPM programs depend on each practices’ effectiveness which differs between
crops and locations. These broad categories help better define IPM, but they do not solve
all the problems related to measuring IPM adoption. The research presented in this paper
uses multiple definitions of IPM in an effort to circumvent some of these problems.
Previous Literature
Many national and state resources have been used to develop IPM programs and
support IPM adoption, but as the GAO report documents, national effects of IPM on the
environment, human health, and income remain uncertain. However, many localized
impact assessments of IPM have reported positive environmental and health benefits.
Norton and Mullen (1994) review 61 economic evaluations of IPM programs in the
United States and found that IPM adoption leads to “generally lower pesticide use,
production cost, and risk, and higher net returns to producers” (Norton and Mullen,
1994). Fernandez-Cornejo and Rakshit (2007) examine more recent IPM impact studies,
8
both national and international, and reach similar conclusions. The GAO report itself
discusses the success of a West Coast apple and pear IPM program and a Wisconsin
potato IPM program at reducing risky pesticide use, but concludes these studies do not
provide sufficient evidence to suggest that IPM has made a significant impact at the
national level. Some individual IPM studies have documented no change or a slight
increase in pesticide use, but the majority of studies document a positive effect of IPM on
the environment through reduced pesticide use. The challenge is to aggregate these
studies to determine the national level impacts of IPM on the environment, health, and
economic wellbeing.
There is circumstantial evidence that IPM has been successful at meeting these
goals. The widespread growth in IPM adoption, both domestically and internationally
over the last thirty years, suggests that IPM has been successful at the very least in
convincing adopters and policymakers that it is beneficial to the environment and to
adopters. One recent report reviews pesticide reduction alternatives and recommends to
the Natural Resources Conservation Service (NRCS) that IPM programs be further
developed and given additional resources (Hamerschlag, 2007). The report concludes
“Integrated pest management, or IPM, can provide effective crop protection while
minimizing risk to health and the environment. These smarter, prevention-based pest
control practices can avoid resistance problems that occur with traditional pesticides and
may reduce overall costs by lowering chemical inputs, reducing liability and worker
injuries, and improving public relations (Hamerschlag, 2007).” The GAO report also
mentions that several food processors encourage their growers to use IPM practices
because it reduces processing costs. The anecdotal nature of most of the evidence
9
supporting IPM does not satisfy the demand by the GAO or national IPM leaders for
national impact assessments on how IPM has affected pesticide use in the United States.
As Norton and Mullen (1994) state, “These (aggregate) assessments are needed for
informed choices on policies and public investments affecting IPM.”
There have been attempts to assess the aggregate benefits of IPM. Resosudarmo
(2001) uses a general equilibrium model to determine the economic impacts of IPM in
Indonesia. He concludes that IPM has created significant and widespread increases in
incomes and has improved health for Indonesians. Others have used general equilibrium
models to determine the impacts of other technologies such as GM rice nationally and
internationally (Hareau, et al., 2006). General equilibrium models can be useful for
national impact assessments, but their data requirements and strong assumptions make
them difficult to implement in an economy as large and interdependent as the United
States (Resosudarmo, 2001). These models also do not address pesticide usage directly,
but instead present monetary benefits, making it difficult to address the specific issue of
actual pesticide use.
Fernandez-Cornejo (1996) uses another technique to examine the impact of IPM
on pesticide use and farm profits. He develops and applies a model that accounts for the
self-selectivity involved in the IPM adoption decision, and the simultaneity between IPM
adoption and the farmers’ profit maximization problem when deciding on the amount of
pesticides to use on the farm. Fernandez-Cornejo (1996; 1998) and Fernandez-Cornejo
and Ferraioli (1999) applies this technique to different crops across the United States to
determine the impact of IPM on pesticide use in specific crops. These studies separately
examine fresh tomatoes, grapes, and peaches, and account for farmers across the United
10
States. They estimate of the national impacts of the crop specific IPM programs in the
United States. The major limitation of these studies is that they only analyze the impacts
for one growing season and one commodity. This limitation is due mostly to data
constraints they faced at the time they were conducting their studies (Fernandez-Cornejo
and Ferraioli, 1999). As mentioned earlier, it is problematic to draw inferences about
pesticide use without considering multiple years and multiple crops. Results from
Fernandez-Cornejo (1996; 1998) and Fernandez-Cornejo and Ferraioli (1999) suggest
that IPM practices have mixed effects on the environment and are dependent on the
specific crop being analyzed. For example Fernandez-Cornejo (1996) concludes that
IPM adoption reduces insecticide and fungicide use in fresh tomatoes, but increases
overall pesticide use and the toxicity of pesticides used in peach production. These
results are only for a single growing season, and further study is needed to determine if
these results hold over time. Fernandez-Cornejo’s model also allowed them to estimate
the effect of IPM adoption on profits, but their results were mixed as profits were slightly
higher for grape and tomato growers but there was no significant effect on peach
growers. In conclusion, studies that have measured the effectiveness of IPM and specific
IPM groupings at reducing pesticide use have yielded mixed results.
The major limitation that prevented Fernandez-Cornejo (1996; 1998) and
Fernandez-Cornejo and Ferraoli (1999) from doing time series analysis was the lack of a
sufficient data set. These studies use NASS agricultural chemical usage surveys, but
these surveys sample different crops and different states in different years making it
difficult to get an accurate and consistent time series of pesticide use in United States
agriculture. The agricultural chemical usage surveys are part of the USDA Pesticide Data
11
Program, but the main focus is on pesticide residues. Its goal is to “enhance the quality
of information on pesticide residues in food” and not to determine the effect of IPM or
other farmer practices have on pesticide use (2007). Other agencies like Natural
Resource Conservation Services (NRCS) and United States Geological Survey (USGS)
collect or compile pesticide data, but most of these data focus on pesticide use as it
relates to the specific topics the agencies are researching and do not consider farm
practices. These data also begin later than the NASS surveys, and therefore do not have
as many observations. Thelin and Gianessi (2000) document the difficulties in
compiling pesticide use data for the USGS project. Unfortunately, many sources of data
on pesticide use fail to collect data on IPM practices, making it impossible to determine
the effects of IPM on pesticide use.
The Agricultural Resource Management (ARMS) surveys do collect both IPM
practice and pesticide use data. The ARMS surveys began in 1996 for the purpose of
conducting a national accounting of farmers’ resource usage across the country. The
ARMS survey also collects information on farmers’ finances, production practices, use of
chemicals, and other resources. ARMS surveys have collected information on more than
15 crops.1 ARMS surveys do not reach every agricultural pesticide user, but they sample
agricultural pesticide users in a manner that is representative of the whole population. An
ARMS survey is conducted in three phases. The first screening phase (Phase 1) surveys
potential respondents on the crops grown and types of livestock present on the farm. The
second phase (Phase II) elicits information on production practices and enterprise
1 ARMS surveys also collect information on some livestock, but these livestock surveys are not included in
this analysis even though some IPM practices and pesticides are used on livestock.
12
management practices. The third phase (Phase III) collects financial information from
the farm.
It is important to note that the ARMS surveys are designed and written
specifically for the crop and year that is being surveyed. In other words, individual
ARMS surveys do differ between crops and years. ARMS surveys have sampled corn,
soybeans, cotton, winter, spring, and durum wheat, fall potatoes, rice, sorghum, flue-
cured tobacco, sugarbeets, peanuts, sunflowers, oats, and barley in different years. These
surveys have been used in other studies to examine a number of different topics. For
example Daberkow et al. (2003) studied the adoption of precision agriculture. Falck-
Zepeda and Traxler (2000) estimated the rents generated by Bt cotton and herbicide
resistant soybeans. Marra et al. (2002) used the data set to analyze whether GM crops do
lead to lower pesticide use.
These studies concentrated on particular crops or a single year and did not use the
complete set of ARMS surveys that are currently available. This study examines pesticide
use at a more aggregated level. Therefore most of the data used in the first part of the
study of this study are taken from the Crop Production Practices Report (CPP) of ARMS.
This data set does not include the financial information collected in Phase III but
combines all of the practice data for all of the crops surveyed into a single data set. The
CPP makes it possible to compare practices of farmers across surveys without directly
addressing the differences between surveys across years and crops. By not including
Phase III information, some specific farmer characteristics cannot be included in the
analysis conducted in this report. Also the CPP does not include data on actual pesticide
usage due to the overwhelming number of different pesticides used on different crops
13
combined with the changes in pesticide brands and active ingredients over the years.
Because of this situation, pesticide cost per acre was used in this study as a proxy for
pesticide use. Admittedly, this proxy might not be perfectly correlated with risky
pesticide use, as some less risky pesticides (as defined by the EPA) might be more
expensive, but it does provide a fair picture of the overall chemical pesticide use by
farmers. The measure should correlate with general pesticide use, and be useful in
determining if IPM and other factors affect pesticide use.
To explicitly recognize some of the limitations imposed by only using the CPP
data, a more complete analysis using specific cotton data from 1997 and 2003 was also
conducted. This analysis included information from both Phase II and Phase III of the
ARMS surveys and provides more direct comparisons to previous single crop studies.
Also by examining cotton, the analysis can separate the effects of IPM and the adoption
of genetically modified crops on pesticide use. This issue has been examined in previous
studies making our results directly comparable to these studies.
Corn data were also analyzed to enable the examination of the effects of specific
IPM practices, essentially an unbundling of IPM. Corn was chosen here, because the
data offered more IPM practices to analyze.
Model
Equation 1
𝐏𝐞𝐬𝐭𝐄𝐱𝐩𝐞𝐧𝐝 = 𝛂 + 𝛃 𝐈𝐏𝐌 + 𝛄 𝐒𝐩𝐚𝐭𝐢𝐚𝐥,𝐏𝐞𝐬𝐭 𝐏𝐫𝐞𝐬𝐬𝐮𝐫𝐞,𝐚𝐧𝐝 𝐓𝐢𝐦𝐞 𝐃𝐮𝐦𝐦𝐢𝐞𝐬 + 𝛜
The basic model used in this study is represented in equation 1. PestExpend
represents pesticide expenditures per acre, α is an intercept term, IPM represents the
adoption of IPM strategies, β represents the impacts that IPM strategies have on chemical
14
spending, and γ are the effects of Spatial, Pest Pressure and Time Dummies. The
following paragraphs and tables report the results of applying this model using different
definitions of IPM and using different IPM practices. The basic model does not include
any farmer-specific characteristics because the CPP data that were used lacked the Phase
III ARMS data. It should be noted that some proxies for farmer characteristics such as
total acres on the farm, whether or not the farmer adopted conservation practices, and
irrigation use, were also used in preliminary regressions. These variables were rarely
statistically significant, but also reduced the number of observations and crops surveyed
due to the fact that the same questions were not used for every crop in every year. The
reduction in crops inhibited achievement of the study’s primary goal of conducting an
aggregate assessment of IPM’s effect on pesticide use. Therefore these variables were
not included in the final regressions. Results by crop reported later in the study explicitly
account for some of the relevant Phase III data.
CPP Results
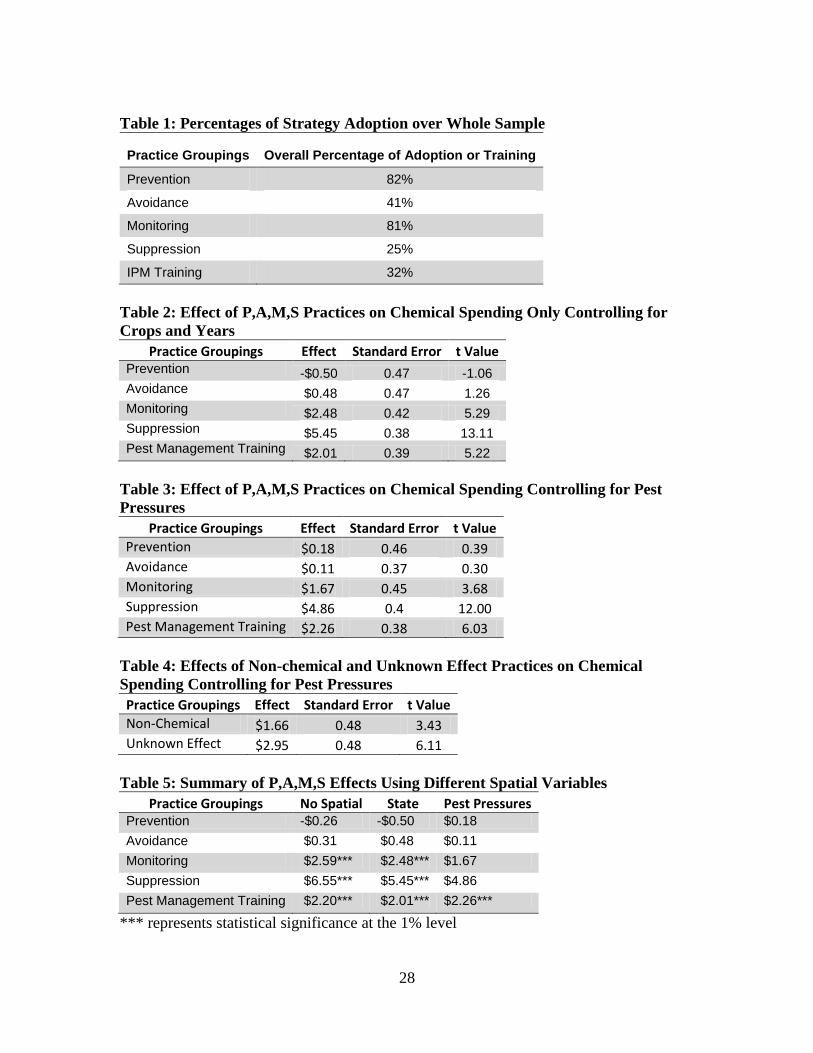
The percentage of farmers in the ARMS sample who adopted a single practice in
a P,A,M,S strategy, and the percentage who had attended a pest management training
class within the last year are reported in Table 1. For example, any farmer who answered
that they “scouted,” no matter what they scouted for, was considered to adopt monitoring
strategies. This concept of one practice being equal to IPM adoption is used throughout
the paper unless another definition is noted. All practices were not reported in the
survey for every crop and wording of questions has changed as the ARMS survey and
program has progressed. This lack of consistency makes comparing specific practices or
developing a more concrete definition of IPM adoption difficult with CPP. The adoption
15
of a single practice equaling the adoption of IPM represents a broad definition of IPM
adoption, and later specifications will narrow that definition by combining and redefining
strategies. The table does suggest that the adoption of prevention and monitoring
strategies are prevalent on most American farms.
A preliminary regression that did not control for any fixed environmental factors
except for the crop and whether the crop was grown after 2000 grown led to some
unexpected results. Choosing the year 2000 roughly split the data in half and was an
arbitrary first step to include time in the analysis. Practices that were found to
significantly increased chemical spending per acre were monitoring ($2.59), suppression
($6.55), and pest management training ($2.20). This regression demonstrated the
importance of controlling for crops and time. Most of the crops resulted in different
chemical spending than corn, and farmers spent less on chemicals (-$2.03) after 2000.
These results suggest that better controls for issues such as pest pressures could
significantly change the results.
A second set of regression results are reported in Table 2. These results
separately control for the crop grown, the state where the crop was grown, and the
specific year that the crop was grown. Prevention and avoidance strategies were found to
have a non-significant effect on chemical spending. Monitoring and suppression
practices significantly increased chemical spending, as did participating in a pest
management training program in the last year. Crop, state, and time specific effects were
also significant. Half of the crops differed significantly from corn, half of the states
differed significantly than Iowa, and in six years farmers spent significantly less than in
16
1996. Even with the larger number of control variables, monitoring ($2.48) and
suppression ($5.45) practices had a significant positive effect on chemical spending.
A third model controlled for environmental factors by creating a variable (pest
pressure) that separated each state by crop and year. For example, a variable was created
that represented Iowa corn farmers in 1996, Ohio soybean farmers in 1998, another
variable for Iowa corn farmers in 2000, and another variable for Ohio soybean farmers in
2001. These variables combined all of the information collected in the second model, but
allowed for a more focused analysis on the effect of a single location in a given year on
chemical spending. This pest pressure variable was intended to identify localized pest
pressure situations that could cause a spike in pesticide use in a given year. This variable
is not perfect, because some states, especially larger states, face different pressures within
the state. The variable should also help control for some farm characteristic, because it is
expected that farmers of the same crop in the same state (especially geographically
smaller states) have similar characteristics, especially with respect to prices received and
expected for their crop and other input costs.
The results from this specification are presented in Table 3. The effects of
monitoring ($1.67) and suppression ($4.86) decreased, but the strategies still increased
chemical spending overall. Also, over fifty percent (129 out of 238) of the pest pressure
variables were significant at the 5% level. This result indicates that pesticide use is not
strictly determined by use practices but also by environmental factors.
A fourth model was created that separated individual practices into those that
should clearly reduce chemical use (non-chemical) and those practices that had an
unknown effect on chemical usage. This specification was designed to separate some of
17
the ambiguous effects that IPM practices such as scouting have on pesticide use.
Scouting can lead to either an increase or a decrease in pesticide use depending on the
pests and pest numbers identified by the scouting. This fourth model retained the pest
pressure variables of the third model, and the results are reported in Table 4. These
results also yielded unexpected results as even those farmers who adopted practices that
should clearly reduce chemical use spent more on chemicals than those who did not.
A fifth model analyzed the effect of adopting all of the P,A,M,S strategies. This
definition represents a narrow definition of IPM adoption as it requires the farmer to
adopt at least one IPM practice in each of the separate P,A,M,S strategies, but the effect
($4.12) of adopting all strategies also increased chemical spending and was statistically
significant. Other models that included combinations of P,A,M,S strategies led to
similar results. The general conclusion from all of these specifications was that IPM
adoption and pest management training lead to slightly greater chemical spending on
average.2 Table 5 summarizes the different effects that P,A,M,S strategies have on
chemical spending across the different specifications controlling for different spatial
variables. The implications of these conclusions will be discussed later.
These results suggest that IPM might actually increase spending on pesticides.
Chemical Use on Cotton
As discussed before, most previous studies have focused on a single crop during a
single year. The benefit of this type of analysis is that it allows the researcher to control
for more farm and farmer-specific characteristics. For example, Fernandez-Cornejo
(1996) controlled for a number of farmer-specific variables such as farm size, farmer
2 These results were robust to the removal of outliers.
18
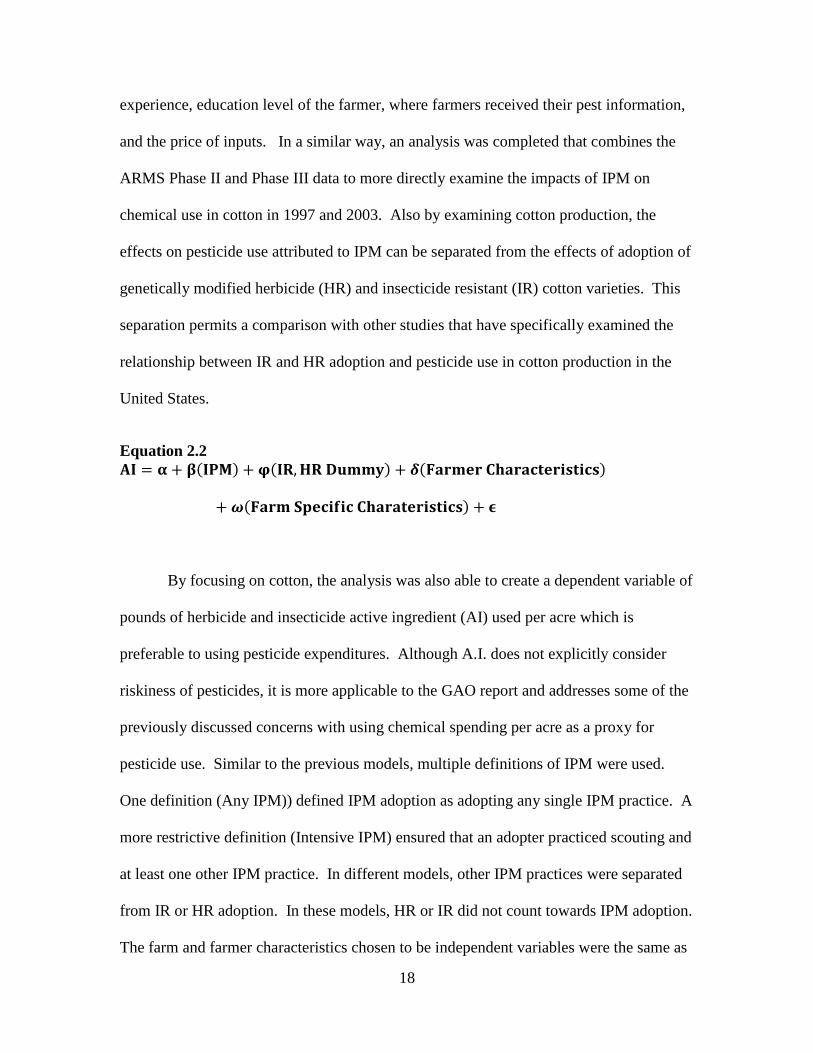
experience, education level of the farmer, where farmers received their pest information,
and the price of inputs. In a similar way, an analysis was completed that combines the
ARMS Phase II and Phase III data to more directly examine the impacts of IPM on
chemical use in cotton in 1997 and 2003. Also by examining cotton production, the
effects on pesticide use attributed to IPM can be separated from the effects of adoption of
genetically modified herbicide (HR) and insecticide resistant (IR) cotton varieties. This
separation permits a comparison with other studies that have specifically examined the
relationship between IR and HR adoption and pesticide use in cotton production in the
United States.
Equation 2.2
𝐀𝐈 = 𝛂 + 𝛃 𝐈𝐏𝐌 + 𝛗 𝐈𝐑, 𝐇𝐑 𝐃𝐮𝐦𝐦𝐲 + 𝜹 𝐅𝐚𝐫𝐦𝐞𝐫 𝐂𝐡𝐚𝐫𝐚𝐜𝐭𝐞𝐫𝐢𝐬𝐭𝐢𝐜𝐬
+ 𝝎 𝐅𝐚𝐫𝐦 𝐒𝐩𝐞𝐜𝐢𝐟𝐢𝐜 𝐂𝐡𝐚𝐫𝐚𝐭𝐞𝐫𝐢𝐬𝐭𝐢𝐜𝐬 + 𝛜
By focusing on cotton, the analysis was also able to create a dependent variable of
pounds of herbicide and insecticide active ingredient (AI) used per acre which is
preferable to using pesticide expenditures. Although A.I. does not explicitly consider
riskiness of pesticides, it is more applicable to the GAO report and addresses some of the
previously discussed concerns with using chemical spending per acre as a proxy for
pesticide use. Similar to the previous models, multiple definitions of IPM were used.
One definition (Any IPM)) defined IPM adoption as adopting any single IPM practice. A
more restrictive definition (Intensive IPM) ensured that an adopter practiced scouting and
at least one other IPM practice. In different models, other IPM practices were separated
from IR or HR adoption. In these models, HR or IR did not count towards IPM adoption.
The farm and farmer characteristics chosen to be independent variables were the same as
19
those used in Fernandez-Cornejo (1996) and included farm size, years of farming
experience, farm income, price received for cotton, farm tenure, type of cotton grown,
cost of pesticides, origin of pesticide information, and if the farmer had received IPM
training in the last two years. The issue of selection bias where the IPM adopters are
systematically different than non-adopters and can bias results is also explicitly
considered by Fernadez-Cornejo (1996) (1998), but statistical tests conducted on this data
determined that selection bias was not significant in any of the following estimated
pesticide demand equations, and therefore only the reduced form results are reported.
This analysis also employs different spatial variables. The models used regional
dummies as defined by ERS, state dummies, and zip code dummies. These spatial
variables, the analysis helped control for specific pest pressures that affect certain farms
as well as other unobserved variables that are associated with location.
Previous studies that have examined pesticide use in cotton have yielded
somewhat contradictory results. Marra et al. (2002) found some evidence that the
introduction of Bt cotton might have reduced pesticide use. Benbrook (2002) suggested
that the benefits of GM cotton in terms of reduced pesticide usage might have been
overstated, and suggested that further study and technologies were needed to ensure that
pesticide use is actually reduced. A recent study suggested that chemical use in cotton is
somewhat sporadic and might have increased over the past few years (Fernandez-
Cornejo, et al., 2009).
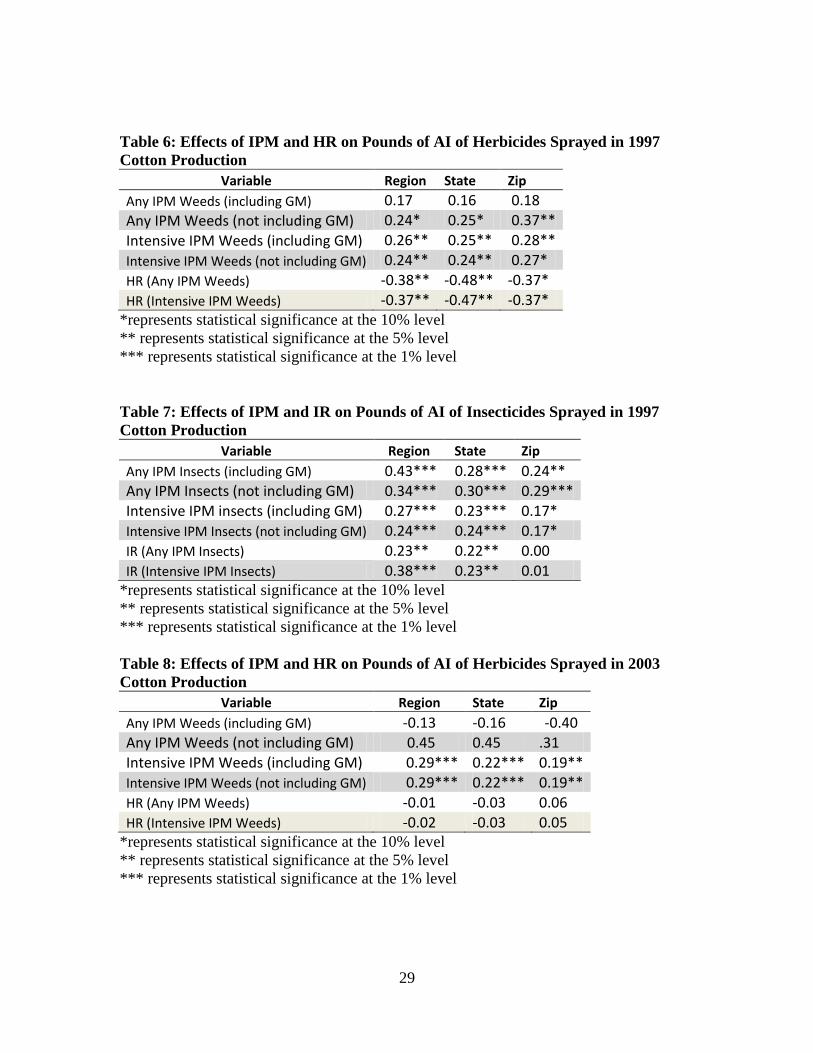
The effects that IPM and HR and IR have on herbicide and insecticide use are
reported in Table 6-9. For the 1997 regressions, there were 688 observations, and for the
2003 regressions there were 1230 observations. In most models, the farm and farmer
20
characteristics had the expected signs based on economic theory and previous empirical
studies, but the statistical significance of these variables varied depending on the year,
spatial variables, and IPM definition used. IPM training rarely had a significant effect on
pesticide use. Also those farmers who received their pesticide information from
extension professionals tended to use more chemicals in some models, but in most
models, this effect was not statistically significant. The adjusted R-squared of the models
varied from 0.10 to 0.40. The models that included state variables tended to have slightly
better fit statistics than those models that included zip code variables. As with the CPP
regressions, many of the spatial dummies were significant and suggested that pesticide
use differed between locations.
These cotton results confirm the aggregate results in the sense that IPM seems to
be associated with increased pesticide use. But these results also question whether some
IPM practices, in this particular case, the adoption of GM technologies might actually
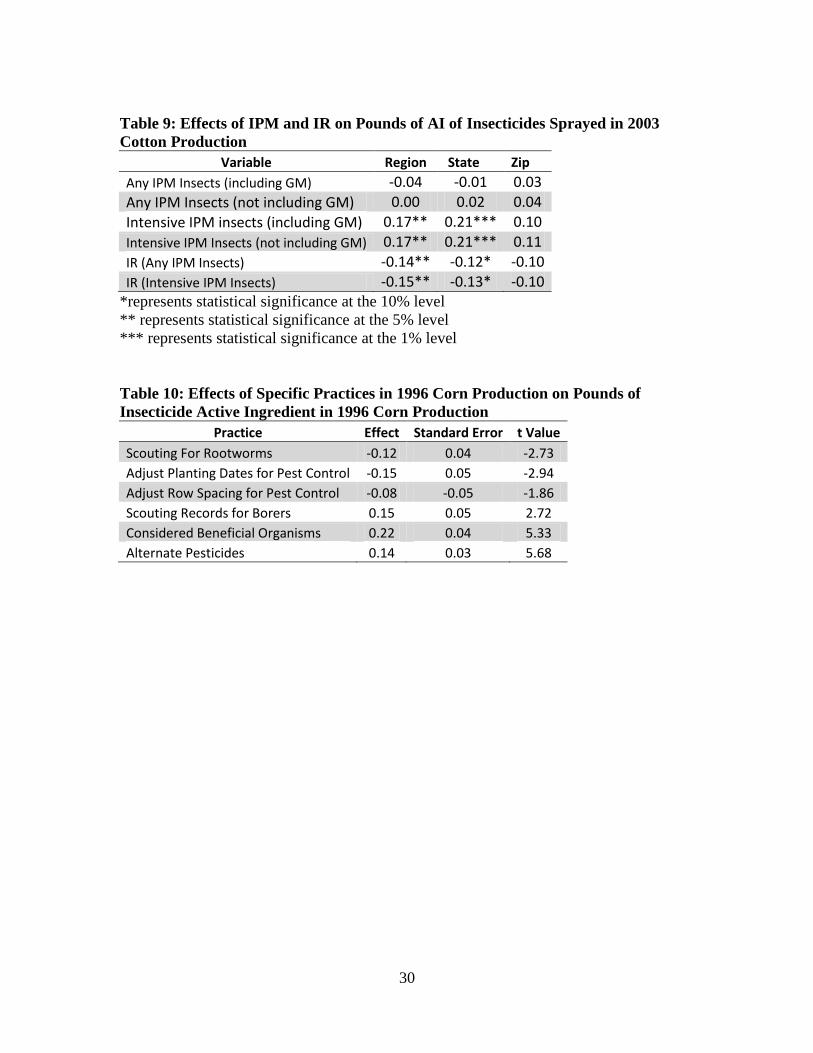
decrease pesticide use. In 1997, the adoption of HR varieties significantly reduced the
herbicide pounds of active ingredient sprayed on cotton, and in 2003 in the models where
region and states were controlled for, adopting IR significantly reduced insecticide
pounds of active ingredient sprayed on cotton. Neither HR nor IR adopters sprayed less
pesticides in both years, but neither demonstrated the statistically significant positive
signs associated with the IPM adoption definitions either. By focusing on measures of
IPM adoption that bundle multiple practices might be generating results that do not
properly assess the importance of some specific practices that actually decrease pesticide
use. Also the broad definitions of IPM increased pesticide use more than the restrictive
21
definitions. The next section addresses these issues by examining specific practices in
corn production.
Chemical Use on Corn
The aggregate analysis of factors affecting pesticide use separates IPM into broad
categories that do not allow for the possibility that specific practices may have different
effects on pesticide use. As in the case of cotton, aggregate analyses that uses broad IPM
categories also might lead to the bundled factors canceling out the effects of each other,
as specific practices in the bundles increase pesticide use while others decrease pesticide
use. The result might be an under-estimation of the significance of certain IPM practices
that do reduce pesticide use. For example, the relatively small magnitude of the
significant coefficients and the lack of significance of prevention and avoidance activities
in the CPP regressions could be explained by some practices within the profile increasing
pesticide use and other practices reducing pesticide use. For example in the cotton
estimates, when HR is bundled together with other IPM practices, the pesticide
decreasing nature of HR cannot be seen.
Equation 2.3
𝐀𝐈 = 𝛂 + 𝛃 𝐈𝐏𝐌 + 𝝎 𝐅𝐚𝐫𝐦 𝐒𝐩𝐞𝐜𝐢𝐟𝐢𝐜 𝐂𝐡𝐚𝐫𝐚𝐭𝐞𝐫𝐢𝐬𝐭𝐢𝐜𝐬 + 𝛄 𝐒𝐭𝐚𝐭𝐞 + 𝛜
To better address this bundling issue, other models using only corn data were run.
These models allowed for specific practices (IPM) to be examined, and controlled for the
state where the corn was grown. Also, some farm specific characteristics such as
irrigation practices and the farm’s conservation practices were added to the model. Like
22
with cotton, by focusing only on 1996 corn data, the analysis was able to create another
dependent variable of pounds of herbicide and insecticide active ingredient (AI) used per
acre.
The results suggested that some practices increased chemical spending and
pounds of active ingredient applied while other practices decreased chemical spending
and pounds of active ingredient applied. The farmer characteristics were not statistically
significant in explaining the pesticide use. The significant results are presented in Table
10. Some practices, even monitoring practices such as scouting for rootworms and
prevention practices such as adjusting planting dates and row spacing, reduced pesticide
use. These results highlight that combining practices might not be telling the full story of
the effects that IPM related practices are having on pesticide use.
A similar type of analysis was done with the ARMS corn data from 2001, except
chemical spending per acre was used as the dependent variable. The results from 1996
corn production differed from the results from 2001 corn production. For example, in
2001 systematic scouting decreased chemical spending while in 1996 it had an increasing
effect. This contrast reinforced the importance of time and environmental factors on
pesticide use and reiterated the dangers in just comparing two years worth of pesticide
use data.
Examining specific practices illuminated the complexity entailed in evaluating an
IPM program’s effect on pesticide use. Farmers face numerous choices concerning how
to use pesticides. Some of these choices are controllable such as IPM practices, but other
factors are uncontrollable such as weather and pest infestations in a given year.
Aggregate analysis allows us to get an unfocused picture of how IPM affects pesticide
23
use, but it does not give insights into how to improve IPM programs or other ways to
reduce pesticide use. By examining specific practices, IPM practitioners can get a better
idea of what IPM practices actually decrease pesticide use and which practices increase
pesticide use.
Limitations of this study
The methods of this study have a number of limitations. First, multiple
definitions of IPM were used in this study. Second, individual IPM programs make
specific recommendations while the ARMS surveys were created to take a national
sample of producers. The ARMS surveys were not specifically designed to study the
impacts of IPM, and therefore, do not have the detail of localized IPM impact practices.
As the analysis of corn and cotton suggests, the significance of a particular practice in a
specific location can lead to significant reductions. By examining aggregate relationships
and using the broad IPM definitions necessary to estimate these relationships, it is
difficult to determine the specific practices that are important in determining IPM’s effect
on pesticide use. The underlying difficulty in an aggregate analysis is that IPM programs
are unique, and it is hard to control for this uniqueness in an aggregated study.
It also must be mentioned that analyzing national “all-inclusive” surveys is a time
consuming process that involves a number of constraints. The surveys offer a wealth of
data, but some of these data are not relevant to IPM impact assessment. As with all
empirical studies, there are questions about which data to include or exclude, and which
data best approximate the suggested theoretical variables. With data as comprehensive as
the ARMS data, these questions and the number of different possible variables can
become almost overwhelming.
24
Also, the definitions used in this analysis cannot account for large IPM related
programs such as the boll weevil eradication program (BWEP) and soybean rust
monitoring program. Participants in these programs could not be separated in order to
determine the effect that these programs have on pesticide use. Research suggests these
programs could have a large economic and environmental impact (McCorkle, et al.,
2008; Roberts, et al., 2006). These large-scale programs have benefits for IPM adopters
and non-IPM adopters that are not being directly accounted for in this analysis. Also the
BWEP goal of eradication might initially lead to increased pesticide use, but over the
long-term, the program could lead to significant reductions in pesticide use as the boll
weevil is eradicated.
The ARMS data used in this paper do not include fruit and vegetable pesticide
use. Although these fruit and vegetable crops account for less than 25% of agricultural
pesticide use in the United States, they are important crops for which IPM has made
inroads in reducing pesticide use (Fernandez-Cornejo, et al., 2009). By not including
these crops, some of IPM’s ability to reduce pesticide use might be understated.
Conclusions
This paper does not directly consider all the benefits of IPM, but IPM has
multiple objectives and is not limited to reduced pesticide use (Kogan, 1998). The only
environmental factor examined in this paper is pesticide use. IPM programs have been
instrumental in educating farmers about proper pesticide use, and the benefits from
pesticide applicators having a greater awareness of the dangers inherent in pesticide use
has probably helped reduce pesticide application accidents that can cause health
complications and death. Studying IPM’s effect on the awareness of pesticide risks and
25
other environmental measures such as environmental indices could be examined in future
research.
The results presented in this paper suggest that adoption of some IPM strategies
lead to increased pesticide use on average. This result is robust to a number of different
IPM definitions and specifications. Some individual practices for particular crops
certainly decrease pesticide use, but using national data and multiple definitions for IPM
adoption, the models presented in this paper suggests that IPM adoption actually
increases chemical spending and pounds of active ingredient sprayed on U.S. farms.
These results suggest that IPM practices may have been more directed at increasing
farmer profits than not reducing pesticide use. Identifying the practices that increase
profits but do not actually decrease pesticide use, and directing research to practices
focused on reducing pesticide use should be part of the future of IPM research. This
paper provides a first step in understanding the long-term relationship between IPM
practices and pesticide use.
IPM coordinators have expressed doubt in IPM’s ability to decrease pesticide use,
and a number of individual studies have reported that IPM has mixed effects on pesticide
use. This being said, there is other evidence that suggests that individual IPM programs
have reduced pesticide use in the United States at the local level. The GAO report
mentions some of these, but there are numerous other examples in the literature. The
more aggregated results reported in this paper may be an example of Simpson’s Paradox
where aggregate trends overwhelm important local trends. In other words, this analysis
might be underselling important IPM programs that do decrease pesticide use.
Agricultural pesticide use in U.S. farming is dependent on a number of farmer-specific
26
practices and a number of environmental constraints. Individual farmers face different
pest pressures, climates, and other uncontrollable environmental factors. The results of
this research suggest that these uncontrollable factors explain a significant portion of
pesticide use. They may explain a greater proportion of pesticide use than do farmer
practices. Pesticide use in the United States is dependent on issues not completely
controlled by the farmer. Increased pest pressure and other environmental factors can
lead to greater pesticide use, and IPM practices designed to meet the local needs of
farmers can certainly help to mitigate both the economic and environmental damage done
by this increased pressure.
27
Figures
Figure 1 Bell Pepper Pesticide Use in the United States from 1992 to 2006
Peppers Pesticide Use
0
0.02
0.04
0.06
0.08
0.1
0.12
0.14
1992 1994 1996 1998 2000 2002 2004 2006
Year
Po
un
ds o
f A
.I.
Per
Acre
Figure 2 Pesticide use on major crops, 1964-2004
28
Table 1: Percentages of Strategy Adoption over Whole Sample
Practice Groupings Overall Percentage of Adoption or Training
Prevention 82%
Avoidance 41%
Monitoring 81%
Suppression 25%
IPM Training 32%
Table 2: Effect of P,A,M,S Practices on Chemical Spending Only Controlling for
Crops and Years
Practice Groupings Effect Standard Error t Value Prevention -$0.50 0.47 -1.06 Avoidance $0.48 0.47 1.26 Monitoring $2.48 0.42 5.29 Suppression $5.45 0.38 13.11 Pest Management Training $2.01 0.39 5.22
Table 3: Effect of P,A,M,S Practices on Chemical Spending Controlling for Pest
Pressures
Practice Groupings Effect Standard Error t Value Prevention $0.18 0.46 0.39 Avoidance $0.11 0.37 0.30 Monitoring $1.67 0.45 3.68 Suppression $4.86 0.4 12.00 Pest Management Training $2.26 0.38 6.03
Table 4: Effects of Non-chemical and Unknown Effect Practices on Chemical
Spending Controlling for Pest Pressures
Practice Groupings Effect Standard Error t Value Non-Chemical $1.66 0.48 3.43 Unknown Effect $2.95 0.48 6.11
Table 5: Summary of P,A,M,S Effects Using Different Spatial Variables
Practice Groupings No Spatial State Pest Pressures Prevention -$0.26 -$0.50 $0.18
Avoidance $0.31 $0.48 $0.11
Monitoring $2.59*** $2.48*** $1.67
Suppression $6.55*** $5.45*** $4.86
Pest Management Training $2.20*** $2.01*** $2.26***
*** represents statistical significance at the 1% level
29
Table 6: Effects of IPM and HR on Pounds of AI of Herbicides Sprayed in 1997
Cotton Production
Variable Region State Zip
Any IPM Weeds (including GM) 0.17 0.16 0.18
Any IPM Weeds (not including GM) 0.24* 0.25* 0.37**
Intensive IPM Weeds (including GM) 0.26** 0.25** 0.28**
Intensive IPM Weeds (not including GM) 0.24** 0.24** 0.27*
HR (Any IPM Weeds) -0.38** -0.48** -0.37*
HR (Intensive IPM Weeds) -0.37** -0.47** -0.37* *represents statistical significance at the 10% level
** represents statistical significance at the 5% level
*** represents statistical significance at the 1% level
Table 7: Effects of IPM and IR on Pounds of AI of Insecticides Sprayed in 1997
Cotton Production
Variable Region State Zip
Any IPM Insects (including GM) 0.43*** 0.28*** 0.24** Any IPM Insects (not including GM) 0.34*** 0.30*** 0.29*** Intensive IPM insects (including GM) 0.27*** 0.23*** 0.17*
Intensive IPM Insects (not including GM) 0.24*** 0.24*** 0.17*
IR (Any IPM Insects) 0.23** 0.22** 0.00
IR (Intensive IPM Insects) 0.38*** 0.23** 0.01 *represents statistical significance at the 10% level
** represents statistical significance at the 5% level
*** represents statistical significance at the 1% level
Table 8: Effects of IPM and HR on Pounds of AI of Herbicides Sprayed in 2003
Cotton Production
Variable Region State Zip
Any IPM Weeds (including GM) -0.13 -0.16 -0.40 Any IPM Weeds (not including GM) 0.45 0.45 .31 Intensive IPM Weeds (including GM) 0.29*** 0.22*** 0.19**
Intensive IPM Weeds (not including GM) 0.29*** 0.22*** 0.19**
HR (Any IPM Weeds) -0.01 -0.03 0.06
HR (Intensive IPM Weeds) -0.02 -0.03 0.05 *represents statistical significance at the 10% level
** represents statistical significance at the 5% level
*** represents statistical significance at the 1% level
30
Table 9: Effects of IPM and IR on Pounds of AI of Insecticides Sprayed in 2003
Cotton Production
Variable Region State Zip
Any IPM Insects (including GM) -0.04 -0.01 0.03
Any IPM Insects (not including GM) 0.00 0.02 0.04
Intensive IPM insects (including GM) 0.17** 0.21*** 0.10
Intensive IPM Insects (not including GM) 0.17** 0.21*** 0.11
IR (Any IPM Insects) -0.14** -0.12* -0.10
IR (Intensive IPM Insects) -0.15** -0.13* -0.10 *represents statistical significance at the 10% level
** represents statistical significance at the 5% level
*** represents statistical significance at the 1% level
Table 10: Effects of Specific Practices in 1996 Corn Production on Pounds of
Insecticide Active Ingredient in 1996 Corn Production
Practice Effect Standard Error t Value
Scouting For Rootworms -0.12 0.04 -2.73 Adjust Planting Dates for Pest Control -0.15 0.05 -2.94 Adjust Row Spacing for Pest Control -0.08 -0.05 -1.86 Scouting Records for Borers 0.15 0.05 2.72 Considered Beneficial Organisms 0.22 0.04 5.33 Alternate Pesticides 0.14 0.03 5.68
31
References
Benbrook, C.M. "Impacts of Genetically Engineered Crops on Pesticide Use in the United
States: The First Eight Years" BioTech InfoNet, Technical Paper Number 6. November
(2006).
Burlingame, S. J. "Integrated Pest Management: Teaching teachers is key." Penn State Outreach,
Spring 4, no. 2(2002). Accessed April 19 2010.
http://www.outreach.psu.edu/news/magazine/Vol_4.2/ipm.html
Burton Jr, R. O., and M. A. Martin. "Restrictions on Herbicide Use: An Analysis of the
Economic Impacts on US Agriculture." North Central Journal of Agricultural Economics
9, no. 2(1987): 181-194.
Carson, R. Silent Spring. Boston: Houghton Mifflin 1962.
Daberkow, S.G. and W.D. McBride. "Farm and Operator Characteristics Affecting the
Awareness and Adoption of Precision Agriculture Technologies in the US." Precision
Agriculture 4, no. 2 (2003), 163-177.
Delaplane, K. S. "Pesticide Usage in the United States: History, Benefits, Risks, and Trends."
Athens, GA: Cooperative Extension Service, The University of Georgia College of
Agriculture and Environmental Sciences, 2002.
Falck-Zepeda, J.B., G. Traxler, and R.G. Nelson. "Rent Creation and Distribution from
Biotechnology Innovations: The Case of Bt Cotton and Herbicide-Tolerant Soybeans in
1997." Agribusiness 16, no. 1(2000), 21-32.
Fernandez-Cornejo, J., and J. Ferraioli. "The Environmental Effects of Adopting IPM
Techniques: The Case of Peach Producers." Journal of Agricultural and Applied
Economics 31, no. 3(1999): 551-64.
Fernandez-Cornejo, J., S. Jans, and M. Smith. "Issues in the Economics of Pesticide Use in
Agriculture: A Review of the Empirical Evidence." Review of Agricultural Economics
20, no. 2(1998): 462-88.
Fernandez-Cornejo, J., et al. "Assessing Recent Trends in Pesticide Use in U.S. Agriculture".
Selected Paper presented at AAEA & ACCI 2009 Joint Annual Meeting, Milwaukee, WI.
2009.
Fitzner, M. S. "Three Decades of Federal Integrated Pest Management Policy." in Pesticides in
Agriculture and the Environment, edited by W. B. Wheeler. Boca Raton, FL: CRC Press
2002, 1-24.
32
Gianessi, L.P. , and C.A. Puffer. "Reregistration of Minor Pesticides: Some Observations and
Implications." Inputs Situation and Outlook Report. U.S. Department of Agriculture,
Economic Research Service. (1992) February:52-60.
Hamerschlag, K. "More Integrated Pest Management Please." New York, NY: National
Resources Defense Council Issue Paper, 2007.
Hareau, G. G., B. F. Mills, and G. W. Norton. "The potential benefits of herbicide-resistant
transgenic rice in Uruguay: Lessons for small developing countries." Food Policy 31, no.
2(2006): 162-179.
Kogan, M. "INTEGRATED PEST MANAGEMENT:Historical Perspectives and Contemporary
Developments." Annual Review of Entomology 43, no. 1(1998): 243-270.
Marra M.C., P.G. Pardey, J.M. Alston. "The Payoffs to Trangenic Field Crops: An Assessment
of the Evidence" AgBioForum 5 no. 2 (2002) 43-50.
McCorkle, D., et al. "The Economic Impact of Boll Weevil Eradication in Texas," Paper
presented at Southern Agricultural Economics Association 2008 Annual Meeting, Dallas,
TX. 2008.
Norton, G. W., and J. Mullen. "Economic Evaluation of Integrated Pest Management Programs:
A Literature Review." Blacksburg, VA: Virginia Cooperative Extension. 1994.
Osteen, C., and M. Livingston. "Pest Management Practices." in Agricultural Resources and
Environmental Indicators, edited by K Wiebe and N. Gollehon. New York, NY: Nova
Science Publishers. 2006. 107-116.
Ratcliffe, S. T., and M. E. Gray. "Will the USDA IPM centers and the national IPM roadmap
increase IPM accountability?-Responses to the 2001 General Accounting Office report."
American Entomologist 50, no. 1(2004): 6-9.
Resosudarmo, B. P. "Impact of the integrated pest management program on the Indonesian
economy." The Australian National University, Economics and Environment Network
(2001).
Roberts, E. M., et al. "Maternal Residence Near Agricultural Pesticide Applications and Autism
Spectrum Disorders Among Children in the California Central Valley," Washington DC:
U.S. Department of Human Services, National Institutes of Health, Environmental Health
Perspectives. 2007.
Roberts, M. J., et al. "The Value of Plant Disease Early-Warning Systems: A Case Study of
USDA's Soybean Rust Coordinated Framework," Washington DC: U.S. Department of
Agriculture, Economic Research Service, Economic Research Report 18. 2006.
33
Royer, T. A., P. G. Mulder, and G. W. Cuperus. "Postmarked: Extension, U. S. A. Renaming
(Redefining) Integrated Pest Management: Fumble, Pass, or Play." American
Entomologist 45, no. 3(1999): 136-139.
Spengler, J. D., et al. "Final Report to HUD: The Healthy Public Housing Initiative." U.S.
Department of Housing and Urban Development. 2005
Thelin, G.P., L.P. Giannessi. "Method for Estimating Pesticide Use for Coutny Areas of the
Continuous United States." Sacramento, CA: U.S. Geological Survey, Pesticide National
Synthesis Project (2000).
U.S. General Accounting Office. Agricultural Pesticides: Management Improvements Need to
Further Promote Integrated Pest Management, Report GAO-01-815. Washington DC:
U.S. General Accounting Office, 2001
U.S. Department of Agriculture. Agricultural Resource Management Survey: Soybean
Production Practices and Costs Report, Washington DC: U.S. Department of
Agriculture, Economic Research Service, 2006
U.S. Department of Agriculture. Pesticide Data Program--Progress Report, Washington DC:
U.S. Department of Agriculture, 2007
Zilberman, D., et al. "The Economics of Pesticide Use and Regulation." Science 253, no.
5019(1991): 518-522.