pershing holdings (uk) limited - bny mellon holdings (uk) limited. they are both full scope ifpru...
TRANSCRIPT

Pershing Holdings (UK) Limited
PILLAR 3 DISCLOSURE
DECEMBER 31, 2016
Pershing Holdings (UK) Limited Pillar 3 Disclosure
Page 2 of 64
Contents
1 Scope of Application ............................................................................... 6
1.1 Disclosure policy ..................................................................................................................... 6 1.2 The Basel III Framework ......................................................................................................... 6 1.3 Purpose of Pillar 3 .................................................................................................................. 6 1.4 Non-material, Proprietary or Confidential Information ............................................................. 7 1.5 Frequency and Means of Disclosure ....................................................................................... 7 1.6 Board Approval ....................................................................................................................... 7 1.7 Key Metrics ............................................................................................................................. 7 1.8 Company Description ............................................................................................................. 8 1.9 Core Business Lines ............................................................................................................... 9
2 Own Funds ............................................................................................. 12
3 Capital Requirements ............................................................................ 15
3.1 Calculating Capital Requirements ......................................................................................... 15
4 Risk Management Objectives and Policies .......................................... 16
4.1 Risk Governance .................................................................................................................. 16 4.2 Risk Management Framework .............................................................................................. 19 4.3 Risk Appetite ........................................................................................................................ 20 4.4 Stress Testing ...................................................................................................................... 20 4.5 Recovery and Resolution Planning (RRP) .......................................................................... 202
5 Credit Risk .............................................................................................. 22
5.1 Definition and Identification ................................................................................................... 22 5.2 Management of Credit Risk .................................................................................................. 22 5.3 Governance .......................................................................................................................... 23 5.4 Analysis of Credit Risk .......................................................................................................... 23 5.5 Analysis of Past Due and Impaired Exposures ..................................................................... 26
6 Credit Risk Mitigation ............................................................................ 29
6.1 ISDA Master Agreements and Netting .................................................................................. 29 6.2 Collateral Valuation and Management .................................................................................. 29 6.3 Wrong-way Risk ................................................................................................................... 29 6.4 Credit Risk Concentration ..................................................................................................... 29
7 External Credit Assessment Institutions (ECAIs) ................................ 31
8 Counterparty Credit Risk ....................................................................... 33
8.1 Credit Valuation Adjustment ................................................................................................. 33
9 Asset Encumbrance .............................................................................. 35
10 Market Risk .......................................................................................... 37
11 Interest Rate Risk – Non-Trading Book ............................................. 38
12 Operational Risk .................................................................................. 39
Pershing Holdings (UK) Limited Pillar 3 Disclosure
Page 3 of 64
12.1 Operational Risk Management Framework ........................................................................... 39 12.2 Operational Risk Capital Resource Requirement .................................................................. 41
13 Leverage .............................................................................................. 42
14 Remuneration Disclosure ................................................................... 44
14.1 Governance .......................................................................................................................... 44 14.2 Aligning Pay with Performance ............................................................................................. 44 14.3 Fixed Remuneration ............................................................................................................. 45 14.4 Ratio between Fixed and Variable Pay ................................................................................. 45 14.5 Variable Compensation Funding and Risk Adjustment ......................................................... 45 14.6 Deferral Policy and Vesting Criteria ...................................................................................... 46 14.7 Variable Remuneration of Control Function Staff .................................................................. 46 14.8 Quantitative Disclosures ....................................................................................................... 46
Pershing Holdings (UK) Limited Pillar 3 Disclosure
Page 4 of 64
Index of Tables
Table 1: Capital ratios ....................................................................................................................... 8 Table 2: Reconciliation of Regulatory Own Funds ........................................................................... 12 Table 3: Composition of regulatory Own Funds ............................................................................... 12 Table 4: Transitional own funds ....................................................................................................... 13 Table 5: Common tier 1 and additional tier 1 instruments and tier 2 instruments ............................. 14 Table 6: Capital requirements ......................................................................................................... 15 Table 7: Standardised credit exposure by exposure class ............................................................... 24 Table 8: Standardised credit exposure by country ........................................................................... 24 Table 9: Standardised post mitigated credit exposures by counterparty type .................................. 25 Table 10: Standardised credit exposure by residual maturity........................................................... 25 Table 11: Credit quality of exposures by counterparty type ............................................................. 26 Table 12: Credit quality of exposures by industry ............................................................................ 27 Table 13: Credit quality of exposures by geographical breakdown .................................................. 27 Table 14: Credit risk mitigation techniques – overview .................................................................... 30 Table 15: Mapping of ECAIs credit assessments to credit quality steps .......................................... 31 Table 16: Credit quality steps and risk weights ................................................................................ 31 Table 17: Credit risk exposure and Credit Risk Mitigation (CRM) effects ......................................... 31 Table 18: Credit risk exposure by asset class and risk weight post CCF and CRM ......................... 32 Table 19: Analysis of the counterparty credit risk (CCR) exposure by approach ............................. 33 Table 20: Credit valuation adjustment capital charge ...................................................................... 33 Table 21: CCR exposures by exposure class and risk weight ......................................................... 34 Table 22: Impact of netting and collateral held on exposure values ................................................. 34 Table 23: Encumbered assets ......................................................................................................... 35 Table 24: Sources of encumbrance ................................................................................................. 36 Table 25: Market risk – risk weighted assets and capital required ................................................... 37 Table 26: Leverage ratio summary .................................................................................................. 42 Table 27: Leverage ratio common disclosure .................................................................................. 42 Table 28: Composition of on-balance sheet exposures ................................................................... 43 Table 29: Aggregate remuneration expenditure by business ........................................................... 47 Table 30: Aggregate remuneration expenditure by remuneration type ............................................ 47 Table 31: Deferred Variable Remuneration ..................................................................................... 47
Pershing Holdings (UK) Limited Pillar 3 Disclosure
Page 5 of 64
Appendices
Appendix 1 Other Risks ............................................................................. 48
Liquidity Risk ................................................................................................................................... 48 Regulatory and Compliance Risk .................................................................................................... 48 Reputational Risk ............................................................................................................................ 48 Legal Risk ....................................................................................................................................... 48 Concentration Risk .......................................................................................................................... 49 Group Risk ...................................................................................................................................... 50 Model Risk ...................................................................................................................................... 50 Strategic Risk .................................................................................................................................. 50 Country Risk ................................................................................................................................... 50
Appendix 2 Glossary of Terms .................................................................. 51
Appendix 3 Supplementary Tables ........................................................... 54
Appendix 4 CRD IV Reference ................................................................... 58
Pershing Holdings (UK) Limited Pillar 3 Disclosure
Page 6 of 64
1 Scope of Application
1.1 Disclosure policy
This document comprises the Pershing Holdings (UK) Limited and its subsidiary undertakings (together the “PHUK Group” or “Pershing”) Pillar 3 disclosures on capital and risk management at 31 December 2016. These Pillar 3 disclosures are published in accordance with the requirements of the Capital Requirements Regulation (CRR) and the Capital Requirements Directive (CRD) referred to together as CRD IV, which came into effect on 1 January 2014. CRD IV has the effect of implementing the international Basel III reforms of the Basel Committee on Banking Supervision within the European Union. The Pillar 3 disclosure requirements are contained in Part Eight of the CRR, in particular articles 431 to 455.
Pillar 3 disclosures are required for a consolidated group and for those parts of the group covered by CRD IV. As such, these disclosures have been prepared for the PHUK Group and information in this report has been prepared solely to meet the Pillar 3 disclosure requirements of the entities noted, and to provide certain specified information about capital and other risks and details about the management of those risks, and for no other purpose. These disclosures do not constitute any form of financial statement of the business nor do they constitute any form of contemporary or forward looking record or opinion of the business.
Unless indicated otherwise, information contained within this document has not been subject to external audit.
1.2 The Basel III Framework
Basel III is the international banking accord intended to strengthen the measurement and monitoring of financial institutions’ capital. The Basel III framework was implemented in the European Union through the Capital Requirements Directive (CRD) and establishes a more risk sensitive approach to capital management. It is comprised of three pillars:
1.3 Purpose of Pillar 3
Pillar 3 requires the external publication of exposures and associated risk weighted assets and the approach to calculating capital requirements for the following risk and exposure types:
Pillar 1 – Minimum capital requirement:
Establishes rules for the calculation of minimum capital for credit risk, counterparty credit risk, market risk and operational risk
Pillar 2 – Supervisory review process:
Requires firms and supervisors to undertake an internal capital adequacy assessment process to determine whether the financial institution needs to hold additional capital against risks not adequately covered in Pillar 1 and to take action accordingly
Pillar 3 – Market discipline:
Complements the other two pillars and effects market discipline through public disclosure showing an institution’s risk management policies, approach to capital management, its capital resources and an analysis of its credit risk exposures
Pershing Holdings (UK) Limited Pillar 3 Disclosure
Page 7 of 64
Credit risk
Counterparty credit risk
Market risk
Credit valuation adjustment
Securitisations
Operational risk
These Pillar 3 disclosures only focus on those risk and exposure types relevant to PHUK Group.
The disclosures also include, where appropriate, comparative figures for the prior year and an analysis of the significant movements to provide greater insight into its approach to risk management.
For completeness, other risks that the PHUK Group is exposed to, but are not covered above, are also discussed
in Appendix 1.
1.4 Non-material, Proprietary or Confidential Information
In accordance with CRD IV, the Board may omit one or more disclosures if the information provided is not regarded as material. The criteria for materiality used in these disclosures is that the PHUK Group will regard as material any information where its omission or misstatement could change or influence the assessment or decision of a user relying on that information for the purpose of making economic decisions.
Furthermore, the Board may omit one or more disclosures if the information provided is regarded as proprietary or confidential. Information is regarded as proprietary if disclosing it publicly would undermine the company’s competitive position. It may include information on products or systems which, if shared with competitors, would render an institution’s investment therein less valuable. In such circumstance, the Board will state in its disclosures the fact that specific items of information are not disclosed and the reason for non-disclosure. In addition it will publish more general information about the subject matter of the disclosure requirement except where these are to be classified as confidential.
1.5 Frequency and Means of Disclosure
Disclosure will be made annually based on calendar year end and will be published in conjunction with the preparation of the Annual Report and Financial Statements. PHUK Group will reassess the need to publish some or all of the disclosures more frequently than annually in light of any significant change to the relevant characteristics of its business including disclosure about capital resources and adequacy, and information about risk exposure and other items prone to rapid change.
This policy will be periodically reassessed and updated in light of market developments associated with Pillar 3.
Disclosures are published on The Bank of New York Mellon Corporation group website (www.bnymellon.com/investorrelations/filings/index.html).
1.6 Board Approval
These disclosures were approved for publication by the Board on 27 June 2017. The Board has verified that they are consistent with formal policies adopted regarding production and validation and are satisfied with the adequacy and effectiveness of the risk management arrangements.
1.7 Key Metrics
The following risk metrics reflect PHUK Group’s risk profile:
Pershing Holdings (UK) Limited Pillar 3 Disclosure
Page 8 of 64
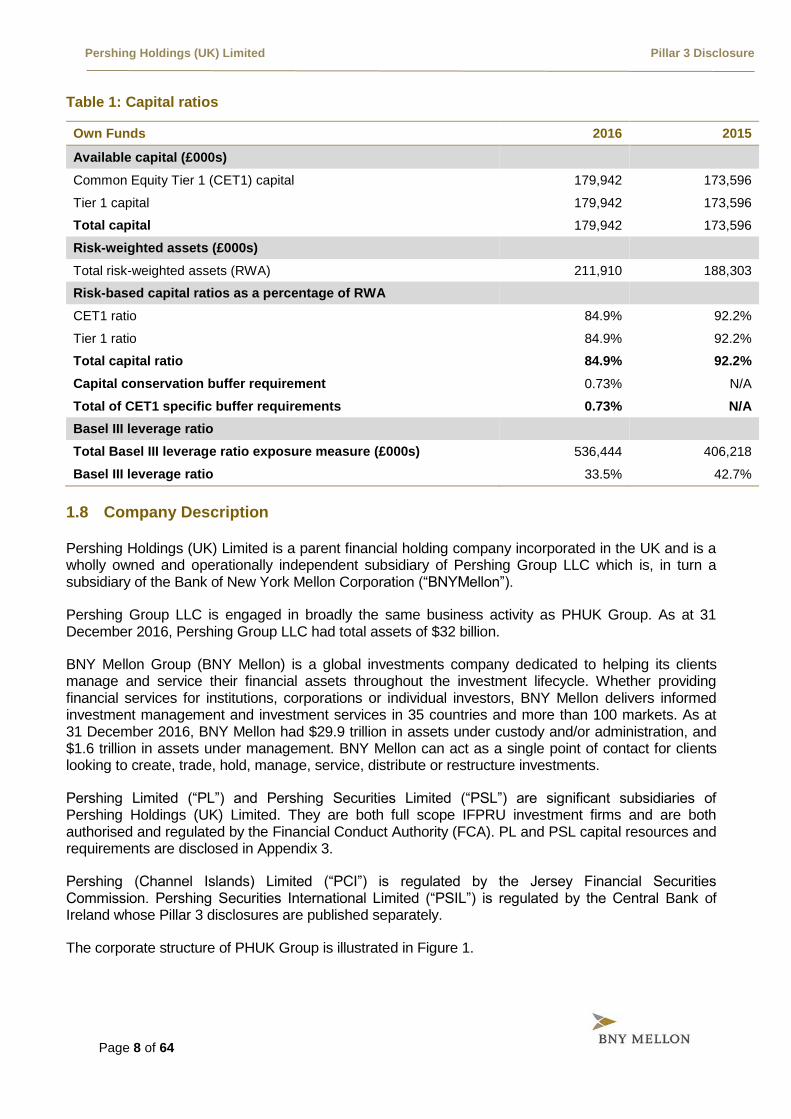
Table 1: Capital ratios
Own Funds 2016 2015
Available capital (£000s)
Common Equity Tier 1 (CET1) capital 179,942 173,596
Tier 1 capital 179,942 173,596
Total capital 179,942 173,596
Risk-weighted assets (£000s)
Total risk-weighted assets (RWA) 211,910 188,303
Risk-based capital ratios as a percentage of RWA
CET1 ratio 84.9% 92.2%
Tier 1 ratio 84.9% 92.2%
Total capital ratio 84.9% 92.2%
Capital conservation buffer requirement 0.73% N/A
Total of CET1 specific buffer requirements 0.73% N/A
Basel III leverage ratio
Total Basel III leverage ratio exposure measure (£000s) 536,444 406,218
Basel III leverage ratio 33.5% 42.7%
1.8 Company Description
Pershing Holdings (UK) Limited is a parent financial holding company incorporated in the UK and is a wholly owned and operationally independent subsidiary of Pershing Group LLC which is, in turn a subsidiary of the Bank of New York Mellon Corporation (“BNYMellon”).
Pershing Group LLC is engaged in broadly the same business activity as PHUK Group. As at 31 December 2016, Pershing Group LLC had total assets of $32 billion.
BNY Mellon Group (BNY Mellon) is a global investments company dedicated to helping its clients manage and service their financial assets throughout the investment lifecycle. Whether providing financial services for institutions, corporations or individual investors, BNY Mellon delivers informed investment management and investment services in 35 countries and more than 100 markets. As at 31 December 2016, BNY Mellon had $29.9 trillion in assets under custody and/or administration, and $1.6 trillion in assets under management. BNY Mellon can act as a single point of contact for clients looking to create, trade, hold, manage, service, distribute or restructure investments.
Pershing Limited (“PL”) and Pershing Securities Limited (“PSL”) are significant subsidiaries of Pershing Holdings (UK) Limited. They are both full scope IFPRU investment firms and are both authorised and regulated by the Financial Conduct Authority (FCA). PL and PSL capital resources and requirements are disclosed in Appendix 3.
Pershing (Channel Islands) Limited (“PCI”) is regulated by the Jersey Financial Securities Commission. Pershing Securities International Limited (“PSIL”) is regulated by the Central Bank of Ireland whose Pillar 3 disclosures are published separately.
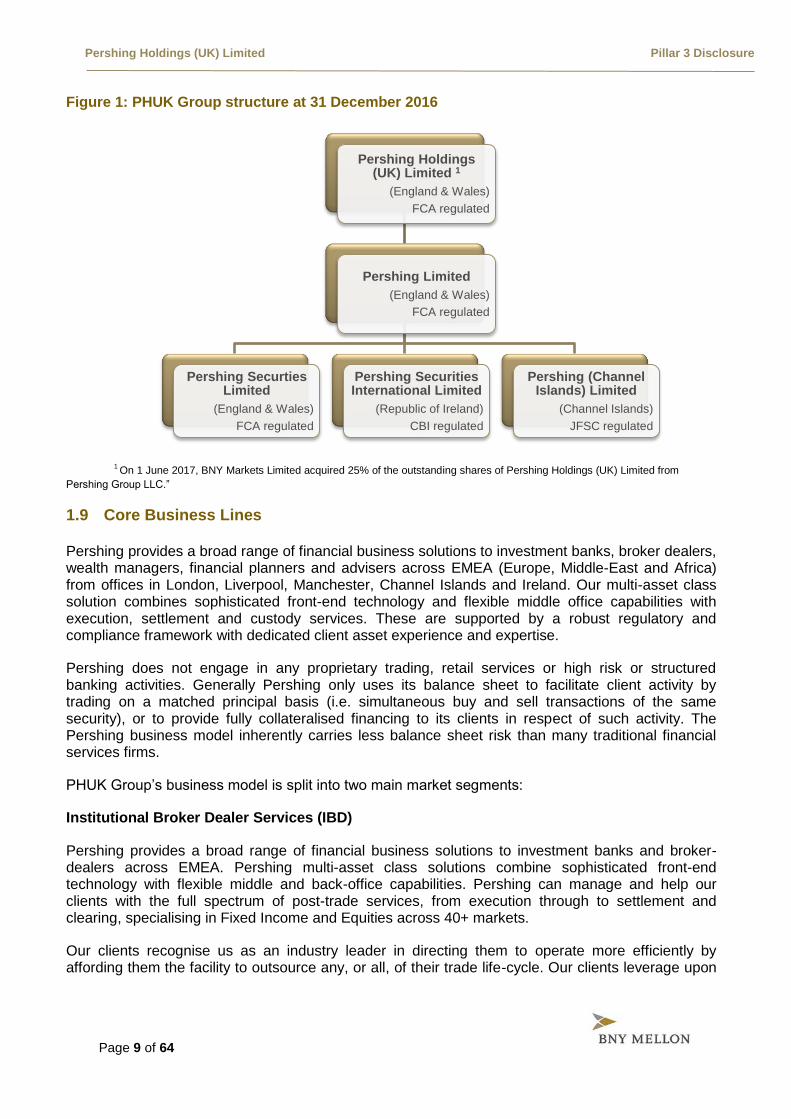
The corporate structure of PHUK Group is illustrated in Figure 1.
Pershing Holdings (UK) Limited Pillar 3 Disclosure
Page 9 of 64
Figure 1: PHUK Group structure at 31 December 2016
1 On 1 June 2017, BNY Markets Limited acquired 25% of the outstanding shares of Pershing Holdings (UK) Limited from
Pershing Group LLC.”
1.9 Core Business Lines
Pershing provides a broad range of financial business solutions to investment banks, broker dealers, wealth managers, financial planners and advisers across EMEA (Europe, Middle-East and Africa) from offices in London, Liverpool, Manchester, Channel Islands and Ireland. Our multi-asset class solution combines sophisticated front-end technology and flexible middle office capabilities with execution, settlement and custody services. These are supported by a robust regulatory and compliance framework with dedicated client asset experience and expertise.
Pershing does not engage in any proprietary trading, retail services or high risk or structured banking activities. Generally Pershing only uses its balance sheet to facilitate client activity by trading on a matched principal basis (i.e. simultaneous buy and sell transactions of the same security), or to provide fully collateralised financing to its clients in respect of such activity. The Pershing business model inherently carries less balance sheet risk than many traditional financial services firms.
PHUK Group’s business model is split into two main market segments:
Institutional Broker Dealer Services (IBD)
Pershing provides a broad range of financial business solutions to investment banks and broker-dealers across EMEA. Pershing multi-asset class solutions combine sophisticated front-end technology with flexible middle and back-office capabilities. Pershing can manage and help our clients with the full spectrum of post-trade services, from execution through to settlement and clearing, specialising in Fixed Income and Equities across 40+ markets.
Our clients recognise us as an industry leader in directing them to operate more efficiently by affording them the facility to outsource any, or all, of their trade life-cycle. Our clients leverage upon
Pershing Holdings (UK) Limited 1
(England & Wales)
FCA regulated
Pershing Limited
(England & Wales)
FCA regulated
Pershing Securties Limited
(England & Wales)
FCA regulated
Pershing Securities International Limited
(Republic of Ireland)
CBI regulated
Pershing (Channel Islands) Limited
(Channel Islands)
JFSC regulated
Pershing Holdings (UK) Limited Pillar 3 Disclosure
Page 10 of 64
our technology, strength and global stability and as such we have become a trusted and independent partner to many financial institutions.
We retain our leadership by investing heavily in our technology, so that our customers can be confident in the knowledge that the functionality and capability of our systems and services will continually meet their industry needs, whilst simultaneously addressing the ever changing regulatory landscape, thereby enabling them to focus on their core business proposition and future proof their corporate positioning.
Wealth and Adviser Solutions (WAS)
Pershing specialises in providing administration and custody services to wealth management professionals. Many of our clients prefer to outsource back and middle office functions to Pershing so they can focus on serving their existing clients and developing new business. Clients benefit from reduced operational costs, Pershing’s expertise in meeting regulatory requirements and from holding their clients’ assets with the world’s largest global custodian.
Clients include banks, wealth managers, family offices, advisers and “consolidator” platforms that provide platform services for smaller advisory firms.
Many wealth management firms are large enough to self-clear their business and most will choose to do this. However, the increasing rate of technological change, transparency in pricing exerting a downward pressure on charges, and the increasing cost of regulatory demands can reduce profit margins and so there is a general industry trend for wealth management firms to consider other ways of working to reduce costs.
Contract bases
Clients contract on a basis appropriate to their business needs, either Model A, B or GlobalClear, as outlined below.
Model A
Model A business provides the outsourcing of settlement and clearing functions by client firms. All settlement accounts are maintained in the name of the client and Pershing has no settlement obligation to any counterparty, except where it is providing a General Clearing Member (“GCM”) service. Therefore, in all other cases, Pershing is not exposed to any credit and market risk relating to such activity. Pershing does however have credit exposure as a GCM, as it assumes an obligation to deliver cash and stock to the Central Counterparty (“CCP”) and is reliant upon receiving cash or stock from the CCP or client firm.
Model B
The largest portion of Pershing’s business is contracted on a Model B basis where we assume the settlement obligations of clients and it is Pershing’s name not the clients in the market place. The main risk exposure from this activity relates to credit risk arising from clients failing to meet their corresponding obligations to PHUK Group. However the actual exposure is generally limited to any adverse mark to market movement in the underlying securities and is mitigated through various techniques and processes, including credit risk monitoring, rights over retained commissions and cash collateral deposits.

Pershing Holdings (UK) Limited Pillar 3 Disclosure
Page 11 of 64
GlobalClear
The GlobalClear Model is designed as an intermediate model. The model utilises key Model A components where, for non-GCM trades, PHUK Group does not assume the settlement obligations of clients as we do under Model B. Clients support these trades on their own balance sheet and PHUK Group is under no obligation to clear such transactions. GlobalClear also utilises key Model B components where the client uses PHUK Group’s network for clearing of GCM trades and PHUK Group’s settlement network for settlement of GCM and non-GCM transactions. Clients also use PHUK Group for associated cash and network management.
Collateralised Lending
With this capability, clients borrow money against the assets held in their investment portfolio. We accept a wide range of securities, including FTSE 350 equities and daily-priced UK registered collective investment funds.
Pershing Holdings (UK) Limited Pillar 3 Disclosure
Page 12 of 64
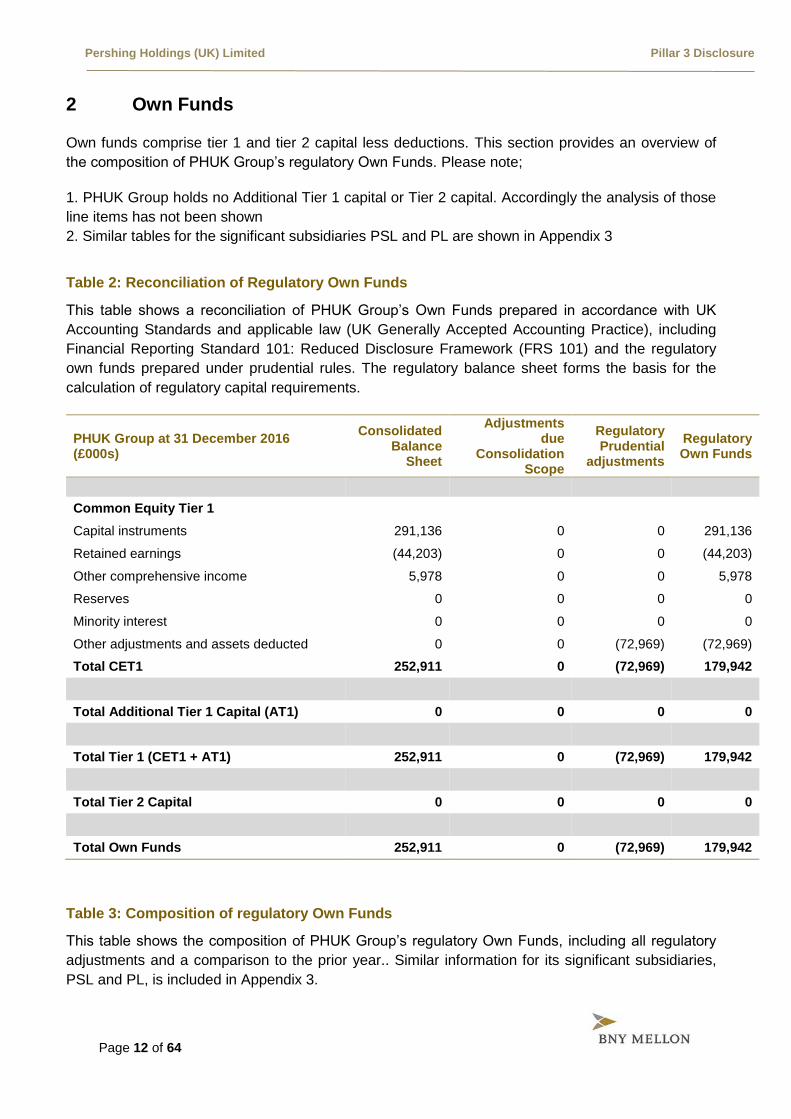
2 Own Funds
Own funds comprise tier 1 and tier 2 capital less deductions. This section provides an overview of
the composition of PHUK Group’s regulatory Own Funds. Please note;
1. PHUK Group holds no Additional Tier 1 capital or Tier 2 capital. Accordingly the analysis of those
line items has not been shown
2. Similar tables for the significant subsidiaries PSL and PL are shown in Appendix 3
Table 2: Reconciliation of Regulatory Own Funds
This table shows a reconciliation of PHUK Group’s Own Funds prepared in accordance with UK
Accounting Standards and applicable law (UK Generally Accepted Accounting Practice), including
Financial Reporting Standard 101: Reduced Disclosure Framework (FRS 101) and the regulatory
own funds prepared under prudential rules. The regulatory balance sheet forms the basis for the
calculation of regulatory capital requirements.
PHUK Group at 31 December 2016 (£000s)
Consolidated Balance
Sheet
Adjustments due
Consolidation Scope
Regulatory Prudential
adjustments
Regulatory Own Funds
Common Equity Tier 1
Capital instruments 291,136 0 0 291,136
Retained earnings (44,203) 0 0 (44,203)
Other comprehensive income 5,978 0 0 5,978
Reserves 0 0 0 0
Minority interest 0 0 0 0
Other adjustments and assets deducted 0 0 (72,969) (72,969)
Total CET1 252,911 0 (72,969) 179,942
Total Additional Tier 1 Capital (AT1) 0 0 0 0
Total Tier 1 (CET1 + AT1) 252,911 0 (72,969) 179,942
Total Tier 2 Capital 0 0 0 0
Total Own Funds 252,911 0 (72,969) 179,942
Table 3: Composition of regulatory Own Funds
This table shows the composition of PHUK Group’s regulatory Own Funds, including all regulatory
adjustments and a comparison to the prior year.. Similar information for its significant subsidiaries,
PSL and PL, is included in Appendix 3.
Pershing Holdings (UK) Limited Pillar 3 Disclosure
Page 13 of 64
Own Funds (£000s) 31 December 16 31 December 15
Common Equity Tier 1 (CET1)
Capital Instruments 291,136 291,136
Retained Earnings (44,203) (47,174)
Other comprehensive income 5,978 4,494
Reserves and others 0 0
CET1 Adjustments (72,969) (74,859)
Total CET1 179,942 173,596
Additional Tier 1 Capital (AT1)
Total AT1 0 0
Total Tier 1 Capital 179,942 173,596
Tier 2 Capital (T2)
Total T2 Capital 0 0
Total Own Funds 179,942 173,596
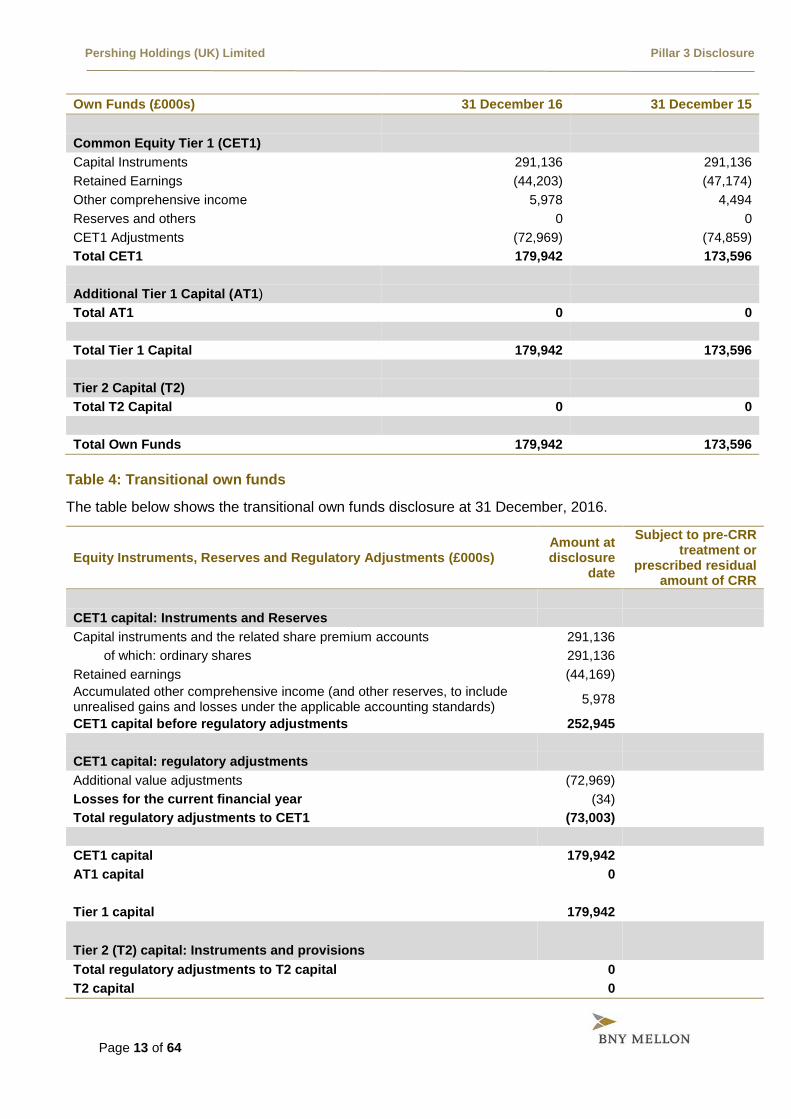
Table 4: Transitional own funds
The table below shows the transitional own funds disclosure at 31 December, 2016.
Equity Instruments, Reserves and Regulatory Adjustments (£000s) Amount at disclosure
date
Subject to pre-CRR treatment or
prescribed residual amount of CRR
CET1 capital: Instruments and Reserves
Capital instruments and the related share premium accounts 291,136
of which: ordinary shares 291,136
Retained earnings (44,169)
Accumulated other comprehensive income (and other reserves, to include unrealised gains and losses under the applicable accounting standards)
5,978
CET1 capital before regulatory adjustments 252,945
CET1 capital: regulatory adjustments
Additional value adjustments (72,969)
Losses for the current financial year (34)
Total regulatory adjustments to CET1 (73,003)
CET1 capital 179,942
AT1 capital 0
Tier 1 capital 179,942
Tier 2 (T2) capital: Instruments and provisions
Total regulatory adjustments to T2 capital 0
T2 capital 0
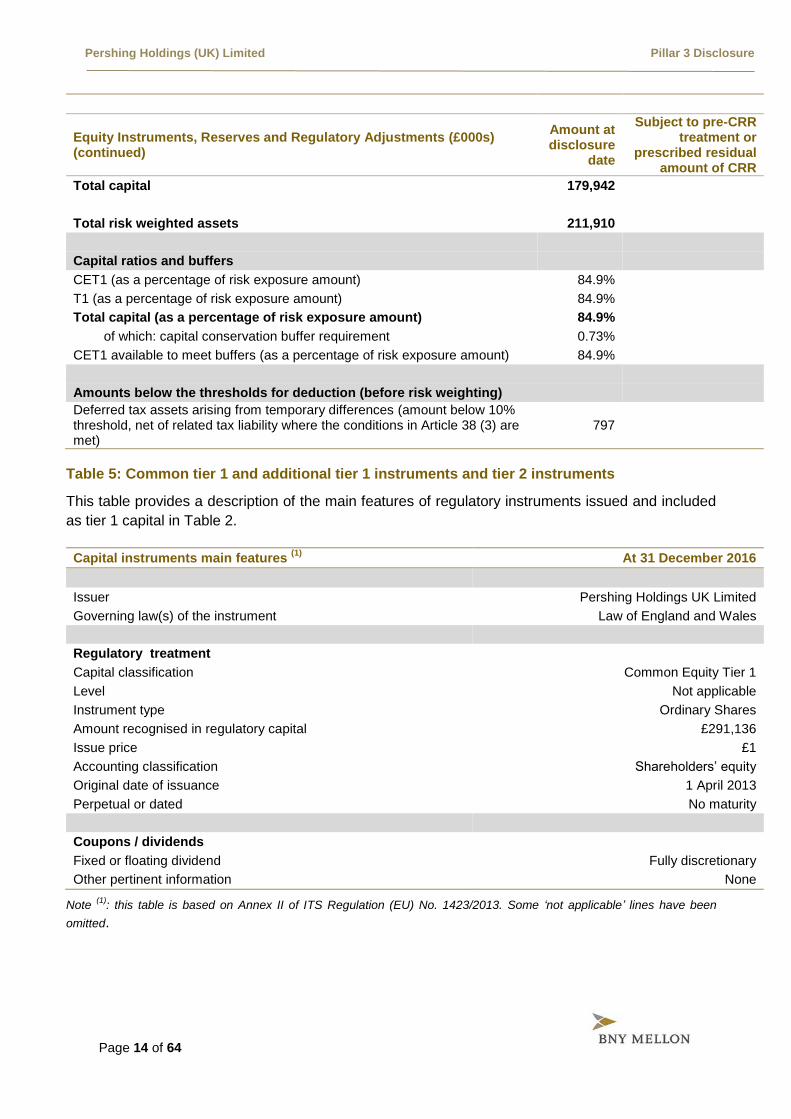
Pershing Holdings (UK) Limited Pillar 3 Disclosure
Page 14 of 64
Equity Instruments, Reserves and Regulatory Adjustments (£000s) (continued)
Amount at disclosure
date
Subject to pre-CRR treatment or
prescribed residual amount of CRR
Total capital 179,942
Total risk weighted assets 211,910
Capital ratios and buffers
CET1 (as a percentage of risk exposure amount) 84.9%
T1 (as a percentage of risk exposure amount) 84.9%
Total capital (as a percentage of risk exposure amount) 84.9%
of which: capital conservation buffer requirement 0.73%
CET1 available to meet buffers (as a percentage of risk exposure amount) 84.9%
Amounts below the thresholds for deduction (before risk weighting)
Deferred tax assets arising from temporary differences (amount below 10% threshold, net of related tax liability where the conditions in Article 38 (3) are met)
797
Table 5: Common tier 1 and additional tier 1 instruments and tier 2 instruments
This table provides a description of the main features of regulatory instruments issued and included
as tier 1 capital in Table 2.
Capital instruments main features (1)
At 31 December 2016
Issuer Pershing Holdings UK Limited
Governing law(s) of the instrument Law of England and Wales
Regulatory treatment
Capital classification Common Equity Tier 1
Level Not applicable
Instrument type Ordinary Shares
Amount recognised in regulatory capital £291,136
Issue price £1
Accounting classification Shareholders’ equity
Original date of issuance 1 April 2013
Perpetual or dated No maturity
Coupons / dividends
Fixed or floating dividend Fully discretionary
Other pertinent information None
Note (1)
: this table is based on Annex II of ITS Regulation (EU) No. 1423/2013. Some ‘not applicable’ lines have been
omitted.
Pershing Holdings (UK) Limited Pillar 3 Disclosure
Page 15 of 64
3 Capital Requirements
The PHUK Group has an Internal Capital Adequacy Assessment Process (“ICAAP”) which defines the risks that the PHUK Group is exposed to, and sets out the associated capital plan which aims to ensure that the PHUK Group holds an appropriate amount of capital to support its business model, through the economic cycle and given a range of plausible but severe stress scenarios. The plan is reflective of PHUK Group’s commitment to a low risk appetite, with no proprietary trading, coupled with a strong capital structure which gives the necessary confidence to our clients.
3.1 Calculating Capital Requirements
CRD IV allows for different approaches to the calculation of capital requirements. PHUK Group uses the standardised approach where risk weights are based on the exposure class to which the exposure is assigned and its credit quality. These risk weights used to assess requirements against credit exposures are consistent across the industry. The standardised approach is used for calculating the risk weights assigned to each risk component including credit risk, counterparty credit risk, market risk and operational risk.
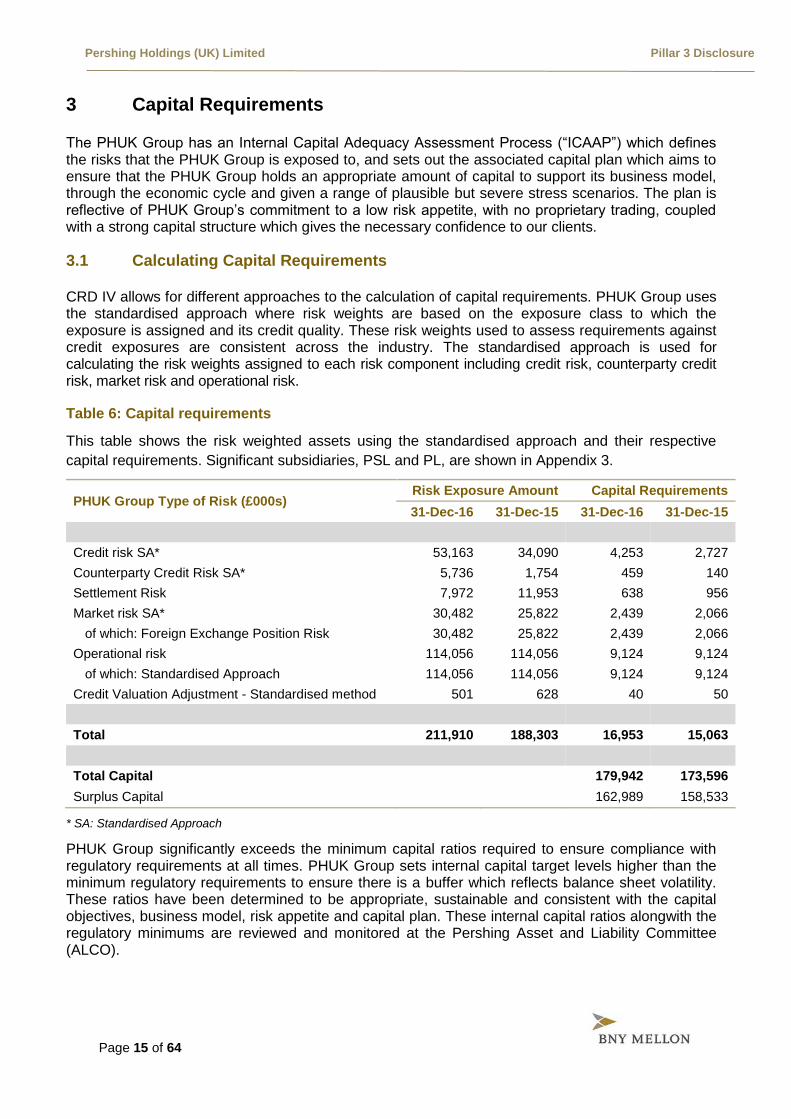
Table 6: Capital requirements
This table shows the risk weighted assets using the standardised approach and their respective
capital requirements. Significant subsidiaries, PSL and PL, are shown in Appendix 3.
PHUK Group Type of Risk (£000s) Risk Exposure Amount Capital Requirements
31-Dec-16 31-Dec-15 31-Dec-16 31-Dec-15
Credit risk SA* 53,163 34,090 4,253 2,727
Counterparty Credit Risk SA* 5,736 1,754 459 140
Settlement Risk 7,972 11,953 638 956
Market risk SA* 30,482 25,822 2,439 2,066
of which: Foreign Exchange Position Risk 30,482 25,822 2,439 2,066
Operational risk 114,056 114,056 9,124 9,124
of which: Standardised Approach 114,056 114,056 9,124 9,124
Credit Valuation Adjustment - Standardised method 501 628 40 50
Total 211,910 188,303 16,953 15,063
Total Capital 179,942 173,596
Surplus Capital 162,989 158,533
* SA: Standardised Approach
PHUK Group significantly exceeds the minimum capital ratios required to ensure compliance with regulatory requirements at all times. PHUK Group sets internal capital target levels higher than the minimum regulatory requirements to ensure there is a buffer which reflects balance sheet volatility. These ratios have been determined to be appropriate, sustainable and consistent with the capital objectives, business model, risk appetite and capital plan. These internal capital ratios alongwith the regulatory minimums are reviewed and monitored at the Pershing Asset and Liability Committee (ALCO).
Pershing Holdings (UK) Limited Pillar 3 Disclosure
Page 16 of 64
4 Risk Management Objectives and Policies
Clients and other market participants need to have confidence that PHUK Group and its subsidiaries will remain strong and continue to deliver operational excellence and maintain an uninterrupted service throughout market cycles and especially during periods of market turbulence. PHUK Group is committed to maintaining a strong balance sheet and this philosophy is also consistent with Pershing Group LLC and BNY Mellon Corporation as a whole.
Whilst PHUK Group assumes less balance sheet risk than most financial services companies due to its focus on transaction processing, its business model does give rise to some risk as described below. As a consequence, Pershing has developed a risk management program that is designed to ensure that:
4.1 Risk Governance
4.1.1 Board of Directors
The main duty and responsibility of the Board is to define the strategy of PHUK Group and to supervise the management of PHUK Group. Whilst acting autonomously and in accordance with its legal and regulatory requirements, the Board also aligns PHUK Group’s strategy to that of its primary shareholder, Pershing Group LLC. The Board has overall responsibility for the establishment and maintenance of PHUK Group’s risk appetite framework and for the approval of the risk appetite statement. The Board ensures that strategic business plans are consistent with the approved risk appetite.
The Board is also responsible for both the management and the oversight of risks, together with the quality and effectiveness of internal controls, but delegates risk management oversight to general management, supported by the risk management committees. It is also responsible for reviewing, challenging and approving all risk management processes including risk identification and assessment, stress testing and capital adequacy. The various control functions provide further support for the management of risk within the business.
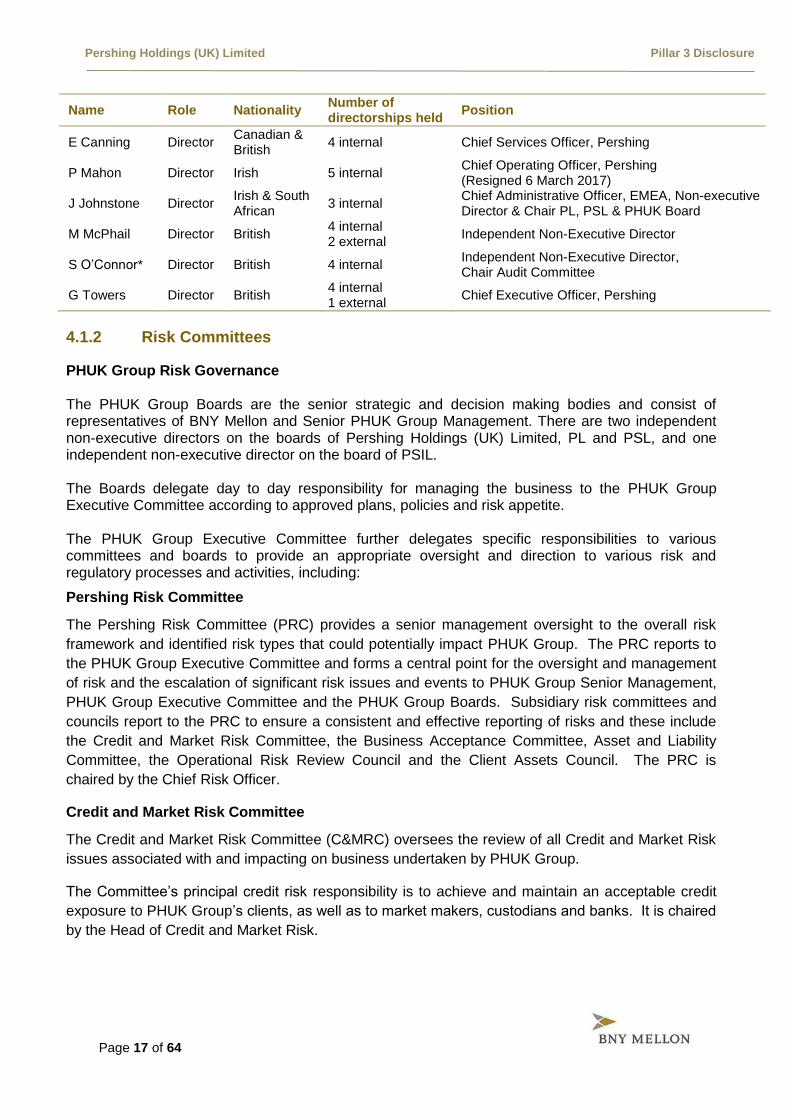
The Board meets at least quarterly and the directors who served as of 31 December 2016 were:
Risk tolerances (limits) are in place to govern its risk-taking activities across all businesses and risk types
Risk appetite principles are incorporated into its strategic decision making processes
An appropriate risk framework is in place to identify, manage, monitor and report on risk within the governance structure
Monitoring and reporting of key risk metrics to senior management and the Board takes place
There is a capital planning process based on a stress testing programme
Pershing Holdings (UK) Limited Pillar 3 Disclosure
Page 17 of 64
Name Role Nationality Number of directorships held
Position
E Canning Director Canadian & British
4 internal Chief Services Officer, Pershing
P Mahon Director Irish 5 internal Chief Operating Officer, Pershing (Resigned 6 March 2017)
J Johnstone Director Irish & South African
3 internal Chief Administrative Officer, EMEA, Non-executive Director & Chair PL, PSL & PHUK Board
M McPhail Director British 4 internal 2 external
Independent Non-Executive Director
S O’Connor* Director British 4 internal Independent Non-Executive Director, Chair Audit Committee
G Towers Director British 4 internal 1 external
Chief Executive Officer, Pershing
4.1.2 Risk Committees
PHUK Group Risk Governance The PHUK Group Boards are the senior strategic and decision making bodies and consist of representatives of BNY Mellon and Senior PHUK Group Management. There are two independent non-executive directors on the boards of Pershing Holdings (UK) Limited, PL and PSL, and one independent non-executive director on the board of PSIL. The Boards delegate day to day responsibility for managing the business to the PHUK Group Executive Committee according to approved plans, policies and risk appetite. The PHUK Group Executive Committee further delegates specific responsibilities to various committees and boards to provide an appropriate oversight and direction to various risk and regulatory processes and activities, including:
Pershing Risk Committee
The Pershing Risk Committee (PRC) provides a senior management oversight to the overall risk
framework and identified risk types that could potentially impact PHUK Group. The PRC reports to
the PHUK Group Executive Committee and forms a central point for the oversight and management
of risk and the escalation of significant risk issues and events to PHUK Group Senior Management,
PHUK Group Executive Committee and the PHUK Group Boards. Subsidiary risk committees and
councils report to the PRC to ensure a consistent and effective reporting of risks and these include
the Credit and Market Risk Committee, the Business Acceptance Committee, Asset and Liability
Committee, the Operational Risk Review Council and the Client Assets Council. The PRC is
chaired by the Chief Risk Officer.
Credit and Market Risk Committee
The Credit and Market Risk Committee (C&MRC) oversees the review of all Credit and Market Risk
issues associated with and impacting on business undertaken by PHUK Group.
The Committee’s principal credit risk responsibility is to achieve and maintain an acceptable credit
exposure to PHUK Group’s clients, as well as to market makers, custodians and banks. It is chaired
by the Head of Credit and Market Risk.
Pershing Holdings (UK) Limited Pillar 3 Disclosure
Page 18 of 64
Asset and Liability Committee
The ALCO is responsible for overseeing the asset and liability management activities of the balance
sheets of PHUK Group and for ensuring compliance with all treasury related regulatory
requirements.
The PHUK Group ALCO is responsible for ensuring that the policy and guidance set through the
BNY Mellon’s Global ALCO and EMEA ALCO is understood and executed locally. This includes the
strategy related to the investment portfolio, placements, interest rate risk, capital management and
liquidity risk. It is chaired by the Chief Financial Officer.
Irish Compliance, Risk and Oversight Committee
The Irish Compliance, Risk and Oversight Committee oversees the adherence of Pershing
Securities International Limited to applicable Irish laws, guidelines and notices effecting its
operations and to fulfil the requirements of the Standards for Stockbrokers, as issued by the Central
Bank of Ireland.
Jersey Compliance and Oversight Council
The Jersey Compliance and Oversight Council oversees the adherence of Pershing Channel Islands
Limited to applicable Jersey laws, guidelines and notices effecting its operations and to fulfil the
requirements of the investment firms, as issued by the Jersey Financial Services Commission.
Business Acceptance Committee
The Pershing Business Acceptance Committee (BAC) is an integral part of the new business
process and is responsible for the review and approval of all new clients, products/services and
material changes to existing processes before they are executed or implemented and includes
responsibility for the pricing of new client activity, products and services. It is chaired by the Chief
Executive Officer and included representatives of all of the risk and control functions, as well as line
support functions.
Operational Risk Review Council
The Operational Risk Review Council has oversight of the operational risk framework within PHUK
Group. The Operational Risk Management Department is responsible for providing all necessary
support to ensure that the framework meets regulatory requirements and industry best practice in
identifying, measuring and reporting on the relevant operational risks inherent in PHUK Group’s
business (including events such as, but not limited to, technical system failures, disaster events,
failed processes or fraud).
Audit Oversight Review Council
The Audit Oversight Review Council provides review, discussion and challenge of control related
issues within PHUK Group. The Council’s responsibilities include discussing emerging control risks,
thematic control concerns or weaknesses and considering possible means to monitor, control or
mitigate such exposures.
Pershing Holdings (UK) Limited Pillar 3 Disclosure
Page 19 of 64
ICAAP Working Group
The ICAAP Working Group coordinates and oversees the processes for the identification and
assessment of risks as they relate to the calculation of regulatory capital and ensure that these are
fully described within the ICAAP
Client Asset Council
This council is responsible for the oversight and governance of PHUK Group’s adherence to the
FCA, Central Bank of Ireland (CBI) and Jersey Financial Services Commission (JFSC) custody and
client money rules. The council reports to the Pershing Risk Committee to confirm the adequacy of
systems and controls in place to identify segregate and hold client assets in accordance with
regulatory rules.
4.2 Risk Management Framework
PHUK Group’s risk management framework is designed to:
Suitable policies and procedures have been adopted by PHUK Group in order to ensure an appropriate level of risk management is directed at the relevant element of the business.
In line with global policy, PHUK Group has adopted the ‘Three Lines of Defence’ model in deploying its risk management framework (figure 2 below). The first line of defence (1LOD) is the business or, in some cases, business partner level. The business takes and owns the risk associated with activities, and it manages the risks and the related control processes and procedures on an operational basis. The risk management and compliance functions are the second line of defence (2LOD) and own the enterprise-wide risk management framework and provide independent oversight of the 1LOD, ensuring that policies are adhered to and challenged. This also includes corporate security, business continuity, financial management and analysis within Finance. The third line of defence (3LOD) is Internal Audit, which independently provides the PHUK Group Board and senior management with the assurance that the governance structures, risk management and internal controls in place are effective.
Ensure that risks are identified, managed, mitigated, monitored and reported
Define and communicate the types and amount of risks to take
Ensure that risk-taking activities are consistent with the risk appetite
Monitor emerging risks and ensure they are weighed against the risk appetite
Promote a strong risk management culture that considers risk-adjusted performance
Pershing Holdings (UK) Limited Pillar 3 Disclosure
Page 20 of 64
Figure 2: Managing Three Lines of Defence
The risk management function monitors and identifies emerging risks with a forward-looking approach. It provides risk management information to the PHUK Group Board and governance committees, and contributes to a “no surprise” risk culture. It aligns closely with Compliance (2LOD) and Internal Audit (3LOD) plus Finance and Treasury (as 1LOD control functions). It independently educates staff, promotes risk awareness and continually makes improvements, whilst monitoring progress against defined success criteria for improving the effectiveness of the risk function.
4.3 Risk Appetite
Pershing defines risk appetite as the maximum level of risk it is normally willing to accept while
pursuing the interests of major stakeholders, including clients, shareholders, employees and
regulators i.e. it considers the balance between risk and reward aligning the strategic goals and the
overall risk. It is linked to the strategic direction set by senior management and is approved by the
PHUK Group Board.
The statement applies to all subsidiaries and is reviewed at least annually or when the Company’s
risk profile changes. The risk appetite ultimately determines the level of regulatory capital.
PHUK Group uses a variety of metrics to measure and monitor its risk taking activities relative to its
risk appetite. Articulating risk appetite through its metrics aids important decision-making by
determining actions such as pursuing new products and enterprises, exiting businesses, and
aligning resources to maximise potential gains given acceptable levels of risk. The metrics are
actively monitored, managed and mitigated through PRC.
4.4 Stress Testing
Stress testing is undertaken at PHUK Group to monitor and quantify risk and ascertain that sufficient
capital resources are held against risks on a forward-looking basis. The process reflects stressed
scenarios that identify an appropriate range of adverse circumstances of varying nature, severity
Pershing Holdings (UK) Limited Pillar 3 Disclosure
Page 21 of 64
and duration relevant to PHUK Group’s risk profile. PHUK Group’s stress testing process conclusion
is a statement of the future risk(s) that the business faces, control improvements to mitigate the
impact should the risk arise and where appropriate, a recommendation for capital to be held against
each risk type.
Scenarios are derived from current, emerging, and plausible future risks and strategy, and reviewed,
discussed and agreed by PHUK Group’s Risk Committee and Board.
4.5 Recovery and Resolution Planning (RRP)
In 2016, a recovery plan was prepared for submission to the FCA in accordance with the requirement of Bank Recovery and Resolution Directive (BRRD). The recovery plan is designed to ensure that the PHUK Group has credible and executable options to meet the challenges that may arise from potential future financial crises.
Pershing Holdings (UK) Limited Pillar 3 Disclosure
Page 22 of 64
5 Credit Risk
5.1 Definition and Identification
Credit risk is defined as the risk that an obligor will fail to repay a loan or otherwise meet a contractual obligation as and when it falls due.
On balance sheet Credit Risk covers default risk for loans, commitments, securities, receivables and other assets where the realisation of the value of the asset is dependent on the counterparty’s ability and willingness to repay its contractual obligations.
Due to the nature of PHUK Group’s business as a provider of clearing and settlement services, Credit Risk mainly arises from the risk of loss in the event that a client, underlying investor or market counterparty fails to meet its contractual obligations to pay for a trade, or to deliver securities for sale. However, the legal structure of the clearing agreements provides PHUK Group with the right to set-off any indebtedness of underlying clients against any credit balance in the name of the same underlying client. PHUK Group also has recourse to securities and cash as collateral and indemnities from client firms in respect of any underlying clients. Consequently, the residual credit risk (i.e. post-mitigation) will devolve to market risk, as the exposure in such cases is the movement in the underlying stock and foreign currency prices. In addition, Pershing also requires clients to place a security deposit with PHUK Group to cover this potential mark to market exposure.
Credit Risk also arises from the non-payment of other receivables, cash at bank, loans to third parties, investment securities and outstanding client invoices and loans to third parties.
5.2 Management of Credit Risk
PHUK Group manages credit risk exposure by a two-stage process:
1) Setting minimum thresholds for the type of client acceptable to PHUK Group in terms of net worth and business profile, including:
Obtaining credit approval for a particular client is the primary responsibility of the business as the first line of defence alongside guidance and oversight from Credit Risk as the second line. Any new relationship requires approval from the Business Acceptance Committee.
2) Monitoring all exposure (both pre- and post-settlement) on a daily basis against various limits for its clients, as follows:
The type of business to be conducted through PHUK Group (e.g. retail vs. institutional;
agency/matched principal vs. proprietary trading / market making)
Markets and financial instruments in which the client can trade
Any special conditions clients are subject to (e.g. cash on account)

Pershing Holdings (UK) Limited Pillar 3 Disclosure
Page 23 of 64
It should also be noted that the metrics supporting the management of credit risk are monitored on a
daily basis and reported to senior management. Breaches are reported to senior management which
may lead to management action such as requesting additional collateral, or requiring the client to
inject additional capital into the business.
5.3 Governance
Governance of credit risk oversight as a second line of defence function is described and controlled through credit risk policies and day-to-day procedures as follows:
5.4 Analysis of Credit Risk
Credit risk exposure is computed under the standardised approach, as defined in BIPRU 3.1.6 R, which uses external credit assessment institution ratings and supervisory risk weights supplied by external credit assessment agencies. The following credit risk exposure tables summarise the credit exposure for PHUK Group in accordance with the CRD IV requirements.
The definitions below are used in the following tables:
Trade Limit (set per client following analysis of the financial strength, management expertise, nature of
business and expected – or historical – peak and average exposure levels);
Gross Exposure Limit (calculated with reference to the security deposit and net worth of the client and
utilised as the higher of total purchases or total sales)
Negative mark to market exposure
Credit Risk Policy for each legal entity describes the outsourcing of credit risk tasks, defines roles and responsibilities and requires reporting to be carried out to each business line and entity that the policy applies to. Any deviation from approved policy requires either senior business or senior legal entity approval depending on the type of event
Approvals for excesses are controlled using a matrix of credit risk approval authorities held within the Credit Risk Policy – each Credit Risk Officer has an individual approval authority granted by the Credit Risk Director. He/she must act within those limits when making approvals. If an excess is beyond the Officer’s approval limit, it is escalated to a more senior officer. The outsourcing of credit responsibility to Credit Risk Officers is through the Board approved Credit Risk Policy
Limit excesses are reported in the daily Risk Management Pack and reviewed at the weekly Credit Committee.
Pershing Holdings (UK) Limited Pillar 3 Disclosure
Page 24 of 64
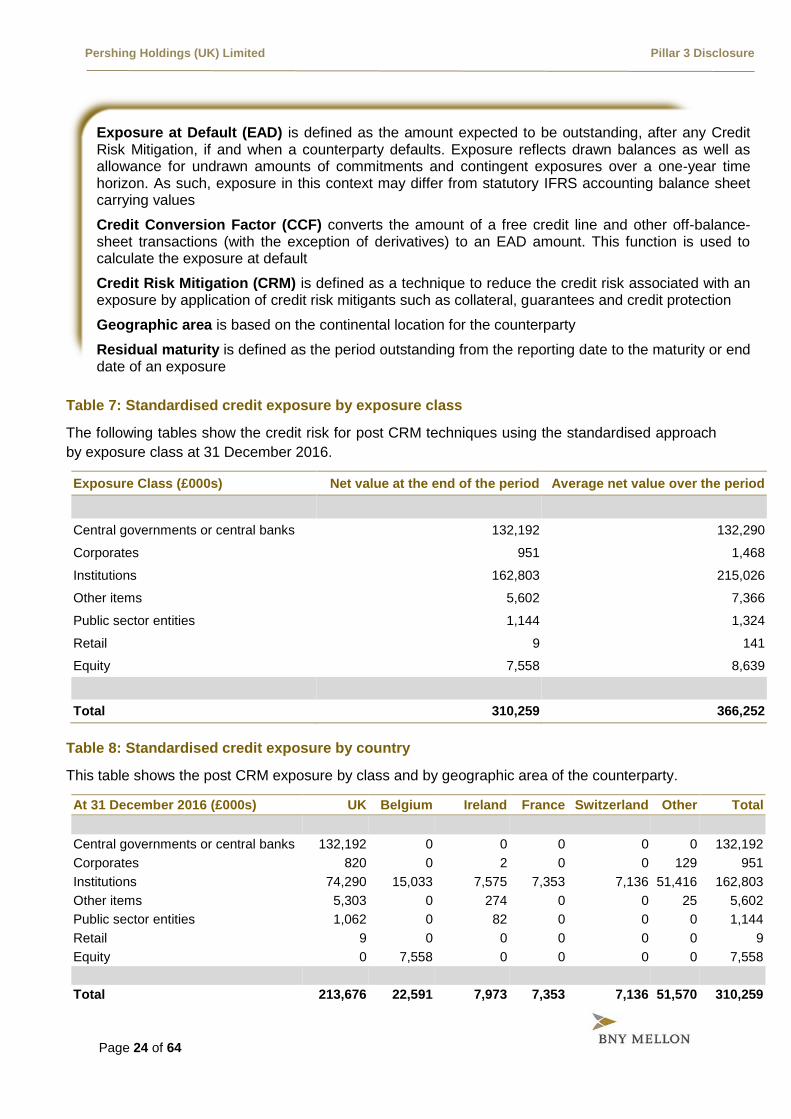
Table 7: Standardised credit exposure by exposure class
The following tables show the credit risk for post CRM techniques using the standardised approach
by exposure class at 31 December 2016.
Exposure Class (£000s) Net value at the end of the period Average net value over the period
Central governments or central banks 132,192 132,290
Corporates 951 1,468
Institutions 162,803 215,026
Other items 5,602 7,366
Public sector entities 1,144 1,324
Retail 9 141
Equity 7,558 8,639
Total 310,259 366,252
Table 8: Standardised credit exposure by country
This table shows the post CRM exposure by class and by geographic area of the counterparty.
At 31 December 2016 (£000s) UK Belgium Ireland France Switzerland Other Total
Central governments or central banks 132,192 0 0 0 0 0 132,192
Corporates 820 0 2 0 0 129 951
Institutions 74,290 15,033 7,575 7,353 7,136 51,416 162,803
Other items 5,303 0 274 0 0 25 5,602
Public sector entities 1,062 0 82 0 0 0 1,144
Retail 9 0 0 0 0 0 9
Equity 0 7,558 0 0 0 0 7,558
Total 213,676 22,591 7,973 7,353 7,136 51,570 310,259
Exposure at Default (EAD) is defined as the amount expected to be outstanding, after any Credit Risk Mitigation, if and when a counterparty defaults. Exposure reflects drawn balances as well as allowance for undrawn amounts of commitments and contingent exposures over a one-year time horizon. As such, exposure in this context may differ from statutory IFRS accounting balance sheet carrying values
Credit Conversion Factor (CCF) converts the amount of a free credit line and other off-balance-sheet transactions (with the exception of derivatives) to an EAD amount. This function is used to calculate the exposure at default
Credit Risk Mitigation (CRM) is defined as a technique to reduce the credit risk associated with an exposure by application of credit risk mitigants such as collateral, guarantees and credit protection
Geographic area is based on the continental location for the counterparty
Residual maturity is defined as the period outstanding from the reporting date to the maturity or end date of an exposure

Pershing Holdings (UK) Limited Pillar 3 Disclosure
Page 25 of 64
At 31 December 2015 (£000s) UK United States
Switzerland Belgium Netherlands Other Total
Central governments or central banks 133,634 0 0 0 0 0 133,634
Corporates 1,999 0 0 0 0 234 2,233
Institutions 30,929 6,422 6,013 4,874 4,273 17,612 70,123
Other items 5,500 0 0 0 0 446 5,946
Public sector entities 966 0 0 0 0 45 1,011
Retail 11 0 0 0 0 0 11
Equity 6,231 0 0 0 0 0 6,231
Total 179,270 6,422 6,013 4,874 4,273 18,337 219,189
Table 9: Standardised post mitigated credit exposures by counterparty type
This table shows the credit exposure post CRM classified by class and by counterparty type.
At 31 December 2016 (£000s) General
governments Credit
institutions Other financial
corporations Various balance
sheet Items Total
Central governments or central banks 132,192 0 0 0 132,192
Corporates 0 0 951 0 951
Institutions 0 162,803 0 0 162,803
Other items 0 0 0 5,602 5,602
Public sector entities 1,144 0 0 0 1,144
Retail 0 0 9 0 9
Equity 0 0 0 7,558 7,558
Total 133,336 162,803 960 13,160 310,259
Table 10: Standardised credit exposure by residual maturity
This table shows the exposure post credit risk mitigation, classified by credit exposure class and
residual maturity.
At 31 December 2016 (£000s) On
demand <= 1 year
> 1 year <= 5 years
> 5 years No stated
maturity Total
Central governments or central banks 0 66,948 65,244 0 0 132,192
Corporates 951 0 0 0 0 951
Institutions 162,803 0 0 0 0 162,803
Other items 0 0 0 0 5,602 5,602
Public sector entities 1,144 0 0 0 0 1,144
Retail 9 0 0 0 0 9
Equity 7,558 0 0 0 0 7,558
Total 172,465 66,948 65,244 0 5,602 310,259
Pershing Holdings (UK) Limited Pillar 3 Disclosure
Page 26 of 64
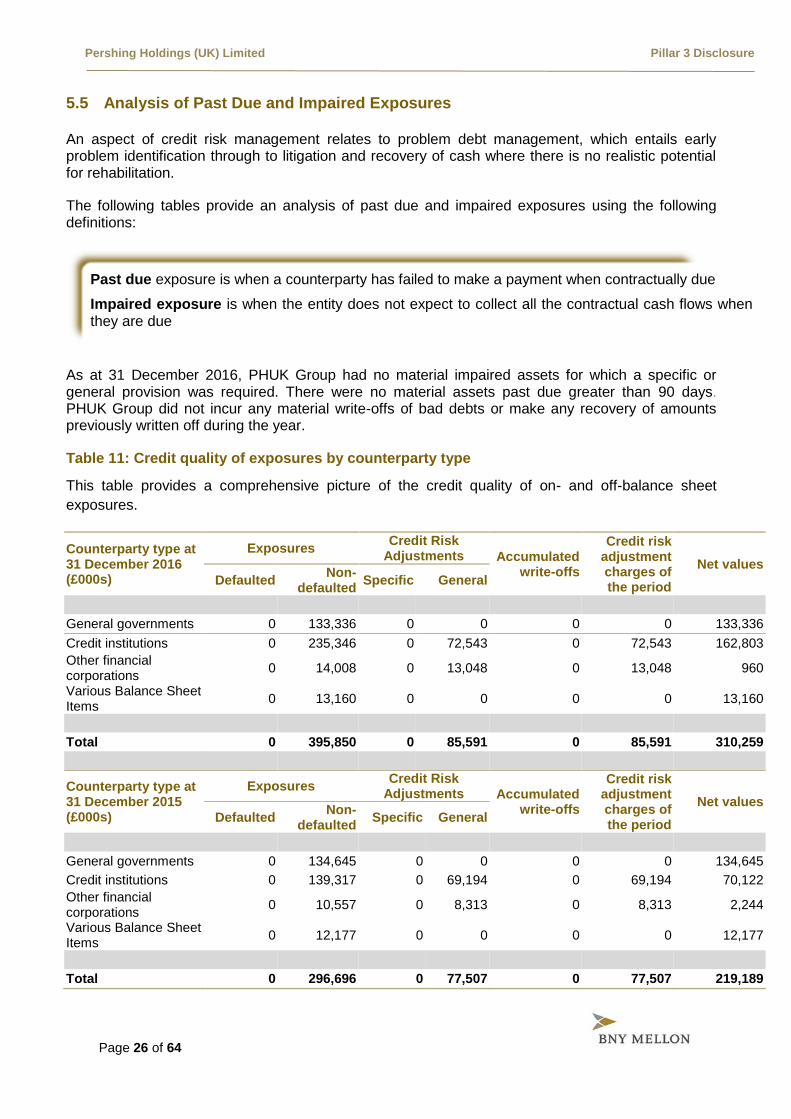
5.5 Analysis of Past Due and Impaired Exposures
An aspect of credit risk management relates to problem debt management, which entails early problem identification through to litigation and recovery of cash where there is no realistic potential for rehabilitation.
The following tables provide an analysis of past due and impaired exposures using the following definitions:
As at 31 December 2016, PHUK Group had no material impaired assets for which a specific or general provision was required. There were no material assets past due greater than 90 days. PHUK Group did not incur any material write-offs of bad debts or make any recovery of amounts previously written off during the year.
Table 11: Credit quality of exposures by counterparty type
This table provides a comprehensive picture of the credit quality of on- and off-balance sheet
exposures.
Counterparty type at 31 December 2016 (£000s)
Exposures Credit Risk
Adjustments Accumulated write-offs
Credit risk adjustment charges of the period
Net values
Defaulted Non-
defaulted Specific General
General governments 0 133,336 0 0 0 0 133,336
Credit institutions 0 235,346 0 72,543 0 72,543 162,803
Other financial corporations
0 14,008 0 13,048 0 13,048 960
Various Balance Sheet Items
0 13,160 0 0 0 0 13,160
Total 0 395,850 0 85,591 0 85,591 310,259
Counterparty type at 31 December 2015 (£000s)
Exposures Credit Risk
Adjustments Accumulated write-offs
Credit risk adjustment charges of the period
Net values
Defaulted Non-
defaulted Specific General
General governments 0 134,645 0 0 0 0 134,645
Credit institutions 0 139,317 0 69,194 0 69,194 70,122
Other financial corporations
0 10,557 0 8,313 0 8,313 2,244
Various Balance Sheet Items
0 12,177 0 0 0 0 12,177
Total 0 296,696 0 77,507 0 77,507 219,189
Past due exposure is when a counterparty has failed to make a payment when contractually due
Impaired exposure is when the entity does not expect to collect all the contractual cash flows when they are due

Pershing Holdings (UK) Limited Pillar 3 Disclosure
Page 27 of 64
Table 12: Credit quality of exposures by industry
This table provides a comprehensive picture of the credit quality of on- and off-balance sheet exposures by industry.
Industry type at 31 December 2016 (£000s)
Exposures Credit Risk
Adjustments Accumulated write-offs
Credit risk adjustment charges of the period
Net values
Defaulted Non-
defaulted Specific General
Financial and insurance activities
0 395,850 0 85,591 0 85,591 310,259
Other services 0 0 0 0 0 0 0
Total 0 395,850 0 85,591 0 85,591 310,259
Of which: Loans 0 0 0 0 0 0 0
Industry type at 31 December 2015 (£000s)
Exposures Credit Risk
Adjustments Accumulated write-offs
Credit risk adjustment charges of the period
Net values
Defaulted Non-
defaulted Specific General
Financial and insurance activities
0 296,696 0 77,507 0 77,507 219,189
Other services 0 0 0 0 0 0 0
Total 0 296,696 0 77,507 0 77,507 219,189
Of which: Loans 0 0 0 0 0 0 0
Table 13: Credit quality of exposures by geographical breakdown
This table shows an analysis of past due, impaired exposures and allowances by country using the IFRS methodology.
Counterparty type at 31 December 2016 (£000s)
Exposures Credit Risk
Adjustments Accumulated write-offs
Credit risk adjustment charges of the period
Net values
Defaulted Non-
defaulted Specific General
UK 0 277,171 0 50,736 0 50,736 226,435
Belgium 0 22,592 0 0 0 0 22,592
Ireland 0 12,543 0 4,610 0 4,610 7,933
France 0 7,354 0 1 0 1 7,353
Switzerland 0 7,141 0 5 0 5 7,136
Other 0 69,049 0 30,239 0 30,239 38,810
Total 0 395,850 0 85,591 0 85,591 310,259
Pershing Holdings (UK) Limited Pillar 3 Disclosure
Page 28 of 64
Counterparty type at 31 December 2015 (£000s)
Exposures Credit Risk
Adjustments Accumulated write-offs
Credit risk adjustment charges of the period
Net values
Defaulted Non-
defaulted Specific General
UK 0 198,082 0 18,812 0 18,812 179,270
United States 0 36,516 0 30,094 0 30,094 6,422
Switzerland 0 6,067 0 54 0 54 6,013
Belgium 0 4,875 0 0 0 0 4,875
Netherlands 0 4,274 0 1 0 1 4,273
Other 0 46,882 0 28,546 0 28,546 18,336
Total 0 296,696 0 77,507 0 77,507 219,189
Pershing Holdings (UK) Limited Pillar 3 Disclosure
Page 29 of 64
6 Credit Risk Mitigation
PHUK Group mitigates Credit Risk through a variety of strategies including obtaining collateral, and
indemnities from clients.
6.1 ISDA Master Agreements and Netting
The International Swaps and Derivatives Association (ISDA) Master Agreement incorporates schedules that allow the contracting parties to customise the terms and conditions to their mutual satisfaction to cover termination events, netting arrangements, security and other matters.
Netting may take two different forms, close-out netting and settlement netting. For Fx Forward business, PHUK adheres to the ISDA dispute resolution Stay Protocol whereby adopting institutions agree to obey resolution-related regulatory stays (up to 48 hours) imposed by any of 6 major jurisdictions with respect to other adopting institutions.
6.2 Collateral Valuation and Management
PHUK Group can receive collateral from a counterparty which can include guarantees, cash and both equity and debt securities and has the ability to call on this collateral in the event of a default by the counterparty.
Collateral amounts are adjusted on a daily basis to reflect market activity to ensure they continue to achieve an appropriate mitigation of risk value. Securities are marked-to-market daily and haircuts are applied to protect PHUK Group in the event of the value of the collateral suddenly reducing in value due to adverse market conditions. Customer agreements can include requirements for the provision of additional collateral should valuations decline.
6.3 Wrong-way Risk
PHUK Group takes particular care to ensure that wrong-way risk between collateral and exposures does not exist. Wrong-way risk results when the exposure to the counterparty increases when the counterparty’s credit quality deteriorates.
6.4 Credit Risk Concentration
Credit risk mitigation taken by PHUK Group to reduce Credit Risk may result in Credit Risk Concentration. Credit Concentration Risk results from concentration of exposures to a single counterparty, borrower or group of connected counterparties or borrowers.
PHUK Group is exposed to Credit Concentration Risk through exchanges and central counterparties, correspondent banks and issuers of securities. These risks are managed and mitigated through the establishment of various limits, on-going monitoring of exposure, collateral and contractual obligations upon the client, including margin calls.
The number of counterparties PHUK Group is willing to place funds with is limited and hence, concentration risk can arise from cash balances placed with a relatively small number of counterparties. To mitigate this, exposures are only placed on a very short-term basis, generally overnight (maximum of 180 days), ensuring ability to withdraw funds in a timely manner.

Pershing Holdings (UK) Limited Pillar 3 Disclosure
Page 30 of 64
Table 14: Credit risk mitigation techniques – overview
31 December 2016 (€000s)
Exposures unsecured:
carrying amount
Total Exposures
secured
Exposures secured by
collateral
Exposures secured by
financial guarantees
Exposures secured by
credit derivatives
Central governments or central banks
132,192 0 0 0 0
Corporates 8,314 7,338 7,338 0 0
Institutions 276,453 85,314 85,314 0 0
Other items 5,602 0 0 0 0
Public sector entities 1,144 0 0 0 0
Retail 12,370 12,337 12,337 0 0
Equity 7,558 0 0 0 0
Total exposures 443,633 104,989 104,989 0 0
Of which defaulted 0 0 0 0 0
Financial and other eligible collateral can include cash, debt securities, equities or gold, and their
values are taken into account for the purposes of calculating the risk weighted exposure amount of
the underlying exposure.
There are no exposures covered by guarantees or credit derivatives at 31 December 2016. Using
guarantees has the effect of replacing the risk weight of the underling exposure with that of the
institution providing the credit protection. Guarantors are primarily rated as investment grade.
Pershing Holdings (UK) Limited Pillar 3 Disclosure
Page 31 of 64
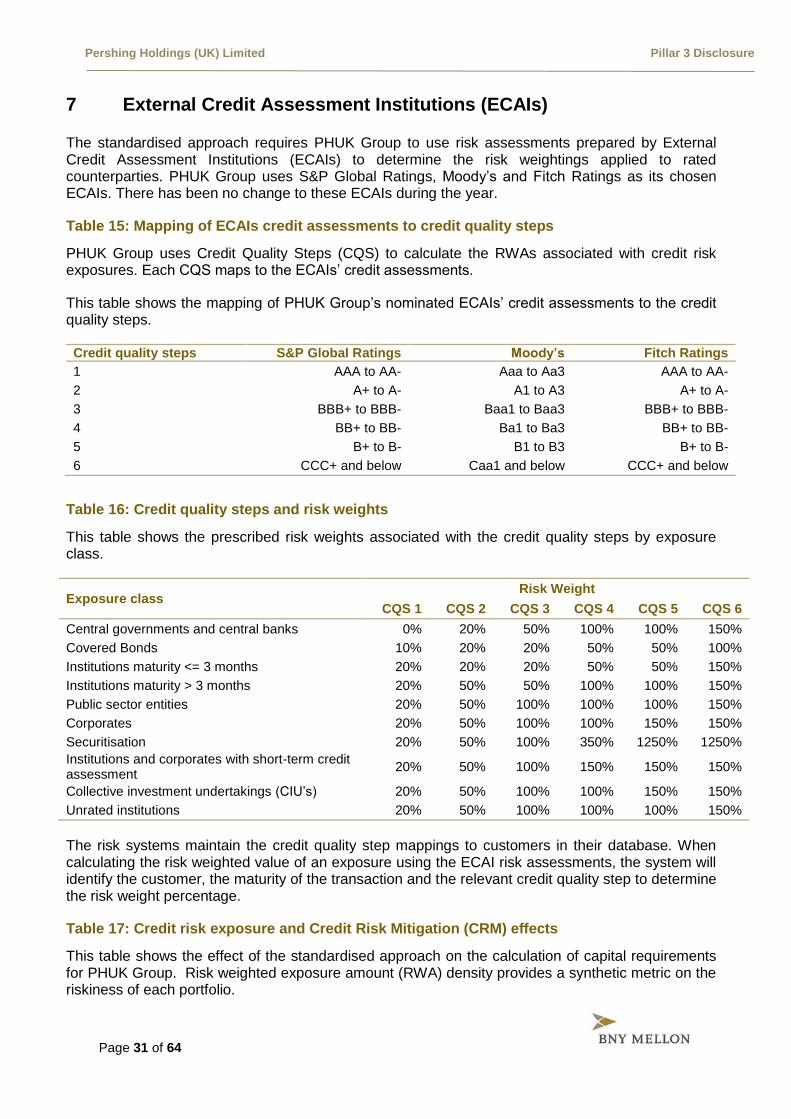
7 External Credit Assessment Institutions (ECAIs)
The standardised approach requires PHUK Group to use risk assessments prepared by External Credit Assessment Institutions (ECAIs) to determine the risk weightings applied to rated counterparties. PHUK Group uses S&P Global Ratings, Moody’s and Fitch Ratings as its chosen ECAIs. There has been no change to these ECAIs during the year.
Table 15: Mapping of ECAIs credit assessments to credit quality steps
PHUK Group uses Credit Quality Steps (CQS) to calculate the RWAs associated with credit risk exposures. Each CQS maps to the ECAIs’ credit assessments.
This table shows the mapping of PHUK Group’s nominated ECAIs’ credit assessments to the credit quality steps.
Credit quality steps S&P Global Ratings Moody’s Fitch Ratings
1 AAA to AA- Aaa to Aa3 AAA to AA-
2 A+ to A- A1 to A3 A+ to A-
3 BBB+ to BBB- Baa1 to Baa3 BBB+ to BBB-
4 BB+ to BB- Ba1 to Ba3 BB+ to BB-
5 B+ to B- B1 to B3 B+ to B-
6 CCC+ and below Caa1 and below CCC+ and below
Table 16: Credit quality steps and risk weights
This table shows the prescribed risk weights associated with the credit quality steps by exposure class.
Exposure class Risk Weight
CQS 1 CQS 2 CQS 3 CQS 4 CQS 5 CQS 6
Central governments and central banks 0% 20% 50% 100% 100% 150%
Covered Bonds 10% 20% 20% 50% 50% 100%
Institutions maturity <= 3 months 20% 20% 20% 50% 50% 150%
Institutions maturity > 3 months 20% 50% 50% 100% 100% 150%
Public sector entities 20% 50% 100% 100% 100% 150%
Corporates 20% 50% 100% 100% 150% 150%
Securitisation 20% 50% 100% 350% 1250% 1250%
Institutions and corporates with short-term credit assessment
20% 50% 100% 150% 150% 150%
Collective investment undertakings (CIU’s) 20% 50% 100% 100% 150% 150%
Unrated institutions 20% 50% 100% 100% 100% 150%
The risk systems maintain the credit quality step mappings to customers in their database. When calculating the risk weighted value of an exposure using the ECAI risk assessments, the system will identify the customer, the maturity of the transaction and the relevant credit quality step to determine the risk weight percentage.
Table 17: Credit risk exposure and Credit Risk Mitigation (CRM) effects
This table shows the effect of the standardised approach on the calculation of capital requirements for PHUK Group. Risk weighted exposure amount (RWA) density provides a synthetic metric on the riskiness of each portfolio.

Pershing Holdings (UK) Limited Pillar 3 Disclosure
Page 32 of 64
Exposure classes (£000s)
Exposures before CCF and CRM
Exposures post CCF and CRM
RWA RWA
density balance sheet amount
balance sheet amount
On- Off- On- Off-
Central governments or central banks 132,192 0 132,192 0 0 0%
Corporates 6,972 0 951 0 951 100%
Institutions 235,346 0 162,803 0 37,229 23%
Other items 5,602 0 5,602 0 5,602 100%
Public sector entities 1,144 0 1,144 0 1,817 159%
Retail 7,036 0 9 0 6 75%
Equity 7,558 0 7,558 0 7,558 100%
Total 395,850 0 310,259 0 53,163 17%
Table 18: Credit risk exposure by asset class and risk weight post CCF and CRM
This table shows the breakdown of exposures for after the application of both conversion factors and risk mitigation techniques.
Exposure Class at 31 December 2016 (£000s)
0% 20% 50% 75% 100% 150% 250% Total
Central governments or central banks
132,192 0 0 0 0 0 0 132,192
Corporates 0 0 0 0 951 0 0 951
Institutions 7,441 143,902 6,025 0 5,432 3 0 162,803
Other items 0 0 0 0 5,602 0 0 5,602
Public sector entities 0 454 0 0 0 0 690 1,144
Retail 0 0 0 9 0 0 0 0
Equity 0 0 0 0 0 7,558 0 7,558
Total 139,633 144,356 6,025 9 11,985 7,561 690 310,259
Exposure Class at 31 December 2015 (£000s)
0% 20% 50% 75% 100% 150% 250% Total
Central governments or central banks
133,634 0 0 0 0 0 0 133,634
Corporates 0 0 0 0 2,233 0 0 2,233
Institutions 0 59,579 9,754 0 665 125 0 70,123
Other items 0 0 0 0 5,946 0 0 5,946
Public sector entities 0 218 0 0 0 0 793 1,011
Retail 0 0 0 11 0 0 0 11
Equity 0 0 0 0 6,231 0 0 6,231
Total 133,634 59,797 9,754 11 15,075 125 793 219,189
Pershing Holdings (UK) Limited Pillar 3 Disclosure
Page 33 of 64
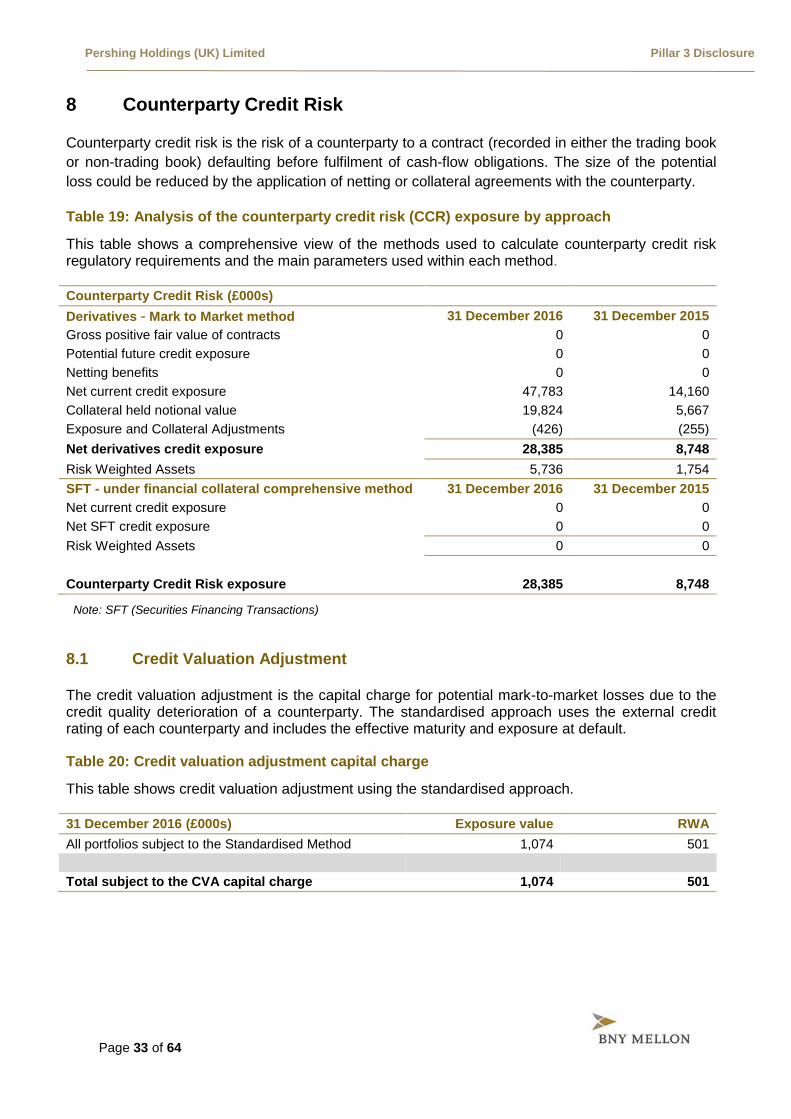
8 Counterparty Credit Risk
Counterparty credit risk is the risk of a counterparty to a contract (recorded in either the trading book
or non-trading book) defaulting before fulfilment of cash-flow obligations. The size of the potential
loss could be reduced by the application of netting or collateral agreements with the counterparty.
Table 19: Analysis of the counterparty credit risk (CCR) exposure by approach
This table shows a comprehensive view of the methods used to calculate counterparty credit risk regulatory requirements and the main parameters used within each method.
Counterparty Credit Risk (£000s)
Derivatives - Mark to Market method 31 December 2016 31 December 2015
Gross positive fair value of contracts 0 0
Potential future credit exposure 0 0
Netting benefits 0 0
Net current credit exposure 47,783 14,160
Collateral held notional value 19,824 5,667
Exposure and Collateral Adjustments (426) (255)
Net derivatives credit exposure 28,385 8,748
Risk Weighted Assets 5,736 1,754
SFT - under financial collateral comprehensive method 31 December 2016 31 December 2015
Net current credit exposure 0 0
Net SFT credit exposure 0 0
Risk Weighted Assets 0 0
Counterparty Credit Risk exposure 28,385 8,748
Note: SFT (Securities Financing Transactions)
8.1 Credit Valuation Adjustment
The credit valuation adjustment is the capital charge for potential mark-to-market losses due to the credit quality deterioration of a counterparty. The standardised approach uses the external credit rating of each counterparty and includes the effective maturity and exposure at default.
Table 20: Credit valuation adjustment capital charge
This table shows credit valuation adjustment using the standardised approach.
31 December 2016 (£000s) Exposure value RWA
All portfolios subject to the Standardised Method 1,074 501
Total subject to the CVA capital charge 1,074 501
Pershing Holdings (UK) Limited Pillar 3 Disclosure
Page 34 of 64
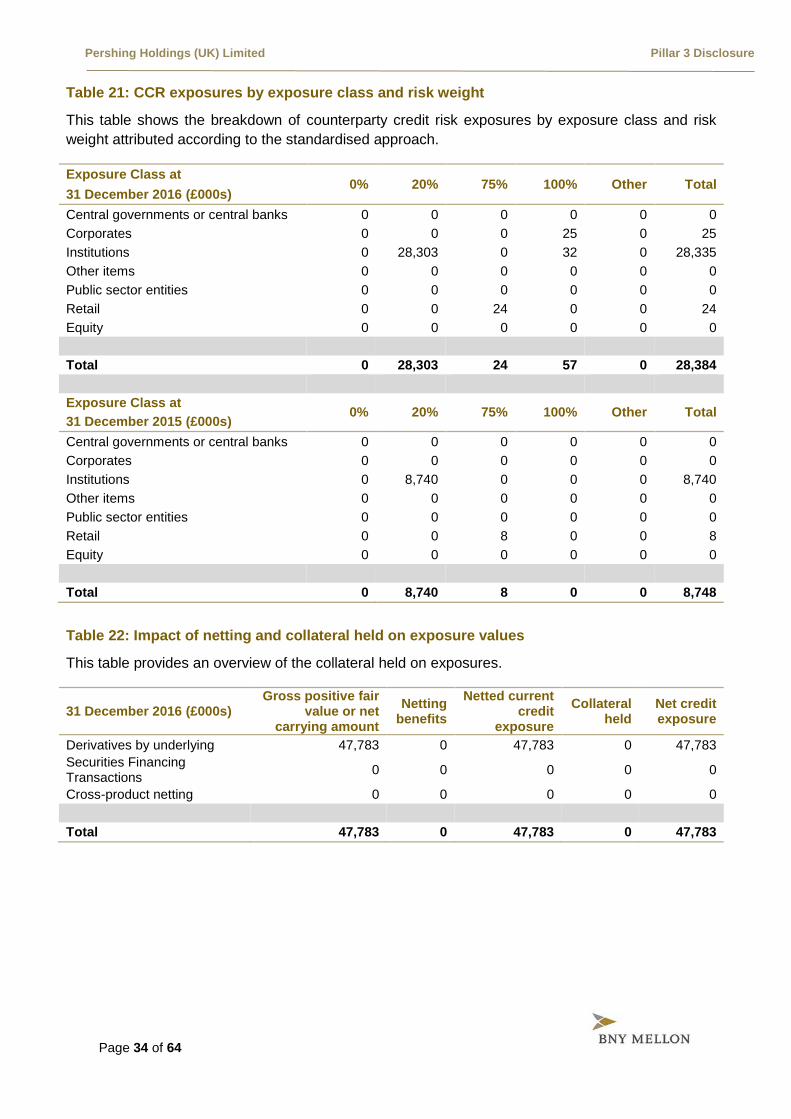
Table 21: CCR exposures by exposure class and risk weight
This table shows the breakdown of counterparty credit risk exposures by exposure class and risk
weight attributed according to the standardised approach.
Table 22: Impact of netting and collateral held on exposure values
This table provides an overview of the collateral held on exposures.
31 December 2016 (£000s) Gross positive fair
value or net carrying amount
Netting benefits
Netted current credit
exposure
Collateral held
Net credit exposure
Derivatives by underlying 47,783 0 47,783 0 47,783
Securities Financing Transactions
0 0 0 0 0
Cross-product netting 0 0 0 0 0
Total 47,783 0 47,783 0 47,783
Exposure Class at 0% 20% 75% 100% Other Total
31 December 2016 (£000s)
Central governments or central banks 0 0 0 0 0 0
Corporates 0 0 0 25 0 25
Institutions 0 28,303 0 32 0 28,335
Other items 0 0 0 0 0 0
Public sector entities 0 0 0 0 0 0
Retail 0 0 24 0 0 24
Equity 0 0 0 0 0 0
Total 0 28,303 24 57 0 28,384
Exposure Class at 0% 20% 75% 100% Other Total
31 December 2015 (£000s)
Central governments or central banks 0 0 0 0 0 0
Corporates 0 0 0 0 0 0
Institutions 0 8,740 0 0 0 8,740
Other items 0 0 0 0 0 0
Public sector entities 0 0 0 0 0 0
Retail 0 0 8 0 0 8
Equity 0 0 0 0 0 0
Total 0 8,740 8 0 0 8,748
Pershing Holdings (UK) Limited Pillar 3 Disclosure
Page 35 of 64
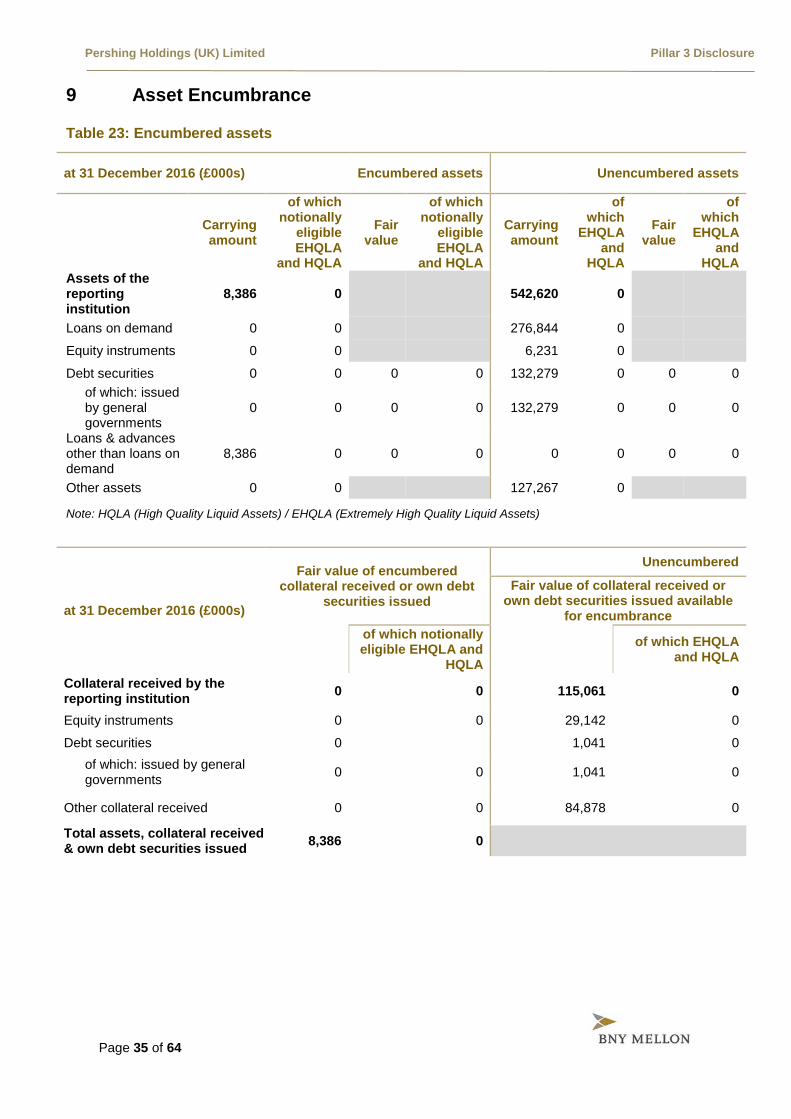
9 Asset Encumbrance
Table 23: Encumbered assets
at 31 December 2016 (£000s) Encumbered assets Unencumbered assets
Carrying amount
of which notionally
eligible EHQLA
and HQLA
Fair value
of which notionally
eligible EHQLA
and HQLA
Carrying amount
of which
EHQLA and
HQLA
Fair value
of which
EHQLA and
HQLA Assets of the reporting institution
8,386 0 542,620 0
Loans on demand 0 0 276,844 0
Equity instruments 0 0 6,231 0
Debt securities 0 0 0 0 132,279 0 0 0
of which: issued by general governments
0 0 0 0 132,279 0 0 0
Loans & advances other than loans on demand
8,386 0 0 0 0 0 0 0
Other assets 0 0 127,267 0
Note: HQLA (High Quality Liquid Assets) / EHQLA (Extremely High Quality Liquid Assets)
at 31 December 2016 (£000s)
Fair value of encumbered collateral received or own debt
securities issued
Unencumbered
Fair value of collateral received or own debt securities issued available
for encumbrance
of which notionally eligible EHQLA and
HQLA
of which EHQLA and HQLA
Collateral received by the reporting institution
0 0 115,061 0
Equity instruments 0 0 29,142 0
Debt securities 0 1,041 0
of which: issued by general governments
0 0 1,041 0
Other collateral received 0 0 84,878 0
Total assets, collateral received & own debt securities issued
8,386 0
Pershing Holdings (UK) Limited Pillar 3 Disclosure
Page 36 of 64
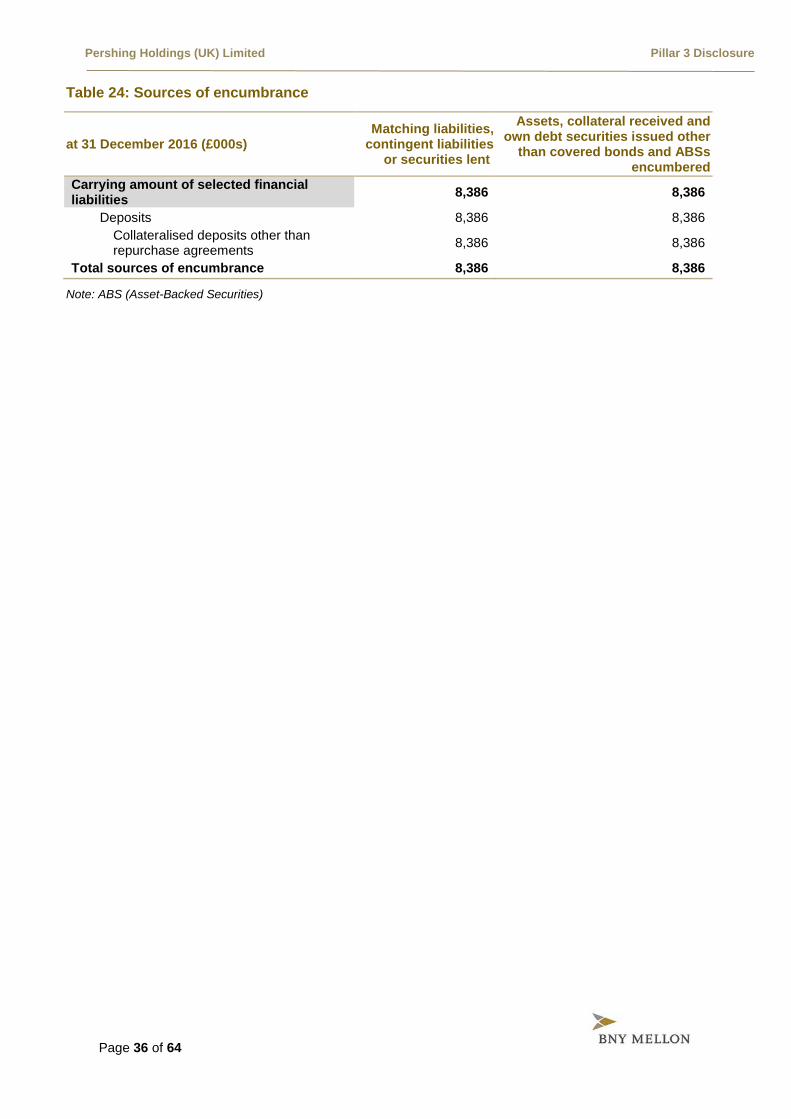
Table 24: Sources of encumbrance
at 31 December 2016 (£000s) Matching liabilities,
contingent liabilities or securities lent
Assets, collateral received and own debt securities issued other
than covered bonds and ABSs encumbered
Carrying amount of selected financial liabilities
8,386 8,386
Deposits 8,386 8,386
Collateralised deposits other than repurchase agreements
8,386 8,386
Total sources of encumbrance 8,386 8,386
Note: ABS (Asset-Backed Securities)
Pershing Holdings (UK) Limited Pillar 3 Disclosure
Page 37 of 64
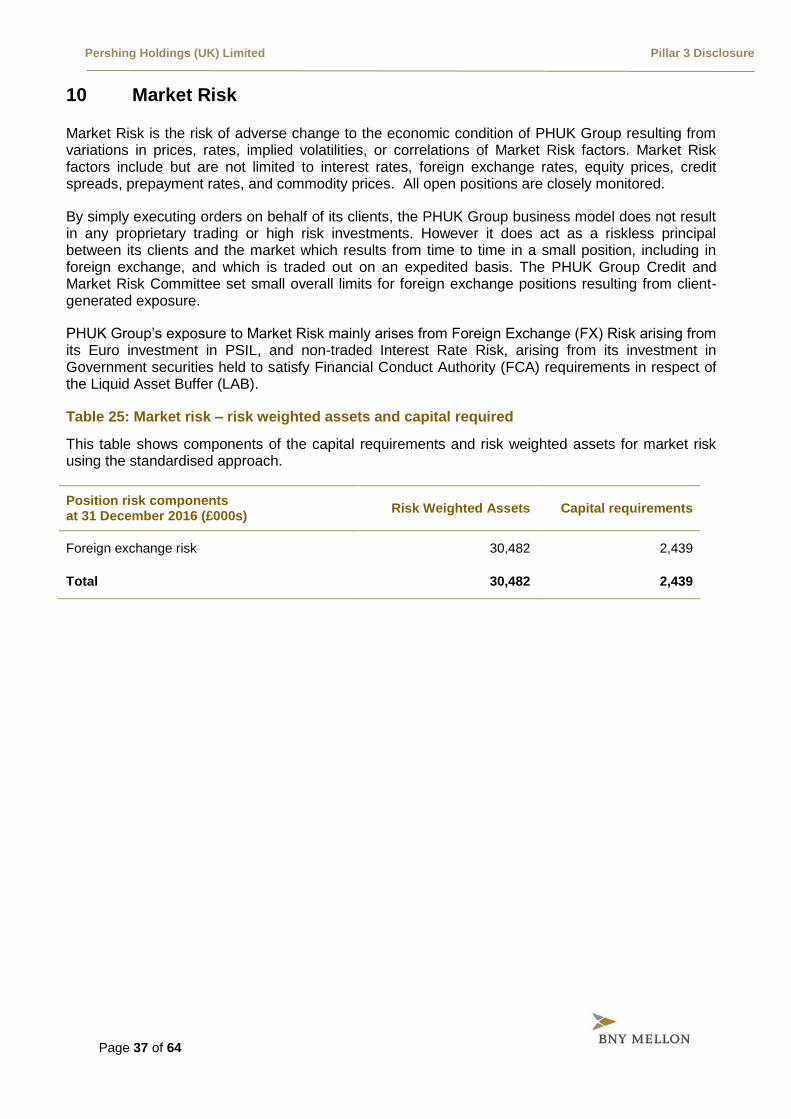
10 Market Risk
Market Risk is the risk of adverse change to the economic condition of PHUK Group resulting from variations in prices, rates, implied volatilities, or correlations of Market Risk factors. Market Risk factors include but are not limited to interest rates, foreign exchange rates, equity prices, credit spreads, prepayment rates, and commodity prices. All open positions are closely monitored.
By simply executing orders on behalf of its clients, the PHUK Group business model does not result in any proprietary trading or high risk investments. However it does act as a riskless principal between its clients and the market which results from time to time in a small position, including in foreign exchange, and which is traded out on an expedited basis. The PHUK Group Credit and Market Risk Committee set small overall limits for foreign exchange positions resulting from client-generated exposure.
PHUK Group’s exposure to Market Risk mainly arises from Foreign Exchange (FX) Risk arising from its Euro investment in PSIL, and non-traded Interest Rate Risk, arising from its investment in Government securities held to satisfy Financial Conduct Authority (FCA) requirements in respect of the Liquid Asset Buffer (LAB).
Table 25: Market risk – risk weighted assets and capital required
This table shows components of the capital requirements and risk weighted assets for market risk using the standardised approach.
Position risk components at 31 December 2016 (£000s)
Risk Weighted Assets Capital requirements
Foreign exchange risk 30,482 2,439
Total 30,482 2,439

Pershing Holdings (UK) Limited Pillar 3 Disclosure
Page 38 of 64
11 Interest Rate Risk – Non-Trading Book
Interest Rate Risk (IRR) is the risk associated with changes in interest rates that affect net interest income (NII) from interest-earning assets and interest-paying liabilities. IRR exposure in the non-trading book arises from on and off-balance sheet assets and liabilities and changes with movements in domestic and foreign interest rates.
PHUK Group does not have any material exposure to Interest Rate Risk in its non- trading book.

Pershing Holdings (UK) Limited Pillar 3 Disclosure
Page 39 of 64
12 Operational Risk
Operational risk is the risk of loss resulting from inadequate or failed internal processes, people, systems, or from external events (including legal risk but excluding strategic and reputation risk).
Operational risk may arise from errors in transaction processing, breaches of internal control, systems and compliance requirements, internal or external fraud, damage to physical assets, and/or business disruption due to systems failures or other events. Operational risk can also arise from potential legal or regulatory actions as a consequence of non-compliance with regulatory requirements, prudent ethical standards or contractual obligations.
12.1 Operational Risk Management Framework
The Operational Risk Management Framework (ORMF) provides the processes and tools necessary to manage risk through a culture of risk awareness, a clear governance structure, well defined policies, procedures and reporting and suitable tools for reporting and monitoring to effectively identify, manage, mitigate, monitor and report the risks in an organised way to the appropriate governance bodies. PHUK Group has set a risk appetite statement which recognises the inherent nature of Operational Risk and the reliance on the ORMF to mitigate it.
The ORMF defines roles and responsibilities through the global policy, using the three lines of defence model as a foundation. Thus, responsibility for the management of Operational Risk sits first and foremost with the business and functions.
The first line is principally the businesses and business process owners, who are responsible for identifying and managing the risks inherent in the products, activities, processes and systems for which they are accountable throughout the course of their business activities.
The second line of defence, the independent Operational Risk Management function, is responsible for reviewing and challenging the risks identified, assessed and managed by the first line of defence. The Operational Risk function is also responsible for building and maintaining the ORMF framework and partnering the first line of defence to enable them to embed it.
The third line of defence is Internal Audit (organisationally independent from both the first and second line of defence). A key responsibility of the third line as it pertains to the ORMF is to opine on the adequacy of the framework and governance process.
Therefore, the monitoring and reporting of operational risks occurs within the business and PHUK Group risk oversight functions as well as decision-making forums, such as the Pershing Risk Committee.
In order to continually reduce the likelihood of adverse impacts from operational failures and to aid the continued identification, evaluation, mitigation, and re-assessment of risks and controls, the activities defined in the ORMF policy are:
Pershing Holdings (UK) Limited Pillar 3 Disclosure
Page 40 of 64
PHUK Group‘s ORMF relies on a culture of risk awareness, a clear governance structure and Operational Risk policies and procedures, which define the roles and responsibilities of the first, second and third lines of defence. These policies and procedures complement each other to ensure that the operational risks of the business are effectively identified, managed, mitigated (where possible) and reported to the appropriate governance committees on a monthly basis.
PHUK Group uses the ORMF to capture, analyse and monitor its operational risks, including Operational Risk Events, Risk Control Self-Assessments, Key Risk Indicators and Operational Risk Scenarios. Below is an explanation of how these tools are used to manage the operational risks of the business.
Operational Risk Events (OREs) - a standard for the capture, notification and reporting of OREs. The collection of internal loss data provides information for assessing the company’s exposure to Operational Risk. Analysis of loss events provides insight into the root cause and information on whether a control weakness is isolated or potentially more systemic.
Risk and Control Self-Assessments (RCSAs) – a comprehensive process for business groups and select business partners to identify risks associated with key business processes, identifying and assessing the quality of controls in place to mitigate risk and assigning accountability for the effective operation of those controls in place to mitigate that risk.
Key Risk Indicators (KRIs) – The use of key metrics designed to monitor risks which could cause financial loss, adverse consequences or reputation damage to the Company. Periodic and consistent monitoring of KRIs ensures that deviations from predetermined standards can be identified, managed and mitigated.
Operational Risk Scenario Analysis (ORSA) - Operational risk scenario analysis is used to forecast the significant forward looking operational risks by combining operational risk data with expert management judgement.
These risk management processes are mandated through individual Operational Risk Polices. PHUK Group also uses the BNY Mellon group system of record, the Risk Management Platform (RMP), to facilitate many of these processes.
PHUK Group also maintains a risk register which captures the most material risks associated with the business undertaken and the risk mitigations currently in place. The risk register is updated on a monthly basis.
Current issues, emerging and top risks, adverse KRIs and OREs (>$10,000) are reported to the PHUK Group Risk Committee.
Risk managers are assigned to oversee the risk management activities undertaken in the business of PHUK Group. Besides the operational risk function, other internal functions also ensure that
Identify and understand key business processes and risks
Design and document controls
Execute the controls
Monitor key risk indicators
Report key risk indicator performance, issues and actions to resolve
Elevate concerns
Strengthen controls
Re-assess and update when necessary
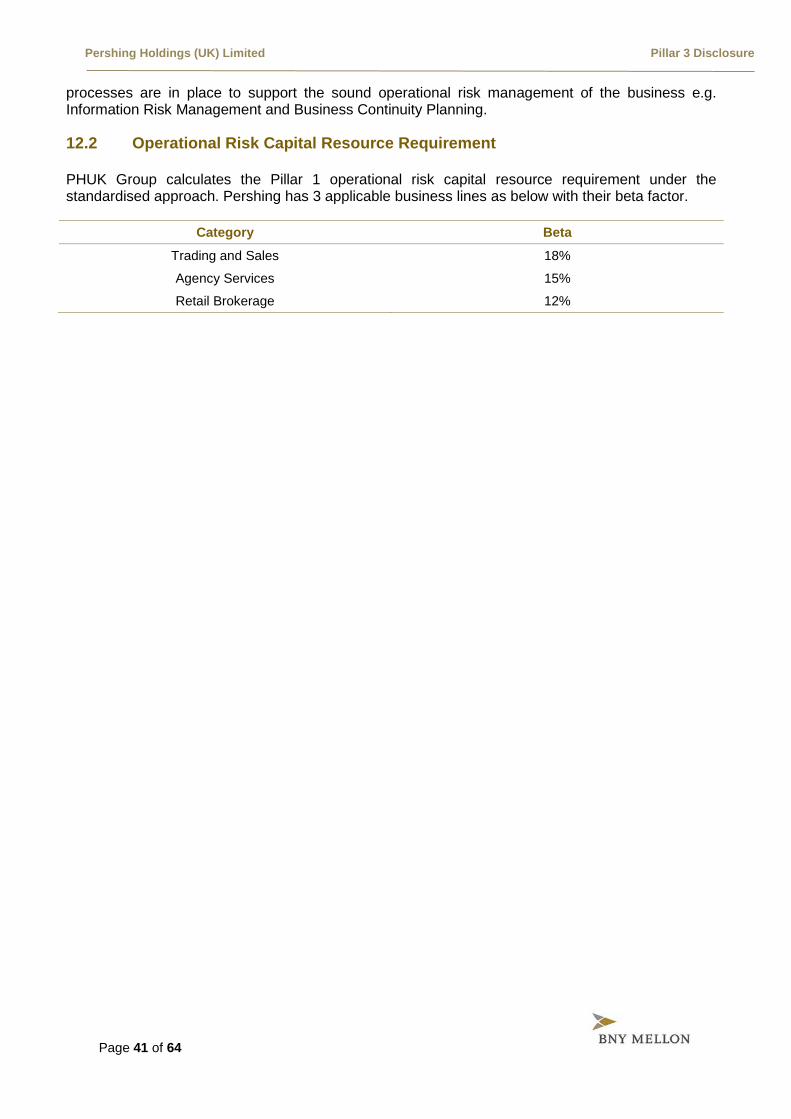
Pershing Holdings (UK) Limited Pillar 3 Disclosure
Page 41 of 64
processes are in place to support the sound operational risk management of the business e.g. Information Risk Management and Business Continuity Planning.
12.2 Operational Risk Capital Resource Requirement
PHUK Group calculates the Pillar 1 operational risk capital resource requirement under the standardised approach. Pershing has 3 applicable business lines as below with their beta factor.
Category Beta
Trading and Sales 18%
Agency Services 15%
Retail Brokerage 12%
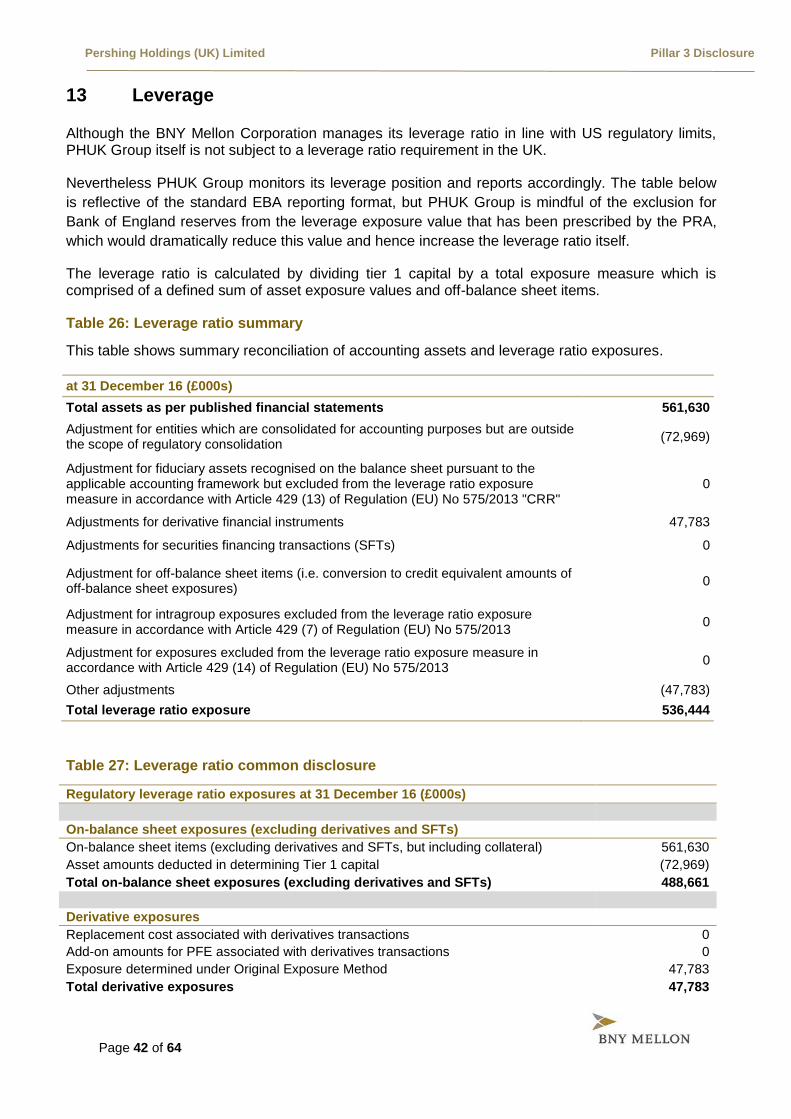
Pershing Holdings (UK) Limited Pillar 3 Disclosure
Page 42 of 64
13 Leverage
Although the BNY Mellon Corporation manages its leverage ratio in line with US regulatory limits, PHUK Group itself is not subject to a leverage ratio requirement in the UK.
Nevertheless PHUK Group monitors its leverage position and reports accordingly. The table below
is reflective of the standard EBA reporting format, but PHUK Group is mindful of the exclusion for
Bank of England reserves from the leverage exposure value that has been prescribed by the PRA,
which would dramatically reduce this value and hence increase the leverage ratio itself.
The leverage ratio is calculated by dividing tier 1 capital by a total exposure measure which is comprised of a defined sum of asset exposure values and off-balance sheet items.
Table 26: Leverage ratio summary
This table shows summary reconciliation of accounting assets and leverage ratio exposures.
at 31 December 16 (£000s)
Total assets as per published financial statements 561,630
Adjustment for entities which are consolidated for accounting purposes but are outside the scope of regulatory consolidation
(72,969)
Adjustment for fiduciary assets recognised on the balance sheet pursuant to the applicable accounting framework but excluded from the leverage ratio exposure measure in accordance with Article 429 (13) of Regulation (EU) No 575/2013 "CRR"
0
Adjustments for derivative financial instruments 47,783
Adjustments for securities financing transactions (SFTs) 0
Adjustment for off-balance sheet items (i.e. conversion to credit equivalent amounts of off-balance sheet exposures)
0
Adjustment for intragroup exposures excluded from the leverage ratio exposure measure in accordance with Article 429 (7) of Regulation (EU) No 575/2013
0
Adjustment for exposures excluded from the leverage ratio exposure measure in accordance with Article 429 (14) of Regulation (EU) No 575/2013
0
Other adjustments (47,783)
Total leverage ratio exposure 536,444
Table 27: Leverage ratio common disclosure
Regulatory leverage ratio exposures at 31 December 16 (£000s)
On-balance sheet exposures (excluding derivatives and SFTs)
On-balance sheet items (excluding derivatives and SFTs, but including collateral) 561,630
Asset amounts deducted in determining Tier 1 capital (72,969)
Total on-balance sheet exposures (excluding derivatives and SFTs) 488,661
Derivative exposures
Replacement cost associated with derivatives transactions 0
Add-on amounts for PFE associated with derivatives transactions 0
Exposure determined under Original Exposure Method 47,783
Total derivative exposures 47,783
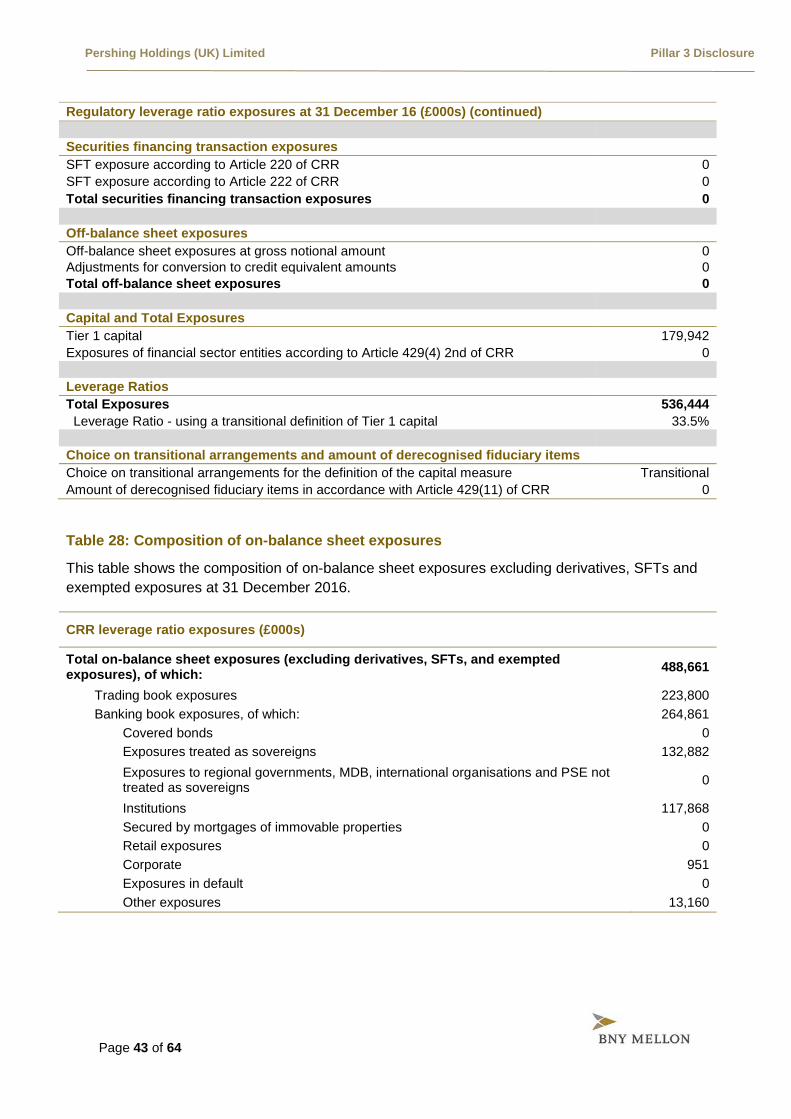
Pershing Holdings (UK) Limited Pillar 3 Disclosure
Page 43 of 64
Regulatory leverage ratio exposures at 31 December 16 (£000s) (continued)
Securities financing transaction exposures
SFT exposure according to Article 220 of CRR 0
SFT exposure according to Article 222 of CRR 0
Total securities financing transaction exposures 0
Off-balance sheet exposures
Off-balance sheet exposures at gross notional amount 0
Adjustments for conversion to credit equivalent amounts 0
Total off-balance sheet exposures 0
Capital and Total Exposures
Tier 1 capital 179,942
Exposures of financial sector entities according to Article 429(4) 2nd of CRR 0
Leverage Ratios
Total Exposures 536,444
Leverage Ratio - using a transitional definition of Tier 1 capital 33.5%
Choice on transitional arrangements and amount of derecognised fiduciary items
Choice on transitional arrangements for the definition of the capital measure Transitional
Amount of derecognised fiduciary items in accordance with Article 429(11) of CRR 0
Table 28: Composition of on-balance sheet exposures
This table shows the composition of on-balance sheet exposures excluding derivatives, SFTs and
exempted exposures at 31 December 2016.
CRR leverage ratio exposures (£000s)
Total on-balance sheet exposures (excluding derivatives, SFTs, and exempted exposures), of which:
488,661
Trading book exposures 223,800
Banking book exposures, of which: 264,861
Covered bonds 0
Exposures treated as sovereigns 132,882
Exposures to regional governments, MDB, international organisations and PSE not treated as sovereigns
0
Institutions 117,868
Secured by mortgages of immovable properties 0
Retail exposures 0
Corporate 951
Exposures in default 0
Other exposures 13,160
Pershing Holdings (UK) Limited Pillar 3 Disclosure
Page 44 of 64
14 Remuneration Disclosure
14.1 Governance
The governance of remuneration matters for BNYM and its group entities, including Pershing, is overseen by four committees, each with separate responsibilities in respect of remuneration as summarised below:
Human Resources and Compensation Committee (“HRCC”) of BNYM is responsible for overseeing BNYM’s employee compensation and benefits policies and programmes globally. It reviews and is responsible for the compensation plans, policies and programs in which the senior officers participate and has general oversight for the other incentive, retirement, welfare and equity arrangements for all employees globally. The members of the HRCC are non-executive members of the BNYM’s Board of Directors, acting on behalf of the BNYM Board of Directors.
Compensation Oversight Committee (“COC”) of BNYM is responsible for providing formal input to the remuneration decision-making process (including through the review of remuneration policies for BNYM), which includes reviewing and approving both remuneration arrangements annually and any significant changes proposed to remuneration arrangements (including termination of any arrangement) and advising the HRCC of any remuneration-related issues. The members of the COC are members of management of BNYM, including the Chief Human Resources Officer, the Chief Risk Officer, the Chief Financial Officer and the Chief Enterprise Risk Officer.
EMEA Remuneration Governance Committee (“ERGC”) is a regional governance committee that was established to ensure alignment of remuneration arrangements operated within BNYM EMEA with local laws and regulations impacting on remuneration. The ERGC is responsible for ensuring that local BNYM EMEA offices implement processes and practices that are consistent with the requirements of local regulators and also have oversight of the functioning and decisions taken by the Remuneration Committees of subsidiaries of BNYM (excluding IM), which are incorporated within the EMEA region, with the exclusion of oversight over individual award decisions.
Incentive Compensation Review Committee (“ICRC”) is the coordinating body of senior executives responsible for the oversight of the process to evaluate and recommend compensation reductions for all employees. These decisions are based on feedback regarding risk, compliance, audit and legal outcomes as well as situations of an employee engaged in fraud or directly or indirectly to have contributed to a financial restatement or other irregularity. The ICRC is a management-level committee that reports its recommendations to the HRCC. Ex ante adjustments are recommended by the employee’s management for review and approval by the committee and ex post adjustments are formulated by the committee. The Chief Human Resources Officer chairs the committee supported by the Global Head of Compensation and Benefits. Voting members include the Chief Executive Officer, Chief Risk Officer, Chief Compliance Officer, Chief Auditor, Chief Financial Officer and General Counsel.
BNYM undergoes an annual attestation process to ensure that its remuneration practices comply with all local laws and regulations as well as best market practice. The implementation of BNYM’s remuneration policies is subject to an annual independent internal review by the internal audit function. External consultants, PwC, were in 2016 engaged in respect of, and provided, initial and high level advice on the remuneration policy developed by the firm.
14.2 Aligning Pay with Performance
BNY Mellon’s compensation philosophy is to offer a total compensation opportunity that supports our values, client focus, integrity, teamwork and excellence. We pay for performance, both at the individual and corporate level. We value individual and team contributions and reward based on how both contribute to business results. In support of this philosophy, variable compensation is used as a means of recognising performance.

Pershing Holdings (UK) Limited Pillar 3 Disclosure
Page 45 of 64
Through our compensation philosophy and principles, we align the interests of our employees and shareholders by encouraging actions that contribute to superior financial performance and long-term shareholder value; by rewarding success; and by ensuring that our incentive compensation arrangements do not encourage our employees to take unnecessary and excessive risks that threaten the value of BNY Mellon or benefit individual employees at the expense of shareholders or other stakeholders. Our compensation structure is comprised of an appropriate mix of fixed and variable compensation that is paid over time. We aim to ensure that both fixed and variable compensation are consistent with business and market practice, fixed compensation is sufficient to provide for a fully flexible variable compensation program, and variable compensation is in the form of annual and/or long-term incentives, and, where appropriate, granted over equity to align employee remuneration with that of shareholder growth.
14.3 Fixed Remuneration
Fixed remuneration is composed of (i) salary, (ii) any additional non-performance related amounts paid as a result of contractual obligations or applicable law, or as a result of market practice, including role-based allowances, and (iii) any benefits in kind which are awarded as a result of the responsibilities of the job rather than the performance within the job.
The fixed remuneration of an employee is determined by the job performed, its level of complexity and responsibility, and the remuneration paid in the market for that type of job. It is set, for all staff, at a rate to be at all times sufficient to provide for full flexibility with regards to any variable remuneration element, including zero variable remuneration.
Employees who are directors of other BNY Mellon group entities are not remunerated separately in their capacity as a director of those entities. Independent directors of BNY Mellon only receive fixed remuneration, as disclosed in our annual Proxy Statement to shareholders.
14.4 Ratio between Fixed and Variable Pay
In respect of remuneration to material risk takers (“MRTs”) as determined under the requirements of the Prudential Regulation Authority (PRA) and FCA, the shareholder of Pershing, The Bank of New York Mellon Corporation, approved an increase in the maximum ratio of Variable to Fixed pay from 100% to 200%. This increase was confirmed by the HRCC on 27 January 2014 on the grounds that the increased ratio would not affect the firm’s ability to maintain a sound capital base and allows for appropriate incentivisation and reward in accordance with our Pay for Performance philosophy.
14.5 Variable Compensation Funding and Risk Adjustment
The employees of Pershing are eligible to be awarded variable compensation but have no entitlement to such awards which are discretionary in nature.
In general, the incentive pools for the business lines are based on the profitability of each business line, with the potential for adjustment by the COC on the basis of a number of factors, including risk management.
Typically, the line of business incentive plans are determined primarily based on pre-tax income, which is a profit rather than revenue based measure. The plans are subject to discretionary adjustment by the business head, COC and HRCC based on factors in assessing the earnings including (but not limited to) significant non-recurring activity, market conditions, interest and currency rates.
The incentive pools for the business partner groups are based on a management approved fixed pool, adjusted for a number of factors, including corporate performance and risk management.
Variable compensation may consist of both cash and equity and both upfront and deferred components and is determined by the functional hierarchy of the business or business partner
Pershing Holdings (UK) Limited Pillar 3 Disclosure
Page 46 of 64
service to which the individual staff member belongs, and in accordance with the terms and conditions of the incentive compensation plan that is applicable for the business or business partner service.
For MRTs, the variable compensation portion of an award comprises four different parts: upfront cash, upfront equity, deferred cash and deferred equity, in order to comply with local regulations. The deferred compensation component awarded in the form of BNY Mellon restricted stock units aligns a portion of the variable compensation award with the management of longer-term business risk.
To ensure effective risk adjustment, BNY Mellon requires employees who receive variable remuneration awards (both upfront and deferred) to agree to forfeiture and clawback of such awards in the event of fraud, misconduct or actions contributing to the detriment of business interests, including competing with the business and soliciting employees or clients. Where required by regulations, awards to MRTs are subject to more stringent risk adjustment, including, but not limited to, forfeiture and clawback in the event of employee misbehaviour, material error, material downturn in business unit performance or a material failure of risk management.
14.6 Deferral Policy and Vesting Criteria
For more senior-level employees, a portion of variable compensation will be deferred, under ordinary circumstances for a period of at least three years with vesting on an annual one-third basis (albeit such compensation may be deferred for longer periods and with a revised vesting schedule, and, for MRTs, in line with regulatory requirements), and will normally be subject to the employee remaining in employment until the deferred payment date (unless provided otherwise under national law). The deferred component of the variable compensation award is usually delivered as restricted stock units whose value is linked to BNY Mellon’s share price. The percentage of the variable compensation award to be deferred depends on the level and responsibility of the individual’s role (including if they are a MRT), regulatory requirements and the amount and value of the award.
14.7 Variable Remuneration of Control Function Staff
The variable compensation awarded to control function staff (for example: audit, compliance and risk) is dependent on performance that is assessed according to the achievement of objectives specific to their functional role that is independent of the activities they oversee. Remuneration is benchmarked against the market level and funded independently of individual business line results and adjusted based on BNY Mellon’s overall annual financial performance.
14.8 Quantitative Disclosures
The tables below provide details of the aggregate remuneration of senior management and MRTs for Pershing for the year ending 31 December 2016.
The figures illustrate figures from three Pershing financial legal entities:
For completeness, this group of staff is limited to those identified as MRTs. The remuneration amounts are presented on a gross basis, regardless of the time spent by BNY Mellon staff in respect of Pershing to reflect the full reporting period.
Pershing Ltd
Pershing Securities International Ltd
Pershing (Channel Islands) Ltd
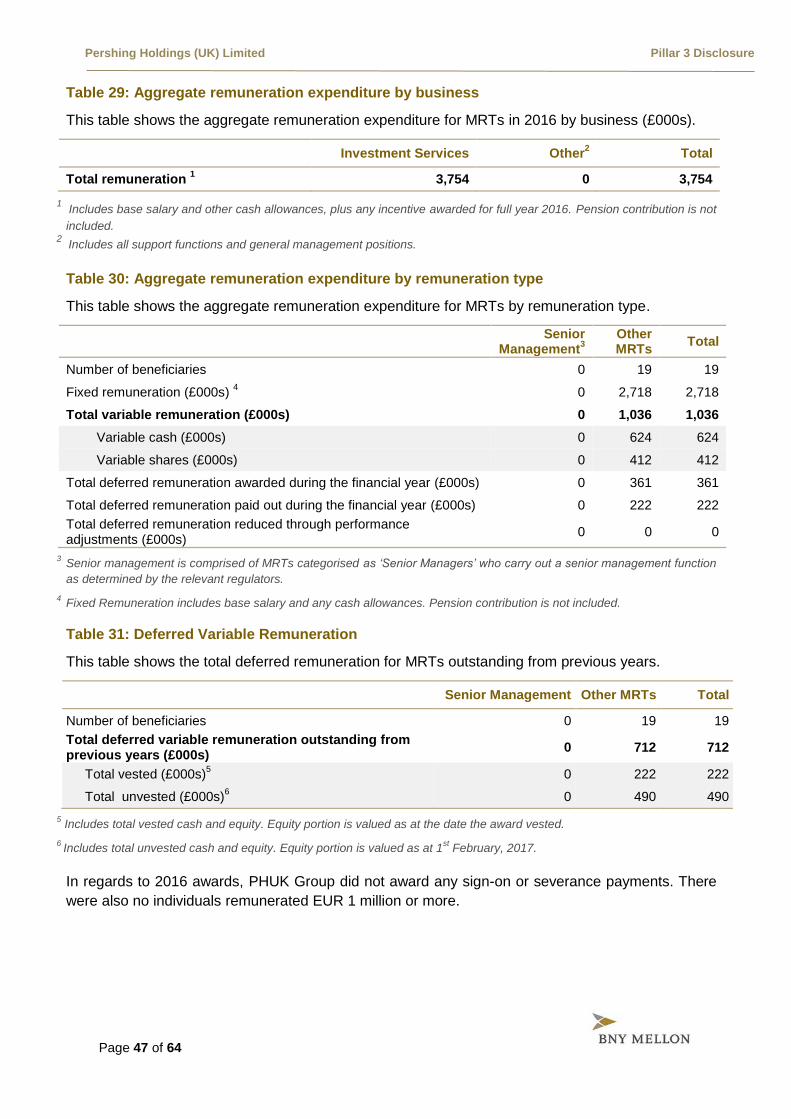
Pershing Holdings (UK) Limited Pillar 3 Disclosure
Page 47 of 64
Table 29: Aggregate remuneration expenditure by business
This table shows the aggregate remuneration expenditure for MRTs in 2016 by business (£000s).
Investment Services Other
2 Total
Total remuneration 1 3,754 0 3,754
1 Includes base salary and other cash allowances, plus any incentive awarded for full year 2016. Pension contribution is not
included. 2 Includes all support functions and general management positions.
Table 30: Aggregate remuneration expenditure by remuneration type
This table shows the aggregate remuneration expenditure for MRTs by remuneration type.
Senior
Management3
Other MRTs
Total
Number of beneficiaries 0 19 19
Fixed remuneration (£000s) 4 0 2,718 2,718
Total variable remuneration (£000s) 0 1,036 1,036
Variable cash (£000s) 0 624 624
Variable shares (£000s) 0 412 412
Total deferred remuneration awarded during the financial year (£000s) 0 361 361
Total deferred remuneration paid out during the financial year (£000s) 0 222 222
Total deferred remuneration reduced through performance adjustments (£000s)
0 0 0
3 Senior management is comprised of MRTs categorised as ‘Senior Managers’ who carry out a senior management function
as determined by the relevant regulators.
4 Fixed Remuneration includes base salary and any cash allowances. Pension contribution is not included.
Table 31: Deferred Variable Remuneration
This table shows the total deferred remuneration for MRTs outstanding from previous years.
Senior Management Other MRTs Total
Number of beneficiaries 0 19 19
Total deferred variable remuneration outstanding from previous years (£000s)
0 712 712
Total vested (£000s)5 0 222 222
Total unvested (£000s)6 0 490 490
5 Includes total vested cash and equity. Equity portion is valued as at the date the award vested.
6 Includes total unvested cash and equity. Equity portion is valued as at 1
st February, 2017.
In regards to 2016 awards, PHUK Group did not award any sign-on or severance payments. There
were also no individuals remunerated EUR 1 million or more.
Pershing Holdings (UK) Limited Pillar 3 Disclosure
Page 48 of 64
Appendix 1 Other Risks
Liquidity Risk
Liquidity Risk is the risk that PHUK Group cannot meet its cash and collateral obligations without significantly affecting daily operations or financial conditions. Liquidity risks can arise from funding mismatches, market constraints from an inability to convert assets to cash, inability to raise cash in the markets, deposit run-off, or contingent liquidity events. Changes in economic conditions or exposure to credit, market, operational, legal, and reputational risks also can affect Pershing’s liquidity risk profile and are considered in the liquidity risk management framework.
PHUK Group does not engage in proprietary trading activities or hold assets for resale on its balance sheet, (excluding Gilts comprising the liquid assets buffer (LAB)) and so does not have significant asset liquidity risk. PHUK Group’s business model is of a transaction processing nature and PHUK Group maintains a prudent funding profile in order to support its clients trading activities. The availability of sufficient and appropriate credit lines is of paramount importance.
A liquidity risk management framework has been established which is maintained on a day to day basis by the Treasury department. The ALCO provides oversight and ultimately the PRC and the Board. PSL complies with FCA liquidity requirements at all times including the maintenance of a LAB.
Regulatory and Compliance Risk
Regulatory and Compliance Risk is defined as sustaining loss arising from non-compliance with laws, directives, regulations, reporting standards and lack of adequately documented and understood processes.
Monitoring and Reporting Risk is the risk of loss arising from a failure to comply with financial reporting standards, agreements or regulatory requirements. This includes risks resulting from action taken by existing and new stockholders, regulators and investors who may have sustained losses due to incomplete, inaccurate or untimely reporting of financial performance.
Existing and new directives and regulations are monitored and reviewed by Compliance and Finance for finance regulatory reporting management and findings are reported to senior management and the Board. Strategies and changes to comply with new regulations are put in place when necessary.
Reputational Risk
Reputation Risk is the risk to the Pershing’s brand and relationships which does not arise out of any one specific error. It can arise from all aspects of business activities, including but not limited to operational failures in business practices, legal or regulatory sanctions, joint ventures with outside firms, engagements with third party vendors, or off-balance sheet activities.
Pershing relies heavily on its reputation and standing in the market place to retain and attract clients.
Legal Risk
Legal Risk is the risk of inadequate legal advice, inadequate contractual arrangements and failing to take appropriate legal measures to protect rights or changes in laws or regulations. Legal Risk could crystallise through:

Pershing Holdings (UK) Limited Pillar 3 Disclosure
Page 49 of 64
Outsourcing Risk
Outsourcing Risk is the risk that failure in respect of the provision of services by third party provider(s) could potentially damage PHUK Group’s operations, or if contracts with any of the third party providers are terminated, that PHUK Group may not be able to find alternative providers on a timely basis or on equivalent terms.
PHUK Group relies on internal and external outsourcing entities within and outside of the BNY Mellon group to perform its core business activities. To date, PHUK Group has only outsourced critical tasks to Pershing group entities that hold the required permissions in their jurisdiction to carry out the respective delegated tasks. Currently there are no critical tasks outsourced to third parties outside Pershing entities.
PHUK Group’s outsourcing policy describes minimum standards that should be adopted when considering or dealing with a service and/or activity that is outsourced to another legal entity, either within the Pershing group or to an external provider and establishes a framework for evaluating and analysing outsourcing projects.
Business Risk
Business Risk is the risk of loss that the business environment poses to PHUK Group’s profitability. It normally consists of items such as changes in the external macro environment or client behaviour, inappropriate management actions and performance of competitors. The list is not exhaustive.
The principal business risk for PHUK Group is within the asset servicing and alternative investment services businesses as this is mainly driven by the fact that fees are significantly based on the client’s net asset value. As business risk is difficult to assess, it has been defined as the residual risks that confronts PHUK Group after taking all known and quantifiable risks into consideration.
Concentration Risk
Concentration Risk is the risk of loss arising from significant interrelated asset or liability exposures, which in cases of distress associated with markets, sectors, countries, or areas of activity, may threaten the soundness of the institution.
Traditionally analysed in relation to credit activities, concentration risk arises from exposures that may arise within or across different risk types, including intra-risk concentration where exposure concentration exists within a single risk type, and inter-risk concentrations arising from interactions between different risk exposures across different risk categories connected by a common risk factor (e.g. counterparties, vendor, economic sector, geographic region, and/or financial instrument/product type).
Receipt or provision of wrong or inadequate legal advice
Failure to manage litigation or disputes effectively
Failure to identify and implement changes in legislation or law
Failure to appropriately make notifications required as a result of legal requirements
Failure to ensure adequate contractual arrangements (excluding outsourcing arrangements)
Failure to manage and/or protect the infringement of rights arising outside of contracts
Pershing Holdings (UK) Limited Pillar 3 Disclosure
Page 50 of 64
Group Risk
Group Risk is the risk that the financial position of PHUK Group may be adversely affected by its relationships (financial and non-financial) with other entities within PHUK Group or by risks which may affect the financial position of the whole Group, for example reputational contagion or Group default.
PHUK Group has a number of dependencies on the larger Pershing group. These range from business leadership, dependency on certain IT systems and support services provided by central functions.
PHUK Group management has considered several possible scenarios where these services may be affected, these include IT services outage and other business continuity issues. These stress scenarios are included as part of the operational risk assessment, and in the liquidity stress testing.
Model Risk
Model Risk refers to the possibility of unintended business outcomes arising from the design, implementation or use of models. Model risk includes the potential risk that management makes incorrect decisions based either upon incorrect model results, or incorrect understanding and use of model results.
PHUK Group uses models in its risk management framework. All models have been assessed in line with the relevant corporate policies and model risk management framework wherein the individual model is categorised into one of three tiers based on materiality, complexity, and level of reliance.
Models that impact the capital assessment process are categorised as Tier 1 models and the execution of the validation of Tier 1 models is done by a designated Independent model validation function. Tier 1 models are required to be validated or reviewed, as per the validation standards, on at least an annual basis.
Pershing internal audit provides independent reviews of compliance with the corporate model validation policy
Strategic Risk
Strategic Risk is defined as the risk of direct or indirect loss arising from the adverse effects or the improper implementation of business decisions. It is a function of the compatibility of an organisation’s strategic goals, the business strategies developed, the resources deployed to achieve those goals and the quality of implementation. It can result from either a misalignment between strategic decisions taken at the asset servicing and alternative investment services business level which impact PHUK Group, or failure to deliver business value through new strategic initiatives.
Country Risk
Country Risk is the risk of unfavourable evolution of operating profits and/or value of assets due to changes in the business environment resulting from political or macroeconomic factors.
Pershing Holdings (UK) Limited Pillar 3 Disclosure
Page 51 of 64
Appendix 2 Glossary of Terms
The following terms are used in this document:
ALCO: Asset and Liability Committee
Basel III: The capital reforms and introduction of a global liquidity standard proposed by the Basel Committee on Banking Supervision in 2010
BNY Mellon: The Bank of New York Mellon Corporation
CRD IV: On 27 June 2013, the European Commission published, through the Official Journal of the European Union, its legislation for a Capital Requirements Directive (CRD) and Capital Requirements Regulation (CRR), which together form the CRD IV package. Amendments published on 30 November 2013 were made to the Regulation. The package implements the Basel III reforms in addition to the inclusion of new proposals on sanctions for non-compliance with prudential rules, corporate governance and remuneration. CRD IV rules apply from 1 January 2014 onwards, with certain requirements set to be phased in
Capital Requirements Directive (CRD): A capital adequacy legislative package issued by the European Commission and adopted by EU member states
Capital Requirements Regulation (CRR): Regulation that is directly applicable to anyone in the European Union and is not transposed into national law
Central Bank of Ireland (CBI): Is Ireland’s central bank and financial services regulator for most categories of financial firms
Common Equity Tier 1 capital: The highest quality form of regulatory capital under Basel III comprising common shares issued and related share premium, retained earnings and other reserves excluding the cash flow hedging reserve, less specified regulatory adjustments
Core Tier 1 capital: Called-up share capital and eligible reserves plus equity non-controlling interests, less intangible assets and other regulatory deductions
Credit risk mitigation (CRM): A technique to reduce the credit risk associated with an exposure by application of credit risk mitigants such as collateral, guarantees and credit protection
Derivatives: A derivative is a financial instrument that derives its value from one or more underlying assets, for example bonds or currencies
EMEA: Europe, Middle-East and Africa region
Exposure: A claim, contingent claim or position which carries a risk of financial loss
Exposure at default (EAD): The amount expected to be outstanding, after any credit risk mitigation, if and when a counterparty defaults. EAD reflects drawn balances as well as allowance for undrawn amounts of commitments and contingent exposures over a one-year time horizon
Financial Conduct Authority (FCA): The Financial Conduct Authority regulates the conduct of financial firms and, for certain firms, prudential standards in the UK. It has a strategic objective to ensure that the relevant markets function well
High Level Assessment (HLA): An assessment of the quality of controls in place to mitigate risk and residual risk. Residual risk is assessed as high, moderate to high, moderate, moderate to low and low with direction anticipated
Institutions: Under the Standardised Approach, institutions are classified as credit institutions or investment firms
Pershing Holdings (UK) Limited Pillar 3 Disclosure
Page 52 of 64
Internal Capital Adequacy Assessment Process (ICAAP): The group’s own assessment of the levels of capital that it needs to hold through an examination of its risk profile from regulatory and economic capital viewpoints
ISDA Master Agreement: A document that outlines the terms applied to a derivatives transaction between two parties. Once the two parties have agreed to the standard terms, they do not have to renegotiate each time a new transaction is entered into
Jersey Financial Services Commission (JFSC): The Commission is responsible for the regulation, supervision and development of the financial services industry in the Island of Jersey
Key Risk Indicator (KRI): Key Risk Indicators are used by business lines to evaluate control effectiveness and residual risk within a business process
Master Netting Agreement: An agreement between two counterparties that have multiple contracts with each other that provides for the net settlement of all contracts through a single payment in the event of default or termination of any one contract
Pillar 3: The part of Basel III that sets out information banks must disclose about their risks, the amount of capital required to absorb them and their approach to risk management. The aim is to encourage market discipline and improve the information made available to the market
Prudential Regulation Authority (PRA): The statutory body responsible for the prudential supervision of banks, building societies, credit unions, insurers and major investment firms in the UK. The PRA is a subsidiary of the Bank of England
Residual maturity: The period outstanding from the reporting date to the maturity or end date of an exposure
Risk appetite: A definition of the types and quantum of risks to which the firm wishes to be exposed
Risk and Control Self-Assessment (RCSA): Risk and Control Self-Assessment is used by business lines to identify risks associated with their key business processes and to complete a detailed assessment of the risk and associated controls
Risk Governance Framework: PHUK Group’s risk governance framework has been developed in conjunction with BNY Mellon requirements. Key elements of the framework are:
- Formal governance committees, with mandates and defined attendees
- Clearly defined escalation processes, both informally (management lines) and formally (governance committees, board, etc.)
- A clear business as usual process for identification, management and control of risks
- Regular reporting of risk issues
Risk Weighted Assets (RWA): Assets that are adjusted for their associated risks using weightings established in accordance with CRD IV requirements
Standardised Approach: Method used to calculate credit risk capital requirements using the Basel III, CRD IV, CRR model supplied by the BCBS. All financial institutions must opt to either use the Standardised Approach (SA) specified by the regulator, or develop and use their own Internal Ratings Model (IRM). The SA model uses external credit assessment institution ratings and supervisory risk weights supplied by external credit assessment agencies
Tier 2 capital: A component of regulatory capital under Basel III, mainly comprising qualifying subordinated loan capital, related non-controlling interests and eligible collective impairment allowances

Pershing Holdings (UK) Limited Pillar 3 Disclosure
Page 53 of 64
Value-at-Risk (VaR): A measure of the potential loss at a specified confidence level from adverse market movements in an ordinary market environment
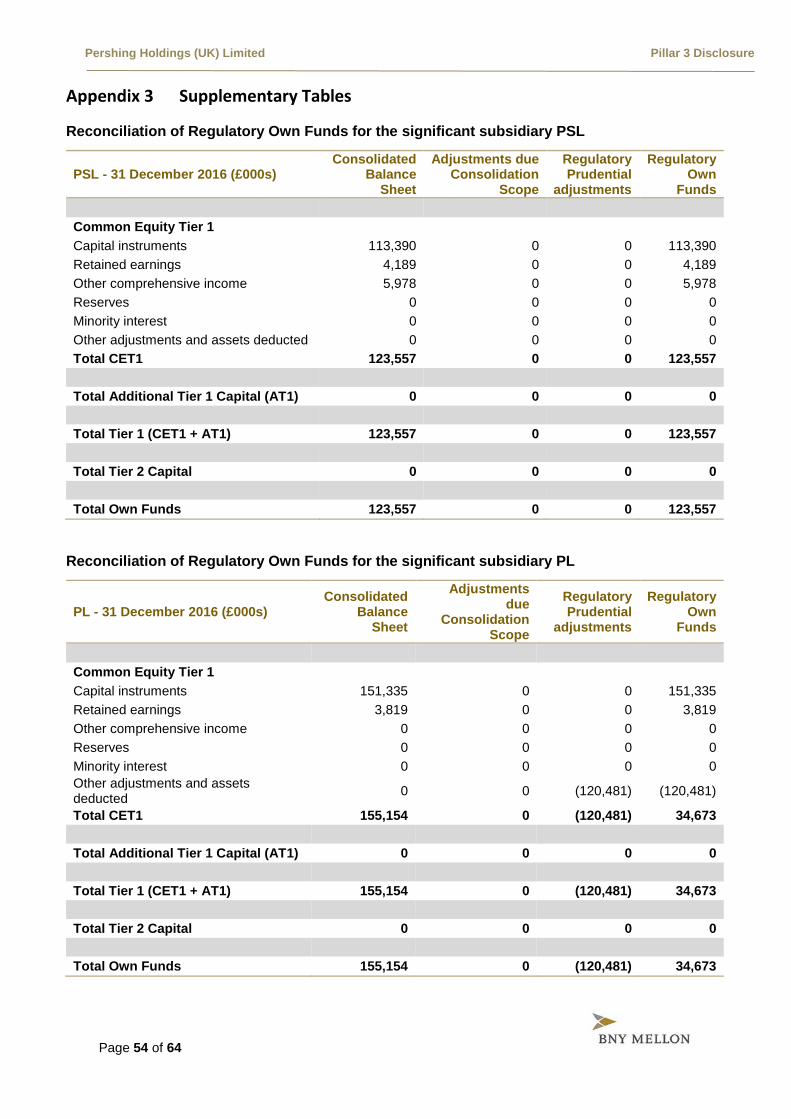
Pershing Holdings (UK) Limited Pillar 3 Disclosure
Page 54 of 64
Appendix 3 Supplementary Tables
Reconciliation of Regulatory Own Funds for the significant subsidiary PSL
PSL - 31 December 2016 (£000s) Consolidated
Balance Sheet
Adjustments due Consolidation
Scope
Regulatory Prudential
adjustments
Regulatory Own
Funds
Common Equity Tier 1
Capital instruments 113,390 0 0 113,390
Retained earnings 4,189 0 0 4,189
Other comprehensive income 5,978 0 0 5,978
Reserves 0 0 0 0
Minority interest 0 0 0 0
Other adjustments and assets deducted 0 0 0 0
Total CET1 123,557 0 0 123,557
Total Additional Tier 1 Capital (AT1) 0 0 0 0
Total Tier 1 (CET1 + AT1) 123,557 0 0 123,557
Total Tier 2 Capital 0 0 0 0
Total Own Funds 123,557 0 0 123,557
Reconciliation of Regulatory Own Funds for the significant subsidiary PL
PL - 31 December 2016 (£000s) Consolidated
Balance Sheet
Adjustments due
Consolidation Scope
Regulatory Prudential
adjustments
Regulatory Own
Funds
Common Equity Tier 1
Capital instruments 151,335 0 0 151,335
Retained earnings 3,819 0 0 3,819
Other comprehensive income 0 0 0 0
Reserves 0 0 0 0
Minority interest 0 0 0 0
Other adjustments and assets deducted
0 0 (120,481) (120,481)
Total CET1 155,154 0 (120,481) 34,673
Total Additional Tier 1 Capital (AT1) 0 0 0 0
Total Tier 1 (CET1 + AT1) 155,154 0 (120,481) 34,673
Total Tier 2 Capital 0 0 0 0
Total Own Funds 155,154 0 (120,481) 34,673
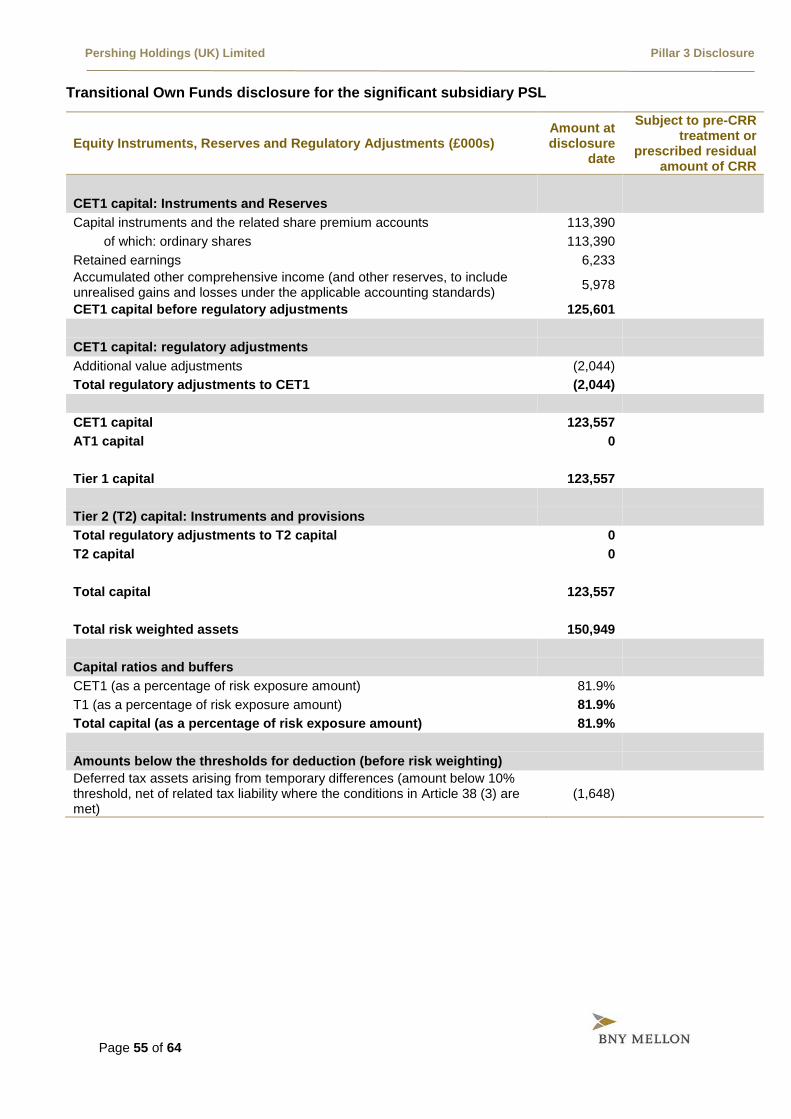
Pershing Holdings (UK) Limited Pillar 3 Disclosure
Page 55 of 64
Transitional Own Funds disclosure for the significant subsidiary PSL
Equity Instruments, Reserves and Regulatory Adjustments (£000s) Amount at disclosure
date
Subject to pre-CRR treatment or
prescribed residual amount of CRR
CET1 capital: Instruments and Reserves
Capital instruments and the related share premium accounts 113,390
of which: ordinary shares 113,390
Retained earnings 6,233
Accumulated other comprehensive income (and other reserves, to include unrealised gains and losses under the applicable accounting standards)
5,978
CET1 capital before regulatory adjustments 125,601
CET1 capital: regulatory adjustments
Additional value adjustments (2,044)
Total regulatory adjustments to CET1 (2,044)
CET1 capital 123,557
AT1 capital 0
Tier 1 capital 123,557
Tier 2 (T2) capital: Instruments and provisions
Total regulatory adjustments to T2 capital 0
T2 capital 0
Total capital 123,557
Total risk weighted assets 150,949
Capital ratios and buffers
CET1 (as a percentage of risk exposure amount) 81.9%
T1 (as a percentage of risk exposure amount) 81.9%
Total capital (as a percentage of risk exposure amount) 81.9%
Amounts below the thresholds for deduction (before risk weighting)
Deferred tax assets arising from temporary differences (amount below 10% threshold, net of related tax liability where the conditions in Article 38 (3) are met)
(1,648)
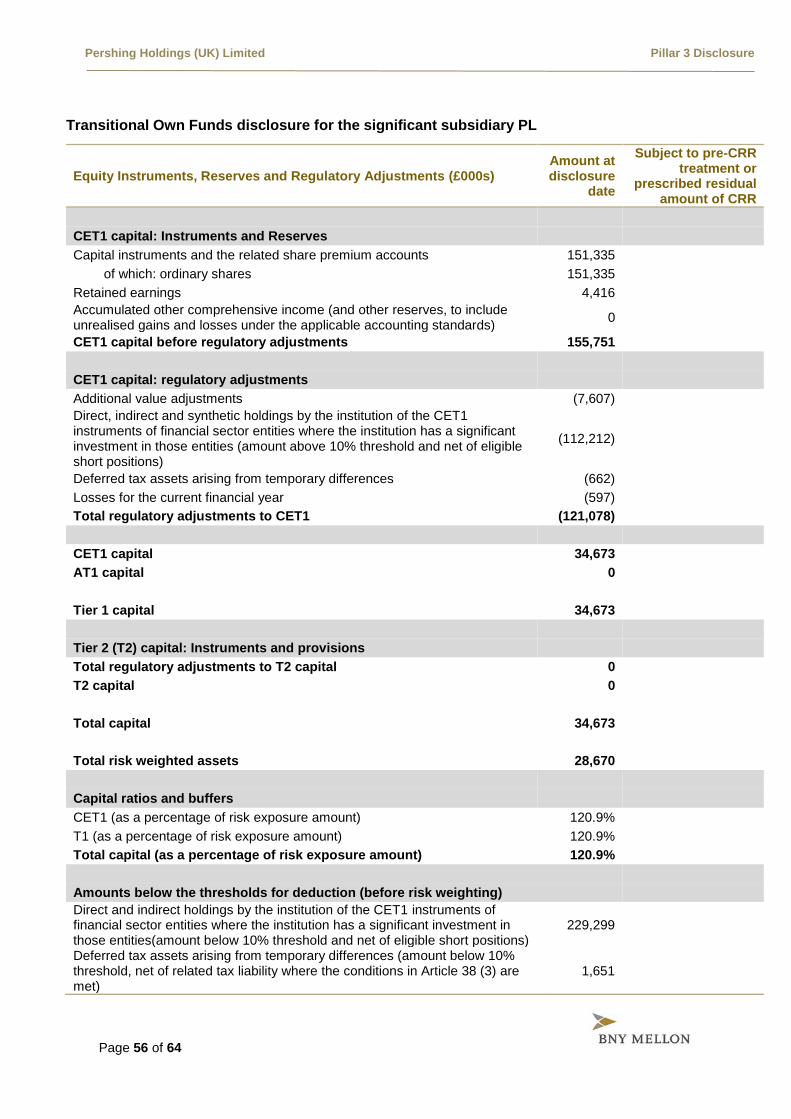
Pershing Holdings (UK) Limited Pillar 3 Disclosure
Page 56 of 64
Transitional Own Funds disclosure for the significant subsidiary PL
Equity Instruments, Reserves and Regulatory Adjustments (£000s) Amount at disclosure
date
Subject to pre-CRR treatment or
prescribed residual amount of CRR
CET1 capital: Instruments and Reserves
Capital instruments and the related share premium accounts 151,335
of which: ordinary shares 151,335
Retained earnings 4,416
Accumulated other comprehensive income (and other reserves, to include unrealised gains and losses under the applicable accounting standards)
0
CET1 capital before regulatory adjustments 155,751
CET1 capital: regulatory adjustments
Additional value adjustments (7,607)
Direct, indirect and synthetic holdings by the institution of the CET1 instruments of financial sector entities where the institution has a significant investment in those entities (amount above 10% threshold and net of eligible short positions)
(112,212)
Deferred tax assets arising from temporary differences (662)
Losses for the current financial year (597)
Total regulatory adjustments to CET1 (121,078)
CET1 capital 34,673
AT1 capital 0
Tier 1 capital 34,673
Tier 2 (T2) capital: Instruments and provisions
Total regulatory adjustments to T2 capital 0
T2 capital 0
Total capital 34,673
Total risk weighted assets 28,670
Capital ratios and buffers
CET1 (as a percentage of risk exposure amount) 120.9%
T1 (as a percentage of risk exposure amount) 120.9%
Total capital (as a percentage of risk exposure amount) 120.9%
Amounts below the thresholds for deduction (before risk weighting)
Direct and indirect holdings by the institution of the CET1 instruments of financial sector entities where the institution has a significant investment in those entities(amount below 10% threshold and net of eligible short positions)
229,299
Deferred tax assets arising from temporary differences (amount below 10% threshold, net of related tax liability where the conditions in Article 38 (3) are met)
1,651
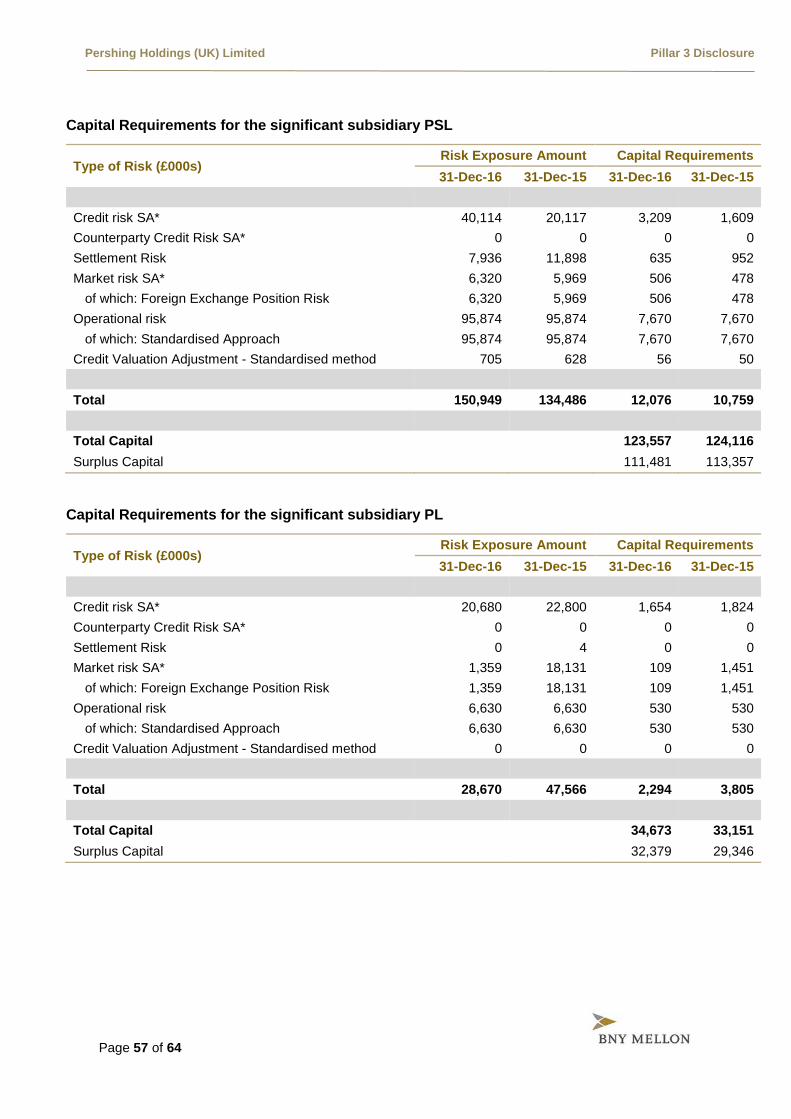
Pershing Holdings (UK) Limited Pillar 3 Disclosure
Page 57 of 64
Capital Requirements for the significant subsidiary PSL
Type of Risk (£000s) Risk Exposure Amount Capital Requirements
31-Dec-16 31-Dec-15 31-Dec-16 31-Dec-15
Credit risk SA* 40,114 20,117 3,209 1,609
Counterparty Credit Risk SA* 0 0 0 0
Settlement Risk 7,936 11,898 635 952
Market risk SA* 6,320 5,969 506 478
of which: Foreign Exchange Position Risk 6,320 5,969 506 478
Operational risk 95,874 95,874 7,670 7,670
of which: Standardised Approach 95,874 95,874 7,670 7,670
Credit Valuation Adjustment - Standardised method 705 628 56 50
Total 150,949 134,486 12,076 10,759
Total Capital 123,557 124,116
Surplus Capital 111,481 113,357
Capital Requirements for the significant subsidiary PL
Type of Risk (£000s) Risk Exposure Amount Capital Requirements
31-Dec-16 31-Dec-15 31-Dec-16 31-Dec-15
Credit risk SA* 20,680 22,800 1,654 1,824
Counterparty Credit Risk SA* 0 0 0 0
Settlement Risk 0 4 0 0
Market risk SA* 1,359 18,131 109 1,451
of which: Foreign Exchange Position Risk 1,359 18,131 109 1,451
Operational risk 6,630 6,630 530 530
of which: Standardised Approach 6,630 6,630 530 530
Credit Valuation Adjustment - Standardised method 0 0 0 0
Total 28,670 47,566 2,294 3,805
Total Capital 34,673 33,151
Surplus Capital 32,379 29,346
Pershing Holdings (UK) Limited Pillar 3 Disclosure
Page 58 of 64
Appendix 4 CRD IV Reference
CRR ref. Requirement summary Compliance ref. Page ref.
Scope of disclosure requirements
431 (1) Institutions shall publish Pillar 3 disclosures BNY Mellon publishes Pillar 3 disclosures N/A
431 (2) Firms with permission to use specific operational risk methodologies must disclose operational risk information
N/A N/A
431 (3) Institutions shall adopt a formal policy to comply with the disclosure requirements
BNY Mellon has a dedicated Pillar 3 policy
N/A
431 (4) Explanation of ratings decision upon request N/A N/A
Non-material, proprietary or confidential information
432 (1) Institutions may omit disclosures if the information is not regarded as material (except Articles 435(2)(c), 437 and 450)
Refer to Pillar 3 policy N/A
432 (2) Institutions may omit information that is proprietary or confidential if certain conditions are respected
Refer to Pillar 3 policy N/A
432 (3) Where 432 (1) and (2) apply this must be stated in the disclosures, and more general information must be disclosed
N/A N/A
432 (4) Paragraphs 1, 2 & 3 are without prejudice to the scope of the liability for failure to disclose material information
Frequency of disclosure
433 Institutions shall publish the disclosures required at least on an annual basis, in conjunction with the date of the publication of the financial statements
Refer to Pillar 3 policy N/A
Means of disclosure
434 (1) Institutions may determine the appropriate medium, location and means of verification to comply effectively
Single Pillar 3 disclosure N/A
434 (2) Disclosures made under other requirements (e.g. accounting) can be used to satisfy Pillar 3 if appropriate
Any cross-references to accounting or other disclosures are clearly signposted in this document
N/A
Risk management objectives and policies
435 (1) Institutions shall disclose their risk management objectives and policies
Section 4 Risk Management Objectives and Policy
16-21
435 (1) (a) Strategies and processes to manage those risks Section 4.1 Risk Objectives 16
435 (1) (b) Structure and organisation of the risk management function
Section 4.2 Risk Governance 19
435 (1) (c) Scope and nature of risk reporting and measurement systems
Section 4.1 - 4.4 16-21
435 (1) (d) Policies for hedging and mitigating risk Section 4 Risk Management Objectives and Policy
16-21
435 (1) (e) Approved declaration on the adequacy of risk management arrangements
Section 4 Risk Management Objectives and Policy
16-21
435 (1) (f) Approved risk statement describing the overall risk profile associated with business strategy
Section 4 Risk Management Objectives and Policy
16-21
435 (2) (a) Number of directorships held by directors Section 4.1.1 Board of Directors 16
Pershing Holdings (UK) Limited Pillar 3 Disclosure
Page 59 of 64
435 (2) (b) Recruitment policy of Board members, their experience and expertise
Section 4.1.1 Board of Directors 16
435 (2) (c) Policy on diversity of Board membership and results against targets
Section 4.1.1 Board of Directors 16
435 (2) (d) Disclosure of whether a dedicated risk committee is in place, and number of meetings in the year
Section 4.1.2 17-19
435 (2) (e) Description of information flow on risk to Board Section 4.1.2 17-19
Scope of application
436 (a) The name of the institution to which the requirements of this Regulation apply
Section 1 Scope of Application 6-11
436 (b) 436 (b) (i) 436 (b) (ii) 436 (b) (iii) 436 (b) (iv)
Outline the differences in the basis of consolidation for accounting and prudential purposes, with a brief description of the entities therein, explaining whether they are: fully consolidated; proportionally consolidated; deducted from own funds; neither consolidated nor deducted
Section 1 Scope of Application 6-11
436 (c) Current or foreseen material practical or legal impediment to the prompt transfer of own funds or repayment of liabilities among the parent undertaking and its subsidiaries
N/A N/A
436 (d) Aggregate amount by which the actual Own Funds are less than required in all subsidiaries not included in the consolidation, and the name or names of such subsidiaries
N/A - Entities outside the scope of consolidation are appropriately capitalised
N/A
436 (e) If applicable, the circumstance of making use of the provisions laid down in Articles 7 & 9
N/A N/A
Own funds
437 (1) Requirements regarding capital resources table Section 2 Own Funds 12-14
437 (1) (a) Full reconciliation of Common Equity Tier 1 (CET1) items
Table 2: Reconciliation of regulatory Own Funds
12
437 (1) (b) Description of the main features of the CET1 and Additional Tier 1 and Tier 2 instruments
Table 3: Composition of regulatory Own Funds
12
437 (1) (c) Full terms and conditions of all CET1, Additional Tier 1 and Tier 2 instruments
Table 3: Composition of regulatory Own Funds
12
437 (1) (d) (i) 437 (1) (d) (ii) 437 (1) (d) (iii)
Each prudent filter applied Each deduction made Items not deducted
Table 2: Reconciliation of regulatory Own Funds
12
437 (1) (e) Description of all restrictions applied to the calculation of Own Funds
N/A - no restrictions apply N/A
437 (1) (f) Explanation of the basis of calculating capital ratios using elements of Own Funds
N/A - Capital ratios calculated on basis stipulated in the Regulations
N/A
437 (2) EBA to publish implementation standards for points above
BNYM follows the implementation standards
N/A
Capital requirements
438 (a) Summary of institution’s approach to assessing adequacy of capital levels
Section 3 Capital Requirements 15
438 (b) Result of ICAAP on demand from authorities N/A N/A
438 (c) Capital requirement amounts for credit risk for each Standardised Approach exposure class
Table 7: Standardised credit exposure by exposure class
24
Pershing Holdings (UK) Limited Pillar 3 Disclosure
Page 60 of 64
438 (d) 438 (d) (i) 438 (d) (ii) 438 (d) (iii) 438 (d) (iv)
Capital requirements amounts for credit risk for each Internal Ratings Based Approach exposure class
N/A – internal ratings based approach is not used
N/A
438 (e) Own funds requirements for market risk or settlement risk, or large exposures where they exceed limits
Table 6: Capital requirements and Section 10: Market Risk
15 & 37
438 (f) Own funds amounts for operational risk, separately for the basic indicator approach, the standardised approach, and the advanced measurement approaches as applicable
Table 6: Capital requirements and Section 12: Operational Risk
15 & 39-41
438 (endnote) Requirement to disclose specialised lending exposures and equity exposures in the banking book falling under the simple risk weight approach
Table 6: Capital requirements 15
Exposure to counterparty credit risk (CCR)
439 (a) Description of process to assign internal capital and credit limits to CCR exposures
Section 8 Counterparty Credit Risk 33-34
439 (b) Discussion of process to secure collateral and establishing reserves
Section 8 Counterparty Credit Risk 33-34
439 (c) Discussion of management of wrong-way exposures
Section 8 Counterparty Credit Risk 33-34
439 (d) Disclosure of collateral to be provided (outflows) in the event of a ratings downgrade
N/A – a credit ratings downgrade is managed at the BNYM Corp level
N/A
439 (e) Derivation of net derivative credit exposure Section 8 Counterparty Credit Risk 33-34
439 (f) Exposure values for mark-to-market, original exposure, standardised and internal model methods
Section 8 Counterparty Credit Risk 33-34
439 (g) Notional value of credit derivative hedges and current credit exposure by type of exposure
N/A – BNYM does not have credit derivative transactions
N/A
439 (h) Notional amounts of credit derivative transactions for own credit, intermediation, bought and sold, by product type
N/A – BNYM does not have credit derivative transactions
N/A
439 (i) Estimate of alpha, if applicable N/A N/A
Capital buffers
440 (1) (a) Geographical distribution of relevant credit exposures
N/A N/A
440 (1) (b) Amount of the institution specific countercyclical capital buffer
N/A N/A
440 (2) EBA will issue technical implementation standards related to 440 (1)
N/A N/A
Indicators of global systemic importance
441 (1) Disclosure of the indicators of global systemic importance
N/A N/A
441 (2) EBA will issue technical implementation standards related to 441 (1)
N/A N/A
Credit risk adjustments
442 (a) Disclosure of bank’s definitions of past due and impaired
Section 5.5 Analysis of Past Due and Impaired Exposures
26-28
442 (b) Approaches for calculating credit risk adjustments Section 5.5 Analysis of Past Due and Impaired Exposures
26-28
442 (c) Disclosure of pre-CRM EAD by exposure class Table 7: Standardised credit exposure by exposure class
24
Pershing Holdings (UK) Limited Pillar 3 Disclosure
Page 61 of 64
442 (d) Disclosures of pre-CRM EAD by geography and exposure class
Table 8: Standardised credit exposure by country
24
442 (e) Disclosures of pre-CRM EAD by industry and exposure class
Table 9: Standardised post mitigated credit exposures by counterparty type
25
442 (f) Disclosures of pre-CRM EAD by residual maturity and exposure class
Table 10: Standardised credit exposure by residual maturity
25
442 (g) 442 (g) (i) 442 (g) (ii) 442 (g) (iii)
Breakdown of impaired, past due, specific and general credit adjustments, and impairment charges for the period, by exposure class or counterparty type
Table 11: Credit quality of exposures by counterparty type
26
442 (h) Impaired, past due exposures, by geographical area, and amounts of specific and general impairment for each geography
Table 13: Credit quality of exposures by geographical breakdown
27
442 (i) 442 (i) (i) 442 (i) (ii) 442 (i) (iii) 442 (i) (iv) 442 (i) (v)
Reconciliation of changes in specific and general credit risk adjustments
Section 5.5 Analysis of Past Due and Impaired Exposures
26-28
442 endnote Specific credit risk adjustments recorded to income statement are disclosed separately
Section 5.5 Analysis of Past Due and Impaired Exposures
26-28
Unencumbered assets
443 Disclosures on unencumbered assets Section 9 Asset Encumbrance 35-36
Use of ECAIs
444 (a) Names of the ECAIs used in the calculation of Standardised Approach RWAs, and reasons for any changes
Section 7 External Credit Assessment Institutions (ECAIs)
31-32
444 (b) Exposure classes associated with each ECAI Section 7 Table 15: Credit quality steps and risk weights
31
444 (c) Explanation of the process for translating external ratings into credit quality steps
Section 7 Table 16: Credit quality steps and risk weights
31
444 (d) Mapping of external rating to credit quality steps Section 7 External Credit Assessment Institutions (ECAIs)
31-32
444 (e) Exposure value pre and post-credit risk mitigation, by credit quality step
Section 7 Table 15-18: External Credit Assessment Institutions (ECAIs)
31-32
Exposure to market risk
445 Disclosure of position risk, large exposures exceeding limits, FX, settlement and commodities risk
Section 10 Market Risk 37
Operational risk
446 Disclosure of the scope of approaches used to calculate operational risk, discussion of advanced methodology and external factors considered
Section 12 Operational Risk 39-41
Exposure in equities not included in the trading book
447 (a) Differentiation of exposures based on objectives Appendix 1 Settlement Risk: no non-trading book exposure in equities
48
447 (b) Recorded and fair value, and actual prices of exchange traded equity where it differs from fair value
Appendix 1 Settlement Risk: no non-trading book exposure in equities
48
447 (c) Types, nature and amounts of the relevant classes of equity exposures
Appendix 1 Settlement Risk: no non-trading book exposure in equities
48
447 (d) Realised cumulative gains and losses on sales over the period
Appendix 1 Settlement Risk: no non-trading book exposure in equities
48
Pershing Holdings (UK) Limited Pillar 3 Disclosure
Page 62 of 64
447 (e) Total unrealised gains/losses, latent revaluation gains/losses, and amounts included within Tier 1 capital
Appendix 1 Settlement Risk: no non-trading book exposure in equities
48
Exposure to interest rate risk on positions not included in the trading book
448 (a) Nature of risk and key assumptions in measurement models
Section 11: The Bank has no significant Balance Sheet Interest Rate Risk because no maturity mismatch exists between client cash deposits and Bank’s cash holdings. In addition, interest rates applicable to clients’ cash deposits are market driven
38
448 (b) Variation in earnings or economic value, or other measures used by the bank from upward and downward shocks to interest rates, by currency
N/A N/A
Exposure to securitisation positions
449 Exposure to securitisations positions Appendix 1 Settlement Risk: no non-trading book exposure in equities
48
Remuneration disclosures
450 Remuneration disclosure regarding remuneration policy and practices
Section 14 Remuneration Disclosure 44-46
450 (1) (a) Information concerning the decision-making process used for determining the remuneration policy
Section 14.1 Governance 44
450 (1) (b) Information on link between pay and performance Section 14.2 Aligning Pay with Performance
44
450 (1) (c) Important design characteristics of the remuneration system
Section 14 Remuneration Disclosure 44-46
450 (1) (d) Ratios between fixed and variable remuneration Section 14.5 Ratio between Fixed and Variable Pay
45
450 (1) (e) Information on the performance criteria on which the entitlement to shares, options and variable components of remuneration is based
Section 14.6 Deferral Policy and Vesting Criteria
46
450 (1) (f) Main parameters and rationale for any variable component scheme and any other non-cash benefits
Section 14.7 Variable Remuneration of Control Function Staff
46
450 (1) (g) Aggregate quantitative information on remuneration by business area
Section 14.8 Table 29: Aggregate Remuneration Expenditure by Business
47
450 (1) (h) 450 (1) (h) (i) 450 (1) (h) (ii) 450 (1) (h) (iii) 450 (1) (h) (iv) 450 (1) (h) (v) 450 (1) (h) (vi)
Aggregate quantitative information on remuneration, broken down by senior staff management and members of staff whose actions have a material impact on the risk profile
Section 14.8 Table 30: Aggregate Remuneration Expenditure by Remuneration Type
47
450 (1) (i) Number of individuals being remunerated £1 million or more per financial year
Section 14.8 46
450 (1) (j) Total remuneration for each member of the management body upon demand from the Member State or competent authority
N/A N/A
450 (2) For institutions that are significant in terms of their size, internal organisation and the nature, scope and the complexity of their activities, the quantitative information above shall be made available to the public at the level of members of the management body of the institution
N/A N/A
Pershing Holdings (UK) Limited Pillar 3 Disclosure
Page 63 of 64
Leverage
451 (1) (a) Leverage ratio Section 13 Leverage Ratio 42-43
451 (1) (b) Breakdown of total exposure measure Section 13 Table 27: Leverage ratio common disclosure
42
451 (1) (c) Derecognised fiduciary items N/A N/A
451 (1) (d) Description of the process used to manage the risk of excessive leverage
N/A N/A
451 (1) (e) Description of the factors that had an impact on the leverage ratio
Section 13 Leverage Ratio 42-43
451 (2) EBA to publish implementation standards for points above
BNYM follows the implementation standards
N/A
Use of the IRB approach to credit risk
452 Risk-weighted exposure under the IRB approach N/A N/A
Use of credit risk mitigation techniques
453 (a) Use of on- and off-balance sheet netting Section 6.1 ISDA Master Agreements and Netting
29
453 (b) How collateral valuation is managed Section 6.2 Collateral Valuation and Management
29
453 (c) Description of types of collateral used N/A N/A
453 (d) Types of guarantor and credit derivative counterparty, and their creditworthiness
N/A - BNYM’s EMEA entities do not enter into credit derivative transactions
N/A
453 (e) Disclosure of market or credit risk concentrations within risk mitigation exposures
Section 6.4 Credit Risk Concentration 29-30
453 (f) For exposures under either the Standardised or Foundation IRB approach, disclose the exposure value covered by eligible collateral
N/A N/A
453 (g) Exposures covered by guarantees or credit derivatives
Section 6.4 Table 14: Credit risk mitigation techniques – overview
30
Use of the Advanced Measurement Approaches to operational risk
454 Description of the use of insurance or other risk transfer mechanisms to mitigate operational risk
N/A - Pillar 1 : standardized approach, Pillar 2 : self-assessment approach
N/A
Use of internal market risk models
455 Institutions calculating their capital requirements using internal market risk models
N/A N/A
Commission Implementing Regulation (EU) No 1423/2013
Article 1 Specifies uniform templates for the purposes of disclosure
N/A N/A
Article 2 Full reconciliation of own funds items to audited financial statements
Section 2 Own Funds 12-14
Article 3 Description of the main features of CET1, AT1 and Tier 2 instruments issued (Annex II and III)
Table 5: Common tier 1 and additional tier 1 instruments and tier 2 instruments
14
Article 4 Disclosure of nature and amounts of specific items on own funds (Annex IV and V)
Table 4: Transitional own funds 13
Article 5 Disclosure of nature and amounts of specific items on own funds during transitional period (Annex VI and VII)
Table 4: Transitional own funds
13
Article 6 Entry into force from 31 March 2014 N/A N/A
Pershing Holdings (UK) Limited Pillar 3 Disclosure
Page 64 of 64
PERSHING HOLDINGS (UK) LIMITED
ONE CANADA SQUARE
CANARY WHARF
LONDON E14 5AL, UNITED KINGDOM
+44 20 7163 8000