peripheral color vision and motion processing · peripheral color vision and motion processing...
TRANSCRIPT
Peripheral Color Vision and Motion Processing
Christopher W. Tyler Smith-Kettlewell Eye Research Institute, San Francisco
Abstract A demonstration of the vividness of peripheral color vision is provided by arrays of
multicolored disks scaled with eccentricity. These demonstrations are designed to correct
the widespread misconception that peripheral color vision is weak or non-existent. In
fact, both small and large disks of color scaled with eccentricity demonstrate that color
perception is just as strong in throughout the periphery as in the fovea, under
appropriate viewing conditions. Moreover, further demonstrations with cone-isolating
motion stimuli indicate that motion perception is undiminished with rod activation
silenced by the choice of colors with equal activation strengths for the rod spectral
sensitivity.
Introduction In designing next-generation visual displays for
entertainment and commercial applications, it is important to
have a good understanding of the full capabilities of human
visual processing. There is a widespread misconception even
among vision scientists, and hence the population in general,
that the high cone density in the fovea implies that color vision
is restricted to the fovea, and conversely that the high density
of rods in the periphery implies a lack of color vision in the
periphery. For example, the Wikipedia article on peripheral
vision says: “rod cells are unable to distinguish color and are
predominant at the periphery, while cone cells are
concentrated mostly in the center of the retina, the fovea.”
(https://en.wikipedia.org/wiki/Peripheral_vision).
Eccentricity Scaling In fact, however, both historical [1] and more recent [2,3]
measurements of photoreceptor densities indicate otherwise.
Despite the high concentration of cones in the fovea, even the
central 5 of the retina contains only about 1% of the con
population, about 50,000 cones, while the remainder of the
total cone population of about 5 million cones are distributed
throughout the peripheral retina with an average density of
about 4,000 cones/mm2 (beyond about 10 eccentricity). Since
the cone inner segments act as their light-catching apertures,
and since their inner segment diameter is about 9 mm, this
density in the periphery implies that the light-catching area of
the cones is about 0.32 mm2 per mm2 of peripheral retina,
while the rod light-catching area accounts for most of the rest.
Thus, about 1/3 of the peripheral retina should be considered
to support color vision [4], with an area of about half the light-
catching area of the rods.
The mapping from retina to cortex can be approximated
as a linear scaling from the fovea to the periphery, particularly
for the cortical mappings of V2 and V3 [5]. To project from
the retina to equal regions of early visual cortex, therefore, the
stimuli should be scaled in proportion to eccentricity, and
studies of peripheral color processing should use such scaling
in order to assess the cortical capabilities of color processing.
Indeed, with suitable areal scaling, color discrimination can be
equated at all eccentricities [6].
Demonstration Images These properties are indicated by the demonstration
image of Fig. 2, which should be viewed at a distance of about
3 inches, so that the outer rim of the figure projects to about
45 eccentricity. This figure shows an array of multi-colored
‘balloons’ scaled to stimulate about 1 cm2 of visual cortex at
each eccentricity. If peripheral color vision had weaker color
vision, the colors when viewing Fig. 2 should appear
desaturated in the periphery relative to those in the center, but
inspection with fixation at the central point verifies that they
do not when the stimuli are scaled in proportion to
eccentricity, although the colors become much less salient
when the size is held constant (horizontal line of dots in Fig.
2). The key factor in the displays is scaling the size of the
colored patches in proportion with eccentricity, which is a
good approximation to a uniform cortical scaling such that
each color patch projects to a roughly equal area of primary
visual cortex.
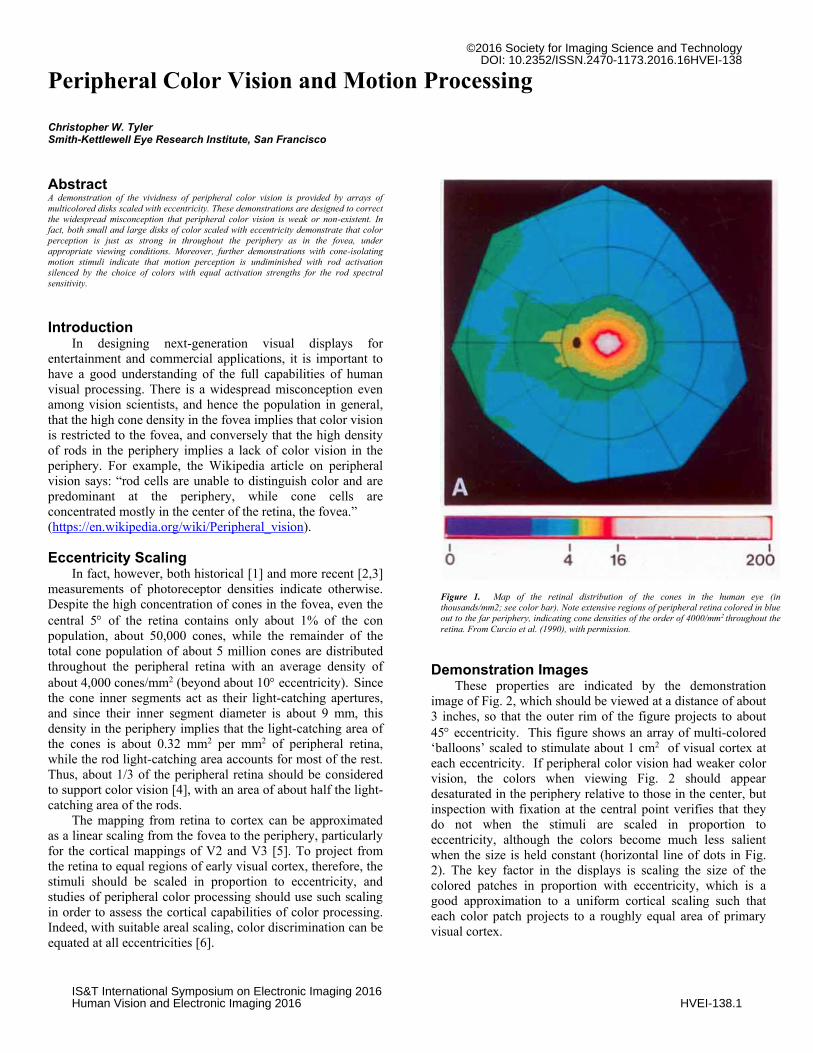
Figure 1. Map of the retinal distribution of the cones in the human eye (in
thousands/mm2; see color bar). Note extensive regions of peripheral retina colored in blue
out to the far periphery, indicating cone densities of the order of 4000/mm2 throughout the
retina. From Curcio et al. (1990), with permission.
©2016 Society for Imaging Science and TechnologyDOI: 10.2352/ISSN.2470-1173.2016.16HVEI-138
IS&T International Symposium on Electronic Imaging 2016Human Vision and Electronic Imaging 2016 HVEI-138.1
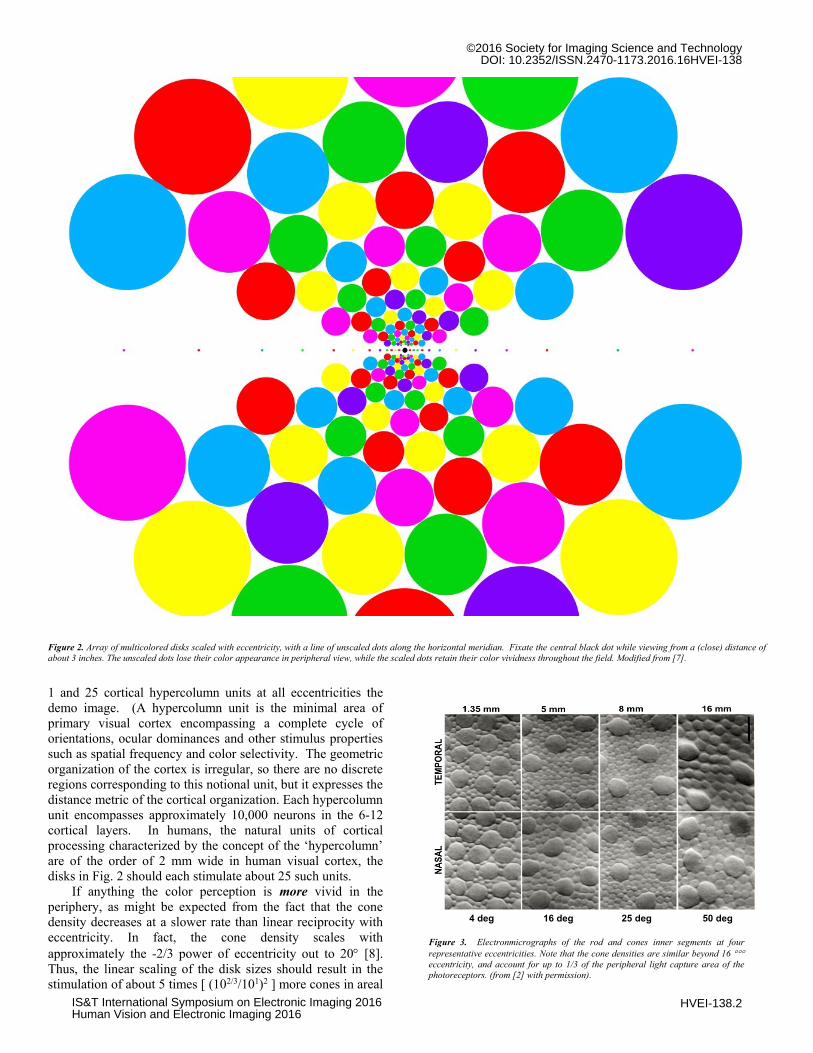
Figure 2. Array of multicolored disks scaled with eccentricity, with a line of unscaled dots along the horizontal meridian. Fixate the central black dot while viewing from a (close) distance of
about 3 inches. The unscaled dots lose their color appearance in peripheral view, while the scaled dots retain their color vividness throughout the field. Modified from [7].
1 and 25 cortical hypercolumn units at all eccentricities the
demo image. (A hypercolumn unit is the minimal area of
primary visual cortex encompassing a complete cycle of
orientations, ocular dominances and other stimulus properties
such as spatial frequency and color selectivity. The geometric
organization of the cortex is irregular, so there are no discrete
regions corresponding to this notional unit, but it expresses the
distance metric of the cortical organization. Each hypercolumn
unit encompasses approximately 10,000 neurons in the 6-12
cortical layers. In humans, the natural units of cortical
processing characterized by the concept of the ‘hypercolumn’
are of the order of 2 mm wide in human visual cortex, the
disks in Fig. 2 should each stimulate about 25 such units.
If anything the color perception is more vivid in the
periphery, as might be expected from the fact that the cone
density decreases at a slower rate than linear reciprocity with
eccentricity. In fact, the cone density scales with
approximately the -2/3 power of eccentricity out to 20 [8].
Thus, the linear scaling of the disk sizes should result in the
stimulation of about 5 times [ (102/3/101)2 ] more cones in areal
4 deg 16 deg 25 deg 50 deg
Figure 3. Electronmicrographs of the rod and cones inner segments at four
representative eccentricities. Note that the cone densities are similar beyond 16 eccentricity, and account for up to 1/3 of the peripheral light capture area of the
photoreceptors. (from [2] with permission).
©2016 Society for Imaging Science and TechnologyDOI: 10.2352/ISSN.2470-1173.2016.16HVEI-138
IS&T International Symposium on Electronic Imaging 2016Human Vision and Electronic Imaging 2016
HVEI-138.2

terms by 20 than 2, giving scope for cortical processing to
account for the extra vividness that is perceptually observed.
Peripheral Motion Processing A further misconception that is also often held is that
peripheral motion processing is mediated by the rod
photoreceptors. The first aspect of this misconception is to
consider the relative distribution of rods and cones across the
retina. This is illustrated in en face electronmicrograph views
of the retina from [2] at the level of the inner segments, which
are the light-catching elements mechanism for the
photoreceptors (Fig. 3).
These images illustrate that the cone inner segments are much
larger than the rod inner segments at all peripheral
eccentricities, with a diameter of about 9 mm. This means that
their light capture area is about 25% of the retinal area, or
1/3rd of that of the rods at the minimum cone density of
4000/mm2, and as much as 33% of the retinal area over large
regions of the periphery, or up to ½ of the light capture area
may be expected to contribute a large proportion of the signal
to motion processing under mesopic lighting conditions, when
both rods and cones are active, and the whole of the motion
processing signal under photopic conditions, when the rods are
saturated or suppressed and no longer contributing any
significant differential signals to the cortex.
Figure 5. Demonstration movie illustrating the uniformity of the motion aftereffect for stimuli scaled with eccentricity. Fixate at the center to develop a motion
aftereffect, then maintain fixation at the center of the blank field to observe the motion aftereffect on the blank field and then on the static stimuli when they reappear.
StrengthoftheMo, onA. erffectasaFunc, onofEccentricity
Figure 4. Strength of the motion aftereffect as a function of eccentricity (from [9],
with permission). Left panel: cancellation velocities for the motion aftereffect as a
function of stimulus size at each of the eccentricities coded at right. Left panel:
rescaling the same data to a uniform estimated cortical size in proportion to
eccentricity aligns them to a single function.
©2016 Society for Imaging Science and TechnologyDOI: 10.2352/ISSN.2470-1173.2016.16HVEI-138
IS&T International Symposium on Electronic Imaging 2016Human Vision and Electronic Imaging 2016
HVEI-138.3

Running Head: BRAILLE WRITING IN THE BLIND
Figure 6. Demonstration movie illustrating the non-uniformity of the motion aftereffect for equiluminant stimuli scaled with eccentricity. As for Figure 5,f ixate at the
center to develop a motion aftereffect, then maintain fixation at the center of the static test field to view the motion aftereffect, which now seems more pronounced at the
center. View through a dark filter to verify that the colors contrast is invisible under scotopic (rod-mediated) conditions.
Motion Aftereffects The motion aftereffect is a well-established measure of
motion-specific processing in the visual system, since the
perception of motion may be mediated by a variety of
mechanisms, such as change in position, or eye-movement or
attentional tracking, but the perception of motion from static
stimuli is immune to all these mechanisms and can only be
attributed to the perception of motion per se. To assess the
relative rod-cone contribution, it needs to be assessed as a
function of luminance and eccentricity. Few studies appear to
have been conducted on this issue, but Murakami & Shimojo
[9] used a cancellation technique to show that the motion
aftereffect at photopic retinal illumination levels falls on a
uniform function when stimulus size is scaled with
eccentricity (Figure 4). This result implies that the motion
processing is fully operational under conditions of rod
saturation, which is also supported by [10,11].
To demonstrate the uniformity of the motion aftereffect
with eccentricity over a wider range than Murakami &
Shimojo [9], Figure 5 provides a stimulus of eccentricity-
scaled annular targets over an eccentricity range of 8:1. This
stimulus may be viewed at the requisite viewing distance to
achieve any desired eccentricity range. For example, if viewed
at a distance of half the width of the outer moving annulus, it
will stimulate out to 45 eccentricity. The first epoch of the
video is designed to develop a motion aftereffect, which is
first observed on the subsequent blank field and then on the
static stimuli when they reappear. Note that the motion
aftereffect appears equally strong across multiple
eccentricities, although it tends to fluctuate on the static
background stimuli, being most noticeable on the ring
attended at any given time. (it may also be weaker on the
central ring due to optical limitations in reproducing the
grating structure.) On a high intensity screen, the images are
being viewed under photopic conditions when the rods should
be inactivated by rod saturation and cone inhibition.
However, to address the issue of rod saturation more
directly, the motion may also be generated with a color
combination that is equiluminant to the rods. Figure 6
provides such a demonstration. It should be verified that, if
viewed with sufficient neutral density filtering (2.0 log units)
to eliminate the color contrast, the stimulus motion is no
longer visible. Thus, under the classical duplex interpretation,
this condition forms a null stimulus for the rod system, and all
motion can only be seen by the cone system. Viewing the
©2016 Society for Imaging Science and TechnologyDOI: 10.2352/ISSN.2470-1173.2016.16HVEI-138
IS&T International Symposium on Electronic Imaging 2016Human Vision and Electronic Imaging 2016
HVEI-138.4

stimulus under high intensity conditions reveals that the
motion aftereffect is now strongest at the center, decreasing
with eccentricity. Thus, on the static test field array, the
central ring seems to twist more rapidly than the peripheral
regions, even though they were subject to the same rotational
adaptation stimulus. This decrease toward the periphery under
pure color stimulation is consistent with the cone distribution
across the retina (see Figure 1), supporting the concept that
peripheral motion is adequately mediated by the cone
photoreceptor system rather than by the rods (although a rods
contribution to the effect from Figure 5 cannot be ruled out if
the viewing intensity is in the mesopic range). Taken together,
these analyses and demonstrations of Figures 5 & 6 restore the
legitimate roles of peripheral cones in both the perception and
processing of color and motion out to the far periphery of the
visual field.
Acknowledgements Some of this material has been published in iPerception [7].
References 1. Østerberg G.A. Topography of the layer of rods and cones in the human
retina. Acta Ophthalmol 13 (Supp. 6) 1-97, 1935.
2. Curcio C.A., Sloan K.R., Kalina R.E., Hendrickson A.E., Human
photoreceptor topography. J Comp Neurol 292, 497-523, 1990.
3. Song H., Chui T.Y., Zhong Z., Elsner A.E., Burns S.A. Variation of cone
photoreceptor packing density with retinal eccentricity and age. Invest
Ophthalmol Vis Sci, 52(10):7376-84, 2011.
4. Williams R.W. The human retina has a cone-enriched rim. Visual Neurosci
6:403–406, 1991.
5. Schira M.M., Tyler C.W., Breakspear M., Spehar B. The foveal confluence
in human visual cortex. J Neurosci. 29:9050-8, 2009.
6. Noorlander C., Koenderink J.J., den Ouden R.J., Edens B.W. Sensitivity to
spatiotemporal colour contrast in the peripheral visual field. Vision
Res. 23:1-11, 1991.
7. Tyler C.W. Peripheral colour demo. i-Perception 6 (6), 2041669515613671,
2015.
8. Tyler C.W. Analysis of human receptor density. In Basic and Clinical
Applications of Vision Science. Lakshminarayanan V. (ed.) Doc.
Ophthal Proc. 60:63-71, 1987.
9. Murakami I., Shimojo S. Modulation of motion aftereffect by surround
motion and its dependence on stimulus size and eccentricity. Vision
Res. 35(13):1835-44. 1995.
10. Gegenfurtner K.R., Mayser H.M., Sharpe L.T. Motion perception at
scotopic light levels. J Opt Soc Am A Opt Image Sci Vis. 17(9):1505-
1, 2000.
11. Vaziri-Pashkam, M., & Cavanagh, P. (2008). Apparent speed increases at
low luminance. J Vision, 8(16), 9.1–912. http://doi.org/10.1167/8.16.9.
Author Biography Christopher Tyler received his undergraduate and graduate training in
England and has taught at Northeastern University, Boston, UCLA, UC Santa
Barbara and UC Berkeley. He is the author of over 250 publications in visual
psychophysics, visual neuroscience and the perceptual analysis of art. He
developed the Sweep VEP for estimating infant visual acuity, the flicker
visuogram to assess ocular processing deficits in ophthalmic diseases and the
corrugation frequency approach to the analysis of stereoscopic processing.
©2016 Society for Imaging Science and TechnologyDOI: 10.2352/ISSN.2470-1173.2016.16HVEI-138
IS&T International Symposium on Electronic Imaging 2016Human Vision and Electronic Imaging 2016 HVEI-138.5