performance indicators for sustainable rice cultivation performance indicators... · pesticide-use...
TRANSCRIPT
Sustainable Rice Platform
www.sustainablerice.org
Version 1.0
October 2015
Performance Indicators for Sustainable Rice Cultivation
©Sustainable Rice Platform
This work is published by the Sustainable Rice Platform under a Creative Commons Attribution-NonCommercial-Share Alike 3.0 License. It should be cited as follows:
SRP (2015). Performance Indicators for Sustainable Rice Cultivation, Sustainable Rice Platform. Bangkok: 2015.Available at http://www.sustainablerice.org
AuthorsThis document has been prepared by the Sustainable Rice Platform (SRP) team led by United Nations Environment Programme (UNEP), International Rice Research Institute (IRRI), UTZ Certified, and Aidenvironment, and supported by the SRP Secretariat, following extensive consultation with SRP members, external stakeholders, and ad hoc working groups focusing on specific topics.
AcknowledgementsThe SRP team wishes to express its gratitude to current and immediate past members of the SRP Advisory Committee: James Lomax (UNEP), Bas Bouman (IRRI), Rajeev Raina (Olam), Luc Beerens (Mars Foods), Richard Burkinshaw (Kellogg’s), Guy Hogge (Louis Dreyfus), Pham Van Du (Ministry of Agriculture and Rural Development, Vietnam), Ladda Viriyangkura (Rice Department, Thailand), and Surinder Kukal (Punjab Agricultural University, India).
SRP Secretariat: Wyn Ellis (SRP Coordinator); Sarah Beebout (IRRI); Dirk Straathof, Anke Kampschreur, Liselotte de Vries and Patricia Garcia Diaz (UTZ Certified); and Jan Willem Molenaar (Aidenvironment).
Layout was managed by the International Rice Research Institute, IRRI, Los Baños, Philippines. The SRP team would also like to thank all participants at the SRP Standard and Indicators Workshop held at the UNEP Regional Office for Asia and the Pacific in Bangkok on 16-17 February 2015, as well as the many other contributors, reviewers, and ad hoc dialogue partners for their many invaluable contributions over the past 18 months, and for helping to enable the timely release of this document.
DisclaimerThe views expressed in this document are purely those of the authors and may not in any circumstance be regarded as stating an official position of the organizations involved.
The Sustainable Rice Platform (SRP) SRP is a global multi-stakeholder alliance co-convened by UNEP and IRRI in 2011, comprising 29 institutional stakeholders, including public and private sector stakeholders, research, financial institutions and NGOs. SRP promotes resource-use efficiency and climate change resilience in rice systems—both on-farm and throughout value chains—and pursues voluntary market transformation initiatives by developing sustainable production standards, indicators, incentive mechanisms, and outreach mechanisms to boost wide-scale adoption of sustainable best practices throughout rice value chains. SRP’s goal is to minimize environmental impacts of rice production and consumption while enhancing smallholder incomes and contributing to food security.
Contact detailsFor further details contact Wyn Ellis, SRP Coordinator: Tel: +66 2 288 1801Email: [email protected] Web: www.sustainablerice.org
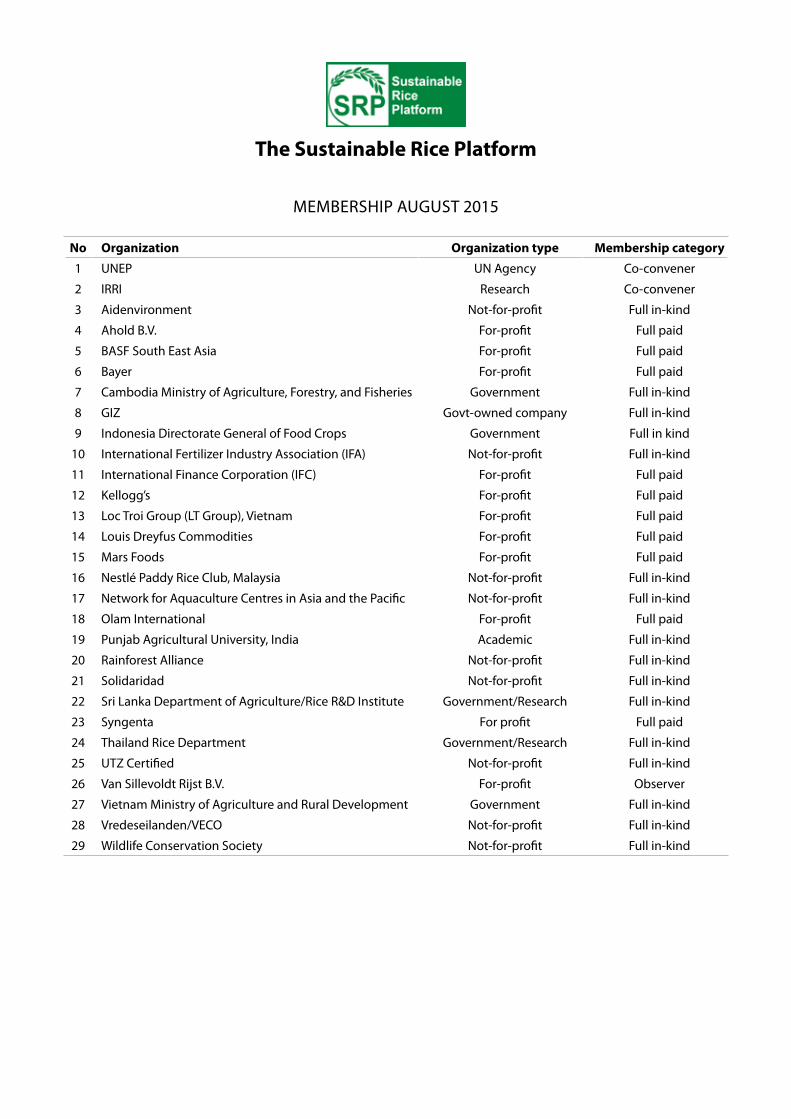
The Sustainable Rice Platform
MEMBERSHIP AUGUST 2015
No Organization Organization type Membership category
1 UNEP UN Agency Co-convener
2 IRRI Research Co-convener
3 Aidenvironment Not-for-profit Full in-kind
4 Ahold B.V. For-profit Full paid
5 BASF South East Asia For-profit Full paid
6 Bayer For-profit Full paid
7 Cambodia Ministry of Agriculture, Forestry, and Fisheries Government Full in-kind
8 GIZ Govt-owned company Full in-kind
9 Indonesia Directorate General of Food Crops Government Full in kind
10 International Fertilizer Industry Association (IFA) Not-for-profit Full in-kind
11 International Finance Corporation (IFC) For-profit Full paid
12 Kellogg’s For-profit Full paid
13 Loc Troi Group (LT Group), Vietnam For-profit Full paid
14 Louis Dreyfus Commodities For-profit Full paid
15 Mars Foods For-profit Full paid
16 Nestlé Paddy Rice Club, Malaysia Not-for-profit Full in-kind
17 Network for Aquaculture Centres in Asia and the Pacific Not-for-profit Full in-kind
18 Olam International For-profit Full paid
19 Punjab Agricultural University, India Academic Full in-kind
20 Rainforest Alliance Not-for-profit Full in-kind
21 Solidaridad Not-for-profit Full in-kind
22 Sri Lanka Department of Agriculture/Rice R&D Institute Government/Research Full in-kind
23 Syngenta For profit Full paid
24 Thailand Rice Department Government/Research Full in-kind
25 UTZ Certified Not-for-profit Full in-kind
26 Van Sillevoldt Rijst B.V. For-profit Observer
27 Vietnam Ministry of Agriculture and Rural Development Government Full in-kind
28 Vredeseilanden/VECO Not-for-profit Full in-kind
29 Wildlife Conservation Society Not-for-profit Full in-kind

Sustainable Rice Platform 1
The Sustainable Rice Platform (SRP) is a multi-stakeholder partnership to promote resource-use efficiency and sustainability both on-farm and throughout the rice value chain. The SRP is developing a range of tools to promote sustainable rice cultivation, including guidelines, a standard, training modules, and decision-making tools. These tools
are intended to be used either separately or together as appropriate to the farmer context.
Through a multi-stakeholder process, the SRP has developed the SRP Standard for Sustainable Rice Cultivation v.1.0, which we are now pleased to make available to SRP members. The SRP Standard has been developed based on priorities defined in a set of 12 Performance Indicators (PIs), complemented with several topics essential for acceptance in potential destination markets. The Standard defines a set of key requirements with different levels of performance allowing for a stepwise improvement and compliance process.
The PIs are designed to support the Standard by measuring changes resulting from the adoption of on-farm sustainable best practices, for example, through compliance with the SRP Standard or other interventions of interest to SRP members. The PIs thus offer a valuable and flexible tool to enhance our understanding of the effectiveness of individual interventions and to create a basis to communicate on progress toward sustainability in any rice system.
The field implementation phase will be an important next step to ensure relevance, robustness, and user-friendliness of the Standard and PIs. Feedback from this implementation phase will help us to refine the tools to maximize value to SRP members, and establish their utility as scalable tools for driving wide-scale adoption of sustainable best practices.
The SRP is therefore pleased to offer its members an opportunity to participate in this implementation phase to be conducted in a number of countries representing a range of production and ecosystem contexts. SRP members are welcome to participate in field validation of the Standard and PIs, either independently or separately, using their own facilities, with support and coordination from the SRP Secretariat.
Field testing will require a common methodology to allow aggregation and analysis of data from different locations. It is anticipated that an online data entry tool will be offered to members in the near future to facilitate and standardize data entry processes and automate analysis of field data by users themselves. The system will provide spatial information to allow linkages with other data, such as weather maps.
This document provides an introduction to the Performance Indicators, a description of each PI, and the methodologies required for sampling and data collection. The Annex provides scorecards to be used in evaluating four specific PIs: pesticide-use efficiency (PI 8), health and safety (PI 10), child labor (PI 11), and women’s empowerment (PI 12).
This document is intended to be used in conjunction with the SRP Standard and the Field Implementation Protocol. The updated Standard, PIs, Implementation Protocol, and reporting templates are all available for download in the Members’ Area of the SRP website: www.sustainablerice.org, or from the SRP Secretariat: [email protected].
Introduction
Sustainable Rice Platform 2
Introduction
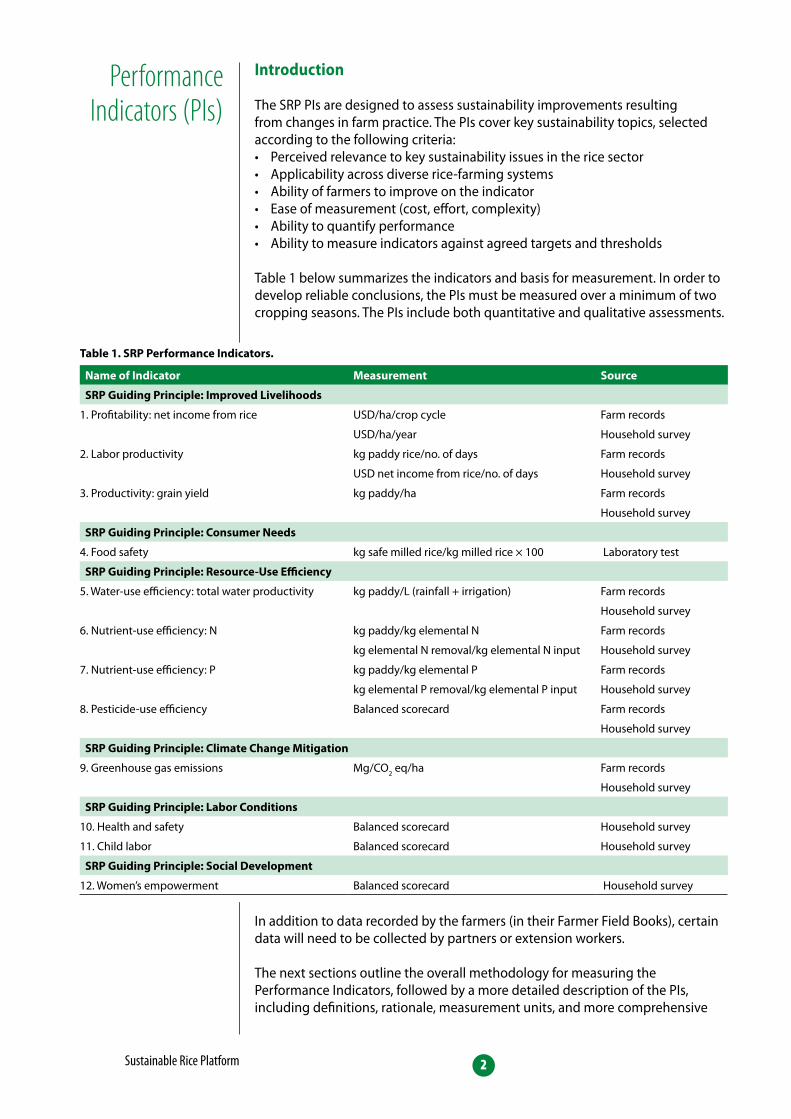
The SRP PIs are designed to assess sustainability improvements resulting from changes in farm practice. The PIs cover key sustainability topics, selected according to the following criteria:• Perceived relevance to key sustainability issues in the rice sector• Applicability across diverse rice-farming systems • Ability of farmers to improve on the indicator • Ease of measurement (cost, effort, complexity)• Ability to quantify performance• Ability to measure indicators against agreed targets and thresholds
Table 1 below summarizes the indicators and basis for measurement. In order to develop reliable conclusions, the PIs must be measured over a minimum of two cropping seasons. The PIs include both quantitative and qualitative assessments.
Performance Indicators (PIs)
In addition to data recorded by the farmers (in their Farmer Field Books), certain data will need to be collected by partners or extension workers. The next sections outline the overall methodology for measuring the Performance Indicators, followed by a more detailed description of the PIs, including definitions, rationale, measurement units, and more comprehensive
Table 1. SRP Performance Indicators.
Name of Indicator Measurement Source
SRP Guiding Principle: Improved Livelihoods
1. Profitability: net income from rice USD/ha/crop cycle Farm records
USD/ha/year Household survey
2. Labor productivity kg paddy rice/no. of days Farm records
USD net income from rice/no. of days Household survey
3. Productivity: grain yield kg paddy/ha Farm records
Household survey
SRP Guiding Principle: Consumer Needs
4. Food safety kg safe milled rice/kg milled rice × 100 Laboratory test
SRP Guiding Principle: Resource-Use Efficiency
5. Water-use efficiency: total water productivity kg paddy/L (rainfall + irrigation) Farm records
Household survey
6. Nutrient-use efficiency: N kg paddy/kg elemental N Farm records
kg elemental N removal/kg elemental N input Household survey
7. Nutrient-use efficiency: P kg paddy/kg elemental P Farm records
kg elemental P removal/kg elemental P input Household survey
8. Pesticide-use efficiency Balanced scorecard Farm records
Household survey
SRP Guiding Principle: Climate Change Mitigation
9. Greenhouse gas emissions Mg/CO2 eq/ha Farm records
Household survey
SRP Guiding Principle: Labor Conditions
10. Health and safety Balanced scorecard Household survey
11. Child labor Balanced scorecard Household survey
SRP Guiding Principle: Social Development
12. Women’s empowerment Balanced scorecard Household survey
Sustainable Rice Platform 3
information on the measurement details and data collection. The Annex contains the scorecards to be used for assessing four PIs:• Pesticide-use efficiency (PI No. 8)• Health and safety (PI No. 10)• Child labor (PI No. 11)• Women’s empowerment (PI No. 12)
Data collection methodology
Responsibilities
The implementing partner is responsible for the data collection process. An implementing partner may be a research institute, company, extension worker, project owner, group manager, or miller. Data collection can be organized in different ways. When one relies on farmer records, it is important to ensure that the farmers have the capacity, willingness, and information to measure accurately. One can also visit farmers frequently (e.g., weekly) to discuss their activities over the previous period.
Number of PIs to measure
We recommend the measurement of all Performance Indicators as this will provide the best information about possible trade-offs and, as such, a more reliable picture of the total concept of sustainability. We do, however, acknowledge that the relative importance of indicators may depend on the particular context, the intervention strategy, or available resources. Implementing partners are therefore free to decide which PIs they want to measure.
Frequency of data collection
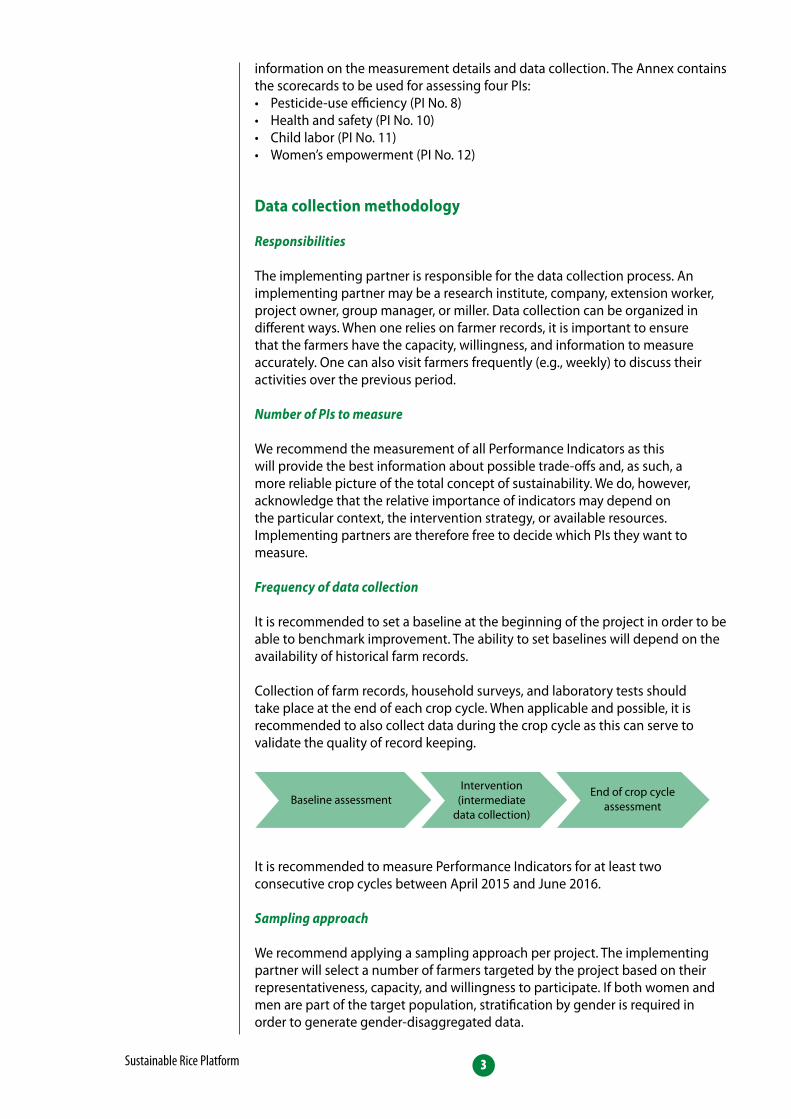
It is recommended to set a baseline at the beginning of the project in order to be able to benchmark improvement. The ability to set baselines will depend on the availability of historical farm records.
Collection of farm records, household surveys, and laboratory tests should take place at the end of each crop cycle. When applicable and possible, it is recommended to also collect data during the crop cycle as this can serve to validate the quality of record keeping.
It is recommended to measure Performance Indicators for at least two consecutive crop cycles between April 2015 and June 2016.
Sampling approach
We recommend applying a sampling approach per project. The implementing partner will select a number of farmers targeted by the project based on their representativeness, capacity, and willingness to participate. If both women and men are part of the target population, stratification by gender is required in order to generate gender-disaggregated data.
Baseline assessmentIntervention
(intermediatedata collection)
End of crop cycleassessment
Sustainable Rice Platform 4
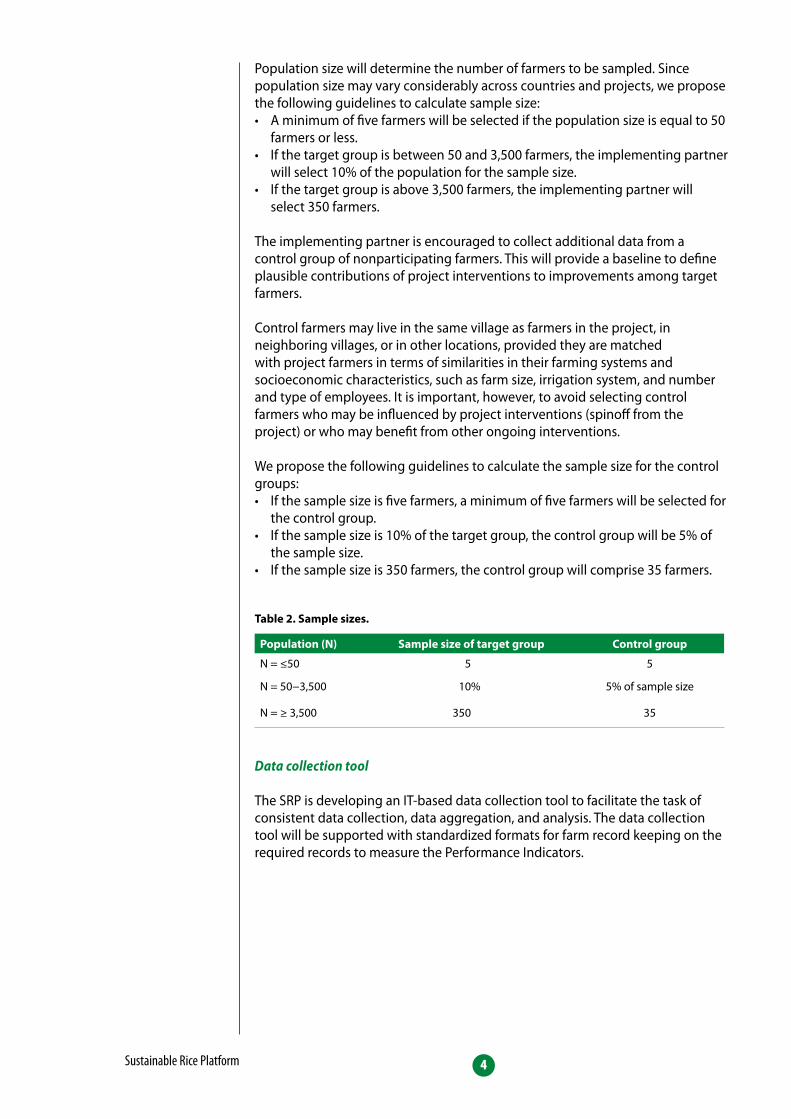
Population size will determine the number of farmers to be sampled. Since population size may vary considerably across countries and projects, we propose the following guidelines to calculate sample size:• A minimum of five farmers will be selected if the population size is equal to 50
farmers or less. • If the target group is between 50 and 3,500 farmers, the implementing partner
will select 10% of the population for the sample size.• If the target group is above 3,500 farmers, the implementing partner will
select 350 farmers.
The implementing partner is encouraged to collect additional data from a control group of nonparticipating farmers. This will provide a baseline to define plausible contributions of project interventions to improvements among target farmers.
Control farmers may live in the same village as farmers in the project, in neighboring villages, or in other locations, provided they are matched with project farmers in terms of similarities in their farming systems and socioeconomic characteristics, such as farm size, irrigation system, and number and type of employees. It is important, however, to avoid selecting control farmers who may be influenced by project interventions (spinoff from the project) or who may benefit from other ongoing interventions.
We propose the following guidelines to calculate the sample size for the control groups:• If the sample size is five farmers, a minimum of five farmers will be selected for
the control group.• If the sample size is 10% of the target group, the control group will be 5% of
the sample size.• If the sample size is 350 farmers, the control group will comprise 35 farmers.
Population (N) Sample size of target group Control group
N = ≤50 5 5
N = 50−3,500 10% 5% of sample size
N = ≥ 3,500 350 35
Data collection tool
The SRP is developing an IT-based data collection tool to facilitate the task of consistent data collection, data aggregation, and analysis. The data collection tool will be supported with standardized formats for farm record keeping on the required records to measure the Performance Indicators.
Table 2. Sample sizes.
Sustainable Rice Platform 5
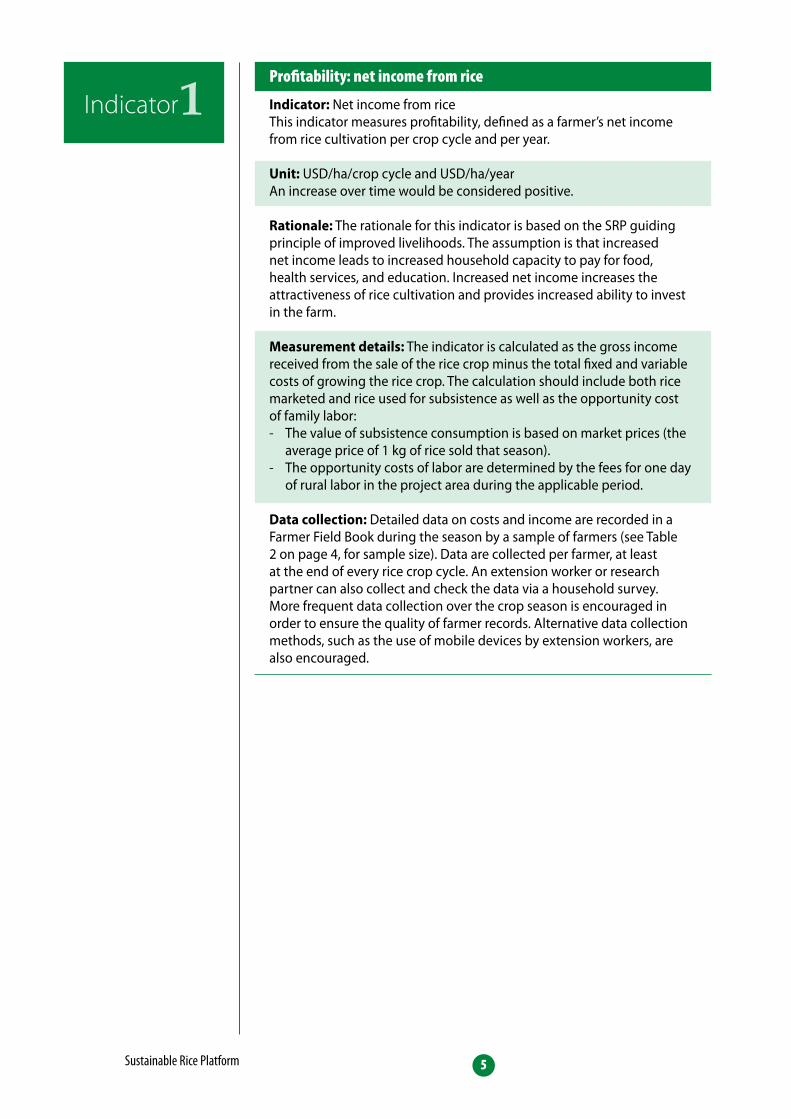
Indicator: Net income from riceThis indicator measures profitability, defined as a farmer’s net income from rice cultivation per crop cycle and per year.
Unit: USD/ha/crop cycle and USD/ha/yearAn increase over time would be considered positive.
Rationale: The rationale for this indicator is based on the SRP guiding principle of improved livelihoods. The assumption is that increased net income leads to increased household capacity to pay for food, health services, and education. Increased net income increases the attractiveness of rice cultivation and provides increased ability to invest in the farm.
Measurement details: The indicator is calculated as the gross income received from the sale of the rice crop minus the total fixed and variable costs of growing the rice crop. The calculation should include both rice marketed and rice used for subsistence as well as the opportunity cost of family labor:- The value of subsistence consumption is based on market prices (the
average price of 1 kg of rice sold that season).- The opportunity costs of labor are determined by the fees for one day
of rural labor in the project area during the applicable period.
Data collection: Detailed data on costs and income are recorded in a Farmer Field Book during the season by a sample of farmers (see Table 2 on page 4, for sample size). Data are collected per farmer, at least at the end of every rice crop cycle. An extension worker or research partner can also collect and check the data via a household survey. More frequent data collection over the crop season is encouraged in order to ensure the quality of farmer records. Alternative data collection methods, such as the use of mobile devices by extension workers, are also encouraged.
Profitability: net income from rice
Indicator1
Sustainable Rice Platform 6
Indicator: Labor productivityThis indicator measures labor productivity, defined as the total number of days worked per kg of rice produced.
Unit: kg paddy rice/no. of days and USD net income from rice/no. of days An increase over time would be considered positive.
Rationale: The rationale for this indicator is based on the SRP guiding principle of improved livelihoods. The assumption is that increased labor productivity leads to increased profitability, more time to spend on other activities, increased attractiveness of rice cultivation, and increased willingness to invest in the farm.
Measurement details: Labor productivity includes labor in all rice-related farm activities such as field clearing, plowing, planting, irrigation and fertilizer application, pest management, and harvesting.
Labor includes temporary, permanent, and seasonal workers paid in cash as well as nonpaid labor carried out by household members, other relatives, and acquaintances.
Data collection: Detailed data on labor inputs (both family and hired) are recorded in a Farmer Field Book over the rice season by a sample of farmers (see Table 2 on page 4, for sample size). Data are collected per farmer, at least at the end of every rice crop cycle. An extension worker or research partner can also collect and check the data via a household survey. More frequent data collection over the crop season is encouraged in order to ensure the quality of farmer records. Alternative data collection methods, such as the use of mobile devices by extension workers, are also encouraged.
Labor productivity
Indicator2
Sustainable Rice Platform 7
Indicator: Grain yieldThis indicator measures productivity, defined as the recovered grain yield per hectare.
Unit: kg paddy/ha/crop cycle and kg paddy/ha/yearAn increase over time would be considered positive.
Rationale: The rationale for this indicator is based on the SRP guiding principle of improved livelihoods. The assumption is that increased productivity leads to increased household food security, an increase in marketable surplus, and increased national and international food security.
Measurement details: Yield is measured in kilograms of wet grain yield harvested, with an adjustment to 14% moisture content calculated on the basis of the measured moisture content at the time of weighing. Before weighing, the grain should be threshed and dried to an appropriate moisture content for selling, milling, or storage, depending on the intended immediate use. A moisture meter should be used to document the actual moisture content at the time of weighing. This value can be used to calculate the final grain yield, which must be reported at 14% moisture content. The entire harvest should be weighed and divided by the total land area.
If the farmer records separate yield measurements for different fields within a farm, these should be averaged across the whole farm (total amount of grain harvested/total land area of the farm) and reported as one value per household.
Rice yields should be disaggregated by- Type (specialty, normal, etc.) to provide information on the farmer’s
choice (e.g., high-yielding varieties or low-yielding, high-value specialty products such as red glutinous rice).
- Cropping season.
Data collection: Detailed data on yields are recorded in a Farmer Field Book during the rice season by a sample of farmers (see Table 2 on page 4, for sample size). Data are collected per farmer, at least at the end of every rice crop cycle. An extension worker or research partner can also collect and check the data via a household survey. Alternative data collection methods, such as the use of mobile devices by extension workers, are also encouraged.
Productivity: grain yield
Indicator3
Sustainable Rice Platform 8
Indicator: Food safetyThis indicator measures food safety, defined as the percentage of milled rice that falls within safety requirements for heavy metals, pesticide residues, and mycotoxins.
Unit: kg safe milled rice/kg milled rice × 100The target should be 100%.
Rationale: The rationale for this indicator is based on the SRP guiding principle of consumer needs. The assumption is that safe rice products lead to consumer assurance. Safer food reduces rice-related human exposure to specific contaminants and leads to a healthier population.
Measurement details: Food safety is calculated as the total amount of safe milled rice, in kilograms, divided by the total amount of milled rice and multiplied by 100.
- From a food safety point of view, it is highly recommended to test at least once for heavy metals (arsenic, cadmium, mercury, chromium, and lead). Alternatively, one can decide to test based on a risk assessment. If no risks have been identified, there is no need for further tests. If moderate levels of heavy metals have been detected, subsequent tests need to be conducted.
- Tests for mycotoxins must be conducted at least once; if there is no reason for concern, tests can be repeated at intervals of five or six seasons. If there is concern, tests need to be repeated every season. As mycotoxin infections are triggered by diseases at the panicle stage, tests for mycotoxins should be conducted in the event of detection of a risk of panicle diseases.
- A preliminary test must be conducted for pesticide residues whenever pesticide residues exceeding MRLs (Maximum Residue Limits) have been reported by any national government within the last 5 years.
To ensure food safety, above tests should be conducted for all farms in the first season. In subsequent seasons, additional samples of some farms can be taken for verification, with locations selected through a process to be determined (the quantity based on analytical budgets, and at locations selected either randomly or on the basis of areas of concern). If resources are a constraint and requirements for food safety allow for it, the initial tests could also be based upon a sample (see Table 2 on page 4, for sample size).
The SRP will consider selecting one or two labs to standardize the analytical procedure for use by all SRP participants. These should have automated LCMS-MS capability, enabling analysis for many pesticides at one time.
Data collection: If a mill has traceability to the farm level, the miller or extension worker can collect the samples after milling. Without this traceability, one could collect samples of paddy from a sample of farms, send the samples to a centralized sample collection system, and then have them all milled by the laboratory immediately before analysis. This last option is still second-best to testing the product after it has gone through the real-world milling process, but it is more meaningful for improving food safety at the farm level. In both cases, records are kept of the size of the batch from which the sample was taken (in kg).
Food safety
Indicator4
Sustainable Rice Platform 9
Indicator: Total water productivityThis indicator measures water-use efficiency, defined as the total amount of recovered yield per input of water.
Unit: kg paddy rice/L (rainfall + irrigation)An increase over time would be considered positive.
Rationale: The rationale for this indicator is based on the SRP guiding principle of resource-use efficiency. The assumption is that savings in irrigation or rainwater can be used for other important purposes (i.e., water availability increases).
Measurement details: Accurate field dimensions are required for this parameter. The farmer records in the Farmer Field Book details on the water input or energy consumption for each irrigation event. Water inputs are disaggregated by source: rainwater, groundwater, or surface water.
- Rainfall (mm), either within individual farmer fields or at a village level, is recorded using a rain gauge after each rainfall event. Alternatively, rainfall data can be sourced from local meteorological organizations or using global rainfall prediction models that are available through agencies such as NASA. Rain-gauge data can be used to ground-truth rainfall model data.
- Groundwater irrigation. The farmer records the total number of irrigation events and the depth of water in the field at the start and end of each irrigation event. The initial water depth at the start of each irrigation should be negative where alternate wetting and drying (AWD) irrigation scheduling is used, reflecting the water level below the soil surface. When possible, the farmer records the amount of pumped groundwater by installing a flow meter or calibrated pump and then records the time it is open or the amount of energy used to pump the water. Alternatively, the discharge capacity (in terms of liters per second or equivalent units) and size of the pump, depth of groundwater (m), and the amount of energy consumed, either volume (diesel, gasoline) or kWh (electricity), during each irrigation event or total irrigation energy consumption per season, should be recorded.
- Surface-water irrigation. The farmer records the number of irrigation events and the depth of water in the field at the start and end of each irrigation event. The initial water depth at the start of each irrigation should be negative where AWD irrigation scheduling is used, reflecting the water level below the soil surface. When possible, the farmer should install an appropriate flow-measuring device for open or closed channels, such as a weir, flume, submerged orifice, or current meter.
Data collection: Detailed data on rainfall and irrigation are recorded in a Farmer Field Book during the rice season by a sample of farmers (see Table 2 on page 4, for sample size). Data are collected per farmer, at least at the end of every rice season. However, this indicator, would especially benefit from more frequent data collection to ensure completeness and quality of data. An extension worker or research partner can also collect and check the data via a household survey. Alternative data collection methods, such as the use of mobile devices by extension workers, are also encouraged.
Water-use efficiency
Indicator5
Sustainable Rice Platform 10
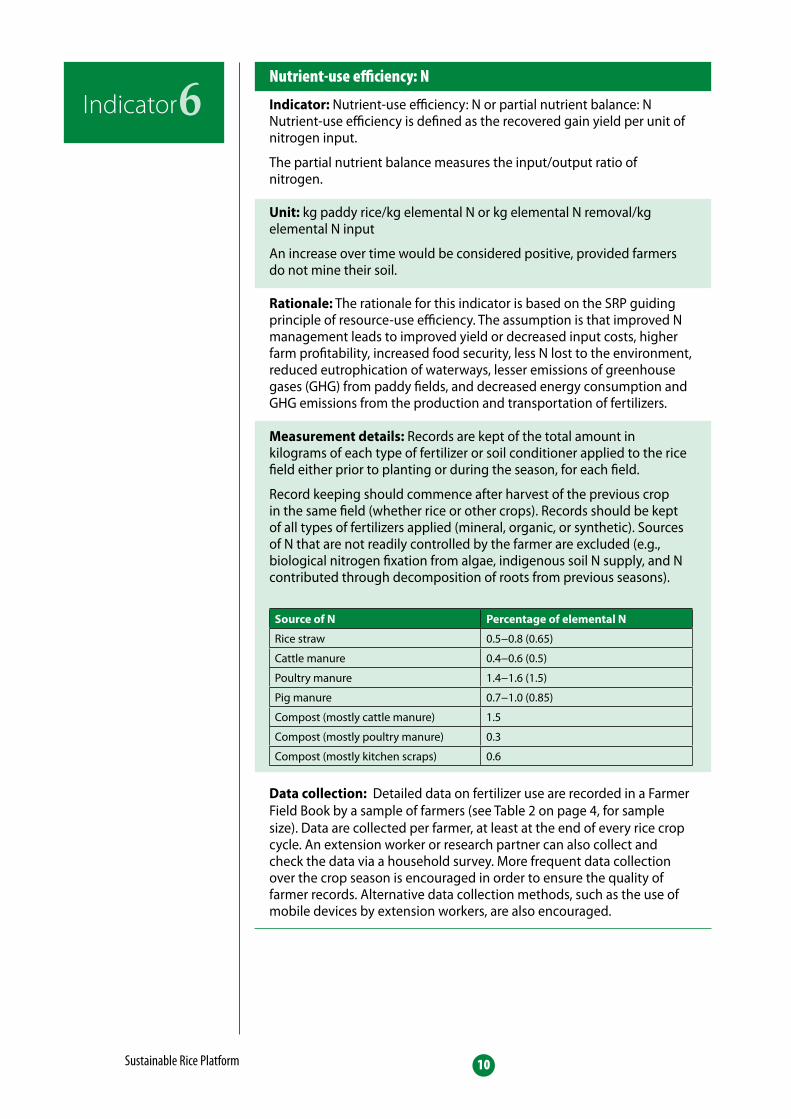
Indicator: Nutrient-use efficiency: N or partial nutrient balance: NNutrient-use efficiency is defined as the recovered gain yield per unit of nitrogen input.
The partial nutrient balance measures the input/output ratio of nitrogen.
Unit: kg paddy rice/kg elemental N or kg elemental N removal/kg elemental N input
An increase over time would be considered positive, provided farmers do not mine their soil.
Rationale: The rationale for this indicator is based on the SRP guiding principle of resource-use efficiency. The assumption is that improved N management leads to improved yield or decreased input costs, higher farm profitability, increased food security, less N lost to the environment, reduced eutrophication of waterways, lesser emissions of greenhouse gases (GHG) from paddy fields, and decreased energy consumption and GHG emissions from the production and transportation of fertilizers.
Measurement details: Records are kept of the total amount in kilograms of each type of fertilizer or soil conditioner applied to the rice field either prior to planting or during the season, for each field.
Record keeping should commence after harvest of the previous crop in the same field (whether rice or other crops). Records should be kept of all types of fertilizers applied (mineral, organic, or synthetic). Sources of N that are not readily controlled by the farmer are excluded (e.g., biological nitrogen fixation from algae, indigenous soil N supply, and N contributed through decomposition of roots from previous seasons).
Data collection: Detailed data on fertilizer use are recorded in a Farmer Field Book by a sample of farmers (see Table 2 on page 4, for sample size). Data are collected per farmer, at least at the end of every rice crop cycle. An extension worker or research partner can also collect and check the data via a household survey. More frequent data collection over the crop season is encouraged in order to ensure the quality of farmer records. Alternative data collection methods, such as the use of mobile devices by extension workers, are also encouraged.
Nutrient-use efficiency: N
Indicator6
Source of N Percentage of elemental N
Rice straw 0.5−0.8 (0.65)
Cattle manure 0.4−0.6 (0.5)
Poultry manure 1.4−1.6 (1.5)
Pig manure 0.7−1.0 (0.85)
Compost (mostly cattle manure) 1.5
Compost (mostly poultry manure) 0.3
Compost (mostly kitchen scraps) 0.6
Sustainable Rice Platform 11
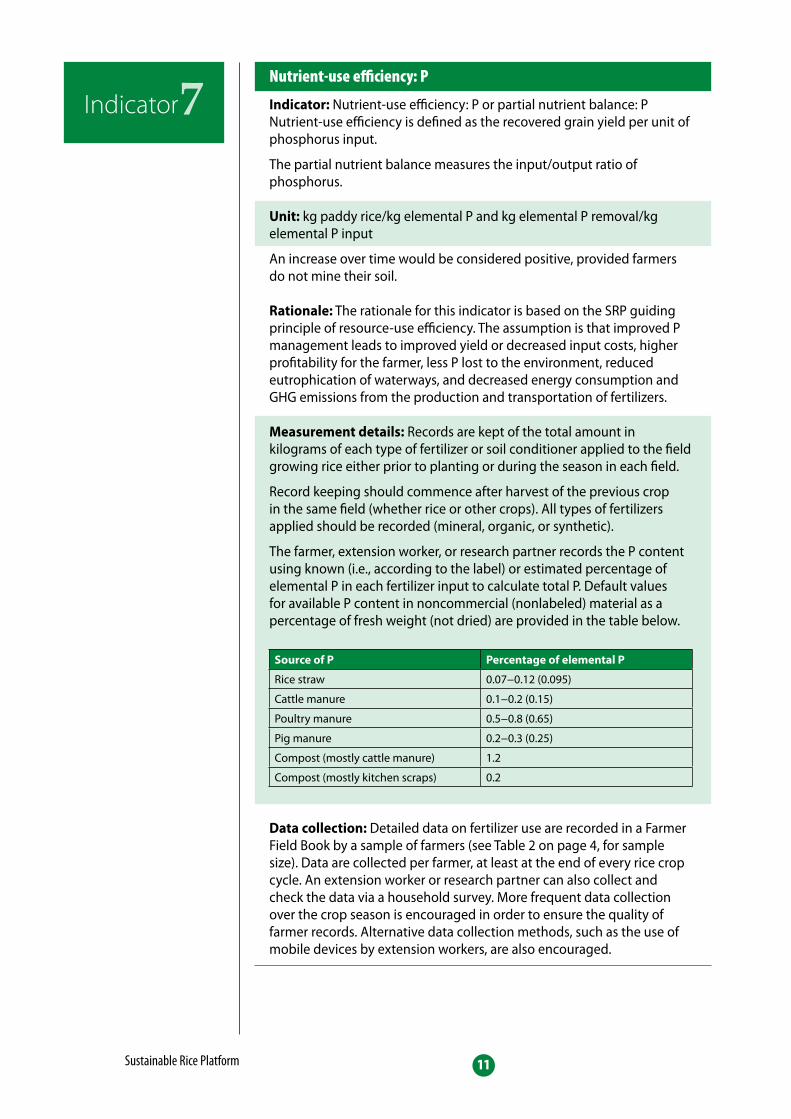
Indicator: Nutrient-use efficiency: P or partial nutrient balance: P Nutrient-use efficiency is defined as the recovered grain yield per unit of phosphorus input.
The partial nutrient balance measures the input/output ratio of phosphorus.
Unit: kg paddy rice/kg elemental P and kg elemental P removal/kg elemental P input
An increase over time would be considered positive, provided farmers do not mine their soil.
Rationale: The rationale for this indicator is based on the SRP guiding principle of resource-use efficiency. The assumption is that improved P management leads to improved yield or decreased input costs, higher profitability for the farmer, less P lost to the environment, reduced eutrophication of waterways, and decreased energy consumption and GHG emissions from the production and transportation of fertilizers.
Measurement details: Records are kept of the total amount in kilograms of each type of fertilizer or soil conditioner applied to the field growing rice either prior to planting or during the season in each field.
Record keeping should commence after harvest of the previous crop in the same field (whether rice or other crops). All types of fertilizers applied should be recorded (mineral, organic, or synthetic).
The farmer, extension worker, or research partner records the P content using known (i.e., according to the label) or estimated percentage of elemental P in each fertilizer input to calculate total P. Default values for available P content in noncommercial (nonlabeled) material as a percentage of fresh weight (not dried) are provided in the table below.
Data collection: Detailed data on fertilizer use are recorded in a Farmer Field Book by a sample of farmers (see Table 2 on page 4, for sample size). Data are collected per farmer, at least at the end of every rice crop cycle. An extension worker or research partner can also collect and check the data via a household survey. More frequent data collection over the crop season is encouraged in order to ensure the quality of farmer records. Alternative data collection methods, such as the use of mobile devices by extension workers, are also encouraged.
Nutrient-use efficiency: P
Indicator7
Source of P Percentage of elemental P
Rice straw 0.07−0.12 (0.095)
Cattle manure 0.1−0.2 (0.15)
Poultry manure 0.5−0.8 (0.65)
Pig manure 0.2−0.3 (0.25)
Compost (mostly cattle manure) 1.2
Compost (mostly kitchen scraps) 0.2
Sustainable Rice Platform 12
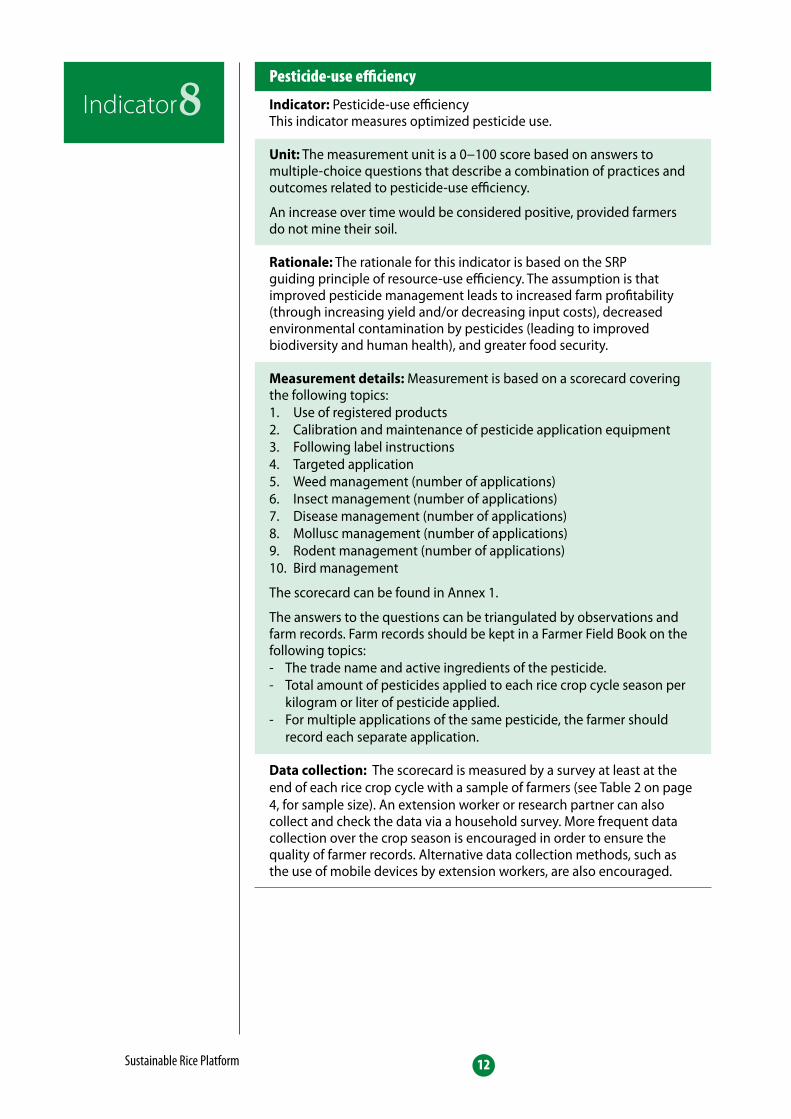
Indicator: Pesticide-use efficiencyThis indicator measures optimized pesticide use.
Unit: The measurement unit is a 0−100 score based on answers to multiple-choice questions that describe a combination of practices and outcomes related to pesticide-use efficiency.
An increase over time would be considered positive, provided farmers do not mine their soil.
Rationale: The rationale for this indicator is based on the SRP guiding principle of resource-use efficiency. The assumption is that improved pesticide management leads to increased farm profitability (through increasing yield and/or decreasing input costs), decreased environmental contamination by pesticides (leading to improved biodiversity and human health), and greater food security.
Measurement details: Measurement is based on a scorecard covering the following topics:1. Use of registered products2. Calibration and maintenance of pesticide application equipment3. Following label instructions4. Targeted application5. Weed management (number of applications)6. Insect management (number of applications)7. Disease management (number of applications)8. Mollusc management (number of applications)9. Rodent management (number of applications)10. Bird management
The scorecard can be found in Annex 1.
The answers to the questions can be triangulated by observations and farm records. Farm records should be kept in a Farmer Field Book on the following topics: - The trade name and active ingredients of the pesticide.- Total amount of pesticides applied to each rice crop cycle season per
kilogram or liter of pesticide applied. - For multiple applications of the same pesticide, the farmer should
record each separate application.
Data collection: The scorecard is measured by a survey at least at the end of each rice crop cycle with a sample of farmers (see Table 2 on page 4, for sample size). An extension worker or research partner can also collect and check the data via a household survey. More frequent data collection over the crop season is encouraged in order to ensure the quality of farmer records. Alternative data collection methods, such as the use of mobile devices by extension workers, are also encouraged.
Pesticide-use efficiency
Indicator8
Sustainable Rice Platform 13
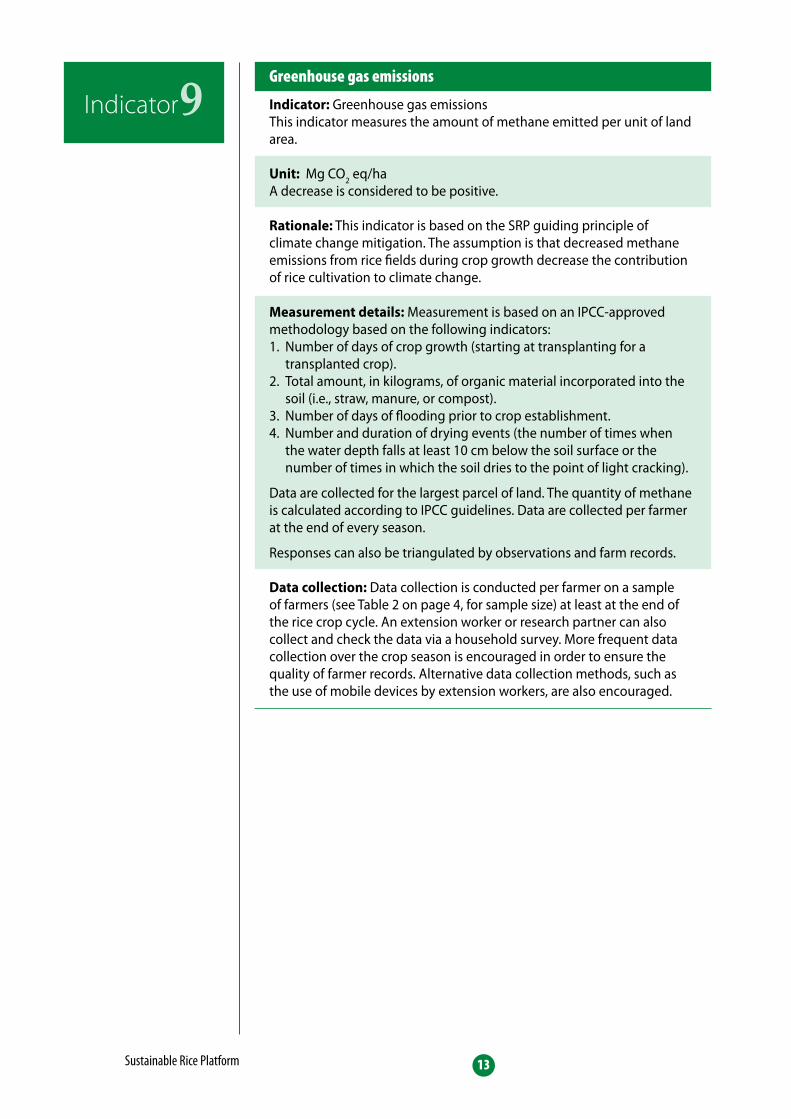
Indicator: Greenhouse gas emissionsThis indicator measures the amount of methane emitted per unit of land area.
Unit: Mg CO2 eq/ha
A decrease is considered to be positive.
Rationale: This indicator is based on the SRP guiding principle of climate change mitigation. The assumption is that decreased methane emissions from rice fields during crop growth decrease the contribution of rice cultivation to climate change.
Measurement details: Measurement is based on an IPCC-approved methodology based on the following indicators:1. Number of days of crop growth (starting at transplanting for a
transplanted crop).2. Total amount, in kilograms, of organic material incorporated into the
soil (i.e., straw, manure, or compost).3. Number of days of flooding prior to crop establishment.4. Number and duration of drying events (the number of times when
the water depth falls at least 10 cm below the soil surface or the number of times in which the soil dries to the point of light cracking).
Data are collected for the largest parcel of land. The quantity of methane is calculated according to IPCC guidelines. Data are collected per farmer at the end of every season.
Responses can also be triangulated by observations and farm records.
Data collection: Data collection is conducted per farmer on a sample of farmers (see Table 2 on page 4, for sample size) at least at the end of the rice crop cycle. An extension worker or research partner can also collect and check the data via a household survey. More frequent data collection over the crop season is encouraged in order to ensure the quality of farmer records. Alternative data collection methods, such as the use of mobile devices by extension workers, are also encouraged.
Greenhouse gas emissions
Indicator9
Sustainable Rice Platform 14
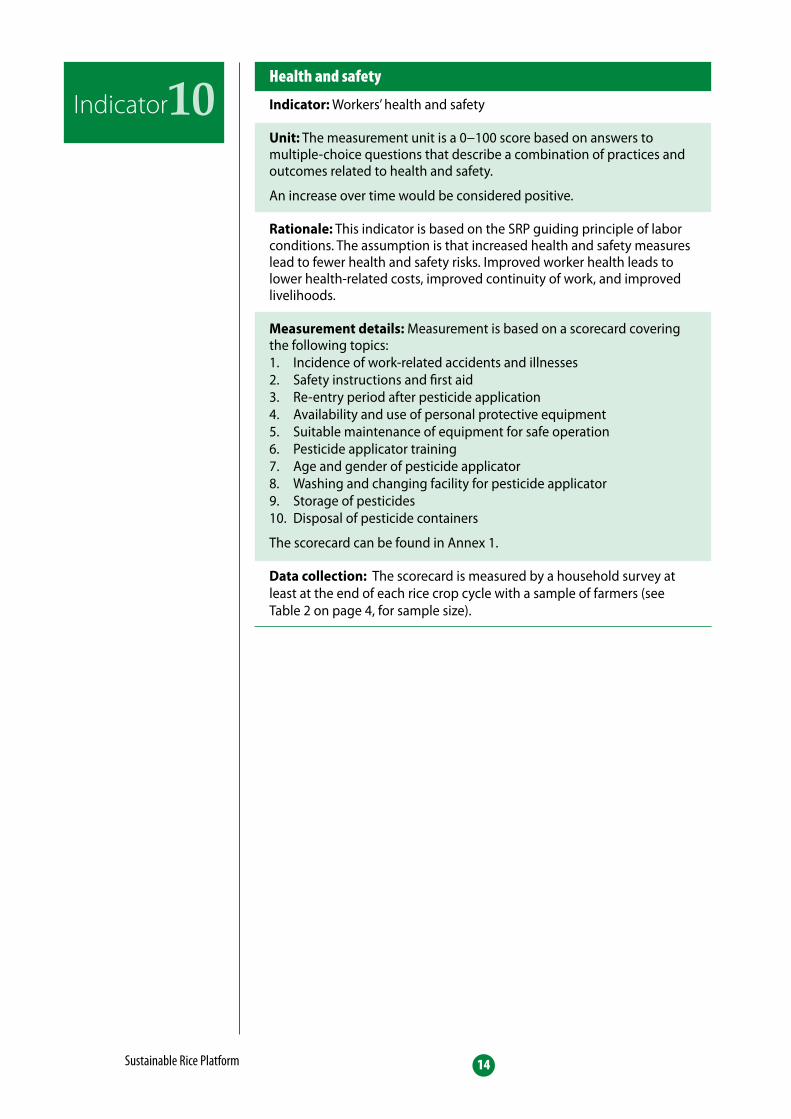
Indicator: Workers’ health and safety
Unit: The measurement unit is a 0−100 score based on answers to multiple-choice questions that describe a combination of practices and outcomes related to health and safety.
An increase over time would be considered positive.
Rationale: This indicator is based on the SRP guiding principle of labor conditions. The assumption is that increased health and safety measures lead to fewer health and safety risks. Improved worker health leads to lower health-related costs, improved continuity of work, and improved livelihoods.
Measurement details: Measurement is based on a scorecard covering the following topics:1. Incidence of work-related accidents and illnesses2. Safety instructions and first aid3. Re-entry period after pesticide application4. Availability and use of personal protective equipment 5. Suitable maintenance of equipment for safe operation6. Pesticide applicator training7. Age and gender of pesticide applicator8. Washing and changing facility for pesticide applicator9. Storage of pesticides10. Disposal of pesticide containers
The scorecard can be found in Annex 1.
Data collection: The scorecard is measured by a household survey at least at the end of each rice crop cycle with a sample of farmers (see Table 2 on page 4, for sample size).
Health and safety
Indicator10
Sustainable Rice Platform 15
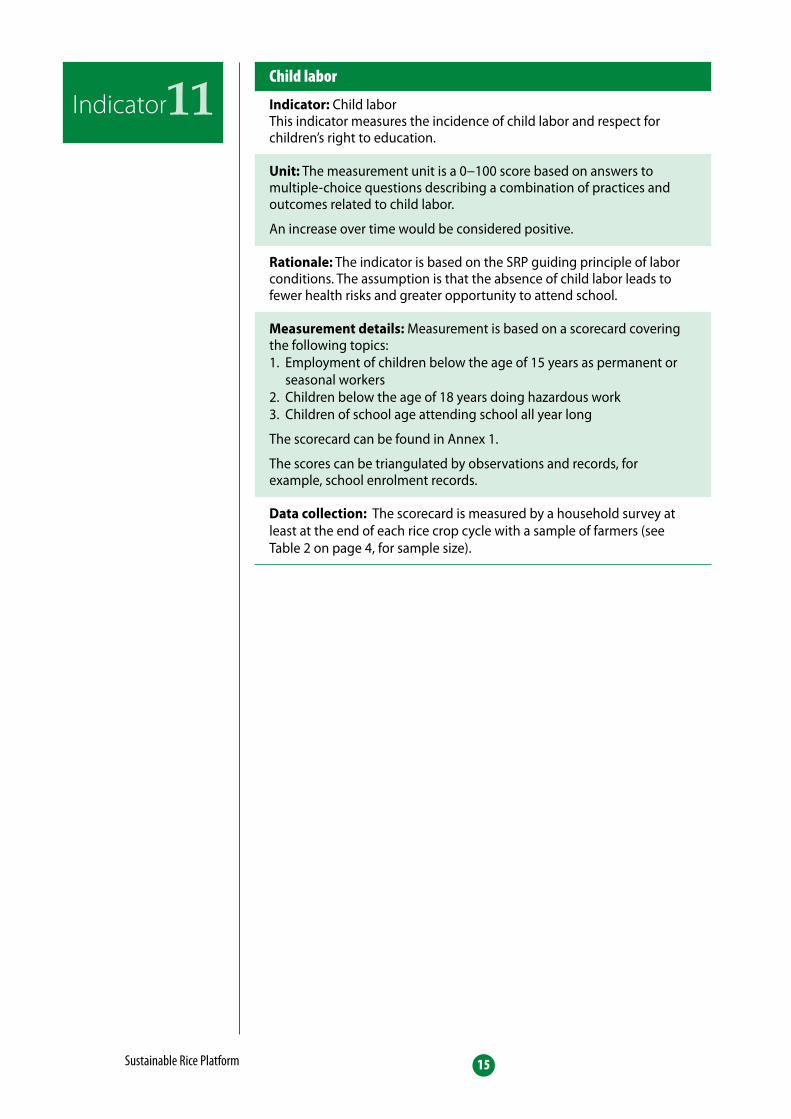
Indicator: Child laborThis indicator measures the incidence of child labor and respect for children’s right to education.
Unit: The measurement unit is a 0−100 score based on answers to multiple-choice questions describing a combination of practices and outcomes related to child labor.
An increase over time would be considered positive.
Rationale: The indicator is based on the SRP guiding principle of labor conditions. The assumption is that the absence of child labor leads to fewer health risks and greater opportunity to attend school.
Measurement details: Measurement is based on a scorecard covering the following topics:1. Employment of children below the age of 15 years as permanent or
seasonal workers2. Children below the age of 18 years doing hazardous work3. Children of school age attending school all year long
The scorecard can be found in Annex 1.
The scores can be triangulated by observations and records, for example, school enrolment records.
Data collection: The scorecard is measured by a household survey at least at the end of each rice crop cycle with a sample of farmers (see Table 2 on page 4, for sample size).
Child labor
Indicator11
Sustainable Rice Platform 16
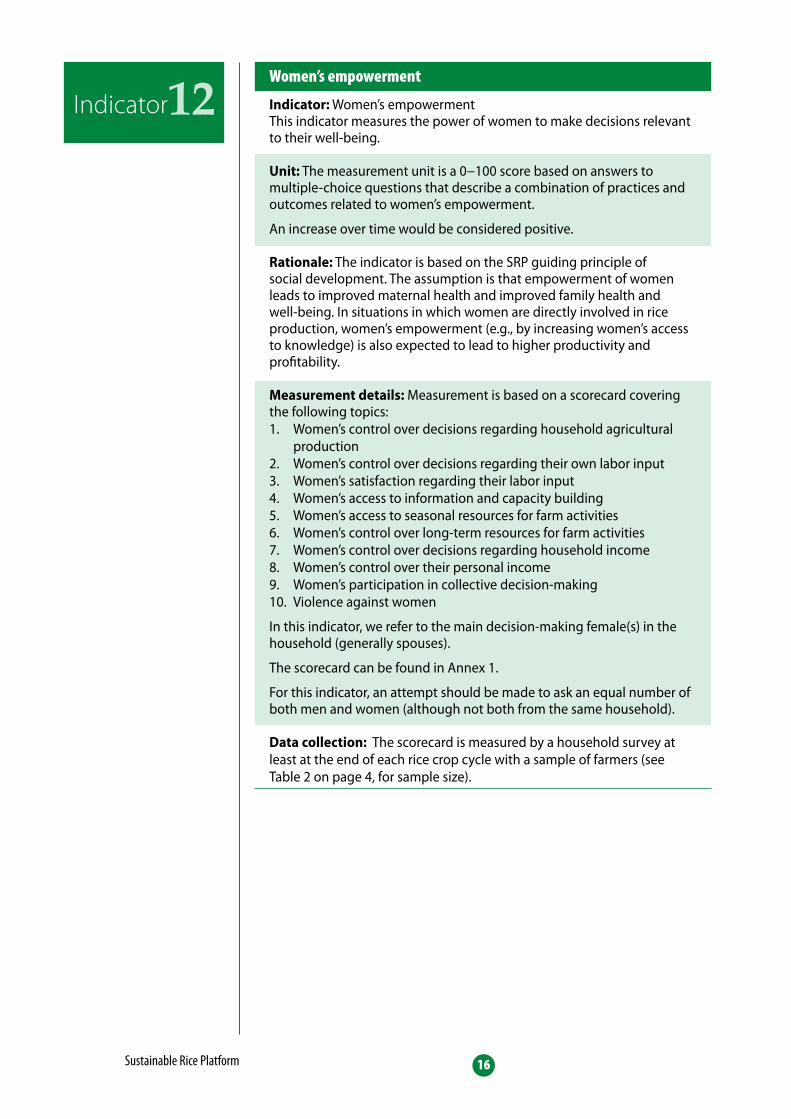
Indicator: Women’s empowermentThis indicator measures the power of women to make decisions relevant to their well-being.
Unit: The measurement unit is a 0−100 score based on answers to multiple-choice questions that describe a combination of practices and outcomes related to women’s empowerment.
An increase over time would be considered positive.
Rationale: The indicator is based on the SRP guiding principle of social development. The assumption is that empowerment of women leads to improved maternal health and improved family health and well-being. In situations in which women are directly involved in rice production, women’s empowerment (e.g., by increasing women’s access to knowledge) is also expected to lead to higher productivity and profitability.
Measurement details: Measurement is based on a scorecard covering the following topics:1. Women’s control over decisions regarding household agricultural
production2. Women’s control over decisions regarding their own labor input3. Women’s satisfaction regarding their labor input4. Women’s access to information and capacity building5. Women’s access to seasonal resources for farm activities 6. Women’s control over long-term resources for farm activities 7. Women’s control over decisions regarding household income8. Women’s control over their personal income9. Women’s participation in collective decision-making10. Violence against women
In this indicator, we refer to the main decision-making female(s) in the household (generally spouses).
The scorecard can be found in Annex 1.
For this indicator, an attempt should be made to ask an equal number of both men and women (although not both from the same household).
Data collection: The scorecard is measured by a household survey at least at the end of each rice crop cycle with a sample of farmers (see Table 2 on page 4, for sample size).
Women’s empowerment
Indicator12
Sustainable Rice Platform 17
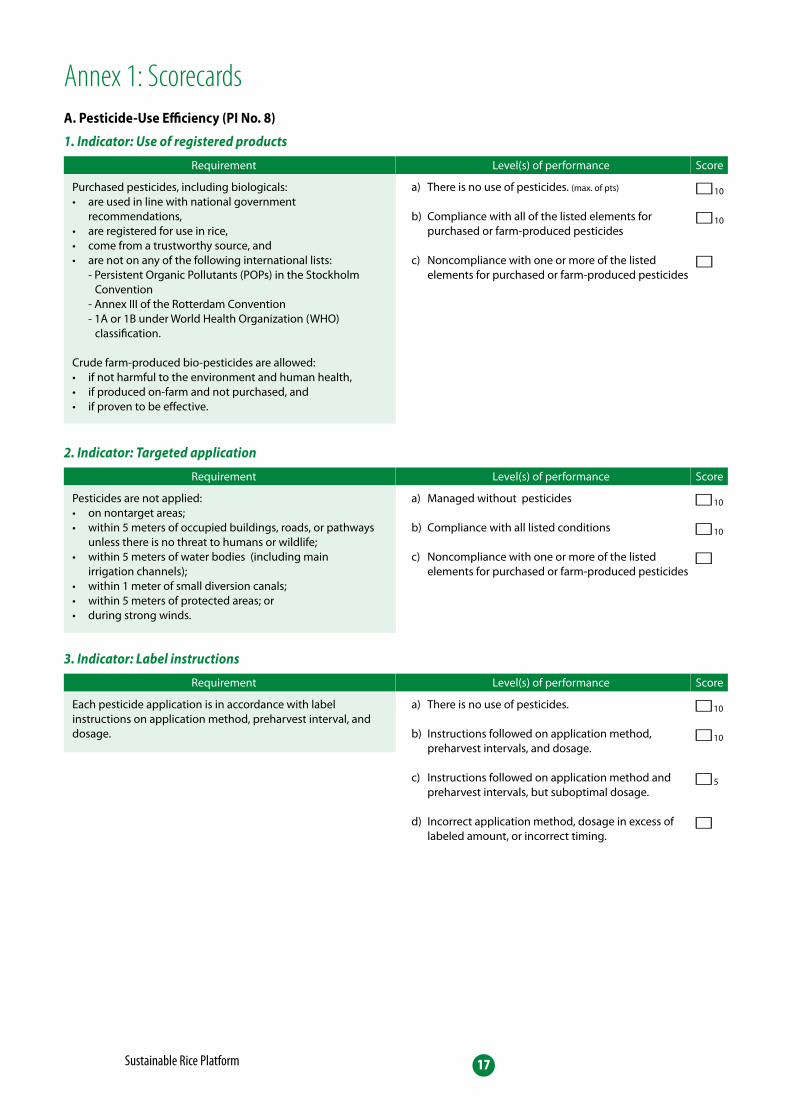
Annex 1: ScorecardsA. Pesticide-Use Efficiency (PI No. 8)
1. Indicator: Use of registered products
2. Indicator: Targeted application
3. Indicator: Label instructions
Purchased pesticides, including biologicals:• are used in line with national government
recommendations,• are registered for use in rice,• come from a trustworthy source, and• are not on any of the following international lists: - Persistent Organic Pollutants (POPs) in the Stockholm
Convention - Annex III of the Rotterdam Convention - 1A or 1B under World Health Organization (WHO)
classification.
Crude farm-produced bio-pesticides are allowed:• if not harmful to the environment and human health,• if produced on-farm and not purchased, and • if proven to be effective.
Pesticides are not applied:• on nontarget areas;• within 5 meters of occupied buildings, roads, or pathways
unless there is no threat to humans or wildlife;• within 5 meters of water bodies (including main
irrigation channels);• within 1 meter of small diversion canals;• within 5 meters of protected areas; or• during strong winds.
Each pesticide application is in accordance with label instructions on application method, preharvest interval, and dosage.
a) There is no use of pesticides. (max. of pts)
b) Compliance with all of the listed elements for purchased or farm-produced pesticides
c) Noncompliance with one or more of the listed elements for purchased or farm-produced pesticides
a) Managed without pesticides
b) Compliance with all listed conditions
c) Noncompliance with one or more of the listed elements for purchased or farm-produced pesticides
a) There is no use of pesticides.
b) Instructions followed on application method, preharvest intervals, and dosage.
c) Instructions followed on application method and preharvest intervals, but suboptimal dosage.
d) Incorrect application method, dosage in excess of labeled amount, or incorrect timing.
Score
Score
Score
Requirement
Requirement
Requirement
Level(s) of performance
Level(s) of performance
Level(s) of performance
£10
£10
£
£10
£10
£
£10
£10
£5
£
Sustainable Rice Platform 18
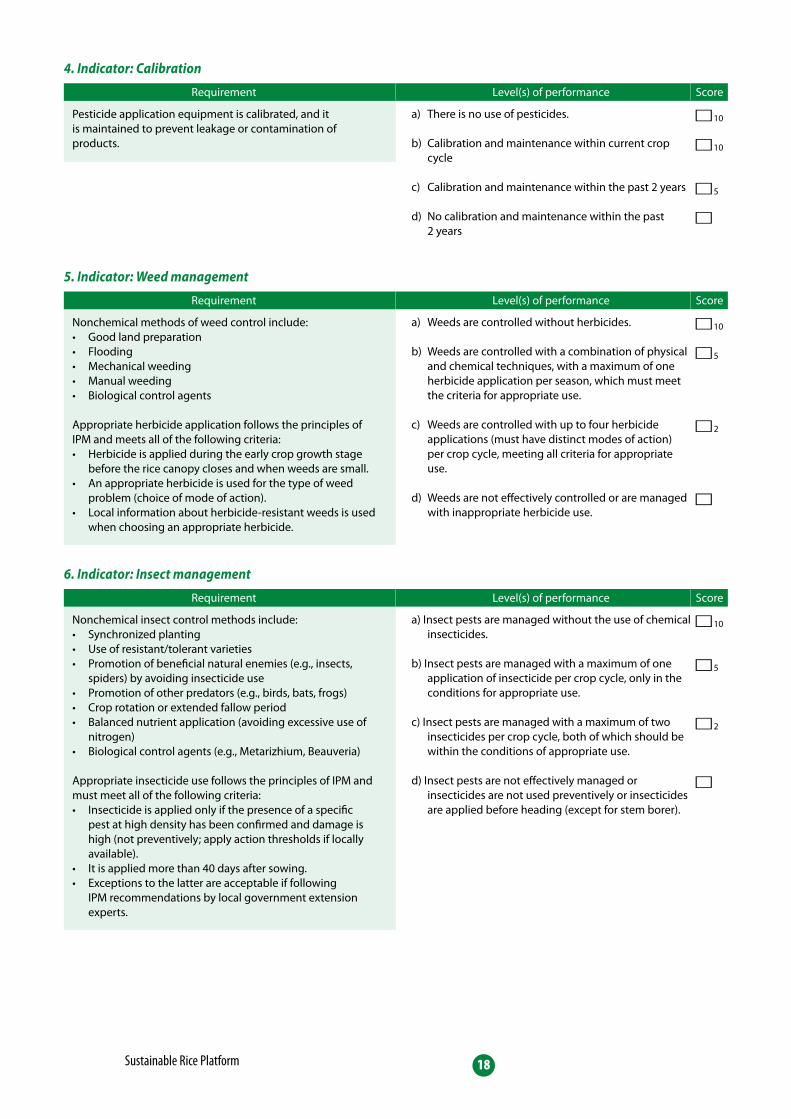
4. Indicator: Calibration
5. Indicator: Weed management
6. Indicator: Insect management
Pesticide application equipment is calibrated, and it is maintained to prevent leakage or contamination of products.
Nonchemical methods of weed control include:• Good land preparation• Flooding• Mechanical weeding• Manual weeding• Biological control agents
Appropriate herbicide application follows the principles of IPM and meets all of the following criteria: • Herbicide is applied during the early crop growth stage
before the rice canopy closes and when weeds are small.• An appropriate herbicide is used for the type of weed
problem (choice of mode of action).• Local information about herbicide-resistant weeds is used
when choosing an appropriate herbicide.
Nonchemical insect control methods include: • Synchronized planting• Use of resistant/tolerant varieties• Promotion of beneficial natural enemies (e.g., insects,
spiders) by avoiding insecticide use• Promotion of other predators (e.g., birds, bats, frogs)• Crop rotation or extended fallow period• Balanced nutrient application (avoiding excessive use of
nitrogen)• Biological control agents (e.g., Metarizhium, Beauveria)
Appropriate insecticide use follows the principles of IPM andmust meet all of the following criteria: • Insecticide is applied only if the presence of a specific
pest at high density has been confirmed and damage is high (not preventively; apply action thresholds if locally available).
• It is applied more than 40 days after sowing.• Exceptions to the latter are acceptable if following
IPM recommendations by local government extension experts.
a) There is no use of pesticides.
b) Calibration and maintenance within current crop cycle
c) Calibration and maintenance within the past 2 years
d) No calibration and maintenance within the past 2 years
a) Weeds are controlled without herbicides.
b) Weeds are controlled with a combination of physical and chemical techniques, with a maximum of one herbicide application per season, which must meet the criteria for appropriate use.
c) Weeds are controlled with up to four herbicide applications (must have distinct modes of action) per crop cycle, meeting all criteria for appropriate use.
d) Weeds are not effectively controlled or are managed with inappropriate herbicide use.
a) Insect pests are managed without the use of chemical insecticides.
b) Insect pests are managed with a maximum of one application of insecticide per crop cycle, only in the conditions for appropriate use.
c) Insect pests are managed with a maximum of two insecticides per crop cycle, both of which should be within the conditions of appropriate use.
d) Insect pests are not effectively managed or insecticides are not used preventively or insecticides are applied before heading (except for stem borer).
Score
Score
Score
Requirement
Requirement
Requirement
Level(s) of performance
Level(s) of performance
Level(s) of performance
£10
£10
£5
£
£10
£5
£2
£
£10
£5
£2
£
Sustainable Rice Platform 19
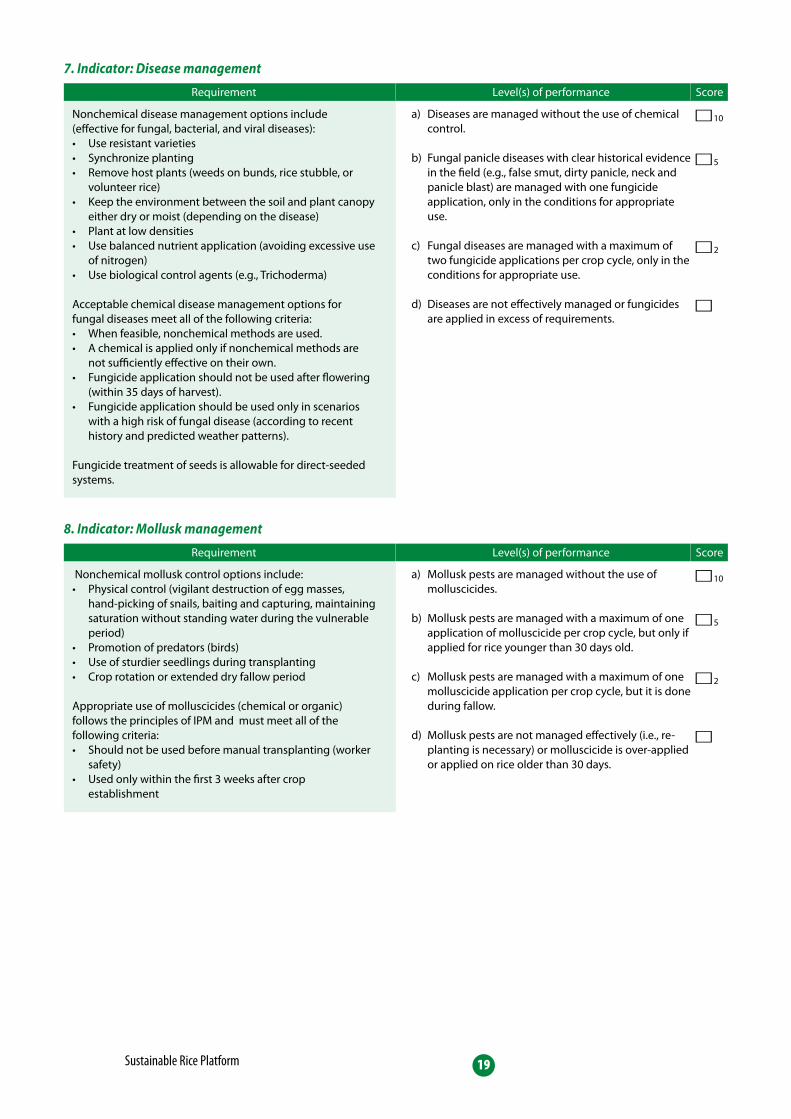
7. Indicator: Disease management
8. Indicator: Mollusk management
Nonchemical disease management options include (effective for fungal, bacterial, and viral diseases): • Use resistant varieties• Synchronize planting• Remove host plants (weeds on bunds, rice stubble, or
volunteer rice)• Keep the environment between the soil and plant canopy
either dry or moist (depending on the disease) • Plant at low densities• Use balanced nutrient application (avoiding excessive use
of nitrogen)• Use biological control agents (e.g., Trichoderma)
Acceptable chemical disease management options for fungal diseases meet all of the following criteria:• When feasible, nonchemical methods are used.• A chemical is applied only if nonchemical methods are
not sufficiently effective on their own.• Fungicide application should not be used after flowering
(within 35 days of harvest).• Fungicide application should be used only in scenarios
with a high risk of fungal disease (according to recent history and predicted weather patterns).
Fungicide treatment of seeds is allowable for direct-seeded systems.
Nonchemical mollusk control options include: • Physical control (vigilant destruction of egg masses,
hand-picking of snails, baiting and capturing, maintaining saturation without standing water during the vulnerable period)
• Promotion of predators (birds)• Use of sturdier seedlings during transplanting• Crop rotation or extended dry fallow period
Appropriate use of molluscicides (chemical or organic) follows the principles of IPM and must meet all of the following criteria: • Should not be used before manual transplanting (worker
safety)• Used only within the first 3 weeks after crop
establishment
a) Diseases are managed without the use of chemical control.
b) Fungal panicle diseases with clear historical evidence
in the field (e.g., false smut, dirty panicle, neck and panicle blast) are managed with one fungicide application, only in the conditions for appropriate use.
c) Fungal diseases are managed with a maximum of two fungicide applications per crop cycle, only in the conditions for appropriate use.
d) Diseases are not effectively managed or fungicides are applied in excess of requirements.
a) Mollusk pests are managed without the use of molluscicides.
b) Mollusk pests are managed with a maximum of one application of molluscicide per crop cycle, but only if applied for rice younger than 30 days old.
c) Mollusk pests are managed with a maximum of one molluscicide application per crop cycle, but it is done during fallow.
d) Mollusk pests are not managed effectively (i.e., re-planting is necessary) or molluscicide is over-applied or applied on rice older than 30 days.
Score
Score
Requirement
Requirement
Level(s) of performance
Level(s) of performance
£10
£5
£2
£
£10
£5
£2
£

Sustainable Rice Platform 20
9. Indicator: Rodent management
10. Indicator: Bird management
Nonchemical rodent control options include:• Synchronized planting• Community rodent management, for example, rat
eradication campaigns, trap crops• Using a trap crop• Trapping• Hunting• Use of narrow bunds (minimize rodent habitat)• Promotion of predators (birds of prey, snakes)
Appropriate rodenticide use must meet all of the following criteria:• Appropriate timing is to manage rodents during the
vegetative growth phase of the crop so that they don’t produce an outbreak during grain filling.
• Rodenticides should be used only in response to current or historical evidence of rodent problems.
• Rodenticides should be placed under protective cover (e.g., bamboo tubes or coconut husks) where they are not easily accessible to birds or exposed to rainfall.
Nonlethal bird control options include:• Synchronized planting• Scare/deterrent devices• Promotion of predators (e.g., birds of prey, shrikes)
a) Rodent pests are managed without the use of rodenticides.
b) Rodent pests are managed with maximum 1 application of rodenticide per crop cycle, but only if used before heading.
c) Rodent pests are managed with more than one application of rodenticide per crop cycle, but only if used before heading.
d) Rodents are not managed effectively or rodenticide is used too late to provide effective protection.
a) Bird pests are managed without the use of lethal control.
b) Bird pests are managed by live trapping and all nonpest species are released alive.
c) Birds are indiscriminately persecuted by killing, poisoning, or hunting.
Score
Score
Score (0–100)
Requirement
Requirement
Level(s) of performance
Level(s) of performance
£10
£5
£2
£
£10
£5
£
Sustainable Rice Platform 21
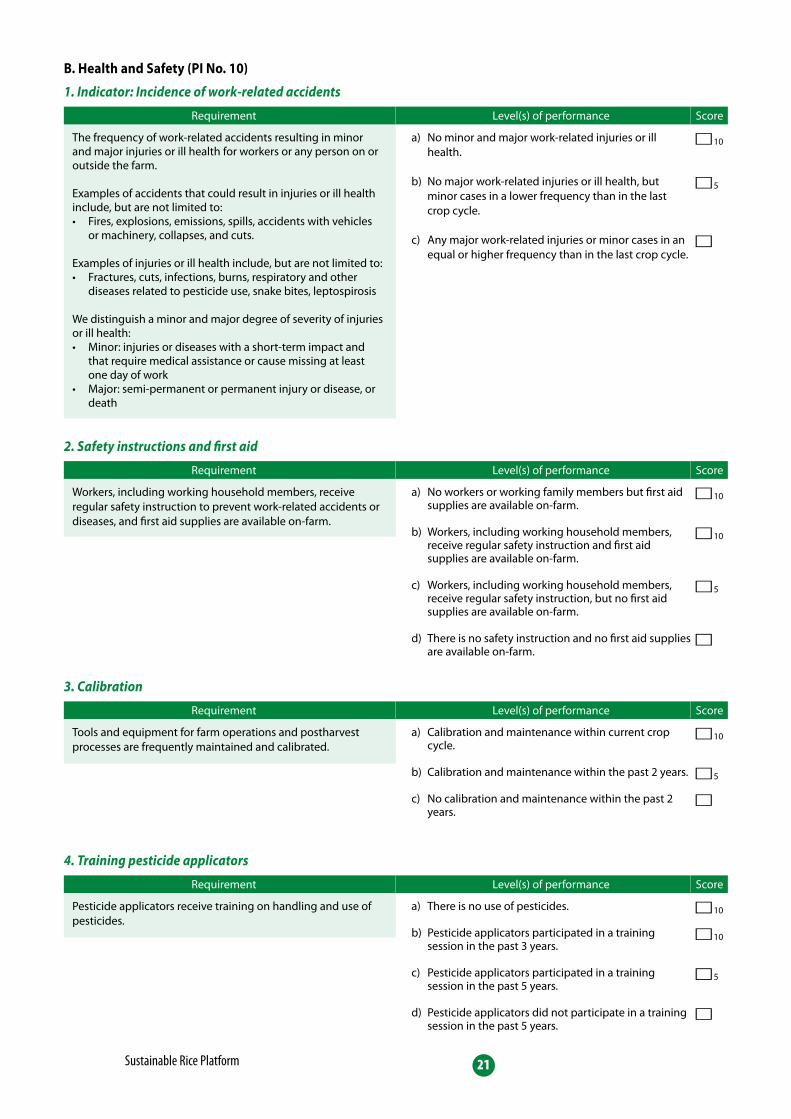
B. Health and Safety (PI No. 10)
1. Indicator: Incidence of work-related accidents
2. Safety instructions and first aid
3. Calibration
4. Training pesticide applicators
The frequency of work-related accidents resulting in minor and major injuries or ill health for workers or any person on or outside the farm.
Examples of accidents that could result in injuries or ill health include, but are not limited to:• Fires, explosions, emissions, spills, accidents with vehicles
or machinery, collapses, and cuts.
Examples of injuries or ill health include, but are not limited to:• Fractures, cuts, infections, burns, respiratory and other
diseases related to pesticide use, snake bites, leptospirosis
We distinguish a minor and major degree of severity of injuries or ill health:• Minor: injuries or diseases with a short-term impact and
that require medical assistance or cause missing at least one day of work
• Major: semi-permanent or permanent injury or disease, or death
Workers, including working household members, receive regular safety instruction to prevent work-related accidents or diseases, and first aid supplies are available on-farm.
Tools and equipment for farm operations and postharvest processes are frequently maintained and calibrated.
Pesticide applicators receive training on handling and use of pesticides.
a) No minor and major work-related injuries or ill health.
b) No major work-related injuries or ill health, but minor cases in a lower frequency than in the last crop cycle.
c) Any major work-related injuries or minor cases in an equal or higher frequency than in the last crop cycle.
a) No workers or working family members but first aid supplies are available on-farm.
b) Workers, including working household members, receive regular safety instruction and first aid supplies are available on-farm.
c) Workers, including working household members, receive regular safety instruction, but no first aid supplies are available on-farm.
d) There is no safety instruction and no first aid supplies are available on-farm.
a) Calibration and maintenance within current crop cycle.
b) Calibration and maintenance within the past 2 years.
c) No calibration and maintenance within the past 2 years.
a) There is no use of pesticides.
b) Pesticide applicators participated in a training session in the past 3 years.
c) Pesticide applicators participated in a training session in the past 5 years.
d) Pesticide applicators did not participate in a training session in the past 5 years.
Score
Score
Score
Score
Requirement
Requirement
Requirement
Requirement
Level(s) of performance
Level(s) of performance
Level(s) of performance
Level(s) of performance
£10
£5
£
£10
£10
£5
£
£10
£5
£
£10
£10
£5
£
Sustainable Rice Platform 22
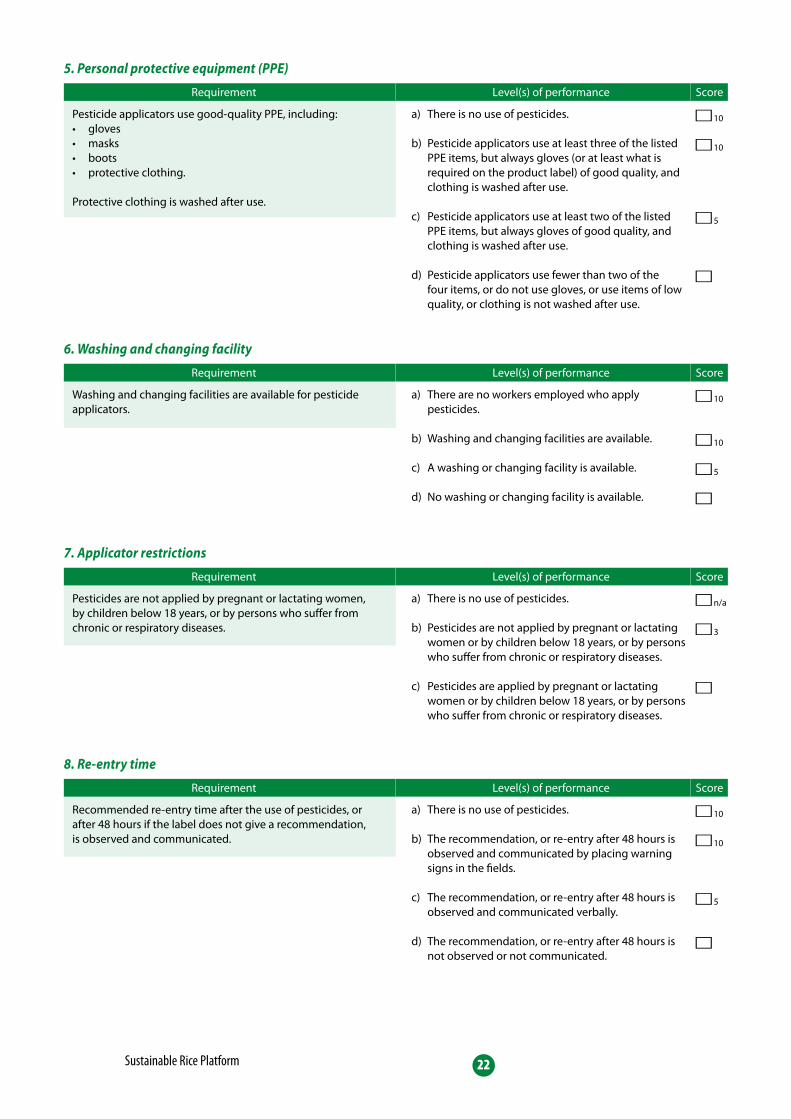
5. Personal protective equipment (PPE)
6. Washing and changing facility
7. Applicator restrictions
8. Re-entry time
Pesticide applicators use good-quality PPE, including:• gloves• masks• boots• protective clothing.
Protective clothing is washed after use.
Washing and changing facilities are available for pesticide applicators.
Pesticides are not applied by pregnant or lactating women, by children below 18 years, or by persons who suffer from chronic or respiratory diseases.
Recommended re-entry time after the use of pesticides, or after 48 hours if the label does not give a recommendation, is observed and communicated.
a) There is no use of pesticides.
b) Pesticide applicators use at least three of the listed PPE items, but always gloves (or at least what is required on the product label) of good quality, and clothing is washed after use.
c) Pesticide applicators use at least two of the listed PPE items, but always gloves of good quality, and clothing is washed after use.
d) Pesticide applicators use fewer than two of the four items, or do not use gloves, or use items of low quality, or clothing is not washed after use.
a) There are no workers employed who apply pesticides.
b) Washing and changing facilities are available.
c) A washing or changing facility is available.
d) No washing or changing facility is available.
a) There is no use of pesticides.
b) Pesticides are not applied by pregnant or lactating women or by children below 18 years, or by persons who suffer from chronic or respiratory diseases.
c) Pesticides are applied by pregnant or lactating women or by children below 18 years, or by persons who suffer from chronic or respiratory diseases.
a) There is no use of pesticides.
b) The recommendation, or re-entry after 48 hours is observed and communicated by placing warning signs in the fields.
c) The recommendation, or re-entry after 48 hours is observed and communicated verbally.
d) The recommendation, or re-entry after 48 hours is not observed or not communicated.
Score
Score
Score
Score
Requirement
Requirement
Requirement
Requirement
Level(s) of performance
Level(s) of performance
Level(s) of performance
Level(s) of performance
£10
£10
£5
£
£10
£10
£5
£
£n/a
£3
£
£10
£10
£5
£

Sustainable Rice Platform 23
£10
£10
£5
£
£10
£10
£10
£
9. Pesticide storage
10. Pesticide disposal
Pesticides and inorganic fertilizers (including empty containers) are labeled and stored in a locked place, separate from fuel and food and out of the reach of children.
Empty pesticide containers and obsolete pesticides are properly disposed of.
a) There is no use of pesticides or inorganic fertilizers.
b) Pesticides and inorganic fertilizers are labeled and stored in a locked and separate place.
c) Pesticides and inorganic fertilizers are labeled and stored in a general farm storage area.
d) Pesticides and inorganic fertilizers are not labeled or stored.
a) There is no use of pesticides.
b) Farmer participates in a collection, return, or disposal system.
c) In the absence of such a system: • Empty containers are rinsed three times with
water and made unusable by crushing or puncturing before burying them on the farm and are not recycled.
• Surplus spray and wash water is applied over an unmanaged part of the farm, away from water bodies.
• Obsolete pesticides (past shelf life or banned) are returned to dealers or, if not possible, disposed of in a manner that minimizes exposure to humans and the environment.
d) There is a collection, return, or disposal system, but it is not used. In the absence of such a system, empty pesticide containers and obsolete pesticides are not disposed of as described under (c).
Score
Score
Requirement
Requirement
Level(s) of performance
Level(s) of performance
Score (0–100)
Sustainable Rice Platform 24
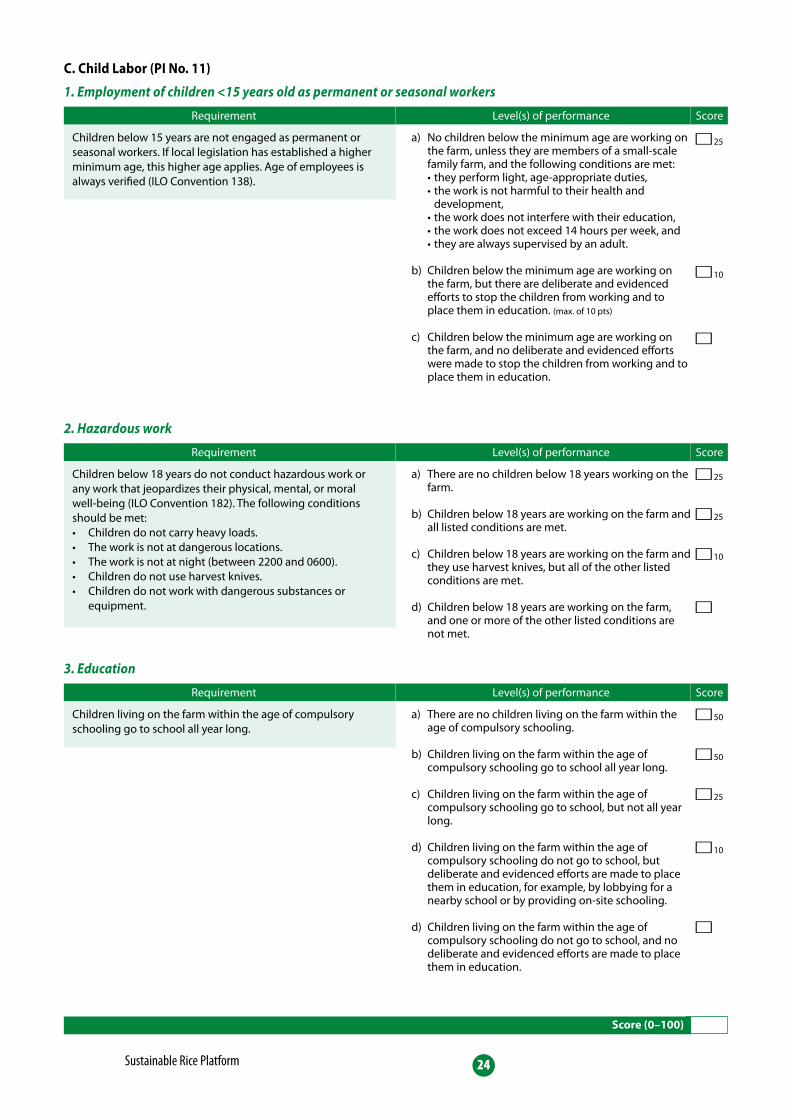
C. Child Labor (PI No. 11)
1. Employment of children <15 years old as permanent or seasonal workers
2. Hazardous work
3. Education
Children below 15 years are not engaged as permanent or seasonal workers. If local legislation has established a higher minimum age, this higher age applies. Age of employees is always verified (ILO Convention 138).
Children below 18 years do not conduct hazardous work or any work that jeopardizes their physical, mental, or moral well-being (ILO Convention 182). The following conditions should be met:• Children do not carry heavy loads.• The work is not at dangerous locations.• The work is not at night (between 2200 and 0600).• Children do not use harvest knives.• Children do not work with dangerous substances or
equipment.
Children living on the farm within the age of compulsory schooling go to school all year long.
a) No children below the minimum age are working on the farm, unless they are members of a small-scale family farm, and the following conditions are met:
• they perform light, age-appropriate duties, • the work is not harmful to their health and
development, • the work does not interfere with their education, • the work does not exceed 14 hours per week, and • they are always supervised by an adult.
b) Children below the minimum age are working on the farm, but there are deliberate and evidenced efforts to stop the children from working and to place them in education. (max. of 10 pts)
c) Children below the minimum age are working on the farm, and no deliberate and evidenced efforts were made to stop the children from working and to place them in education.
a) There are no children below 18 years working on the farm.
b) Children below 18 years are working on the farm and all listed conditions are met.
c) Children below 18 years are working on the farm and they use harvest knives, but all of the other listed conditions are met.
d) Children below 18 years are working on the farm, and one or more of the other listed conditions are not met.
a) There are no children living on the farm within the age of compulsory schooling.
b) Children living on the farm within the age of compulsory schooling go to school all year long.
c) Children living on the farm within the age of compulsory schooling go to school, but not all year long.
d) Children living on the farm within the age of compulsory schooling do not go to school, but deliberate and evidenced efforts are made to place them in education, for example, by lobbying for a nearby school or by providing on-site schooling.
d) Children living on the farm within the age of compulsory schooling do not go to school, and no deliberate and evidenced efforts are made to place them in education.
Score
Score
Score
Requirement
Requirement
Requirement
Level(s) of performance
Level(s) of performance
Level(s) of performance
£25
£10
£
£25
£25
£10
£
£50
£50
£25
£10
£
Score (0–100)
Sustainable Rice Platform 25
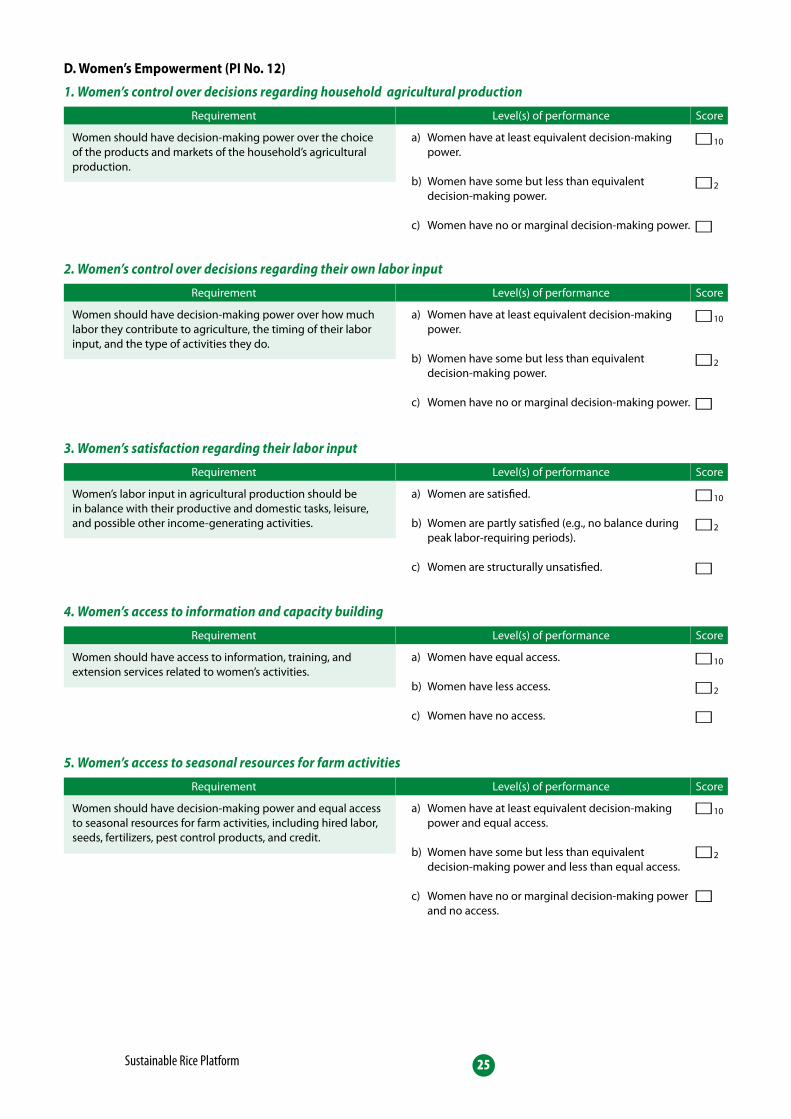
D. Women’s Empowerment (PI No. 12)
1. Women’s control over decisions regarding household agricultural production
2. Women’s control over decisions regarding their own labor input
3. Women’s satisfaction regarding their labor input
4. Women’s access to information and capacity building
5. Women’s access to seasonal resources for farm activities
Women should have decision-making power over the choice of the products and markets of the household’s agricultural production.
Women should have decision-making power over how much labor they contribute to agriculture, the timing of their labor input, and the type of activities they do.
Women’s labor input in agricultural production should be in balance with their productive and domestic tasks, leisure, and possible other income-generating activities.
Women should have access to information, training, and extension services related to women’s activities.
Women should have decision-making power and equal access to seasonal resources for farm activities, including hired labor, seeds, fertilizers, pest control products, and credit.
a) Women have at least equivalent decision-making power.
b) Women have some but less than equivalent decision-making power.
c) Women have no or marginal decision-making power.
a) Women have at least equivalent decision-making power.
b) Women have some but less than equivalent decision-making power.
c) Women have no or marginal decision-making power.
a) Women are satisfied.
b) Women are partly satisfied (e.g., no balance during peak labor-requiring periods).
c) Women are structurally unsatisfied.
a) Women have equal access.
b) Women have less access.
c) Women have no access.
a) Women have at least equivalent decision-making power and equal access.
b) Women have some but less than equivalent decision-making power and less than equal access.
c) Women have no or marginal decision-making power and no access.
Score
Score
Score
Score
Score
Requirement
Requirement
Requirement
Requirement
Requirement
Level(s) of performance
Level(s) of performance
Level(s) of performance
Level(s) of performance
Level(s) of performance
£10
£2
£
£10
£2
£
£10
£2
£
£10
£2
£
£10
£2
£
Sustainable Rice Platform 26
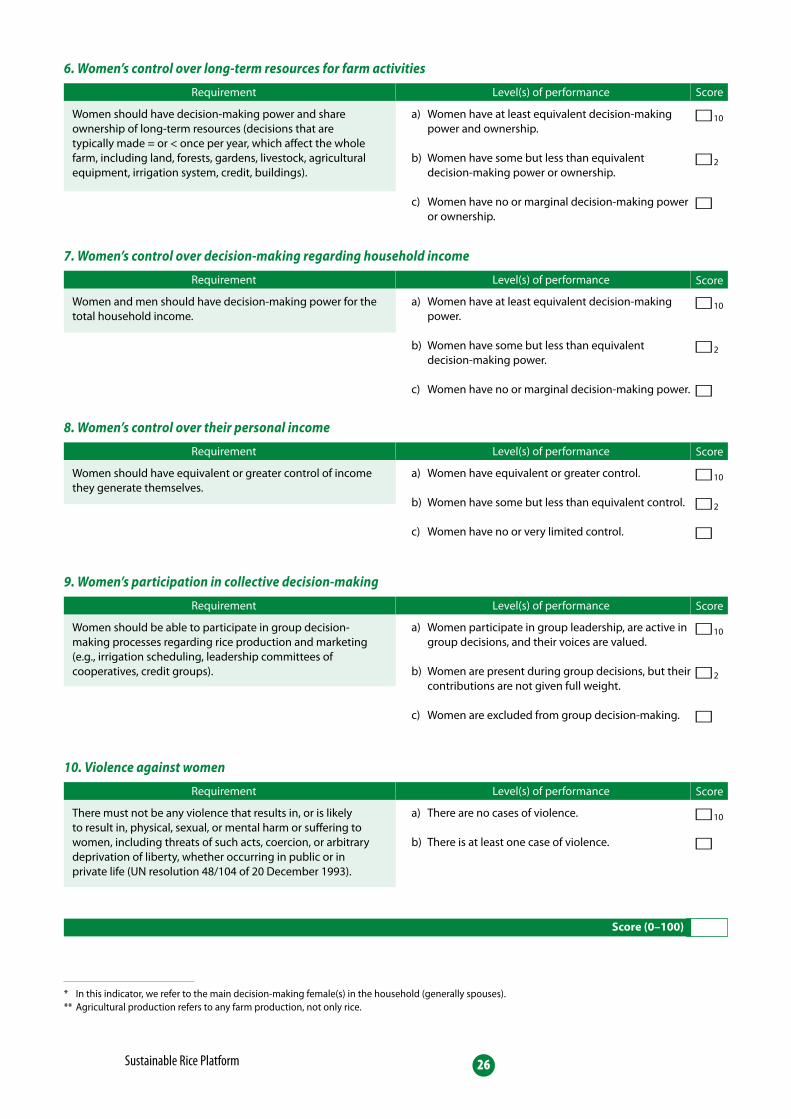
6. Women’s control over long-term resources for farm activities
7. Women’s control over decision-making regarding household income
8. Women’s control over their personal income
9. Women’s participation in collective decision-making
10. Violence against women
Women should have decision-making power and share ownership of long-term resources (decisions that are typically made = or < once per year, which affect the whole farm, including land, forests, gardens, livestock, agricultural equipment, irrigation system, credit, buildings).
Women and men should have decision-making power for the total household income.
Women should have equivalent or greater control of income they generate themselves.
Women should be able to participate in group decision-making processes regarding rice production and marketing (e.g., irrigation scheduling, leadership committees of cooperatives, credit groups).
There must not be any violence that results in, or is likely to result in, physical, sexual, or mental harm or suffering to women, including threats of such acts, coercion, or arbitrary deprivation of liberty, whether occurring in public or in private life (UN resolution 48/104 of 20 December 1993).
a) Women have at least equivalent decision-making power and ownership.
b) Women have some but less than equivalent decision-making power or ownership.
c) Women have no or marginal decision-making power or ownership.
a) Women have at least equivalent decision-making power.
b) Women have some but less than equivalent decision-making power.
c) Women have no or marginal decision-making power.
a) Women have equivalent or greater control.
b) Women have some but less than equivalent control.
c) Women have no or very limited control.
a) Women participate in group leadership, are active in group decisions, and their voices are valued.
b) Women are present during group decisions, but their contributions are not given full weight.
c) Women are excluded from group decision-making.
a) There are no cases of violence.
b) There is at least one case of violence.
Score
Score
Score
Score
Score
Requirement
Requirement
Requirement
Requirement
Requirement
Level(s) of performance
Level(s) of performance
Level(s) of performance
Level(s) of performance
Level(s) of performance
£10
£2
£
£10
£2
£
£10
£2
£
£10
£2
£
£10
£
Score (0–100)
* In this indicator, we refer to the main decision-making female(s) in the household (generally spouses).** Agricultural production refers to any farm production, not only rice.

Sustainable Rice Platform 27
Notes:

Sustainable Rice Platform 28