performance-based optimum design of structures with...
TRANSCRIPT

Int. J. Reliability and Safety, Vol. 7, No. 1, 2013 75
Copyright © 2013 Inderscience Enterprises Ltd.
Performance-based optimum design of structures with vulnerability objectives
Vissarion Papadopoulos* and Nikos D. Lagaros Institute of Structural Analysis & Seismic Research, National Technical University of Athens, 9, Iroon Polytechniou Str., Zografou Campus, 157 80 Athens, Greece Email: [email protected] Email: [email protected] *Corresponding author
Abstract: A methodology is proposed for the Performance-Based optimum seismic Design (PBD) of structures implementing vulnerability objectives. Vulnerability objectives are introduced through target limit-state probabilities of exceedance. This is achieved by performing additional probabilistic design checks. The PBD framework implementing vulnerability objectives allows designers to explicitly determine acceptable probabilities of exceedance of selected performance indices that must be satisfied simultaneously for all limit-states. The proposed methodology is formulated as a structural optimisation problem. The numerical results demonstrate that PBD framework implementing vulnerability objectives can be easily integrated into a design procedure and is generally applicable.
Keywords: vulnerability performance objectives; performance-based design; vulnerability analysis; life cycle cost analysis; structural optimisation; reliability and safety.
Reference to this paper should be made as follows: Papadopoulos, V. and Lagaros, N.D. (2013) ‘Performance-based optimum design of structures with vulnerability objectives’, Int. J. Reliability and Safety, Vol. 7, No. 1, pp.75–94.
Biographical notes: Vissarion Papadopoulos in 2006 joined the School of Civil Engineering of NTUA and the Institute of Structural Analysis and Antiseismic Research, where he is currently an Assistant Professor and teaches five courses, including structural analysis and design using SFEM (post-graduate course). He received his Civil Engineering degree and PhD from the National Technical University of Athens (NTUA). His research activity is devoted to Computational Mechanics with emphasis on system uncertainties described by random fields. His published research work contains 25 peer-reviewed journal papers, two contributed books, two international conference proceedings, two chapters in international books and 40 papers in international conferences.
Nikos D. Lagaros is a Lecturer in the Institute of Structural Analysis and Seismic Research of the School of Civil Engineering, National Technical University of Athens. He is also a Lecturer at the School of Corps of Engineers of the Hellenic Army (SCEHA) since 2007. The results of his research activity encompass a wide range of topics with an interdisciplinary character in the field of computational mechanics. His published research work contains:

76 V. Papadopoulos and N.D. Lagaros
60 peer-reviewed journal papers, one book, six contributed books, two international conference proceedings, 15 chapters in international books, 125 papers in international conferences.
1 Introduction
Performance Based Design (PBD) is the modern conceptual approach of seismic structural design which defines target performance objectives that a structure should meet for a number of different hazard levels ranging from earthquakes with a small intensity to more destructive events. PBD procedures have the following distinctive features with respect to traditional prescriptive design requirements: (a) allow the structural engineer to define the appropriate performance of the structure, based on the level of seismic hazard and the corresponding seismic demand and (b) the structure is designed to meet the requirements corresponding to a number of seismic intensity levels (Kunnath et al., 2004; Krawinkler et al., 2006). On the other hand, vulnerability analysis is usually performed in order to assess the integrity of existing structures or the designs of new structures obtained by PBD (or the prescriptive) design framework, through estimation of the probabilities that various performance levels will be reached or exceeded given the occurrence of a seismic event corresponding to a specific intensity level. Vulnerability analysis represents an important stage in risk assessment, loss estimation and decision making procedures where it is desirable to achieve a long-term objective in reduction of cost, loss and consequences (Wen and Ellingwood, 2005, Moschonas et al., 2009).
In the context of PBD, various design methodologies have been proposed in the framework of structural optimisation with deterministic as well as probabilistic formulations. Deterministic formulations (i.e. Zou and Chan, 2005a and Zou and Chan, 2005b) are in most cases not capable to reach unbiased, feasible and realistic optimum structural designs due to the fact that they ignore uncertainties involved in parameters affecting the structural behaviour. More elaborate probabilistic optimum design formulations are implemented usually distinguished in two categories: Reliability-Based Optimisation (RBO), which aims to design for safety with respect to extreme events by determining design points that are located within a range of target failure probabilities (Pu et al., 1997; Beck et al., 1999; Jiang et al., 2000; Royset et al., 2001; Frangopol and Maute, 2003; Streicher and Rackwitz, 2004; Liang et al., 2007; Nikolaidis, 2007; Jensen et al., 2008; Lagaros et al., 2008; Kanagaraj and Jawahar, 2011; Patelli et. al., 2011) and Robust Design Optimisation (RDO), which attempts to stabilise the performance by minimising the effects of variations without eliminating their causes (Anthony and Keane, 2003; Doltsinis et al., 2005; Zang et al., 2005; Park et al., 2006; Ray and Smith, 2006; Beyer and Sendhoff, 2007; Lagaros and Papadrakakis, 2007a; Lagaros and Papadrakakis, 2007b; Rangavajhala et al., 2007; Schumacher and Olschinka, 2008; Nataraj et al., 2009). An RDO formulation in connection with probabilistic and specifically vulnerability-based constraints was recently proposed by Papadopoulos and Lagaros (2009) for designing safe and economic shell-type structures with random initial imperfections. In that work, target exceeding probabilities were correlated to acceptable damage and/or serviceability limit-states of increasing intensity, up to total structural failure, which was considered to be the buckling of the shell structure.
As a further step to the aforementioned design methodologies, life-cycle cost analysis has been also incorporated in the framework of PBD for assessing the various
Performance-based optimum design of structures 77
designs resulting from the optimisation procedure, while recently, life-cycle cost was incorporated as a design objective in a relevant optimisation formulation (Esteva et. al., 2002; Frangopol and Maute, 2003; Liu et al., 2003; Fragiadakis and Lagaros, 2011; Mitropoulou et. al., 2011). In all cases, computationally efficient optimisation algorithms are usually incorporated in order to achieve fast convergence to the optimum. The importance of using advanced optimisers such as Evolutionary Algorithms (EA) to solve the optimisation problems is more pronounced in probabilistic formulations of the optimisation problem since in each step of the optimisation algorithm a full computationally intensive probabilistic analysis is required (Papadrakakis and Lagaros, 2002; Riauke and Bartlett, 2009; Zeblah et al., 2010). The recent advances in RBO and RDO structural optimisation problems can be found in the book by Tsompanakis et al. (2008).
In the present work a probabilistic Performance-Based Design framework is formulated using Vulnerability objectives (PBD-V) and proposed for the safe and economic seismic structural design of structures. In PBD with vulnerability objectives, in addition to deterministically defined performance objectives that are required for the implementation of the PBD framework, probabilistic (vulnerability) objectives are introduced through target limit-state probabilities of exceedance for the various limit-states of the PBD procedure. This is achieved by performing additional probabilistic design checks during the design procedure. The proposed PBD earthquake design procedure is formulated as a RBO problem which allows designers to explicitly determine acceptable probabilities of exceedance of selected performance indices (for instance the maximum interstorey drift) that should be satisfied simultaneously for all limit-states. In this work, standard PBD is also formulated as structural optimisation with deterministic objectives for comparison purposes. The numerical results demonstrate that vulnerability objectives can be easily integrated into a design framework and the resulting methodology is generally applicable. Results are obtained for PBD with vulnerability objectives and compared to corresponding results obtained from standard deterministic PBD. It is shown the use of vulnerability objectives may lead to more economic optimum designs, with reference to multiple limit-state vulnerabilities and total life cycle cost.
2 Performance-based design framework
2.1 Structural performances and hazard levels
In PBD and PBD-V frameworks the levels of structural performance are selected first. The following levels are considered in this study: (a) Operational: the overall damage is characterised as very light. (b) Life Safety: the overall damage is characterised as moderate. (c) Collapse Prevention: the overall damage is characterised as severe. Following the definition of structural performance levels, the corresponding seismic hazard levels are determined. According to FEMA-350 (2000) and ASCE/SEI Standard 41-06 (2006) three levels are considered: (a) Occasional Earthquake (OE): with probability of exceedance 50% in 50 years (50/50) and mean recurrence interval 72 years. (b) Rare Earthquake (RE): with probability of exceedance 10% in 50 years (10/50) and mean recurrence interval 475 years. (c) Maximum Considered Event (MCE): with probability of exceedance 2% in 50 years (2/50) and mean recurrence interval 2475 years. In the present work the aforementioned three hazard levels are defined based on the hazard curves taken from the work by Papazachos et al. (2005).

78 V. Papadopoulos and N.D. Lagaros
2.2 Structural analysis phase – evaluation of structural capacity
According to ASCE/SEI Standard 41-06 (2006) four alternative analytical procedures, based on linear and non-linear static and dynamic structural response, are recommended for the structural analysis of buildings under earthquake loading. In this study the Non-linear Static analysis Procedure (NSP) is used to assess the structural capacity, where a lateral load distribution that follows the fundamental mode is adopted. The PBD procedure consists of the following steps: (a) All Eurocode 2 (PrEN 1992-1-1, 2002) checks must be satisfied for the gravity loads; (b) if the checks of Step (1) are satisfied then NSP is performed in order to explicitly calculate the demand for the defined intensity levels. The structural capacity is associated with the maximum interstorey drift values θ, and the acceptance criteria of Step (2) are confirmed if satisfied or not in order to accept or not the design. The analysis procedure is terminated as soon as the 150% of the target displacement that corresponds to the 2/50 hazard level is reached or earlier if the algorithm fails to converge. The detailed description of the exact steps followed for the seismic design of the buildings can be found in the work by Lagaros and Papadrakakis (2007a, 2007b).
For every design the capacity is assessed at three performance levels using the displacement coefficient method (FEMA-350, 2000). The target displacement can be obtained from the formula:
2
0 1 2 3 24e
tT
C C C C Sa gδπ
= (1)
where C0, C1, C2, C3, are modification factors. C0 relates the spectral displacement to the likely building roof displacement. C1 relates the expected maximum inelastic displacements to the displacements calculated for linear elastic response. C2 represents the effect of the hysteresis shape on the maximum displacement response and C3 accounts for P-Δ effects. Te is the effective fundamental period of the building in the direction under consideration. Sa is the response spectrum acceleration corresponding to the Te period. Furthermore, to take into account the effect of simultaneous ground shaking in two orthogonal directions, the recommendation of FEMA-350 is employed, where multidirectional excitation effects are accounted for by combining 100% of the response due to loading in the longitudinal direction with 30% of the response due to loading in the transverse direction, and vice versa. The most severe maximum interstorey drift value obtained when both of these load combinations are applied is used to obtain the seismic demand.
2.3 Performance-based design based on deterministic objectives
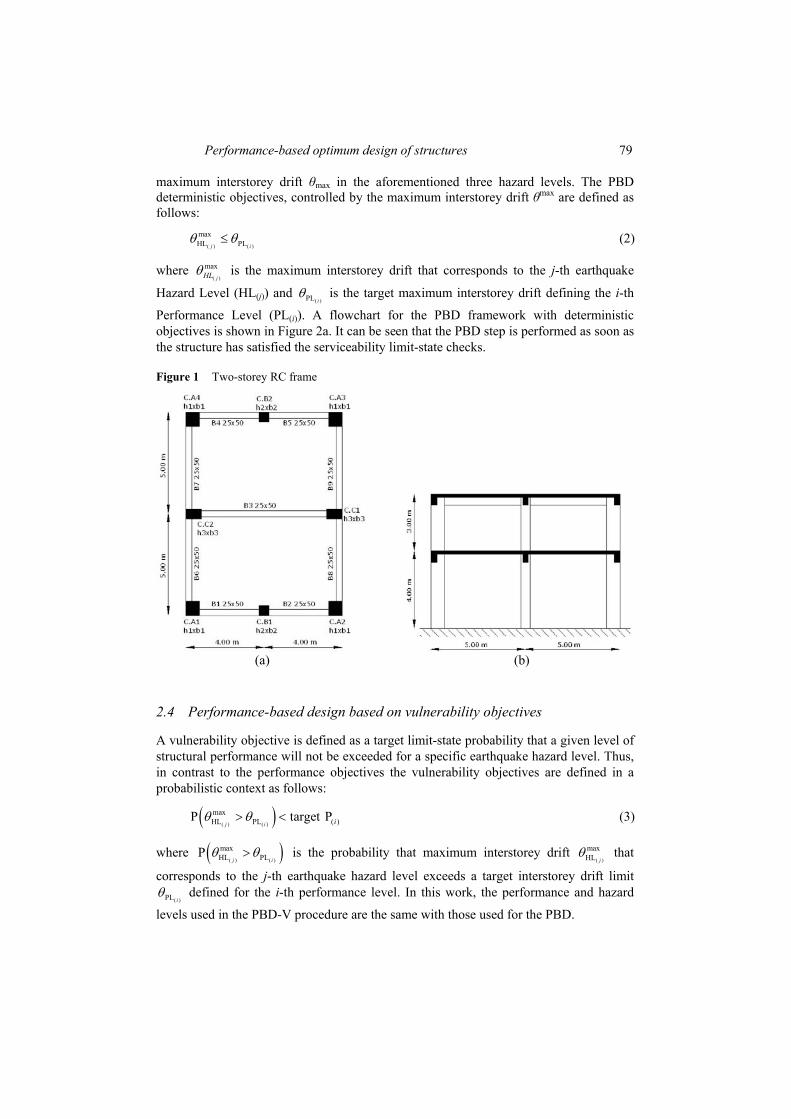
The main part in a performance-based seismic design procedure is the definition of the deterministic performance objectives. A deterministic performance objective is defined as a desired target level of structural performance that corresponds to a specific hazard level. The test example considered in this work is the two-storey reinforced concrete building of Figure 1 which is classified as a standard emergency facility, thus it is designed according to the Enhanced Objectives of ASCE/SEI Standard 41-06 (2006). The Enhanced Objectives are described with the following three performance objectives: (a) Operational level-Occasional Earthquake Hazard level; (b) Life Safety level-Rare Earthquake Hazard level and (c) Collapse Prevention level-Maximum Considered Event Earthquake Hazard level, while the structural performance is monitored through the
Performance-based optimum design of structures 79
maximum interstorey drift θmax in the aforementioned three hazard levels. The PBD deterministic objectives, controlled by the maximum interstorey drift θmax are defined as follows:
( ) ( )
maxHL PLj i
θ θ≤ (2)
where ( )
maxjHLθ is the maximum interstorey drift that corresponds to the j-th earthquake
Hazard Level (HL(j)) and ( )PL i
θ is the target maximum interstorey drift defining the i-th
Performance Level (PL(i)). A flowchart for the PBD framework with deterministic objectives is shown in Figure 2a. It can be seen that the PBD step is performed as soon as the structure has satisfied the serviceability limit-state checks.
Figure 1 Two-storey RC frame
(a) (b)
2.4 Performance-based design based on vulnerability objectives
A vulnerability objective is defined as a target limit-state probability that a given level of structural performance will not be exceeded for a specific earthquake hazard level. Thus, in contrast to the performance objectives the vulnerability objectives are defined in a probabilistic context as follows:
( )( ) ( )
maxHL PL ( )P target P
j i iθ θ> < (3)
where ( )( ) ( )
maxHL PLP
j iθ θ> is the probability that maximum interstorey drift
( )
maxHL j
θ that
corresponds to the j-th earthquake hazard level exceeds a target interstorey drift limit ( )PL i
θ defined for the i-th performance level. In this work, the performance and hazard
levels used in the PBD-V procedure are the same with those used for the PBD.

80 V. Papadopoulos and N.D. Lagaros
Figure 2 Flowchart of the (a) PBD and (b) PBD-V procedures
(a)
(b)

Performance-based optimum design of structures 81
The left part of the inequality given in equation (3) represents the seismic vulnerability FR defined as the limit-state probability, conditioned on a measure of seismic intensity IM, which can be expressed by means of the peak ground acceleration, the spectral acceleration, the spectral velocity, or any other quantity that is consistent with the specification of seismic hazard. Thus the seismic fragility is defined as:
maxPL( )( ) ( | )R iF x P IM xθ θ= ≥ = (4)
Assuming that limit-state structural response is lognormally distributed (Benjamin and Cornell, 2000), and that the intensity measure IM is the peak ground acceleration, FR(x) can be calculated analytically as follows:
( )( )
( ) ( )
maxPL
PL PL
1|( ) ( )i
i i
PGAP PGA InmPGA
θ θβ θ θ
⎡ ⎤⎛ ⎞⎢ ⎥⎜ ⎟≥ = Φ
⎜ ⎟⎢ ⎥⎝ ⎠⎣ ⎦ (5)
where ( )PL( )i
mPGA θ is the median value of peak ground acceleration at which the
building reaches the threshold of limit-state, ( )PL( )i
β θ is the coefficient of variation
(Cov) of the peak ground acceleration that corresponds to the occurrence of limit-state ( )PL i
θ , taken as ( )PL( ) 0.6i
β θ = according to HAZUS-MH MR1 (2003) and Φ is the
standard normal cumulative distribution function. ( )PL( )i
mPGA θ is calculated from the
capacity curve of the structure for the various limit-states by means of capacity spectrum analysis (Fajfar, 1999; Moschonas et al., 2009). Vulnerability-based design of structures requires the satisfaction of equation (3) for all damage levels. Thus, the calculation of a series of limit-state probabilities is required for a corresponding series of earthquake levels monotonically increasing severity. The flowchart for the PBD-V framework employed in this study is shown in Figure 2b.
3 Performance-based structural optimisation
In order to assess the PBD with vulnerability objectives versus the standard PBD, a structural optimisation problem is formulated, where the two design procedures are incorporated as behavioural constraints. In general the corresponding formulations of the optimisation problem can be defined as follows:
mins∈F CIN(s)
where CIN(s) = Cb(s)+Csl(s) + Ccl(s) + Cns(s)
Subject to SERVjg ( ) 0 j 1,...m (serviceability checks)≤ =s (6)
and PBDk 1g ( ) 0 k 1,...n (PBDdeterministicchecks)≤ =s
and PBDk 2g ( ) 0 k 1,...n (Vulnerabilitychecks)≤ =s
82 V. Papadopoulos and N.D. Lagaros
where s represents the design vector corresponding to the dimensions of the columns’ cross-sections, F is the feasible region where all the serviceability (gSERV) and performance-based (gPBD) with deterministic and/or vulnerability constraints are satisfied. The objective function considered in all formulations is the initial construction cost CIN that refers to the total initial construction cost of the structure, Cb(s), Csl(s), Ccl(s) and Cns(s) correspond to the total initial construction cost of beams, slabs, columns and non structural elements, respectively. The term ‘initial cost’ of a new structure corresponds to the cost just after construction. The initial cost is related to both material and labour costs for the construction of the building which includes concrete, steel reinforcement, infill walls and non-structural cost.
For solving the optimisation problem at hand a metaheuristic search algorithm was used. In particular, an evolutionary algorithm was employed in this study that follows the steps described by Lagaros and Papadopoulos (2006). Evolutionary algorithms are population-based probabilistic direct search optimisation algorithms gleaned from principles of Darwinian evolution. Starting with an initial population of μ candidate designs, an offspring population of λ designs is created from the parents using variation operators. Different classes of EA have been proposed with varying the type of operators (mutation, crossover, selection and others) used and the coding implemented (real or binary)
4 Life cycle cost
The designs obtained from the formulation of the PBD using deterministic as well as vulnerability objectives optimisation problems are assessed with respect to their total life cycle cost. The total expected cost CTOT of a structure, may refer either to the design life period of a new structure or to the remaining life period of a retrofitted structure. This cost can be expressed as a function of the time and the design vector as follows (Wen and Kang, 2001):
( , ) ( ) ( , )TOT IN LSC t C C t= +s s s (10)
where CIN is the initial cost of a structure as defined in the previous section and CLS is the present value of the expected limit-state cost, s is the design vector corresponding to the design loads, resistance and material properties, while t is the time period. The term limit-state cost refers to the potential damage cost from earthquakes that may occur during the life of the structure. It accounts for the cost of the repairs after an earthquake, the cost of loss of contents, the cost of injury recovery or human fatality and other direct or indirect economic losses. The quantification of the losses in economical terms depends on several socio-economic parameters. It should be mentioned that in the calculation formula of CLS a factor is used that transforms the costs in present values.
The most difficult cost to quantify is the cost corresponding to the loss of a human life. There are a number of approaches for its calculation, ranging from purely economic reasoning to more sensitive that consider the loss of a person irreplaceable. Therefore, the estimation of the cost of exceedance of the collapse prevention limit-state will vary considerably according to which approach is adopted. In the present study two cases have
Performance-based optimum design of structures 83
been considered: when the cost associated with the human injury and fatality is not taken into account (Case I) and when it is taken into account (Case II). The expected cost for the i-th limit-state, can thus be formulated as follows
( )i i i i iLS dam con ren incC I C C C C= + + + (11a)
( )i i i i i i iLS dam con ren inc inj fatC II C C C C C C= + + + + + (11b)
where idamC is the damage repair cost, i
conC is the loss of contents cost, irenC is the loss of
rental cost and iincC is the income loss cost, i
injC is the cost of injuries and ifatC is the cost
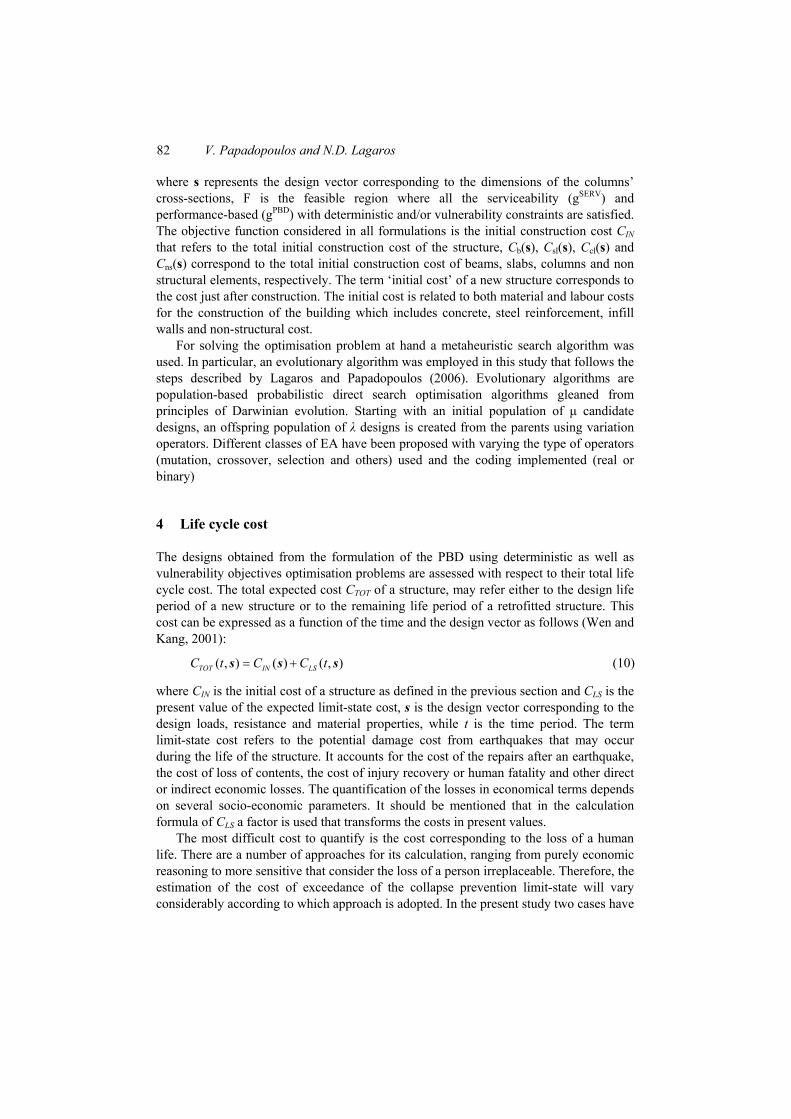
of human fatality. Details about the calculation formula for each limit-state cost along with the values of the basic cost for each category can be found in Table 1 (Wen and Kang, 2001). The values used for the mean damage index, loss of function, down time, expected minor injury rate, expected serious injury rate and expected death rate of Table 1 are given in Table 2 (Kang and Wen, 2000; Ellingwood and Wen, 2005) as a function of the limit-state according to ATC-13 (1985) and FEMA-227 (1992). A detailed description of the calculation steps of the life-cycle cost can be found in Lagaros (2007) and Mitropoulou et al. (2010). Table 1 Limit state costs – calculation formula
Cost Category Calculation Formula Damage/repair (Cdam) Replacement cost (1500 €/m2) × floor area × mean damage index Loss of contents (Ccon) Unit contents cost (500 €/m2) × floor area × mean damage index Rental (Cren) Rental rate (10 €/month/m2) × gross leasable area × loss of function Income (Cinc) Rental rate (1000 €/year/m2) × gross leasable area × down time
Minor injury (Cinj,m) Minor injury cost per person (2000 €/person) × floor area × occupancy rate* × expected minor injury rate
Serious injury (Cinj,s) Serious injury cost per person (2 × 10⁴ €/person) × floor area × occupancy rate × expected serious injury rate
Human fatality (Cfat) Death cost per person (2.8 × 10⁶ €/person) × floor area × occupancy rate × expected death rate
Note: * Occupancy rate 2 persons/100 m2.
Table 2 Limit state parameters for cost evaluation
FEMA-227 ATC-13 Limit State mean damage
index (%) expected minor
injury rate expected serious
injury rate expected
death rateloss of
function (%) down
time(%) (I) None 0 0 0 0 0 0 (II) Slight 0.5 3.0E-05 4.0E-06 1.0E-06 0.9 0.9 (III) Light 5 3.0E-04 4.0E-05 1.0E-05 3.33 3.33 (IV) Moderate 20 3.0E-03 4.0E-04 1.0E-04 12.4 12.4 (V) Heavy 45 3.0E-02 4.0E-03 1.0E-03 34.8 34.8 (VI) Major 80 3.0E-01 4.0E-02 1.0E-02 65.4 65.4 (VII) Collapsed 100 4.0E-01 4.0E-01 2.0E-01 100 100

84 V. Papadopoulos and N.D. Lagaros
It is generally accepted that interstorey drift can be used to determine the expected damage. The relation between the drift ratio limits with the limit-state, employed in this study (Table 3), is based on the work of Ghobarah (2004) for ductile RC moment resisting frames, bare or infilled. Based on analytical and experimental data Ghobarah examined the correlation between drift and damage of various structural elements and systems. He determined a relation of the interstorey drift with various damage levels of different reinforced concrete elements and structural systems. The numerical cost components of the limit-states, for the two storey RC building used in the present study, are listed in Table 4. ( )i
LSC II and ( )iLSC I are the limit-state costs with and without
considering injury and death, respectively. From Table 4 it can be seen that for the case of ( )i
LSC I the damage and income loss costs are the dominating cost components corresponding to 50% and 30% of ( )i
LSC I while in the case that injury and death costs are taken into account damage and income loss costs remain the dominating cost components for the limit-states I–VI, while the cost of human fatality contributes significantly at the highest limit-state VII. Table 3 Limit state drift ratio limits for bare Moment Resisting Frames (MRF)
Limit State Interstorey Drift (%) for bare MRF (I) None θ ≤ 0.1% (II) Slight 0.1% < θ ≤ 0.2% (III) Light 0.2% < θ ≤ 0.4% (IV) Moderate 0.4% < θ ≤ 1.0% (V) Heavy 1.0% < θ ≤ 1.8% (VI) Major 1.8% < θ ≤ 3.0% (VII) Collapsed 3.0% < θ
Table 4 Numerical values for limit state cost components (1000 €)
iinjC
Limit State idamC i
conC irenC i
incC Minor Serious
ifatC ( )i
LSC I ( )iLSC II
(I) None 0.00 0.00 0.00 0.00 0.00 0.00 0.00 0.00 0.00 (II) Slight 1.20 0.40 0.17 1.44 0.00 0.00 0.01 3.21 3.22 (III) Light 12.00 4.00 0.64 5.33 0.00 0.00 0.09 21.97 22.06 (IV) Moderate 48.00 16.00 2.38 19.84 0.02 0.03 0.90 86.22 87.16 (V) Heavy 108.00 36.00 6.68 55.68 0.19 0.26 8.96 206.36 215.77 (VI) Major 192.00 64.00 12.56 104.64 1.92 2.56 89.60 373.20 467.28 (VII) Collapsed 240.00 80.00 19.20 160.00 2.56 25.60 1792.00 499.20 2319.36
Based on a Poisson process model of earthquake occurrences and an assumption that damaged buildings are immediately retrofitted to their original intact conditions after each major damage-inducing seismic attack, Wen and Kang (2001) proposed the following formula for the expected limit-state cost function considering N limit-states:
1
( , ) (1 )N
t iLS LS i
i
vC t e C Pλ
λ−
=
= − ∑s (12)

Performance-based optimum design of structures 85
where
1( ) ( )i i iP P Pθ θ θ θ += > − > (13)
and
( ) ( 1/ ) In[1 ( )]i i iP t Pθ θ θ θ> = − ⋅ − − (14)
Pi is the probability of the i-th limit-state being violated given the earthquake occurrence and i
LSC is the corresponding limit-state cost; ( )iP θ θ− is the exceedance probability given occurrence; θi, θi+1 are the drift ratios defining the lower and upper bounds of the i-th limit-state; ( )i iP θ θ− is the annual exceedance probability of the maximum interstorey drift value Δi; ν is the annual occurrence rate of significant earthquakes modelled by a Poisson process and t is the service life of a new structure or the remaining life of a retrofitted structure. The first component of equation (12), with the exponential term, is used in order to express CLS in present value, where λ is the annual monentary discount rate. In this work the annual monentary discount rate λ is taken to be constant, since considering a continuous discount rate is accurate enough for all practical purposes according to Rackwitz (2006). Various approaches yield values of the discount rate λ in the range of 3–6% (Ellingwood and Wen, 2005), in this study it was taken equal to 5%.
Each limit-state is defined by the drift ratio limits listed in Table 3. When one of those drift values is exceeded the corresponding limit-state is assumed to be reached. The annual exceedance probability ( )i iP θ θ− of the i-th limit-state is obtained from a relationship of the form:
( ) ( ) ki i iP θ θ γ θ −− = (15)
The above expression is obtained by best fit of known i iP θ− pairs. These pairs correspond to the 2%, 10% and 50% in 50 years earthquakes that have known probabilities of exceedance iP . The corresponding maximum interstorey drift limit values θi, for the three earthquake hazard levels, are obtained using the pushover analysis. According to Poisson’s law the annual probability of exceedance of an earthquake with a probability of exceedance p in t years is given by the formula:
( 1/ ) In(1 )P t p= − ⋅ − (16)
Which means that the 2/50 earthquake has a probability of exceedance equal to 2%P = – ln(1–0.02)/50 = 4.04×10⁻⁴ (4.04×10⁻² %).
5 Numerical study
A simple two-storey 3D RC building shown in Figure 1 is employed in this work in order to demonstrate the philosophy of PBD procedure when using vulnerability objectives, explain the corresponding numerical implementation and assess the proposed design framework. The columns, having rectangular cross-section, are separated into three groups resulting to six design variables. All beams have a cross-section of 25 × 50 cm2 which remains unchanged during the optimisation procedure. The materials assumed correspond to the concrete class C16/20 (nominal cylindrical strength of 16 MPa) and
86 V. Papadopoulos and N.D. Lagaros
steel class S500 (nominal yield stress of 500 MPa), while the slab thickness is equal to 18 cm. The design loads considered are its self weight, 1.5 kN/m2 permanent load and 2.0 kN/m2 live load.
All analyses were performed using the OpenSEES platform (McKenna and Fenves, 2001). Each member is modelled with a single force-based, fibre beam-column element. This element provides a good balance between accuracy and computational cost. The modified Kent and Park (1971) model is employed for the simulation of the concrete fibres. This model was chosen because it allows for an accurate prediction of the demand for flexure-dominated RC members despite its relatively simple formulation. The transient behaviour of the reinforcing bars was simulated with the Menegotto and Pinto (1973) model, while in order to account for shear failure a non-linear shear force-shear distortion (V-γ) law is adopted based on the work of Marini and Spacone (2005). The effect of gravity loads and second-order effects are considered using the geometric stiffness matrix. The same material properties are used for all the members of the frame. The base of the columns at the ground floor is assumed to be fixed.
With reference to equation (2), the performance objectives for the PBD formulation are defined as follows:
max50/50max
10/50
max2/50
(s) 0.4%
(s) 1.8%
(s) 3.0%
θ
θ
θ
≤
≤
≤
(17)
where subscripts 50/50, 10/50 and 2/50, indicate the probability of exceedance (50%, 10% and 2% in 50 years) of the seismic event corresponding to the OE, RE and MCE hazard levels (see Section 2.1), while the values for
( )PL iθ (0.4%, 1.8% and 3% for the
three performance levels, respectively) are taken from the work of Ghobarah (2004). For the PBD with Vulnerability constraints (PBD-V) formulation, three cases of
vulnerability objectives are examined according to equation (3), as follows: max50/50
max10/50
max2/50
P( ( ) 0.4%) 0.1%
Case A : P( ( ) 1.8%) 0.01%
P( ( ) 3.0%) 0.001%
θ
θ
θ
⎧ > ≤⎪
> ≤⎨⎪ > ≤⎩
s
s
s
(18)
max50/50
max10/50
max2/50
P( ( ) 0.4%) 5.0%
Case B : P( ( ) 1.8%) 0.5%
P( ( ) 3.0%) 0.05%
θ
θ
θ
⎧ > ≤⎪
> ≤⎨⎪ > ≤⎩
s
s
s
(19)
max50/50
max10/50max2/50
P( ( ) 0.4%) 1.0%
CaseC : P( ( ) 1.8%) 1.0%
P( ( ) 3.0%) 1.0%
θ
θ
θ
⎧ > ≤⎪
> ≤⎨⎪ > ≤⎩
s
s
s
(20)
Each vulnerability objective is defined as a target limit-state probability that a given level of structural performance will not be exceeded for a specific earthquake hazard level. These three cases for the vulnerability objectives where implemented in order to investigate the effect that different selections of target probabilities have on the designs obtained as well as to their corresponding structural performances.

Performance-based optimum design of structures 87
A parametric study is performed in two stages with respect to the PBD and the three cases of the PBD-V formulations. In the first stage an optimum design is computed employing the EA (μ + λ) optimisation scheme (Lagaros and Papadopoulos, 2006) with ten parents and offsprings (μ = λ = 10). In total four optimisation problems are formulated resulting to four optimum designs. In the second stage the four designs are assessed with reference to the limit-state fragility curves and the total life cycle cost. Table 5 depicts the optimum designs obtained along with the initial construction and total life cycle costs. In Table 5 the dimensions of the cross-sections of the columns along with the detailing of the longitudinal (LR) and transverse (TR) reinforcements are provided. From Table 5 it can be observed that PBD design is cheaper by 2.0–10.0% compared to the three PBD-V designs. In the case when the four designs are compared with reference to the cost of the RC skeletal members alone, the initial cost of the design PBD-V(A) is increased by 31% compared to PBD while the initial cost of the designs PBD-V(B) and PBD-V(C) by 22% and 16%, respectively. Table 5 Optimisation results
Design PBD PBD-V (A) PBD-V (B) PBD-V (C)
h1 × b1 (m2) 0.30 × 0.25, LR:4Ø14
+ 4Ø16, TR: (2)Ø10/20 cm
0.65 × 0.75, LR:14Ø18 + 8Ø20, TR: (4)Ø10/10 cm
0.70 × 0.40, LR:8Ø20 + 8Ø22, TR: (2)Ø10/20 cm
0.60 × 0.30, LR:8Ø20, TR: (2)Ø10/20 cm
h2 × b2 (m2) 0.25 × 0.45, LR:4Ø14
+ 4Ø16, TR: (2)Ø10/20 cm
0.60 × 0.25, LR:6Ø18 + 6Ø20, TR: (2)Ø10/20 cm
0.40 × 0.30, LR:4Ø14 + 4Ø18, TR: (2)Ø10/20 cm
0.35 × 0.25, LR:4Ø14 + 4Ø16, TR:
(2)Ø10/20 cm
h3 × b3 (m2) 0.25 × 0.45, LR:4Ø14
+ 4Ø16, TR: (2)Ø10/20 cm
0.60 × 0.65, LR:10Ø20 + 8Ø24, TR: (4)Ø10/20 cm
0.25 × 0.80, LR: 12Ø22, TR:
(2)Ø10/10 cm
0.25 × 0.75, LR:6Ø18 + 6Ø22, TR:
(2)Ø10/20 cm CIN,RC Skeleton
(1000 €) 21.72 28.49 26.52 25.16
CIN (1000 €) 115.10 127.28 120.61 117.51
Notes: LR: Longitudinal Reinforcement TR: Transverse Reinforcement.
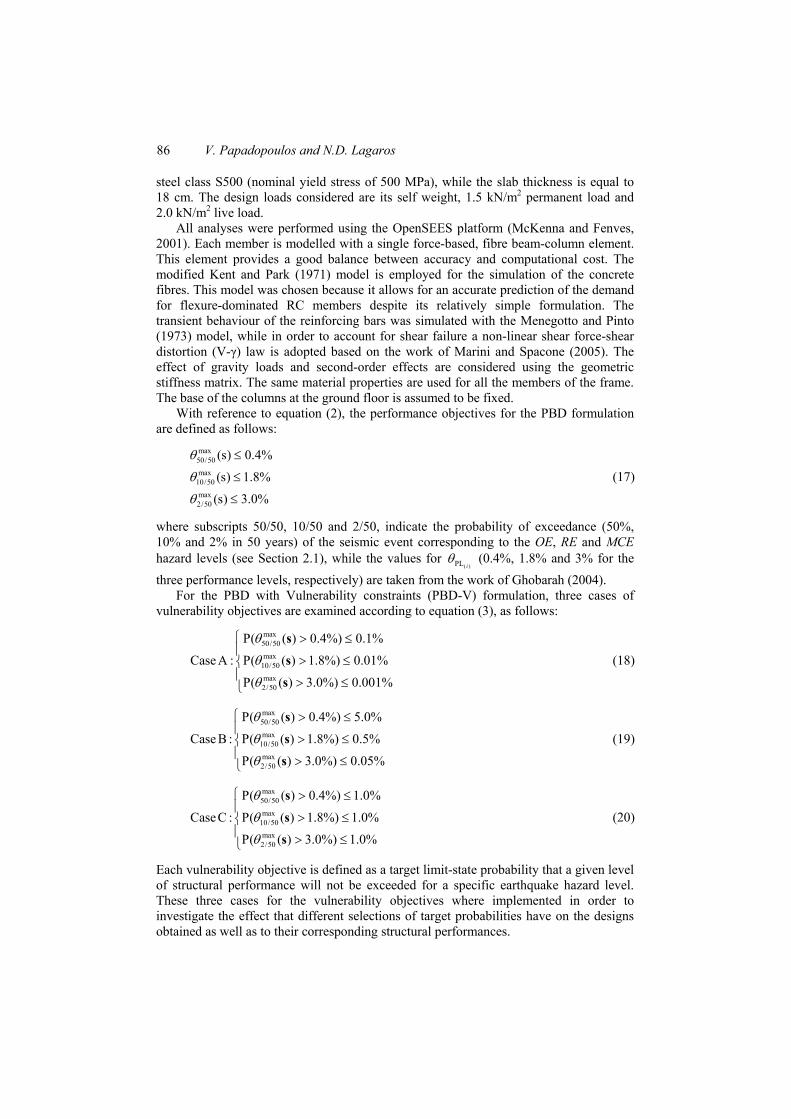
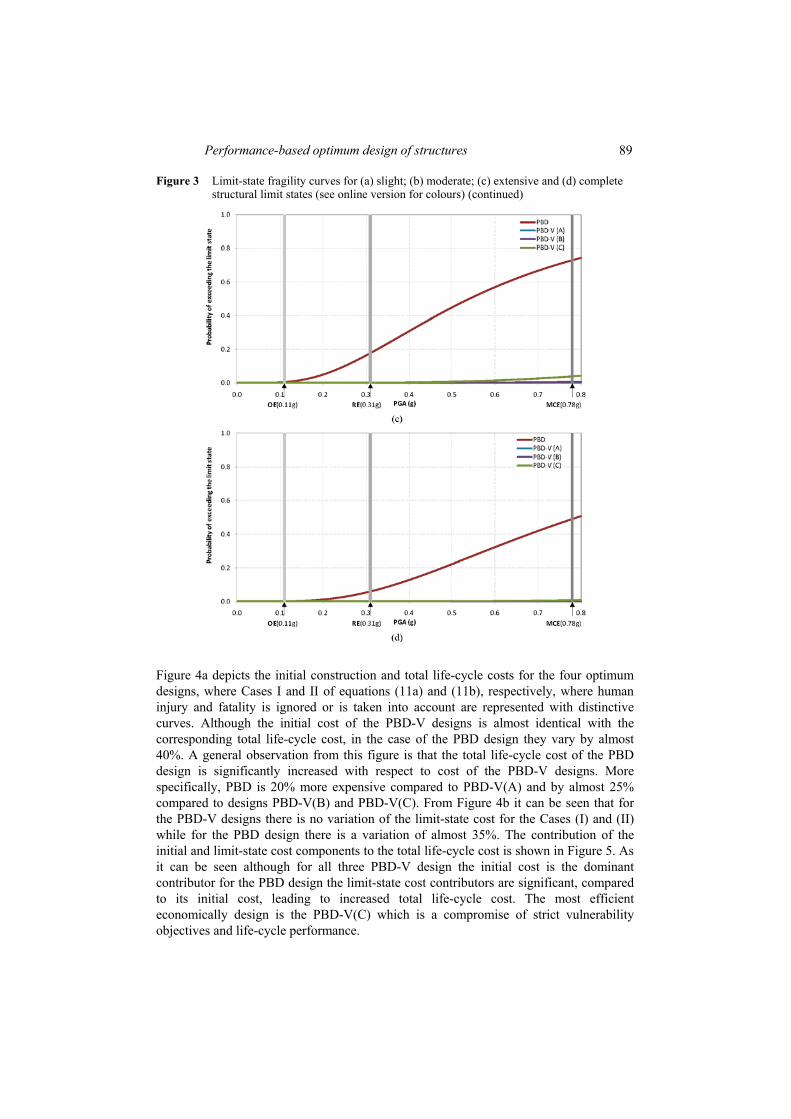
Four limit-state fragility curves are obtained for the low-rise RC building of Figure 1. The limit-states considered are expressed in terms of maximum interstorey drift values and cover the whole range of structural damage from serviceability to life safety. The following Δ values are chosen for each of the four limit-states: 0.4%, 1.0%, 2.0% and 3.0%. Figures 3a–d depicst the limit-state vulnerability curves developed for the four structural limit-states. In these figures, the PGA values that correspond to the three earthquake hazard levels (OE, RE and MCE) are drawn with a bold vertical line, while the limit-state probabilities of exceedance (intersections of the PGA vertical lines with the corresponding vulnerability curves) are given in Table 6. It can be seen that although the PBD and PBD-V designs are similar with respect to the CIN, they differ significantly with respect to their structural behaviour since the probability of exceedance for all limit-states of the PBD design is significantly larger than the corresponding to the PBD-V designs. Worth mentioning the observation that for the Δ = 3.0% limit-state the probability of exceedance of the PBD design is two to ten orders of magnitude greater than the corresponding probabilities of the PBD-V designs.

88 V. Papadopoulos and N.D. Lagaros
Table 6 Probability of exceeding the limit state (%)
Limit State PBD PBD-V (A) PBD-V (B) PBD-V (C) Occasional Earthquake (OE) Hazard Level
θ ≥ 0.4% 4.66E + 01 1.49E-03 6.89E-02 9.03E-01 θ ≥ 1.0% 5.30E + 00 5.83E-07 1.13E-04 5.20E-03 θ ≥ 2.0% 3.90E-01 3.39E-10 1.97E-07 2.35E-05 θ ≥ 3.0% 4.95E-02 2.36E-12 2.62E-09 5.46E-07
Rare Earthquake (RE) Hazard Level θ ≥ 0.4% 9.50E + 01 7.26E-01 7.09E + 00 2.63E + 01 θ ≥ 1.0% 5.45E + 01 3.53E-03 1.35E-01 1.57E + 00 θ ≥ 2.0% 1.76E + 01 1.43E-05 1.61E-03 4.69E-02 θ ≥ 3.0% 5.90E + 00 3.14E-07 6.69E-05 3.37E-03
Maximum Considered Event (MCE) Earthquake Hazard Level θ ≥ 0.4% 9.99E + 01 1.83E + 01 5.29E + 01 8.18E + 01 θ ≥ 1.0% 9.51E + 01 7.48E-01 7.24E + 00 2.71E + 01 θ ≥ 2.0% 7.29E + 01 1.65E-02 4.45E-01 3.86E + 00 θ ≥ 3.0% 4.91E+01 9.86E-04 4.96E-02 7.25E-01
Figure 3 Limit-state fragility curves for (a) slight; (b) moderate; (c) extensive and (d) complete structural limit states (see online version for colours)
Performance-based optimum design of structures 89
Figure 3 Limit-state fragility curves for (a) slight; (b) moderate; (c) extensive and (d) complete structural limit states (see online version for colours) (continued)
Figure 4a depicts the initial construction and total life-cycle costs for the four optimum designs, where Cases I and II of equations (11a) and (11b), respectively, where human injury and fatality is ignored or is taken into account are represented with distinctive curves. Although the initial cost of the PBD-V designs is almost identical with the corresponding total life-cycle cost, in the case of the PBD design they vary by almost 40%. A general observation from this figure is that the total life-cycle cost of the PBD design is significantly increased with respect to cost of the PBD-V designs. More specifically, PBD is 20% more expensive compared to PBD-V(A) and by almost 25% compared to designs PBD-V(B) and PBD-V(C). From Figure 4b it can be seen that for the PBD-V designs there is no variation of the limit-state cost for the Cases (I) and (II) while for the PBD design there is a variation of almost 35%. The contribution of the initial and limit-state cost components to the total life-cycle cost is shown in Figure 5. As it can be seen although for all three PBD-V design the initial cost is the dominant contributor for the PBD design the limit-state cost contributors are significant, compared to its initial cost, leading to increased total life-cycle cost. The most efficient economically design is the PBD-V(C) which is a compromise of strict vulnerability objectives and life-cycle performance.

90 V. Papadopoulos and N.D. Lagaros
Figure 4 (a) Initial and total expected life-cycle cost and (b) expected limit state cost as a function of the designs obtained for PBD and PBD-V frameworks (t = 50 years, λ = 5%) for the cases (I) and (II) (see online version for colours)
Figure 5 Contribution of the initial cost and limit state cost components to the total expected life cost for the designs obtained for PBD and PBD-V frameworks (see online version for colours)

Performance-based optimum design of structures 91
6 Concluding remarks
In this work a methodology is proposed for the performance-based seismic design of structures using vulnerability objectives. The framework of PBD with vulnerability constraints is based on the principals of the performance-based design procedure, i.e. assess the structural performance in multiple earthquake intensity levels; but in the place of the deterministically defined performance objectives, vulnerability objectives are used instead. A structural optimisation problem is considered in order to assess the designs obtained using the proposed approach with respect to a standard PBD procedure with deterministic constraints. The two design procedures have been applied for the optimum design of a 3D RC building. It has been demonstrated that the concepts of PBD using vulnerability constraints can be easily integrated into a structural optimum design procedure in order to obtain optimum designs that fulfil the provisions of a modern framework for seismic design of structures. From the test cases examined it was observed that although PBD with vulnerability constraints is up to 10% more expensive compared to the standard PBD designs in terms of initial cost, it is 20–25% cheaper with reference to the total life cycle cost while standard PBD depicts many orders of magnitude larger limit-state probabilities of exceedance.
References Anthony, D.K. and Keane, A.J. (2003) ‘Robust-optimal design of a lightweight space structure
using a genetic algorithm’, AIAA Journal, Vol. 41, No. 8, pp.1601–1604. Applied Technology Council (ATC) (1985) Earthquake Damage Evaluation Data for California,
Report No. ATC-13, Redwood City, CA. ASCE/SEI Standard 41-06 (2006) Seismic Rehabilitation of Existing Buildings, Prepublication
edition, Structural Engineering Institute, American Society of Civil Engineers. Beck, J.L., Chan, E., Irfanoglu, A. and Papadimitriou, C. (1999) ‘Multi-criteria optimal structural
design under uncertainty’, Earthquake Engineering and Structural Dynamics, Vol. 28, No. 7, pp.741–761.
Benjamin, J.R. and Cornell, C.A. (1970) Probability, Statistics, and Decision for Civil Engineers, McGraw-Hill, New York.
Beyer, H-G. and Sendhoff, B. (2007) ‘Robust optimization – a comprehensive survey’, Computer Methods in Applied Mechanics and Engineering, Vol. 196, Nos. 33/34, pp.3190–3218.
Doltsinis, I., Kang, Z. and Cheng, G. (2005) ‘Robust design of non-linear structures using optimization methods’, Computer Methods in Applied Mechanics and Engineering, Vol. 194, Nos.12–16, pp.1779–1795.
Ellingwood, B.R. and Wen, Y-K. (2005) ‘Risk-benefit-based design decisions for low-probability/high consequence earthquake events in mid-America’, Progress in Structural Engineering and Materials, Vol. 7, No. 2, pp.56–70.
Esteva, L., Díaz-López, O., García-Pérez, J., Sierra, G. and Ismael, E. (2002) ‘Life-cycle optimization in the establishment of performance-acceptance parameters for seismic design’, Structural Safety, Vol. 24, Nos. 2–4, pp.187–204.
Fajfar, P. (1999) ‘Capacity spectrum method based on inelastic demand spectra’, Earthquake Engineering and Structural Dynamics, Vol. 28, No. 9, pp.979–993.
FEMA-227 (1992) A Benefit–Cost Model for the Seismic Rehabilitation of Building, Federal Emergency Management Agency, Building Seismic Safety Council, Washington, DC.
FEMA-350 (2000) Recommended Seismic Design Criteria for New Steel Moment-Frame Buildings, Federal Emergency Management Agency, Washington DC.

92 V. Papadopoulos and N.D. Lagaros
Fragiadakis, M. and Lagaros, N.D. (2011) ‘An overview to structural seismic design optimization frameworks’, Computers and Structures, Vol. 89, Nos. 11–12, pp.1155–1165.
Frangopol, D.M. and Maute, K. (2003) ‘Life-cycle reliability-based optimization of civil and aerospace structures’, Computers and Structures, Vol. 81, No. 7, pp.397–410.
Ghobarah, A. (2004) ‘On drift limits associated with different damage levels’, Proceedings of the International Workshop on Performance-Based Seismic Design: Concepts and Implementation, 28 June–1 July, Bled, Slovenia, pp.321–332.
HAZUS-MH MR1 (2003) Multi-hazard Loss Estimation Methodology Earthquake Model, FEMA-National Institute of Building Sciences, Washington, DC.
Jensen, H.A., Valdebenito, M.A. and Schueller, G.I. (2008) ‘An efficient reliability-based optimization scheme for uncertain linear systems subject to general Gaussian excitation’, Computer Methods in Applied Mechanics and Engineering, Vol. 198, No. 1, pp.72–87.
Jiang, M., Corotis, R.B. and Hugh Ellis, J. (2000) ‘Optimal life-cycle costing with partial observability’, Journal of Infrastructure Systems, Vol. 6, No. 2, pp.56–66.
Kanagaraj, G. and Jawahar, N. (2011) ‘Optimal redundancy allocation for a reliability-based total cost of ownership model using genetic algorithm’, International Journal of Reliability and Safety, Vol. 5, No. 2, pp.158–181.
Kang, Y-J. and Wen, Y.K. (2000) Minimum Life-cycle Cost Structural Design against Natural Hazards, Structural Research Series (629), Department of Civil and Environmental Engineering, University of Illinois at Urbana-Champaign, Urbana, IL.
Kent, D.C. and Park, R. (1971) ‘Flexural members with confined concrete’, Journal of Structural Division, Vol. 97, No. 7, pp.1969–1990.
Krawinkler, H., Zareian, F., Medina, R.A. and Ibarra, L.F. (2006) ‘Decision support for conceptual performance-based design’, Earthquake Engineering and Structural Dynamics, Vol. 35, No. 1, pp.115–133.
Kunnath, S.K., Nghiem, Q. and El-Tawil, S. (2004) ‘Modeling and response prediction in performance-based seismic evaluation: case studies of instrumented steel moment-frame buildings’, Earthquake Spectra, Vol. 20, No. 3, pp.883–915.
Lagaros, N.D. (2007) ‘Life-cycle cost analysis of construction practices’, Bulletin of Earthquake Engineering, Vol. 5, pp.425–442.
Lagaros, N.D., Garavelas, A.T. and Papadrakakis, M. (2008) ‘Innovative seismic design optimization with reliability constraints’, Computer Methods in Applied Mechanics and Engineering, Vol. 198, No. 1, pp.28–41.
Lagaros, N.D. and Papadopoulos V. (2006) ‘Optimum design of shell structures with random geometric, material and thickness imperfections’, International Journal of Solids and Structures, Vol. 43, Nos. 22/23, pp.6948–6964.
Lagaros, N.D. and Papadrakakis, M. (2007) ‘Robust seismic design optimization of steel structures’, Structural and Multidisciplinary Optimization, Vol. 33, No. 6, pp.457–469.
Lagaros, N.D. and Papadrakakis, M. (2007) ‘Seismic design of RC structures: a critical assessment in the framework of multi-objective optimization’, Earthquake Engineering and Structural Dynamics, Vol. 36, No. 12, pp.1623–1639.
Liang, J., Mourelatos, Z.P. and Nikolaidis, E. (2007) ‘A single-loop approach for system reliability-based design optimization’, Journal of Mechanical Design, Transactions, Vol. 129, No.12, pp.1215–1224.
Liu, M., Burns, S.A. and Wen, Y.K. (2003) ‘Optimal seismic design of steel frame buildings based on life cycle cost considerations’, Earthquake Engineering and Structural Dynamics, Vol. 32, pp.1313–1332.
Marini, A. and Spacone, E. (2006) ‘Analysis of reinforced concrete elements including shear effects’, ACI Structural Journal, Vol. 103, No. 5, pp.645–655.
McKenna, F. and Fenves, G.L. (2001) The OpenSees Command Language Manual – Version 1.2, Pacific Earthquake Engineering Research Centre, University of California, Berkeley.
Performance-based optimum design of structures 93
Menegotto, M. and Pinto, P.E. (1973) ‘Method of analysis for cyclically loaded reinforced concrete plane frames including changes in geometry and non-elastic behavior of elements under combined normal force and bending’, Proceedings, IABSE Symposium on Resistance and Ultimate Deformability of Structures Acted on by Well Defined Repeated Loads, Lisbon, pp.15–22.
Mitropoulou, C.C., Lagaros, N.D. and Papadrakakis, M. (2010) ‘Building design based on energy dissipation: a critical assessment’, Bulletin of Earthquake Engineering, Vol. 8, No. 6, pp.1375–1396.
Mitropoulou, C.C., Lagaros, N.D. and Papadrakakis, M. (2011) ‘Life-cycle cost assessment of optimally designed reinforced concrete buildings under seismic actions’, Reliability Engineering and System Safety, Vol. 96, pp.1311–1331.
Moschonas, I.F., Kappos, A.J., Panetsos, P., Papadopoulos, V., Makarios, T. and Thanopoulos, P. (2009) ‘Seismic fragility curves for Greek bridges: methodology and case studies’, Bulletin of Earthquake Engineering, Vol. 7, No. 2, pp.439–468.
Nataraj, P.S.V., Deshpande, M.M. and Vyawahare, V. (2009) ‘Design and implementation of an optimal, reliable and robust control system for an industrial plant emulator’, International Journal of Reliability and Safety, Vol. 3, Nos. 1–3, pp.131–152.
Nikolaidis, E. (2007) ‘Decision-based approach for reliability design’, Journal of Mechanical Design Transactions, Vol. 129, No. 5, pp.466–475.
Papadopoulos, V. and Lagaros, N.D. (2009) ‘Vulnerability-based robust design optimization of imperfect shell structures’, Structural Safety, Vol. 31, No. 6, pp.475–482.
Papadrakakis, M. and Lagaros, N.D. (2002) ‘Reliability-based structural optimization using neural networks and Monte Carlo simulation’, Computer Methods in Applied Mechanics and Engineering, Vol. 191, No. 32, pp.3491–3507.
Papazachos, B.C., Papaioannou, C.A. and Theodulidis, N.P. (1993) ‘Regionalization of seismic hazard in Greece based on seismic sources’, Natural Hazards, Vol. 8, No. 1, pp.1–18.
Park, G.J., Lee, T.H., Lee, K.H. and Hwang, K.H. (2006) ‘Robust design: an overview’, AIAA Journal, Vol. 44, No. 1, pp.181–191.
Patelli, E., Valdebenito, M.A. and Schuëller, G.I. (2011) ‘General purpose stochastic analysis software for optimal maintenance scheduling: application to a fatigue-prone structural component’, International Journal of Reliability and Safety, Vol. 5, No. 3/4, pp.211–228.
PrEN 1992-1-1 (2002) Eurocode 2: Design of Concrete Structures – Part 1: General Rules and Rules for Buildings, Commission of the European Communities, European Committee for Standardization.
Pu, Y., Das, P.K. and Faulkner, D. (1997) ‘A strategy for reliability-based optimization’, Engineering Structures, Vol. 19, No. 3, pp.276–282.
Rackwitz, R. (2006) ‘The effect of discounting, different mortality reduction schemes and predictive cohort life tables on risk acceptability criteria’, Reliability Engineering and System Safety, Vol. 91, No. 4, pp.469–484.
Rangavajhala, S., Mullur, A. and Messac, A. (2007) ‘The challenge of equality constraints in robust design optimization: examination and new approach’, Structural and Multidisciplinary Optimization, Vol. 34, No. 5, pp.381–401.
Ray, T. and Smith, W. (2006) ‘A surrogate assisted parallel multiobjective evolutionary algorithm for robust engineering design’, Engineering Optimization, Vol. 38, No. 8, pp.997–1011.
Riauke, J. and Bartlett, L. (2009) ‘Safety system design optimisation using a multi-objective genetic algorithm’, International Journal of Reliability and Safety, Vol. 3, No. 4, pp.397–412.
Royset, J.O., Der Kiureghian, A. and Polak, E. (2001) ‘Reliability-based optimal design of series structural systems’, Journal of Engineering Mechanics, Vol. 127, No. 6, pp.607–614.
Schumacher, A. and Olschinka, C. (2008) ‘Robust design considering highly nonlinear structural behavior’, Structural and Multidisciplinary Optimization, Vol. 35, No. 3, pp.263–272.
94 V. Papadopoulos and N.D. Lagaros
Streicher, H. and Rackwitz, R. (2004) ‘Time-variant reliability-oriented structural optimization and a renewal model for life-cycle costing’, Probabilistic Engineering Mechanics, Vol. 19, No. 1/2, pp.171–183.
Tsompanakis, Y., Lagaros, N.D. and Papadrakakis, M. (Eds) (2008) Structural Optimization Considering Uncertainties, Taylor & Francis.
Wen, Y.K. and Ellingwood, B.R. (2005) ‘The role of fragility assessment in consequence-based engineering’, Earthquake Spectra, Vol. 21, No. 3, pp.861–877.
Wen, Y-K. and Kang, Y.J. (2001) ‘Minimum building life-cycle cost design criteria I: methodology’, Journal of Structural Engineering, Vol. 127, No. 3, pp.330–337.
Zang, C., Friswell, M.I. and Mottershead, J.E. (2005) ‘A review of robust optimal design and its application in dynamics’, Computers and Structures, Vol. 83, No. 4/5, pp.315–326.
Zeblah, A., Chatelet, E., Yalaoui, F., Samrout, M.E. and Massim, Y. (2010) ‘Reliability optimization using harmony search algorithm under performance and budget constraints’, International Journal of Reliability and Safety, Vol. 4, Nos.2/3, pp.299–317.
Zou, X.K. and Chan, C.M. (2005a) ‘An optimal resizing technique for seismic drift design of concrete buildings subjected to response spectrum and time history loadings’, Computers and Structures, Vol. 83, Nos.19/20, pp.1689–1704.
Zou, X.K. and Chan, C.M. (2005b) ‘Optimal seismic performance-based design of reinforced concrete buildings using nonlinear pushover analysis’, Engineering Structures, Vol. 27, No. 8, pp.1289–1302.