performance and special trials on u.s. navy surface ships
TRANSCRIPT
* David Taylor Research CenterBethesda, MD 20084-5000
DTRC/SHD-1320-01 April 1989Ship Hydromechanics Department
Research & Development Report'ci1<Performance and Special Trials on
I U.S. NAVY Surface Shipsby
Io Richard J. Stenson - Head, Full Scale Trials BranchW Lowry L. Hundley - Project Manager, Full Scale Trials Branch
II
Ii
C"Ca DTIC199 ELECTES1D
II 0 0 _
1 90 03

I
ICODE 011 DIRECTOR OF TECHNOLOGY, PLANS AND ASSESSMENT
12 SHIP SYSTEMS INTEGRATION DEPARTMENT I14 SHIP ELECTROMAGNETIC SIGNATURES DEPARTMENT 315 SHIP HYDROMECHANICS DEPARTMENT
16 AVIATION DEPARTMENT I1 / SHIP STRUCTURES AND PROTECTION DEPARTMENT
18 COMPUTATION, MATHEMATICS & LOGISTICS DEPARTMENT
19 SHIP ACOUSTICS DEPARTMENT I27 PROPULSION AND AUXILIARY SYSTEMS DEPARTMENT
28 SHIP MATERIALS ENGINEERING DEPARTMENT I
III
DTRC ISSUES THREE TYPES OF REPORTS:
1. DTRC reports, a formal series, contain information of permanent technical value. 3They carry a consecutive numerical identification regardless of their classification or theoriginating department.
2. Departmental reports, a semiformal series, contain information of a preliminary,temporary, or proprietary nature or of limited interest or significance. They carry adepartmental alphanumerical identification.
3. Technical memoranda, an informal series, contain technical documentation oflimited use and interest. They are pimarily working papers intended for internal use. Theycarry an identifying number which indicates their type and the numerical code of theoriginating department. Any distribution outside DTRC must be approved by the head ofie originating depat;ment on a case-by-case basis.
I
I UNCLASSIFIEDSECURITY CLASSIFICATION OF THIS PAGE
Frm Approved
REPORT DOCUMENTATION PAGE OMBNo 0704-0188
la REPORT SECURITY CLASSIFICATION lb RESTRICTIVE MARKINGS
Unclassified2a SECURITY CLASSIFICATION AUTHORITY 3 DISTRIBUTION /AVAILABILITY OF REPORT
Approved for public release;2b DECLASSIFICATION/ DOWNGRADING SCHEDULE Distribution is unlimited.
4 PERFORMING ORGANIZATION REPORT NUMBER(S) 5 MONITORING ORGANIZATION REPORT NUMBER(S)
DTRC/SHD-1320-01
6a NAME OF PERFORMING ORGANIZATION 6b OFFICE SYMBOL 7a. NAME OF MONITORING ORGANIZATION(If applicable)
David Taylor Research Center Code 15236c. ADDRESS (City, State, and ZIPCode) 7b ADDRESS(City, State, and ZIP Code)
Bethesda, MD 20084-5000
8a. NAME OF FUNDING/ SPONSORING 8b. OFFICE SYMBOL 9 PROCUREMENT INSTRUMENT IDENTIFICATION NUMBERORGANIZATION (If applicable)
Naval Sea Systems Command Code 55W32
8c. ADDRESS (City, State, and ZIP Code) 10 SOURCE OF FUNDING NUMBERS=PROGRAM PROJECT TASK WORK UNIT
EEETN NONO ACCESSION NO
Washington, D. C. 20362-5101
11. TITLE (Include Sec rity Classification)
Performance and Special Trials on U. S. Navy Surface Ships
12 PERSONAL AUTHOR(S)
Stenson, Richard J., and Lowry L. Hundley13a TYPE OF REPORT 13b TIME COVERED 114. DATE OF REPORT (YearMonth,Day) 315PAGE COUNT
Final FROM TO i Ar1 1 QRQ16 SUPPLEMENTARY NOTATION
17 COSATI CODES 18 SUBJECT TERMS (Continue on reverse if necessary and identify by block number)
FIELD GROUP SUB-GROUP " Performance and Special Trials Tactical Trials-Standardization Trials) Trailed and Locked Shaft Trials)Acceleration and Decelratoa s.A V cc r, 0 0 r,' F ',,f<
19 ABSTRACT (Con',:nue on reverse if necessary and identify by block number) to ) C 0 P (_ _
>Performance and Special Trials are conducted on the first ship of each new classof ships built for the US Navy, and on ships of existing classes where major modifica-tions have occurred. Performance trials include a series of extensive sea trialsdesigned to obtain definitive data L aocerning thu hydrodynamic capa.bilities of theship. Special Trials are a series of unique trials carried out concurrently withPerformance Trials to investigate a particular or unusual aspect of a given ship.Performance and Special Trials planning, agenda preparation, trials procedures,instrumentation calibration and installation, trial sites, data collection, andanalysis and reporting are presented. Examples of the various types of definitivemaneuvers used to evaluate ship performance are given. Finally, advances ininstlirmentation and data collection techniques which have occurred as a result ofportable, small, high speed computers are presenLed. . ..-.. ..
20 DISTRIBUTION/AVAILABILITY OF ABSTRACT 21 ABSTRACT SECURITY CLASSIFICATION
0 UNCLASSIFIED/UNLIMITED QR SAME AS RPT 0 DTIC USERS Unclassified
22a NAME OF RESPONSIBLE INDIVIDUAL 22b. TELFPHONE (Include Area Code) 22c OFFICE SYMBOL
Richard J. Stenson 1 (301) 227-1870 Code 1523DD Form 1473, JUN 86 Previous editions are obsolete. SECURITY CLASSIFICATION OF THIS PAGE
S/N 0102-LF-014-6603 UNCLASSIFIED

U CONTENTS
3 Page
ABSTRACT .....................................................................
ADMINISTRATIVE INFORMATION .. ........................................... 1
INTRODUCTIONA.. ......................................................... 1
MODEL TESTING ............................................................... 2
F SHIP ACCEPTANCE BY THE U.S. NAVY......................................... 3
BUILDER' S TRIAlL ........................................ 3
ACCEPTANCE TRIAL ......................................................... 4
SFINL CONTRACT TRIAL................................................ 8
PERFORMANCE AND SPECIAL TRIAS............................................ 9
HTRIAL AGENDA DEVELOPMENT........ . ................................. 7
TRIAL SITE SELECTION ........................................... 7
G Acoustic Ranges.................................................... 8
I Radar Trackin Ranges .............................. 9
SHIP CHECK AND CKE TRIAL CONFERENCE ................................. 10
3SHIP PREPARATION................. . 10
TRIAL CONITIONS ..................................... ............ 12I TRIAL TYPES AND PROCEDURES......................................... 13
5 GENERAL................................................................ 13
TANDARDIZATION TRIALS .............. .. ......... ........... 14
tTRAILED AND LOCKED SHAFT LALS......................19
U or
TACTICAL TRIALS........................................................ 20 r
m ~ACCELERATION AND Cr'rT.T'PT'rON ' A. i"
Dstributjon/
I Avallabiity Codes "
D val ando-
1st

I
CONTENTS (Continued)
Page 3MANEUVERING TRIALS ..................................................... 23
Spiral Tests ..................................................... 23 3Horizontal Overshoot Tests .......................................... 25
Backing Tests ....................................................... 26
FUEL ECONOMY TRIALS .................................................... 26
MEASUREMENT METHODS ....................................................... 27
GENERAL ................................................................. 27 3CALIBRATION PROCEDURES ................................................. 27
SHIP POSITION AND SPEED ................................................ 28
Portable Tracking Equipment ........................................ 28 3Hatteras East Coast Tracking Offshore Range (HECTOR) ............. 31
SHIPBOARD TRANSDUCERS ..................................................... 32
SHAFT TORQUE AND SPEED .............................................. 32 gPROPELLER THRUST ....................................................... 34
MACHINERY CHARACTERISTICS ..................................................... 35
CONTROL SETTING AND APPENDAGE POSITIONS ............................... 35
PROPELLER PITCH ...................................................... 36 3CONDITIONING EQUIPMENT ................................................. 37
DATA PROCESSING AND CONTROL ............................................... 38
DATA ACQUISITION SYSTEM ................................................. 38
.... "" EQUIPMENT ................................................... 41
D~A z.UCT:ON EQUIPMENT ............................................ 4Z
Iiv 3
• • mlII tU

U CONTENTS (Continued)
P age
POST-TRIAL DATA AAYI........................4
3STAND)ARD)IZATION TRIALS ............................................... 43
3TRAILED AND LOCKED SHAFT TRIALS ....................................... 44TACTICAL. TRIALS ...................................................... 44
ifACCELERATION AND DECELERATION TRIALS .................................. 46
MANEUVERING TRAS................... ......... 41
ISpiral Tests ...................................................... 473Horizontal Overshoot Tests ......................................... 47
Backing Tests ....................................... o...... o.......48
3FTJEL ECONOMY TRIALS ...... o.... ............................. o.....48MODEL POWERING CORRELATION..............................................48
ISUMMARY AND CONCLUSIONS ... .......... -......... e.... o.......... 49
FIGURES
31. Typical acoustic range layout ............................................ 51
2. Location of Hatteras East Coast Tracking Offshore Range.............52
13. Tactical turn, uncorrected ..................... o..o.......... 53
3 ~4. Typical Motorola tracking system setup.....................................54
5. Tracking system geometry ..................... ......... 55
6. Acurex torsiometer installation on propeller shaft...............56
7. Instrumented thrust shoe,........ ................. ......... 57
8. InstrumenLat4 'nblock diagram ......................... o...........58
39. Standardization Trial data ............................. o............59U V

FIGURES (Continued)
Page3
10. Tactical turn, drift corrected ...................................... 60
!I. Tactical trial 4ata ................................................ 61
12. Change of heading curves ........................................... 62
13. Typical deceleration maneuvers using full power astern .............. 63
14. Spiral maneuver -stable ship ....................................... 64
15. Spiral maneuver - unstable ship ..................................... 65
16. Horizontal overshoot ............................................... 663
TABLES3
1. Tracking range locations ............................................ 67
2. Typical measurement accuracies ....................................... 68
viI
I
1 ABSTRACT
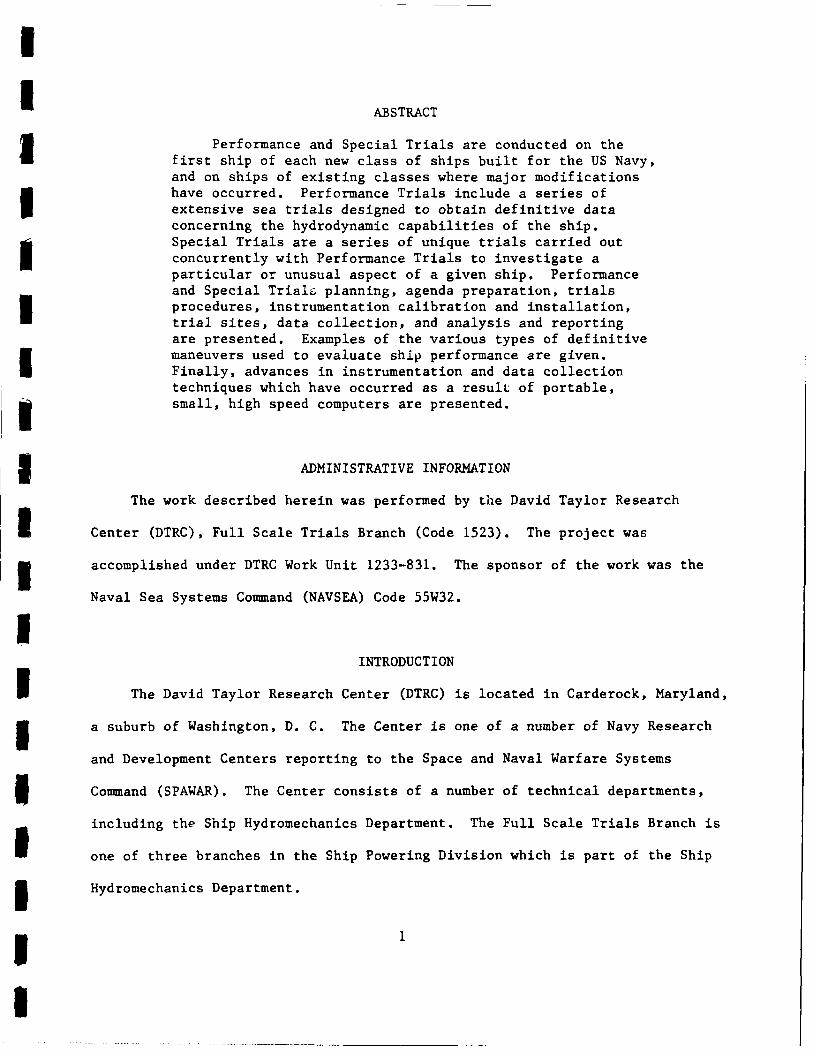
Performance and Special Trials are conducted on thefirst ship of each new class of ships built for the US Navy,and on ships of existing classes where major modificationshave occurred. Performance Trials include a series of
extensive sea trials designed to obtain definitive dataconcerning the hydrodynamic capabilities of the ship.Special Trials are a series of unique trials carried outconcurrently with Performance Trials to investigate aparticular or unusual aspect of a given ship. Performanceand Special Trialz planning, agenda preparation, trialsprocedures, instrumentation calibration and installation,trial sites, data collection, and analysis and reportingare presented. Examples of the various types of definitivemaneuvers used to evaluate ship performance are given.Finally, advances in instrumentation and data collectiontechniques which have occurred as a result of portable,3 small, high speed computers are presented.
3 ADMINISTRATIVE INFORMATION
The work described herein was performed by the David Taylor Research
3 Center (DTRC), Full Scale Trials Branch (Code 1523). The project was
3 accomplished under DTRC Work Unit 1233-831. The sponsor of the work was the
Naval Sea Systems Command (NAVSEA) Code 55W32.
IINTRODUCTION
I The David Taylor Research Center (DTRC) is located in Carderock, Maryland,
3 a suburb of Washington, D. C. The Center is one of a number of Navy Research
and Development Centers reporting to the Space and Naval Warfare Systems
-- Command (SPAWAR). The Center consists of a number of technical departments,
including the Ship Hydromechanics Department. The Full Scale Trials Branch is
Ione of three branches in the Ship Powering Division which is part of the ShipHydromechanics Department.
11
U
I
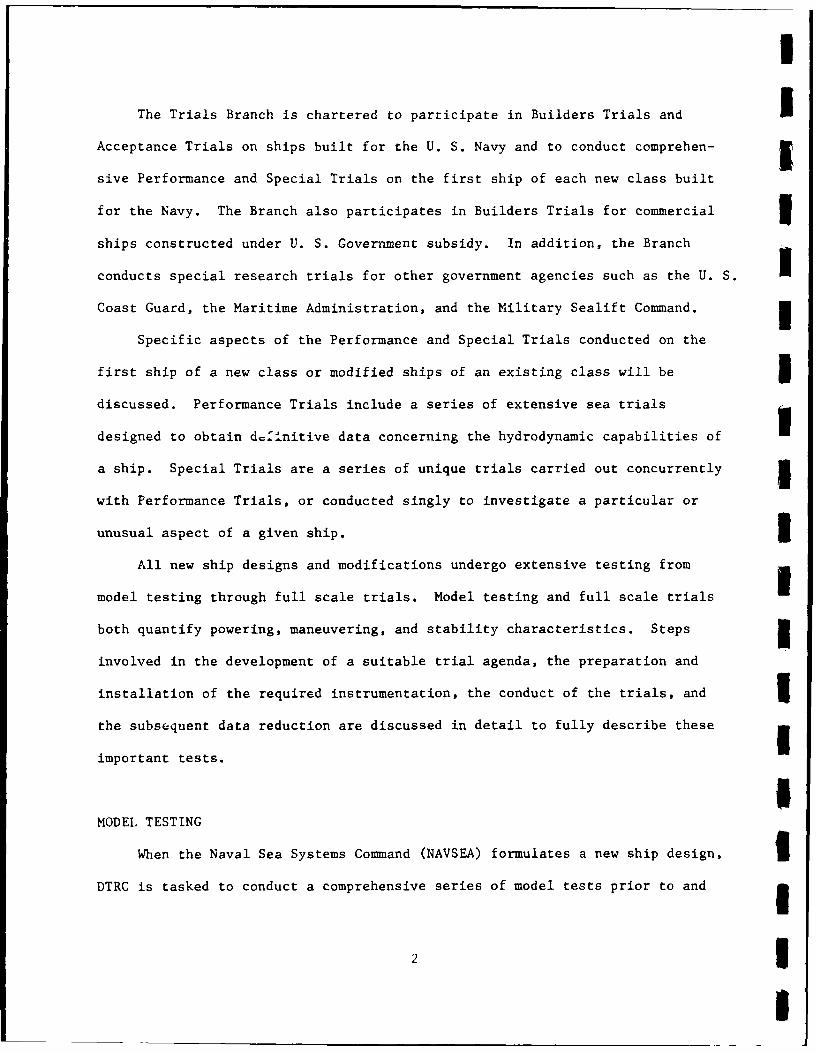
The Trials Branch is chartered to participate in Builders Trials and IAcceptance Trials on ships built for the U. S. Navy and to conduct comprehen-
sive Performance and Special Trials on the first ship of each new class built
for the Navy. The Branch also participates in Builders Trials for commercial I
ships constructed under U. S. Government subsidy. In addition, the Branch
conducts special research trials for other government agencies such as the U. S.
Coast Guard, the Maritime Administration, and the Military Sealift Command.
Specific aspects of the Performance and Special Trials conducted on the
first ship of a new class or modified ships of an existing class will be 3discussed. Performance Trials include a series of extensive sea trials
designed to obtain d-finitive data concerning the hydrodynamic capabilities of
a ship. Special Trials are a series of unique trials carried out concurrently iwith Performance Trials, or conducted singly to investigate a particular or
unusual aspect of a given ship. IAll new ship designs and modifications undergo extensive testing from
model testing through full scale trials. Model testing and full scale trials
both quantify powering, maneuvering, and stability characteristics. Steps
involved in the development of a suitable trial agenda, the preparation and
installation of the required instrumentation, the conduct of the trials, and
the subsequent data reduction are discussed in detail to fully describe these
important tests.
IMODEL TESTING
When the Naval Sea Systems Command (NAVSEA) formulates a new ship design, 3DTRC is tasked to conduct a comprehensive series of model tests prior to and
2
I
I during the actual construction of the ship. Model tests offer a cost effective
method of predicting full scale ship performance. Actual model test data
coupled with experimental correlation factors predict full scale characteris-
3 tics. Correlation factors are developed through comparison of past full scale
and model test results.
Model tests include but are not limited to: resistance, self propulsion,
turning, maneuvering, propeller open water tests, propeller cavitation tests,
wake surveys, hull flow visualization, bilge keel traces, and seakeeping tests.
3 Therefore, a tremendous amount of data predicting ship performance is available
before the new or modified ship's first sea voyage. These data are then
utilized to develop a trial agenda suitable for extensive full scale trials.
ISHIP ACCEPTANCE BY THE U.S. NAVY
I BUILDERS TRIAL
Any new ship must be found fully functional and safe for sea duty prior to
determining the detailed full scale performance capabilities. Functional
5 capability certification involves close liaison between the U. S. Navy and the
private sector because all new Naval ship construction is currently
I accomplished in private shipyards. U.S. Government shipyards are currently
3 engaged only in the necessary overhaul, repair, and maintenance of naval ships.
The resident supervisor of shipbuilding (SUPSHIP) represents the Navy and
5 monitors the construction of each ship at each of the major private shipyards.
Each SUPSHIP office oversees the contractual agreements between the private
yards and the Navy. The SUPSHIP office also provides the necessary liaison
I
I
I
between the Navy and the private yard for sea trials conducted prior to I
delivery of the ship to the Navy. IEach ship must successfully complete a Builders Trial, an Acceptance
Trial, and a Final Contract Trial in order to be accepted by the Navy. The 3ship is operated by and is under the control of the shipyard personnel onboard
during the Builders Trial. However, government representatives and government Ifurnished equipment (GFE) are an important part of the Builders Trial. 3
An example of GFE utilized during these trials is the instrumentation
provided by DTRC to determine the ship's capability to develop design full
power. The necessary equipment, such as torsionmeters, thrustmeters, shaft
r/min counters, and data collection devices are installed and operated under
the supervision of DTRC representatives. Full power tests, fuel economy tests, 5turning tests, backing tests, acceleration and deceleration tests, and testing
of all ship components and subsystems are accomplished during the Builders 1Trial. Deficiencies are identified and corrected and an Acctptance Trial is
scheduled.
IACCEPTANCE TRIAL
The Acceptance Trial is conducted approximately one month after the IBuilders Trial. These trials are conducted by the U. S. Navy Inspection and gSurvey (INSURV) Board. The Board consists of a team of Navy personnel
generally under the direction of a Navy Captain or Admiral. The INSURV Board 3determines if the shipyard has meL all of its contractual requirements and that
the ship is safe and meets all design specifications. i
I
I
I
I Once again, the ship is subjected to a series of tests to demonstrate the
ship's acceptability to the Navy. Problem areas are identified and presented
to the shipyard. Only after the deficiencies have been corrected is the ship
3 accepted by the Navy for delivery.
FINAL CONTRACT TRIAL
3 The Final Contract Trial consists of another series of tests to
demonstrate that the ship fulfills all design requirements and meets design
I specifications. It occurs after the ship has been commissioned, fully
i equipped, and armed. Deficiencies noted during this trial are submitted to the
cognizant SUPSHIP office and to the Naval Sea Systems Command (NAVSEA) to
3 determine whether the Navy or the contractor is liable for the necessary
repairs. A financial agreement is subsequently reached between the Navy and
I t0 contractor regarding deductions or additions to the stipulated contract
* price.
Data obtained during the Builders, Acceptance, and Final Contract Trials
3 are adequate to determine if the ship is 3uitable for acceptance by the Navy.
However, these data are not adequate to develop suitable ope-ational
I information required by the fleet. Consequently, more extensive trials
3 referred to as "Performance and Special Trials" must be performed on at least
one ship of the class.IPERFORMANCE AND SPECIAL TRIALS
Performance and Special Trials are normally conducted on the lead ship of
3 each new class as well as modified existing ships. These trials are designed
I
to test and quantify the operational characteristics of the hull and the Iperformance of the propulsion and control systems of the ship. The Performance Iand Special Trials primarily include the following types of trials:
o Standardization 3o Trailed and Locked Shaft
o Tactical
o Acceleration and Deceleration 3o Maneuvering
o Fuel Economy IIn addition, these trials sometimes include:
o Underway Vibration
o Seakeeping Io Miscellaneous Special Tests
Underway Vibration Trials and Seakeeping Trials are conducted by other 3branches at DTRC. Fuel Economy Trials are conducted by the Naval Ship Systems
Engineering Station (NAVSSES) Philadelphia, in conjunction with the Full Scale
Trials Branch.
NAVSEA issues a Trial Agenda Letter based on the information generated by
the model tests and the particular design features of the ship. This letter is 3sent to DTRC, the ship, and the shipyard involved. It constitutes the
authority to conduct the trials and generally precedes the actual trial date by
approximately one year. The letter provides general guidance which indicates 3the types of trials to be conducted, the desired measurements, and the nominal
conditions such as speed, displacement, and trim. It also defines the I
6 I
I
i operating limits for the propulsion machinery for various types of maneuvers.
5 This letter, therefore, forms the basis for the development of the Trial Agenda.
3 TRIAL AGENDA DEVELOPMENT
The Trial Agenda is a single document which dictates the conduct of the
trials. It is developed within the Full Scale Trials Branch by the Trials
* Director who is assigned the overall responsibility for administrating the
trials. The agenda follows the general guidelines contained in the NAVSEA
5 Trial Agenda Letter and provides a detailed run by run schedule of events for
* each phase of trials.
The agenda specifies the different test teams involved in the overall
5 trials and provides estimates of the time required for each evolution.
Furthermore, the agenda specifies: the procedures for conducting each type of
1 maneuver, measurements to be obtained, acceptable trial conditions, the number
of personnel required and their respective duties, and any other prerequisites
or requirements for conducting each run.
A pzeliminary agenda is then submitted to the cognizant NAVSEA technical
codes and the Prospective Commanding Officer (PCO) of the ship, as well as the
I PCO's squadron and fleet commanders for comment and review. After all
5 necessary changes have been incorporated into the agenda, it is submitted to
NAVSEA for final approval and dissemination to all concerned activities.
ITRIAL SITE SELECTION
The selection of a suitable trial site is dependent upon the trial agenda
3 requirements as well as the location of the shipyard building the ship.
37
I
U
Perf'rrqance and Special Trials on surface ships can be conducted on an acoustic Ior a radar tracking range. Suitable trial sites are recommended by DTRC and 5the final selection is made by the Naval Sea Systems Command. The locations
and characteristics of available ranges are discussed below. 3
Acoustic Ranges I
A number of sophisticated underwater acoustic tracking ranges are operated 3by the U. S. Navy. All of these ranges have been utilized by the Trials Branch
and are able to accurately track the position of the ship during trials and
thus determine its speed and tactical characteristics.
The two East Coast ranges are the Atlantic Underwater Test and Evaluation
Center (AUTEC) which is located on Andros Island in the Bahamas and the 5Atlantic Fleet Weapons Training Facility (AFWTF) established on St. Croix in
the U. S. Virgin Islands. 3West Coast ranges include the Santa Cruz Acoustic Range Facility (SCARF)
on Santa Cruz Island off the coast of Long Beach, California; the Naval Torpedo
Station Three Dimensional Range situated in Dabob Bay, Keyport, Washington; and 5the Nanoose Three Dimensional Range located on Vancouver Island, British
Columbia. Ships operating out of Pearl Harbor, Hawaii, utilize the Pacific 3Missile Range Facility at Barking Sands on the island of Kauai.
The geometry of a typical acoustic range would be similar to AFWTF as
shown in Fig. 1. The figure depicts 13 hydrophones anchored on the ocean
bottom and connected by underwater cable to the shore installation. The ship
is equipped with a specially installed tracking range "pinger" which emits an Ielectronic signal at a variable rate from I to 4 s, depending on which pinger g
8
is selected. The hydrophones receive these electrical pulses thereby enabling
5 the shore installation to accurately determine the position of the ship through
triangulation. The ship's position can then be tracked as a function of time
* which allows calculation of ship speed relative to the ocean bottom.
Radar TrackingRanges
3 DTRC established the Hatteras East Coast Tracking Offshore Range (HECTOR)
in August 1982. It is approximately 30 nmi (56 km) off the coast of Oregon
I Inlet, North Carolina. HECTOR is operated and maintained by the Full Scale
Trials Branch and provides easy access for ships operating out of Norfolk,
Virginia and Charleston, South Carolina. The center of the range is 90 nmi
5 (167 km) southeast of Norfolk. This range's location is shown in Fig. 2.
In the event tbit logistics, scheduling, or transit times preclude the use
U of the acoustic ranges or HECTOR, portable electronic tracking instrumentation
5 is available within the Trials Branch and can usually be installed in close
proximity to the ship construction site. Precise coordinates of the necessary
fixed reference sites can be determined by a Global Positioning System (GPS),
which is a satellite tracking system maintained by the Trials Branch. The
I following factors must be considered when establishing a temporary range:
5 range geometry, water depth, water currents, marine traffic, and potential
sources of electromagnetic interference which could affect the tracking system.
3 The portable tracking equipment has been utilized with great success and will
be discussed in detail in a later section. Ranges which have been used for
- surface ship trials are listed in Table 1.
I
I
SHIP CHECK AND PRE-TRIAL CONFERENCE IFollowing the agenda completion and trial site selection a ship check is 5
made and a pre-trial conference is attended by the ship's officers, representa-
tives for NAVSEA and the Shipyard, as well as DTRC and range personnel. The 3ship's schedule is established during this meeting and trial objectives and
procedures are discussed. Instrumentation requirements for the trials are Idescribed and a ship compartment is designated for temporary location of the 3data acquisition system. Special ship conditions required during the trials,
such as displacement and trim, are discussed to provide ample time for ship 3personnel to determine the best method of achieving the desired conditions. U
Ship personnel are often skeptical about the ship's capability to achieve
some required conditions, as well as the trials process as a whole. Ship 3personnel's apprehension usually peaks during the equipment installation phase
as they observe stuffing tubes being drilled, cables being routed throughout 3the ship, rings being clamped around the propeller shafts, and racks of
instrumentation arriving onboard. In general, these misgivings soon disappear
once the ship realizes that the trial team is experienced and is genuinely 3concerned about the overall impact on the ship. The objective of the trial
team is always to obtain the best data possible with minimum impact on the ship 3and its schedule. 3
SHIP PREPARATION
Performance and Special Trials are normally scheduled within 30 days of
undocking. This requirement is necessary to minimize the adverse effects of Ihull and propulsor fouling and thus provide a more "standard" condition for
103 |I

I
each ship tested. Extensive full scale trial data have conclusively shown that
3 hull fouling can, under certain conditions, substantially affect the powering
characteristics of a ship in a few months time.
3 Features such as bilge keels, stabilizer fins, bow thrusters, or other
appendages are noted during the drydock period. A roughness survey is also
conducted to quantify the hull and propeller condition. A British Ship
3 Research Association (BSRA) roughness gauge is used for this survey. The
texture of selected portions of the hull and appendages are measured and the
I data are statistically analyzed to obtain a value representative of the averageu roughness of the hull and appendages. The ship's propeller is inspected for
damage and the average propeller roughness is determined.
If a ship is equipped with a controllable pitch (CP) propeller, a
calibration curve of onboard propeller pitch setting versus actual propeller
I pitch is obtained. This calibration is best performed with the ship in drydock
3 to facilitate the necessary measurements on the propeller blades. The ship's
schedule often does not permit a drydock calibration and a pierside calibration
* must then be performed with the assistance of divers.
A specially designed device is attached to the propeller hub to provide a
I reference surface for measurements to the leading and trailing edges of each
5 propeller blade. At selected pitch settings (zero, design ahead, full ahead,
and full astern), actual blade position measurements are obtained concurrently
3 with measurements of the ship's pitch indicator and the oil temperature in the
pitch control system. Ideally, these data are obtained for three different oil
temperatures to determine the effects of oil temperature on propeller pitch
3 settings.
1 11UmI
I
Following the pitch calibration, the visibility and the accuracy of the Iship's draft marks are checked and any other relevant information is recorded 3in order to fully document the ships's condition at the time of the trials.
UTRIAL CONDITIONS
Environmental conditions have significant influence on the data obtained I
during sea trials. High winds or unfavorable water currents can result in the 3use of excessive rudder to maintain course in preparation for and during a
trial run. Such rudder excursions result in large torque fluctuations and an 3unsteady ship speed. Additionally, high winds or sea states have a direct, but
unquantifiable, impact on propulsion power levels required to maintain given
ship speeds. State 3 seas and/or a wind speed of 20 kn is generally considered 3the maximum environmental conditions allowable for Performance and Special
Trials. ICertain tests included in the Performance and Special Trials, e.g., spiral
and zig-zag maneuvers, are more susceptible to the effects of wind and sea
state. These tests should be conducted when the weather is considerably better 3than the upper limit environmental conditions stated above. The trial schedule
should be amended to utilize the first calm day to perform any environmentally 3sensitive tests. Unfortunately, limited trial time occasionally results in
compromises and tests are sometimes conducted during marginal weather
conditions. 3
II
II
I
I TRIAL TYPES AND PROCEDURES
5 GENERAL
Proper approach conditions must be established and maintained for each run
3 to help ensure reliable Performance Trials data. Unsteady approach conditions
as indicated by fluctuations in shaft speed, rudder angle, shaft torque,
propeller pitch, or ship speed, can dramatically affect test results and
3 usually produce erratic data. Close liaison between the ship operators and the
Trials Director is necessary to maintain the required propulsion conditions for
I one minute prior to the start or EXECUTE of each run. Alert and informed
3 helmsmen and throttlemen are crucial to the successful implementation of the
Test Agenda.
3 The Officer of the Deck should inform the Trials Director when the ship is
on course and at the proper shaft speed and pitch (for CP propellers). The
I Trials Director and/or the instrumentation operators then independently confirm
5 these conditions by monitoring torque and speed on remote monitors. The
requested shaft speed will be attained before the ship's momentum and speed can
£be stabilized, therefore, shaft torque and the ship's electromagnetic log speedmeasurements provide the best indications of a steady approach. After all
Ipertinent parameters are steady, a COMEX command is given which results in one-- minute of steady data collection prior to the initiation of the scheduled trial
maneuver or EXECUTE. A FINEX command is given upon the completion of the
3 scheduled maneuver.
This procedure is followed for all runs including runs which begin from
the dead-in-the-water (DIW) condition. To avoid redundancy, each trial type
5 discussed below will be described from the EXECUTE point and the approach
3 13
I
I
procedure will not be repeated. As a general rule, the Maneuvering Trials and Ithe Fuel Economy Trials are not conducted on a range because positional
information is not needed. However, on occasion, one or more of these trials
is conducted on a range. 3
STANDARDIZATION TRIALS
Standardization Trials are conducted in order to determine the steady- 3state speed and powering characteristics of the ship. Standardization Trials
on conventionally powered surface ships are conducted at two displacements, 3namely design full load and a displacement at least 10% lighter. Normally, the
ship should be as close to zero trim as practicable during both displacements
and, if possible, the trim for each of the displacements should be the same. 3Data at two displacements provide an indication of how changes in displacement
affect ship speed and powering. The two sets of data allow interpolation of Ispeed and powering characteristics over a range of displacements which
facilitates direct comparison with model data.
Draft readings are obtained immediately prior to the ship getting underway 5for each trial phase. Readings are obtained at the bow, amidship, and at the
stern on both the port and starboard sides. A seawater sample should also be 3obtained at this time to determine water temperature and specific gravity which
are needed for the subsequent displacement calculations. Seawater temperature
and specific gravity are also measured at the trials location to determine if 3any significant differences with the pierside readings are present. Ship
displacement and trim are important parts of the Performance and Special Trials 3and should be closely and carefully monitored throughout the trial period. I
14
I
I Daily ship operations generally allow draft readings to be taken pierside
3 in the morning of each day during the trial period. When the ship remains at
sea for several days, draft readings are obtained via a small boat, if
3 possible. This operation is at the discretion of the Commanding Officer and
should only be attempted when the sea state is favorable. Attempting to obtain
this data in rough seas will result in erratic readings and potentially,
3 personal injury. The ship's displacement history should be monitored through
periodic tank soundings to determine any change in displacement attributable to
3 fucl uunsumption. Arrangements should be made with ship personnel to obtain
tank sounding data as needed.
Dynamic environmental conditions must be recorded throughout the trials to
3 facilitate both quantification and qualification of the data. Seawater samples
should be taken daily in the vicinity of the operating area to determine the
3 water's specific gravity and temperature. These values are necessary so that
* Standardization Trial data can be corrected to standard conditions for model
correlation. Relative wind speed and direction are monitored during the trial
* with a specially calibrated wind anemometer which is installed close to the bow
and high above the deck in order to measure uninterrupted air flow. Periodic
I observations of the sea state, air temperature, and general weather conditions
5 are also recorded. The quartermaster normally is supplied with a log book and
requested to record this data hourly.
3 Preparation for conducting a Standardization Trial on an acoustic range
begins with the communications link between the test ship and the shore
I installation which allows the onboard and land clocks to be synchronized,
3 thereby establishing a common time base for all data collected. A base course
*15
I
and a reciprocal course are established based on range geometry for the conduct 1of the runs. Eight or nine speed settings, referred to as "spots", are 5generally required to adequately define the standardization curve. A spot is
defined as the average of two or three runs in reciprocal directions at the Usame power level.
Standardization runs are usually conducted starting with the lowest
required speed. Ship speed is then increased incrementally until full power is
reached. Data collection begins after ship speed, shaft torque, and shaft
speed reach steady predetermined values. One minute of steady approach data 3arc collected and then three minutes of steady run data are recorded. Minimum
rudder movement, generally ±3 deg, is used to maintain heading during both the
approach and the actual run. Throttle settings (and pitch settings in the case 5of CP propellers) are preset and are not adjusted during the run. Throttle and
pitch settings remain fixed as a Williamson Turn is executed following the Ifirst pass to position the ship on the reciprocal course in the same general
area of the range.
The procedure for conducting the Williamson Turn is to execute and hold a 520 deg rudder movement until the ship's heading has changed 60 deg from the
base course. At this time, the rudder is shifted to 20 deg on the opposite Uside, and held until the ship's heading reaches the reciprocal of the base
course. Speed and torque conditions are allowed to stabilize and the ship
executes the second pass with shaft speed the same as in the first pass. 3Three runs are normally accomplished for each speed "spot". If the
current gradient is determined to be 0.2 kn or less and the magnitude of the 5current is less than 0.5 kn, two run spots are acceptable. The gradient is
16
U
I determined by comparing the speeds of runs in the same direction for steady and
3 equal levels of powering. The current gradient is a function of time,
therefore the elapsed time between comparative runs must be kept to a minimum.
3 Typically, a minimum of three runs are made for each "spot" at the initial
speed in the standardization series, at the mid-range speed, and at full power.
A simple average of the data is used to determine the speed and power
3 values for a two-pass spot. A mean of means method is used for three pass
spots. The values from the second pass are doubled and added to the values
3 from the first and third passes. This sum is then divided by four to determine
average values for the spot. The latter method assumes that changes in the
effective water current over the ground at the trial course are approximately
3 linear with time during the three consecutive passes. Each method converts the
ship's speed over the ground, as determined by the range, to speed through the
I water. It must be emphasized that steady approach speeds are important. This
requires that the length of the approach to higher power runs, particularly the
full power spot, be increased to ensure that the ship reaches a steady powering
* condition prior to the start of each run.
Primary onboard measurements obtained during each run consist of:
I propeller shaft torque, speed, thrust, first stage shell pressure (steam
3 turbine plant), propeller pitch for CP propellers, relative wind speed and
direction, ship's heading, and rudder position. In addition, the ship's
3 electromagnetic (EM) speed log can be calibrated during these trials. This
calibration allows the use of the EM log as a speed reference for trial
3- maneuvers conducted in free route. The ship's XY coordinates are determined
3. onshore from the hydrophone outputs on acoustic ranges or onboard ship by the
17
radar transponders and shipboard receiver/transmitter units on radar tracking Iranges. The XY positions are recorded at approximately 1 s intervals which 3allows the ship's position to be determined as a function of time. This
positional data provide the means to calculate the ship's speed to accuracies 5within a tenth of a knot.
It is important to balance the propeller shaft speed for multiple-shaft Uships to obtain equal power on each shaft. In the case of ships with four 5propellers, such as aircraft carriers, the inner shafts will generally reach
their maximum torque level prior to the outer shafts. The full power spot may 3thus be conducted with less shaft speed and higher torque on the inner shafts
than on the outer shafts. This arrangement is required in order to balance the
power output of each shaft. 3Trials on twin shaft ships equipped with CF systems require that both
shaft speed and propeller pitch be equal to develop the same power on the two 3shafts. Equal shaft power can be obtained by balancing shaft speeds and then
changing propeller pitch until the two torques are matched. This procedure is
necessary when propeller pitch cannot be determined to a high degree of
accuracy.
Standardization Trials on ship's equipped with a CP system are normally 3conducted in both program control (PC) mode and in manual mode. PC mode
automatically selects predetermined combinations of propeller pitch and shaft
speed in response to the ship speed requested. This mode of operation is 3designed such that each propeller will operate at or near peak efficiency
throughout the ship's speed range. Standardization Trials in the PC mode are 3typically followed by a series of runs with the propellers over-pitched as well
18
U
as under-pitched. A family of speed/powering curves is thereby generated to
3define the full range of capabilities of a given propeller.The procedures for conducting these trials using portable tracking
I equipment are generally the same as on the acoustic tracking ranges. One
notable exception is that the positional data are collected with nnbop-d
equipment, which can "e located in the vicinity of the bridge, thus
3 facilitating the conduct of the trials by providing near-real time ship
position and speed information. The portable electronic tracking equipment is
I discussed in detail in a later section.
TRAILED AND LOCKED SHAFT TRIALS
3 Trailed and Locked Shaft Trials are conducted to determined the speed/
powering characteristics of a multiple-shaft ship operating while trailing or
I locking one or more shafts. These trials are generally part of the
3 Standardization Trials and are accomplished using the procedures described
above. Trailed shaft powering data are oesirable because ships are often able
5 to secure one or more engines, maintain the necessary speed of advance (SOA),
and realize an overall savings in fuel consumption. This is particularly true
I in the case of ships equipped with gas turbine engines. Here, the driving
3 engine(s) can be operated at a higher speed than that speed required if all
engines are operating. This higher turbine speLd is closer ti the design or
3 optimal efficiency condition, thereby reducing specific fuel consumption.
Trailed or locked shaft data are also useful in the event of a ship
Ucasualty. Such data will indicate the maximum speed allowed on the driving
S19I
U
shaft or shafts, based on maximum shaft torque restrictions, and will quantify
the maximum ship speed attainable in that condition.
TACTICAL TRIALS 3Tactical Trials are conducted to determine the turning characteristics of
the ship. These trials require tracking of the ship and are conducted on an
acoustic range, a radar range such as HECTOR, or with the pcrtable electronic 5tracking equipment. Tactical Trials are usually conducted at design displace-
ment and at three different approach speeds. Turns are conducted at a minimum 3of three rudder angles, turning both left and right at each rudder angle and
approach condition. Multiple-shaft ships often exhibit similar turning
characteristics for both right and left turns, in which case only one turn in
the opposite direction is needed at eacn speed for verification.
The first step in conducting a tactical turn is the communications link 3and subsequent synchronization of clocks between the shore facility and the
ship. After the ship is in the proper position on the range, one minute of
steady approach data is recorded before the EXECUTE command is given. Upon 3this command, the helmsmar w'vy the rudder smartly to the predetermined angle.
If the intended rudder angle is slightly exceeded, or not quite reached, no I
adjustments are made and the rudder is held fixed for the duration of the run.
Additionally, no adjustments are made to shaft speed, or to the propeller pitch
of CP propellers. A FINEX command is given which effectively ends the run 3after a heading change of 540 deg (one and one-half turns). The ship's
position is tracked throughout the maneuver which provides a plot similar to Ithat shown in Fig. 3.
203
I
Tactical Trials on an acoustic range require that predetermined change of
3 heading marks be verbally passed to the shore installation in order to
correlate ship heading and position data. This correlation is not necessary at
* HECTOR or when using the portable tracking system because all of the data are
stored on one medium onboard the ship.
Onboard measurements recorded during the tactical turns consist of: rudder
3 angle, ship's heading, angle of heel, shaft speed, propeller pitch for CP
propellers, shaft torque, shaft thrust, and relative wind velocity. The
I positional data obtained by the tracking range enable the two dimensional
turning characteristics of the ship to be determined. The calculations used to
quantify these characteristics are discussed in the analysis section.
IACCELERATION AND DECELERATION TRIALS
I Acceleration and Deceleration Trials are also conducted on a tracking
3 range. The purpose of these trials is to determine the speed and reach versus
time profiles (time histories) of the ship for various starting and stopping
3 conditions. All acceleration and deceleration runs are interspersed with
tactical circle runs. Drift values determined from the tactical circle
I maneuvers can then be interpolated over the time of day to mathematically
i correct the ship's movement to account for the effects of drift due to wind and
water current.
Acceleration Trials are generally conducted from zero speed (dead-in-the-
water or DIW) to various steady ahead ship speeds using several engine orders
including: Ahead 1/3, Ahead 2/3, Ahead Standard, Ahead Full, and Ahead Flank.
21
I
I
In addition, acceleration runs may be conducted from Ahead 1/3 to Ahead Flank Iand from backing conditions such as Back 1/3 to Ahead Flank.
Deceleration Trials are usually performed from Ahead Flank to DIW using
various backing engine orders to bring the ship to a stop, such as: All Stop, 3Back 1/3, Back 2/3, Back Full, and Back Emergency. Deceleration Trials might
also be conducted from approach speeds other than Ahead Flank
Acceleration and deceleration runs begin with the recording of 1 min of
steady approach data. Upon EXECUTE, the proper engine order is requested via
the engine order telegraph. The propulsion turbine throttles are opened or Uclosed as required to meet the engine order at the maximum rate allowable
without exceeding design operating limits. For CP propeller installations, the
propeller pitch and shaft speed are changed as required by the engine order, as
rapidly as possible. The ship's position is recorded at approximately 1 s
intervals throughout the run until the ship has reached a steady terminal Ispeed. The ship's rudder is used as necessary to maintain heading. 3
In addition to positional information, onboard measurements taken include:
shaft speed, torque and thrust, propulsion turbine first stage shell and astern 3bowl pressures as well as throttle positions for steam turbine plants,
propeller pitch for CP propellers, rudder angle, and ship's heading. IAdditional deceleration runs are sometimes conducted using the rudder to 3
aid in stopping the ship. Runs are conducted with the rudder moved to the full
left or right position on execute and held for the duration of the run. Runs 3are also conducted while periodically shifting the rudder from right to left at
scheduled time intervals during the run. These maneuvers generally result in Iless reach and increased deviation from the base course as compared to a 3
221
I
I similar engine order using conventional procedures (use of rudder solely to
5 maintain heading).
Acceleration and Deceleration Trials can also be conducted using the
3 portable tracking equipment and the general procedures are the same. A more
detailed discussion of the data collection techniques for these trials 4sing
the portable tracking equipment will be presented in a later section.
IMANEUVERING TRIALS
I Maneuvering Trials are conducted in free route at sea, away from major
shipping lanes. These trials generally include spiral tests, horizontal
overzhoot tests, and backing tests. The procedures used for each of these
I tests are discussed below.
I Spiral Tests
I Spiral tests are designed to determine the inherent dynamic stability of
the ship and are normally conducted at approach speeds of Ahead 1/3 and Ahead
3 2/3. These tests require a large operating area and generally take from 2 to
3 hr to complete at each condition. Spiral tests should be conducted with sea
I states from 0 to 1 with minimum wind conditions because the ship's response
during these maneuvers is particularly sensitive to external forces.
The spiral test begins with the collection of 1 min of steady approach
data. No adjustments are made to the shaft speed or propeller pitch settings
after data collection begins until the FINEX of the run. At EXECUTE, the
rudder is moved to 15 deg right rudder. When the ship's rate of change of
heading becomes constant, the rudder is eased to the second setting,
23
U
10 deg right, and again held until the rate of change of heading becomes Iconstant. This procedure is repeated at successive rudder angles of 7.5 deg Iright, 5 deg right, 2 deg right, 0 deg, 2 deg left, 5 deg left, 7.5 deg left,
10 deg left, 15 deg left, 10 deg left, 7.5 deg left, 5 deg left, 2 deg left, 30 deg, 2 deg right, 5 deg right, 7.5 deg right, 10 deg right, and 15 deg right.
The data acquisition system continuously records data at a slow rate throughout
the maneuver. 3The ship's directional stability characteristics are being investigated
during the spiral test, therefore, it is important to meet the next scheduled Irudder angle coming from the proper direction. For example, when moving from
15 deg right to 10 deg right, if the rudder inadvertently goes to 9 deg right,
it must be held there and not corrected to 10 deg right. It is also important 3to remain at each rudder setting long enough to ensure that the rate of change
of heading has become constant. Reaching this condition is especially time Iconsuming at the low rudder angles. Once the steady turning condition is 5reached, approximately 2 min of data at each setting will suffice.
It is also important that the spiral test be conducted as one continuous 3maneuver, from 15 deg right to 15 deg left and back to 15 deg right, without
breaking off between rudder angle settings. Spiral tests must therefore be Iconducted in an area free of marine traffic and away from land masses. If a
spiral test is aborted at a particular rudder angle, it is po.ssible to resume
the test at the preceding rudder angle assuming the shaft speed and/or 3propeller pitch have not been changed, which would thereby change the approach
conditions. I
224!
I
I Measurements recorded during the Spiral tests include: rudder angle,
3 ship's heading, roll angle, shaft speed, propeller pitch (CP propellers), EM
log speed, relative wind speed and direction, as well as sea state observations.IHorizontal Overshoot Tests
Horizontal overshoot tests are conducted to determine the response of the
5 ship to a checking, or opposite direction, rudder angle. The tests are
generally conducted at two approach speeds, Ahead 1/3 and Ahead 2/3, and with
3 both left and right rudder angles of 10 and 20 deg for each speed.
3The approach course for the horizontal overshoot tests should align theship's heading directly with or directly into the wind to avoid a bias in the
3 data due to ambient wind conditions. If the existing wind is from 050 deg
true, for example, the appropriate approach heading would be either 050 or 230
I deg true. This procedure will insure that the wind's influence on the ship's
turning characteristics will be similar, whether the ship is turning left or
right.
3 The EXECUTE mark is given after 1 min of steady approach data has been
recorded and the rudder is then moved to its predetermined setting such as
1 10 deg right. When the ship's heading has changed 10 deg from the base course,
3 the rudder is shifted to the same number of degrees in the opposite direction.
The rudder is held at this position while the ship's direction of turn reverses,
5 and the ship's heading passes through the base course and reaches 10 deg on the
opposite side of the base course. The rudder is then shifted back to its
U EXECUTE position and this procedure is repeated through two and one-half
3 cycles.
25
U
Measurements obtained during these maneuvers include: rudder angle, ship's 3heading, approach speed, shaft speed, and roll angle. 3
Backing Tests 3Backing tests are generally conducted at two different approach speeds,
Back 2/3 and Back 1/3. The tests are conducted in calm water and if successful,
are repeated in moderate sea state. The purpose of the backing tests is to
determine whether the ship is able to maintain its heading while backing. The
procedure used is to develop a steady, appropriate astern r/min and then to Iattempt to steer the ship while backing.
Ship speed during a backing test can only be obtained from time referenced
position data provided by tracking equipment because the ship's EM log does not
provide an output in the astern direction. Additional measurements recorded
during the backing tests include: engine order, shaft speed, propeller pitch Ifor CP plants, rudder angle, and heading.
FUEL ECONOMY TRIALS 3Fuel Economy Trials are conducted by NAVSSES, Philadelphia, with support
from DTRC. NAVSSES calibrates and installs fuel flowmeters and any instrumenta- Ition necessary to define the fuel consumption rate required for various
operating conditions. DTRC records torque and r/min data concurrent with the
fuel economy runs in order that fuel consumption rates can be correlated with 3shaft horsepower.
Fuel Economy Trials are normally conducted in free route due to the long Iduration of each run. The length of a given run is a function of the time 3
26
I
U required for propulsion plant parameters to stabilize and can vary from 15 min
3 to 1 hr. For example, a gas turbine plant will stabilize more quickly than a
steam turbine plant. It is advisable to run the Fuel Economy Trials after the
3 ship's EM log has been calibrated. This allows speed data to be obtained from
S the EM log during the free-route Fuel Economy Trials.
Results of the Fuel Economy Trials are generally reported under separate
3 cover by NAVSSES. However, on some occasions, the fuel economy data are
forwarded to DTRC for inclusion in the standardization report.I-- A MEASUREMENT METHODS
-- GENERAL
3= Advances in electronic technology during the past decade have significantly
improved the capabilities of the Full Scale Trials Branch to collect and
U analyze data which describes the powering and maneuvering performance of Naval
3 ships. These improvements have contributed to the realization of more accurate
measurements, more precisely controlled trials, and greater data outputs.
-- Specific data collection techniques used are discussed below.
CALIBRATION PROCEDURES
Each DTRC supplied transducer used during full scale trials undergoes a
minimum of two calibrations during each Standardization or Maneuvering Trials
process. The expected maximum or minimum values for each recorded parameter
are first determined. Each transducer and signal conditioning unit is then
calibrated for this range of values immediately prior to shipment to the
installation site. The instruments are again calibrated at the end of the
27
U
trial upon return to the Center. Every calibration is documented and retained
for future reference. A description of the major instruments used in full
scale trials is presented below and each is accompanied by a brief description
of the normal calibration procedures. The accuracy expected for each of these 3measurements is shown in Table 2.
SHIP POSITION AND SPEED 3Ship position is one of the more important measurements obtained during
Performance Trials. Such data are necessary to derive ship speed and to fully 3define the powering and maneuvering characteristics of the ship. An increasing
number of Performance Trials are conducted using portable tracking systems
maintained by DTRC or at HECTOR, therefore, these two methods are described in 3detail. IPortable Tracking Equipment
The Full Scale Trials Branch currently uses the Motorola Falcon system to
accurately track the movement of a surface ship during trials. The Falcon
operates on the pulse radar principal and requires a receiver/transmitter (R/T)
mounted high on the ship and a minimum of two reference stations (transponders) 3on shore.
The R/T emits an interrogation pulse comprised of a unique code for each
of the shore-based transponders at precise time intervals. The elapsed time 3between the transmitted interrogation and the reply from each transponder is
used to determine the ship's range to each reference station. The resulting Irange measurements and the known distance between the reference stations 3
28 3I

I
I constitute three known sides of a triangle which allows ship position to be
3 accurately determined through fundamental trigonometric relationships. A
typical Falcon installation is shown in Fig. 4.
* The standard version of the Falcon operates at line-of-sight ranges up to
20 nmi (37 km) with a probable range measurement accuracy of plus or minus 9 ft
(2.7 m). System portability permits trials to be conducted at most
geographical locations. Several considerations are required, however, to
optimally locate the reference stations and test site to insure that the
I accuracy potential of the system is achieved. Major considerations are:
1 1. Geometric relationship between the two reference stations
and the ship
3 2. Range of the positioning system
3. Line-of-sight
3 4. Antenna patterns
* 5. Multi-oath (range reflections)
6. R/T placement
7. Accessibility of reference station sites
8. Power sources at the reference sites.
Performance Trials are generally conducted with the ship between 2 and
10 nm (4 and 19 km) offshore. The baseline course length is nominally twice
the distance of the ship from shore. The optimum positional accuracy of the
system is obtained when the intersection angle of the two range distances is
90 deg. Therefore, trial maneuvers are ideally conducted at an offshore
distance such that a 90 deg intersection angle occurs at the midpoint of the
29
I
maneuvering area. Figure 5 depicts a radar tracking range with the minimum, I
optimum, and maximum intersection angles.
Placement of the R/T relative to the ship's communication, navigation, and
radar antennas is of particular concern. Electromagnetic transmissions from
the ship can affect the R/T, therefore, two precautions are normally taken to
avoid R/T damage or interference:
1. Locate the R/T as far as possible from high-power antennas
2. Request that non-essential radiation be secured during trials.
The R/T can be damaged even if the Falcon system is off, consequently, its Iposition relative to antennas with similar frequencies should be considered of
utmost importance. In particular, the R/T should not be located in close
proximity to the AN/SPS-67(V) surface search radar. This radar is replacing 3the AN/SPS-10 radar and operates on C-Band very close to the 5570 MHz frequency
of the tracking system. It is recognized that positioning the R/T can be Idifficult due to the location and number of permanent antennas. For example,
ships such as aircraft carriers have as many as 130 antennas installed topside.
Test ships are generally cooperative and will secure any radiation not 3necessary for safe operation of the ship. High intensity radiation from the
ship's antennas can render the R/T inoperative or result in random position Idata. Performance Trials provide an excellent opportunity for the ship to 3conduct drills such as General Quarters (GQ). For this reason, trial
interruptions due to radiation during GQ or other drills should be avoided by 3advance arrangements with appropriate ship personnel. In particular, it is
advisable to inform the proper ship personnel of the location of the R/T and to Iidentify any antennas which have interference potential. 3
30 1I
I
U In addition to meeting the criteria described above for the positioning
3 system, the test site must have adequate water depth to eliminate shallow water
effects which may induce vibration, speed loss, and overloading of the machinery
plant at higher speeds. The minimum water depth required is the larger of
criterion (a) or (b):
(a) d > 3.0 * [B * HI
(b) d > C * V2
where:
d = Depth of water (ft or m)
B = Ship's beam (ft or m)
H = Mean draft (ft or m)
3 C = Constant (0.3 for English units or 0.09144 for metric units)
V = Maximum ship speed (kn)I* Hatteras East Coast Tracking Offshore Range (HECTOR)
HECTOR provides an alternative site for speed/powering trials on surface
3- ships operating on the east coast of the U. S. in lieu of transitting to an
acoustic range in the Bahamas or the Caribbean. This site is approximately
4 hr from Norfolk and thus minimizes a ship's transit time to the trial site.
The center of the range is located at 350 52.5' latitude north and 74051 '
longitude west. The range site utilizes two of four offshore-towers which are
used by the Navy for pilot training. The unmanned towers are 17.5 nmi
(32.4 km) apart and at the edge of the continental shelf, consequently a trial
site can be established outside the 100 fathom (183 m) curve to avoid shallow
water effects.
31
I
The Falcon pulse-radar system is utilized at HECTOR. Transponders are Ipermanently mounted on each tower and are powered by a combination of batteries 3and solar panels. All positional data are recorded onboard and a real time
graphics display indicates ship position on the range to permit optimum system 3geometry to be maintained. Trials are typically conducted within a 2 by 4 nmi
(3.7 by 7.4 km) area with an approach heading of 018 deg true for northerly
runs and an approach heading of 198 deg true for southerly runs. Multi-path 3problems are eliminated by installing the R/T between 70 and 180 ft (21 and
55 m) above the water surface and conducting trials within the designated area.
Loran C equipment is generally installed on the test ship by Center
personnel prior to the trials at HECTOR. The Loran system is used to vector
the ship onto the trial site, because the pulse-radar system is limited to a 3range of 20 nmi (37 km). Loran data are recorded during the standardization
portion of Performance Trials to provide supplemental speed information. 3
SHIPBOARD TRANSDUCERS
SHAFT TORQUE AND SPEED 3Sensing and measuring physical changes at one location and transmitting
the results through air to another location by telemetry str the methodd used Ito provide torque measurements during Performance Trials. Previous systems
required physical contact between the rotating shaft and the stationary ship
structure via a slipring-brush interface. A telemetry system is free from 3brush noise and does not require regular maintenance. The 100 Hz frequency
response of the torque system facilitates the measurement of both mean and Ialternating torque. 3
32
I
I
The Acurex series 1600 horsepower meter consists of a strain-gage bridge
3 sealed in a 18 in. (46 cm) metal tube (sensor bar) which is bolted to two
carrier rings clamped around the propulsion shaft. Excitation voltage for the
5 strain-gage bridge is provided by the 6 Vdc output of a regulated bridge
rectifier. The rectifier input voltage is supplied by a 160 kHz signal
inductively coupled to a rotating antenna. The changing dc output of the
3 strain-gage bridge then proportionally modulates a 5 kHz square wave in the
rotary electronics module. These modulated pulses drive a voltage controlled
oscillator operating at a frequency of 10.7 MHz. The oscillator output is
capacitively coupled from rotor to stator winding and is electrically separated
from the power signal. The signal is then demodulated and signal conditioned to
3 produce a dc voltage proportional to shaft torque.
The shaft-mounted portion of the system is shown in Fig. 6. The system is
U calibrated by subjecting the sensor bar to precise displacement increments
3 which can be related to shaft torque via a knowledge of shaft characteristics
and properties such as outside diameter, inside diameter, and modulus of
3 rigidity.
Shaft speed is measured using an infrared light source/sensor and
reflective tape strips. The light source is directed toward a band of 60
strips of reflective tape evenly spaced about the shaft, with each strip
separated by non-reflective material. As each strip of reflective tape passes
under the light source, the light is reflected to the sensor and converted to a
voltage pulse. The voltage pulses generated are then converted to a dc voltage
suitable for monitoring and recording purposes. Shaft horsepower is then
calculated according to the relationship:
33
I
P = Q * r/min Uc 2
where: C
P = Shaft power (shp or kW) 3Q = Shaft torque (ft-lb or N-m)
R/min = Revolutions per minute 3C2 = Constant value (5,252 for English units or 9,549 for metric units)2!
PROPELLER THRUST 3Thrust measurements are obtained on surface ships by replacing the
standard thrust bearing leveling plates with leveling plates that contain 3strain gauge load cells as shown in Fig. 7. This measurement technique
provides reasonably accurate thrust data, but the installation is costly and Itime consuming.
The calibration factor (output voltage versus applied load in pounds or
newtons) is determined for each cell with a loading machine at the Center. The 3voltages recorded during each run are converted to force values by application
of the calibration factor and by subtracting the load attributable to the depth Iof submergence of the propeller. The total correction also takes into account 3the weight of the rotating parts (shafting and propeller), the angle of
inclination of the main shaft, and the trim of the ship. 3Leveling plates with strain gauge load cells are often installed to obtain
thrust data for model and propeller correlation studies despite their difficult Iinstallation procedures. Attempts to develop a more efficient and economical 3method of obtaining accurate thrust data have been unsuccessful to date.
I34 I
I
I
H MACHINERY CHARACTERISTICS
3 Selected data are recorded to document the operating ievels of ship
machinery during Performance Trials. Typical measurements include first stage
3 shell pressure of the high pressure turbine, condenser vacuum, astern nozzle
bowl pressure, and rudder ram pressures. These measurements may be used as a
diagnostic tool to examine or confirm the operating levels of various machinery
3 or to provide supportive data for direct measurements of various parameters
such as shaft horsepower. For example, first stage shell pressure can be
directly related to shaft power and indirectly to changes in hull condition
resulting from marine growth.
Pressure transducers, flow meters, thermocouples, accelerometers, etc.,
are examples of common transducers utilized during Performance -rials. The dc
output from each transducer is conditioned and routed to the recording
U instrumentation. Past trials have required a thorough knowledge of machinery
operating principles, characteristics, and expected performance. As many as
100 different data channels have been monitored and recorded during individual
* trial periods.
I CONTROL SETTINGS AND APPENDAGE POSITIONS
3 Documentation of the dynamic positions of selected ship machinery controls
and certain appendages are essential to the successful completion and subsequent
3 analysis of Performance Trials. These measurements are typically obtained via
existing ship's synchro circuits. Measurements obtained in this manner include
throttle position, rudder angle, and ship's heading.
35
I
The ship's synchro circuits are connected to solid state synchro converter Imodules which have input impedances of greacer than 100;000 ohms. High input
impedance devices are used for all interfaces with ship's circuits to avoid
impairing the normal operation of ship systems. These synchro modules are 3configured to produce output voltages which vary in proportion to the mechanical
movement being sensed. Calibrations are performed by recording the output of Ieach synchro module as a given control or appendage is moved to and held at a
known position. IPROPELLER PITCH
The accurate determination of propeller pitch is perhaps the most difficult
measurement to accomplish during Performance Trials. Propeller pitch is
normally measured by the ship's mechanical indicator located near the oil
distribution box which supplies pressurized oil to the control mechanism. The 3mechanical indicator provides a means to record the pitch, however, the
indicator output is not sensitive to propeller pitch deviations caused by
changes in system oil temperature or shaft compression due to thrust. Sensors 3mounted in propeller hubs during special trials have demonstrated the
significant difference which may be present between actual blade position and Ithat reported by the mechanical indicator.
Temporary in-hub sensors are rarely utilized due to the high cost and
complexity of the installation. Consequently, propeller pitch calibrations
have increased in complexity and now involve supplemental measurements such as
system oil temperature and pressure. Propeller pitch mechanical indicator Icalibrations are generally performed pierside with divers for three different
36
I
hub oil temperatures. At each pitch setting of interest, divers obtain
3 measurements at the propeller hub while inbcard measurements are taken at the
pitch mechanical indicator. A correlation is then made between the actual
I pitch and the mechanical indicator position for each oil temperature. System
oil temperature is subsequently measured during the trial and is used in the
pitch computation.
Periodically during the trials, propeller pitch is moved to its maximum
position, which is fixed by design, to provide a known point such that the
I pitch calibration can be checked. This verification includes the simultaneous
measurement of pitch from the ship's indicator and hub oil pressure. Failure
to meticulously perform the pitch calibration and subsequent validations will
result in erroneous pitch data. The measurement of propeller pitch continues
to be an area of concern. Currently, a permanent in-hub pitch sensor is under
U development for one class of ship. Hopefully it will prove to be reliable and
3 accurate.
CONDITIONING EQUIPMENT
Each transducer output recorded during a Performance Trial requires signal
conditioning or processing to create high resolution data compatible with the
electrical characteristics of the data acquisition system. Signal conditioning
equipment required to accomplish this processing include: dc amplifiers,
synchro to analog converters, frequency to voltage converters, and torsionmeter
electronics. Many of these devices are located near the data source to insure
a high signal to noise ratio and to reduce the amount of equipment which must
be installed in the instrument room.
37
I
The specific functions of individual elements of the "conditioning Iequipment" shown on the instrumentation block diagram, Fig. 8, is either Iself-explanatory, e.g. dc amplifier, or is discussed in the text which
describes the general measurements.
DATA PROCESSING AND CONTROL IDATA ACQUISITION SYSTEM 3
The Full Scale Trials Branch has discontinued use of an analog scanner and
printer system in favor of a digital computer based system in order to take 3advantage of technological advances previously mentioned and to obtain more
detailed performance data. The computer based system, capable of both data I
acquisition and data analysis, significantly reduces the manpower required to
conduct Performance Trials. Experience has shown that Performance Trials can
be most efiiciently conducted by limiting the amount of manually collected 3data. Trials which depend on manual data collection are severely limited by
the speed at which data can be obtained. Manual recording also hinders the
simultaneous sampling of numerous data channels. 3Communication difficulties generally arise with a large number of data
collection stations. As an example, recording marks can be inadvertently 3missed as persons in areas such as the engine room experience a great deal of
background noise. Accordingly, it is considered imperative that data collection
during major trials on large ships be as automated as possible to avoid such I
problems.
An important step in planning for a Performance Trial on a large ship is 3the selection of the data acquisition and/or data reduction system location.
383
I
Several configurations may be possible for a given ship, but some arrangements
3 have advantages over others. Performance Trials must be directed from the
pilot house by the Trial Director to ensure proper execution of each maneuver.
I Therefore, the pilot house is the preferred location for the data collection
system. This arrangement allows the Trial Director and the computer operator
to interface more effectively with each other and the pilot house personnel.
3 Discretion should be exercised, however, before the decision is made to locate
the instrumentation in the pilot house. Generally, the following criterion
I must be met before locating in the pilot house.
1. Adequate space must be available such that the added personnel and
equipment will not interfere with normal ship operations.
2. Ship personnel should be receptive to having additional instrumenta-
tion in the pilot house.
U 3. The installation must be neat and presentable and should allow easy
3 replacement of any component in the event of equipment failure.
4. Consideration should be given to the possibility of night operations
3 when the pilot house would be rigged for red (no bright lights).
It is likely that the data acquisition system cannot be located in the pilot
I house. Consequently, a second choice is to locate the equipment within 200 ft
3 (61 m) of the R/T installed on the mast. This arrangement allows the Falcon
console to be located with the computer system and minimizes the length of
cables routed between the instrument room and the pilot house. In the event a
suitable instrumentation room cannot be located within 200 ft (61 m) of the
R/T, the Falcon console must be located remote from the computer system and
controlled via a bus extender system.
39
I
The bus extender system is transparent to the user, highly immune to Inoise, and requires only two shielded pairs of cable for data transmission.
This system allows the computer to control any Institute of Electrical and
Electronics Engineer (IEEE) 488 device, such as the Falcon console, at 3distances up to 4,000 ft (1,220 m). Long separations between the Falcon
console and the computer necessitate several long cable runs between the
instrument room and the pilot house. Propagation delays are inherent due to
the link length, but data transmission rates of 60 kbytes/s are typical.
The area ultimately selected to house the major portion of the data I
acquisition system should be reasonably quiet, out of the mainstream of the
ship's personnel traffic, centrally located to the signals being recorded, and
air conditioned. Air conditioning helps avoid equipment failures resulting
from extreme temperatures or humidity. Outputs from the transducers previously
discussed are routed to the selected compartment, referred to as the instrument Iroom, and are inputed to a measurement and control processor as shown in Fig. 8.
The processor accepts bi-polar 10 V analog signals as well as digital
signals and routes the data to the computer. The computer is programmed in 3basic language and controls the acquisition, computation, and recording of all
data channels. The 16-bit computer used by the Full Scale Trials Branch has I4 Mbyte of random access memory and input-output ports for interfacing with a
wide variety of peripherals. A flexible disk drive is used for permanent
storage. A thermal printer is used after each run for "quick-look" 3confirmation of the validity of each run.
The instrumentation system described above allows all data to be collected Iand checked for certain types of errors automatically. The computer program 3
40

I
used is menu-driven and allows the operator to select different run modes, scan
rates, etc. However, this system causes a dilemma in the event of failure of a
major system component such as the computer or the tracking system. It is
I therefore imperative that substitute components be readily available for
critical system elements. If instrumentation problems occur, corrective
actions are initiated by the trial engineer who monitors the performance of the
instrumentation throughout the trials.
I DISPLAY EQUIPMENT
The Trial Director must verify that each run is performed in accordance
with accepted trial procedures to ensure comparable test results. In order to
* assist the Trial Director in recognizing steady conditions and appraising the
validity of each run, data from selected parameters are displayed real time via
Ucathode ray tube (CRT) monitors in the pilot house.
One of the pilot house monitors displays machinery data which normally
includes torque, shaft speed, horsepower, ship heading, and rudder angle. A
second display graphically depicts the ship's movements and allows the Trial
Director to know the ship's location on the range at all times. The Trial
Director is thereby kept fully apprised of ship conditions without frequent
phone communications with the instrument room personnel. Four cable runs are
normally required to pass machinery and position data to the pilot house.
These cables are noise sensitive and it is recommended that this distance be
limited to 200 ft (61 m). An additional cable run is needed for communications.
41
I
DATA REDUCTION EQUIPMENT IThe necessity of backup instrumentation onboard the test ship, along with
the smaller size of today's data processing equipment has resulted in the
routine installation of a second data acquisition and control system for each
Performance Trial. In addition to serving as a backup system, the secondary
equipment is utilized for data reduction concurrent with data acquisition by
the primary unit. Thus, while trials are in process, the second system is used
to plot time histories, reduce trial data, or perform any processing deemed
necessary by the trial team. ISoftware is continually being developed to further utilize this equipment
to more completely document, analyze, and validate each run as well as to
identify areas which may warrant further investigation. The equipment is used
to accumulate individual run data into a common file thus enabling a run
summary table to be output at any time for all common maneuver runs. iAdditionally, the system is used to calculate and plot drift vectors and to
estimate true wind velocity. This information is useful in observing weather
trends and provides insight into the scheduling of the different types of
trials. An observed trend of decreasing wind conditions may, for example,
indicate a favorable opportunity for conducting spiral tests. Undoubtedly, the irole of the onboard data reduction system will continue to increase as new
software is developed and this tremendous resource is more fully utilized.
I
I
I

I
N POST-TRIAL DATA ANALYSIS
STANDARDIZATION TRIALS
The speed and computational power inherent to the acquisition system
described above minimizes the post-trial data reduction effort. This is
particularly true of the standardization data shown in Fig. 9. Maximum,
minimum, and mean values for all channels are determined during each speed/
power run which allows the Trial Director to readily detect inconsistent data.
Inconsistent run averages indicate the need for additional runs to clarify any
I questionable data or to verify unexpected trends. The importance of verifying
trial data while at sea cannot be overemphasized. Repeat runs are not possible
once the trials have been completed and the instrumentation has been removed.
The basic data presented from Standardization Trials are shaft speed,
power, torque, and thrust as functions of ship speed. Data from multiple shaft
* ships are generally reported as averages or totals of all the shafts.
3 Standardization data are normally obtained at two different displacements
to document the magnitude of the powering changes resulting from differences in
Sdisplacement. Relevant data such as relative wind speed and direction and ship
heading are also presented with the standardization data so that all powering
I data can be corrected to zero wind condition for comparison with model
predictions.
Standardization curves are distributed to the fleet to provide information
on the powering characteristics of each new class of ship. The clean hull data
provided by these powering trials constitute a valuable reference for uture
evaluations of the powering efficiency of a given ship. Periodic measurements
43
II
of the ship speed to shaft speed relationship of a ship, for example, can be Icompared to standardization data to provide an indication of hull fouling.
TRAILED AND LOCKED SHAFT TRIALS
Data obtained during Trailed and Locked Shaft Trials are presented as a
group of curves representing the ship's speed/powering characteristics for
various combinations of trailed or lccked shafts. The curves of thrust,
torque, shaft speed, and horsepower versus ship speed can thus be used to
predict the ship's speed/powering capabilities in the event of a casualty which
requires the trailing or locking of a shaft.
TACTICAL TRIALS
Tactical circle positional data must be corrected for the drift experienced
by the ship due to wind, current, and tides. Tactical circle trials therefore Irequire that the ship complete a change of heading of at least 540 deg for each
run. Time dependent positional information which is 360 deg apart in heading
are then compared to determine the drift correction coefficients. Corrections
are based on the assumption that a true circular path is swept by the ship with
a constant rate of change of heading. Accordingly, after the ship's rate of Ichange of heading has become constant, any differences in the ship's position
at heading values 360 deg apart are due to wind and water currents.
The magnitude and direction of the drift coefficients can then be obtained 3by dividing the positional differences (360 deg apart) by the elapsed time
between points. These coefficients are defined for X and Y positions and have Iunits of feet, yards, or meters per second. The corrected ship's path is then
44
I
U derived through the addition of the recorded X/Y coordinates and the product of
the X/Y drift coefficient and the elapsed time relative to execute for all data
points.
A path similar to that shown in Fig. 10 results when the ship's movement
during a turn has been drift-corrected. The ship's turning characteristics:
advance, transfer, tactical diameter, and steady turning diameter are then
determined from the drift-corrected plot. Advance is the distance along the
baseline course from EXECUTE (the point at which the rudder began to move) to
I the 90 deg change of heading position. Transfer is defined as the distance
perpendicular to the baseline course from EXECUTE to the 90 deg change of
heading position. Tactical diameter is measured from EXECUTE to the 180 deg
change of heading position, perpendicular to the baseline. The steady turning
diameter is the diameter of the drift corrected circle. In addition to these
I measurements, the ship's steady speed in the turn is determined from the steady
turning circumference and the time required for 360 deg change of heading at a
steady turning rate. Sample tactical trial data are shown in Fig. 11.
* These data also reveal turning differences that occur with the use of
right or left rudder and the possible presence of rudder breakdown. When
I rudder breakdown occurs, it is generally at higher speeds with large rudder
3 angles and is defined as the point at which an increase in rudder angle results
in a decrease in turning rate for a given speed. The rudder -essentially loses
3 effectiveness beyond that particular angle of deflection. This effect is shown
in Fig. 12 where 40 deg of rudder deflection results in a lesser turning rate
I than 35 deg.
4
1!4
I
Other parameters recorded during the Tactical Trial and generally Itabulated for reporting purposes are angle and direction of heel. These
tactical data are also provided to the fleet and provide valuable operational
characteristics for a new ship class.
ACCELERATION AND DECELERATION TRIALS UAcceleration and Deceleration Trials quantify the ship's ability to
increase or decrease speed as functions of various initial conditions and
subsequent engine orders. In the case of the deceleration maneuver, the time 3to stop and the distance traveled while stopping are the important parameters
needed to define the ship's stopping characteristics. The time and distance
traveled before reaching terminal speed from a specific initial condition and 3engine order defines the accelerating characteristics. The term "reach" is
used to define the distance traveled along the ship's extended approach path Ibetween EXECUTE and the attainment of terminal speed.
Computer programs which utilize polynomial curve-fitting routines are used
to obtain an equation defining relative changes in ship position as a function
of time for each acceleration or deceleration maneuver. The resulting reach
equation is then differentiated to obtain an expression to define ship speed as
a function of time. Reach and speed versus time plots can then be produced to
graphically illustrate the ship's movement along the projected approach path
during each run. A family of deceleration curves developed by this method is
shown in Fig. 13. Acceleration curves look similar except the speed plots
curve upward rather than downward. I
446 1
I
I
l MANEUVERING TRIALS
Definitive maneuvers such as spirals and horizontal overshoots are
performed to characterize the directional stability, handling response, and
I rudder effectiveness of a given ship.
Spiral Tests
Spiral Test data reduction primarily involves generating plots showing
rate of change of heading in degrees per second as a function of rudder angl!.
* The rates of change of heading are calculated by dividing the total change of
* heading by the elapsed time during a period of steady turning at a constant
rudder angle. The actual rudder angle reached is used for plotting purposes
3 rather than the requested, predetermined rudder angle.
An example of a spiral maneuver depicting a directionally stable ship is
I shown in Fig. 14. As shown in Fig. 14, a directionally stable ship will
exhibit the same turning response whether the rudder is moving left to right or
right to left. A directionally unstable ship !7ill not turn the same to the
left and right as evidenced by the "hysteresis loop" between 5 deg left and
10 deg right shown in Fig. 15.I3 Horizontal Overshoot Tests
Horizontal overshoot maneuvers are generally characterized by a time
3 history plot of rudder angle and ship's heading. The results of a horizontal
overshoot test are shown in Fib. 16. Good horizontal overshoot characteristics
are position and heading repeatability between left and right rudder maneuvers
i and maneuvers with the rudder in the same direction. Small overshoot angles
* 47
3
I
are indicative of the ship's ability to effectively change direction or Icounter-maneuver. Effective countermaneuvering capability is particularly
important when operating in restricted waters.
The primary predetermined parameters for horizontal overshoots are approach
speed, rudder angle, and execute change of heading (generally 10 or 20 deg'.
Backing Tests
The results of this maneuver are presented and analyzed using plots of
heading versus time and, if conducted on a range, positional time history Iplots. However, these tests generally cannot be satisfactorily performed.
Most twin propeller ships respond well to large rudder angles while moving
backward. However, most single propeller ships or the use of low rudder angles
on any ship generally results in the ship being unable to maintain a straight
path while backing. I
FUEL ECONOMY TRIALS UResults of the Fuel Economy Trials are reported by NAVSSES, Philadelphia.
Powering data are normally supplied to NAVSSES by DTRC and the report includes
fuel consumption data as a function of shaft power. Fuel consumption rates are
sometimes forwarded to DTRC for inclusion in the Standardization Trials report.
MODEL POWERING CORRELATION
Correlation between full scale trial results and model predictions of
powering characteristics continues to be an important part of the U. S. Navy's Ieffort to improve its ship design capabilities. Each model to full scale
48
II
correlation produces data necessary to more precisely determine hull
correlation allowance (CA) values which must be applied to model test results
to accurately predict the powering performance of a given ship. CA values are
constantly being modified as more data are obtained through this correlation
j process. Such information is necessary to maintain a high level of agreement
between model predictions and full scale data. This correlation provides
a cost-effective method of obtaining creditable performance predictions for new
hull, appendage, and propeller designs.
Upon completion of a full scale trial, an additional series of model tests
are conducted which duplicate the full scale trial conditions. The model is
rigged and appended similarly to the actual conditions existing during the full
scale trials (trim, displacement, appendages, and the propellers) Resistance
and self-propulsion tests are then conducted again. Corrections are applied
for wind, seawater, temperature, and specific gra-ity, and then a new
* correlation allowance can be established.
3SUMMARY AND CONCLUSIONS
Performance Trials continue to provide the best source of quantitative
I data on the powering and maneuvering characteristic of U.S. Navy ships.
3 Advances in the performance capabilities of ships have been accompanied by
advances in instrumentation capabilities, thus resulting in the more complete
3 characterization of the total ship. Faster sample rates, less onboard
manpower, more accurate measurements, faster data turnaround, and a wider
I choice of selection of trial sites are the trends in full scale trials.
I
I 4
I
Advances in capability must be accompanied by proper equipment calibration Iand substitution capability to ensure that each trial is successful. 3The successful trial is a result of careful planning, close liaison with the
ship, and the ability of the trial team to adjust to changing trial conditions 3which often threaten the realization of trial objectives.
The more controlled aspects of the current full scale ship performance Itrial procedures reduce the trial time required, while improving trial safety
through more precise ship positioning at greater distances from shore. The
near-real time processing capability of the instrumentation system also allows 3instant recognition of any peculiarities, thus providing an opportunity for
immediate further investigation as deemed appropriate. Therefore, each Uproperly executed trial produces a wealth of accurate, detailed data to assist 3the modern naval architect in achieving the goal of producing the fastest and
most efficient naval ships in the world.
5IIIIII
50 II
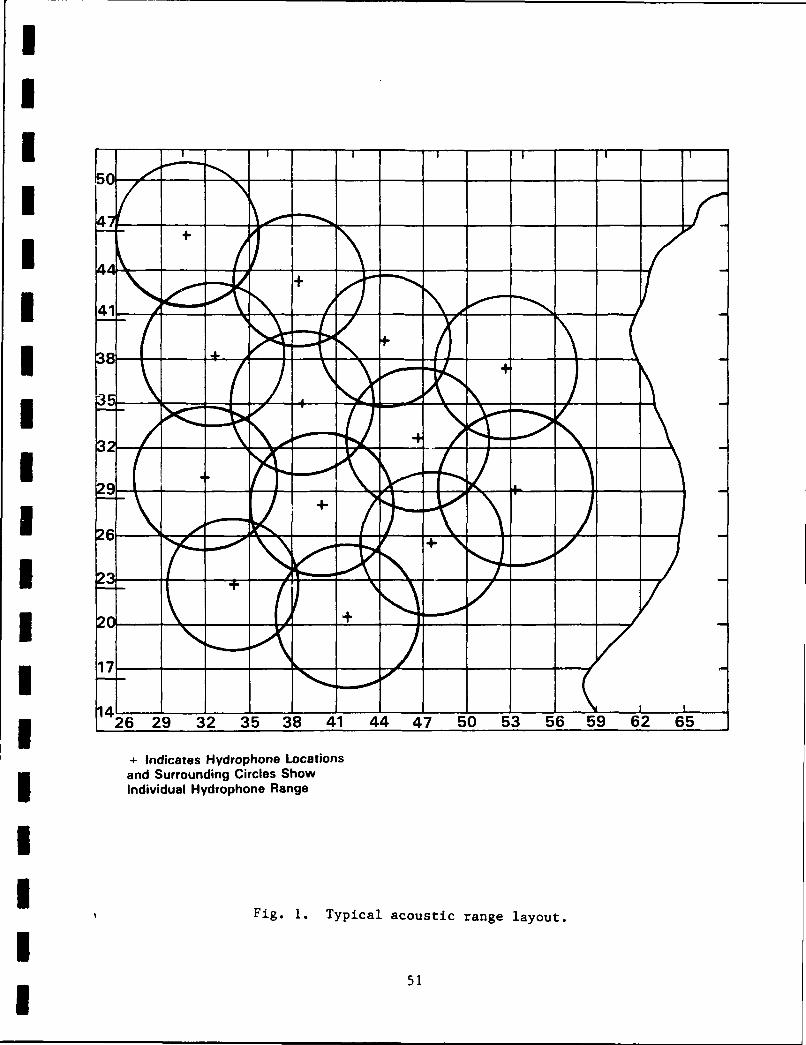
I547I
I ~ +_ _ _
I ~- \ -_ _ _ + _
_ _
_
I4I3
U3I9 __ _ _ _
U __ __26_
26-29 3235 38 4144 4750 5356 5962 65
-Indicates Hydrophone Locationsand Surrounding Circles ShowI Individual Hydrophone Range
I Fig. 1. Typical acoustic range layout.
51

I Ina
_ _00_ _ __ISLA_ _ _
GoFI(230.,19.*TRACKING AREAU
0 R ?0 __ I
CV
7600 750
Fig. 2. Location of Hatteras East Coast Tracking Offshore Range.I
52
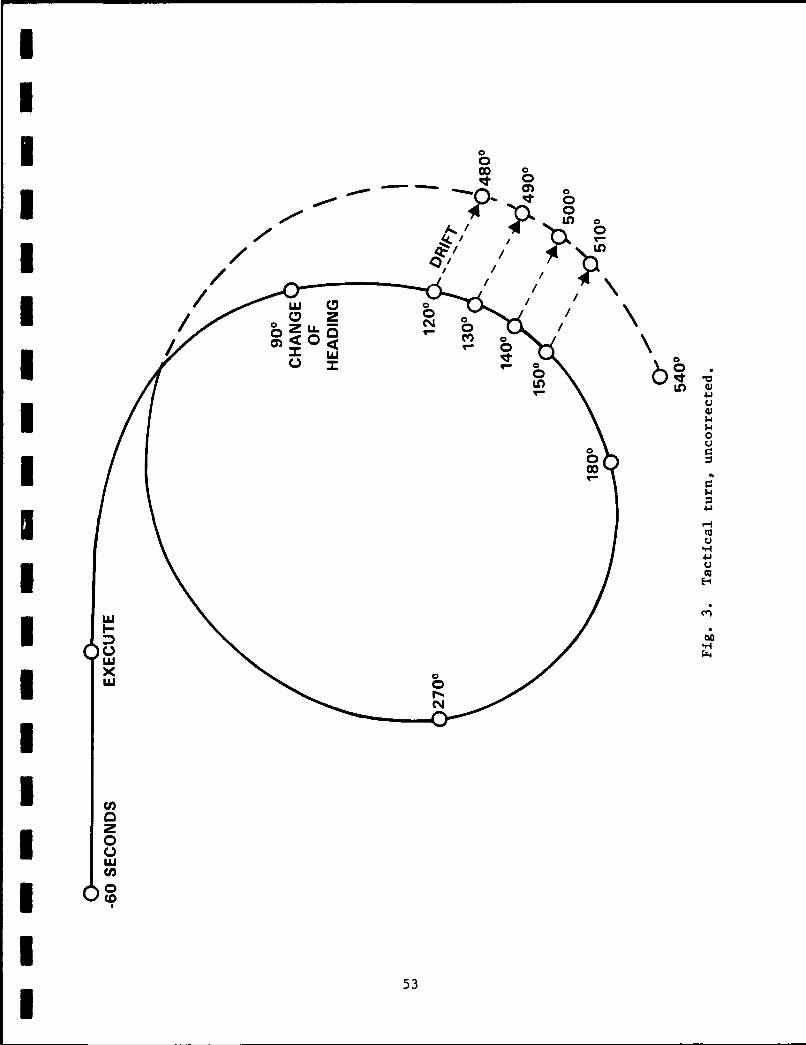
11100ILN-U
CD~ z
LLOL) M
0
4.
* IH
E4
LUU
* 0
53-
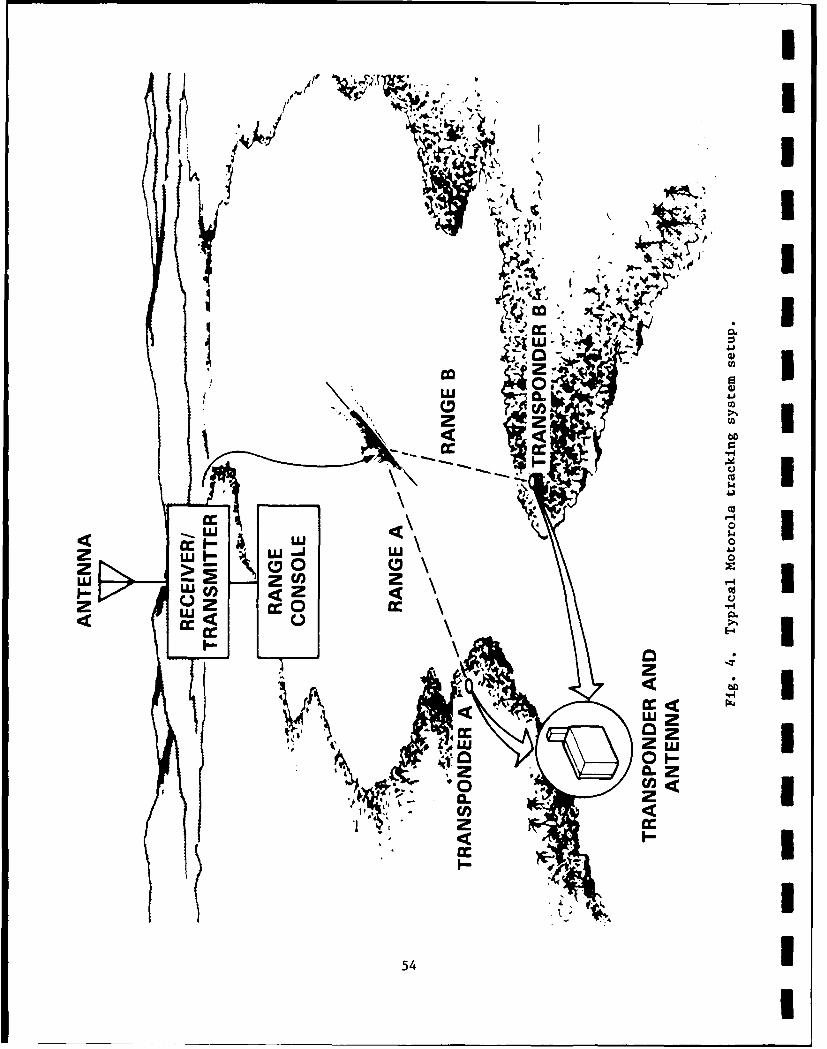
b U IcoIP J4ofLUI
W W
w ~U
z Z 0VU <0-oz
LU
a- I
54I
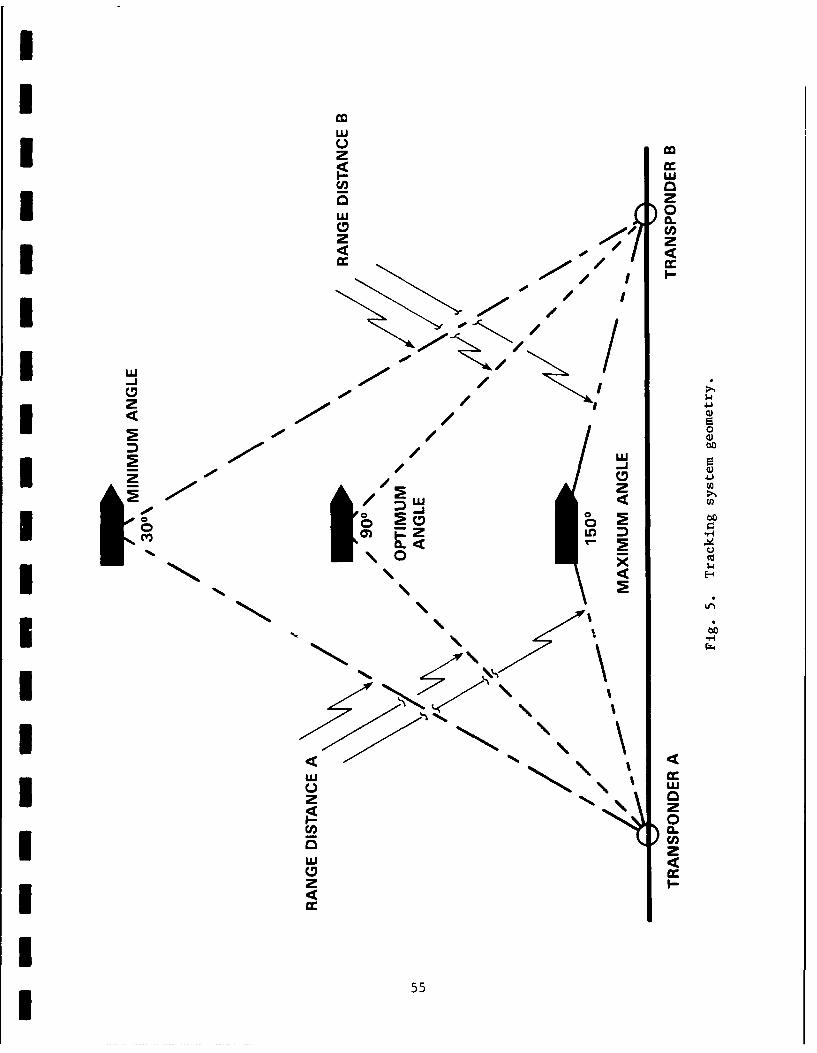
zz
w 0
4 -- 00, zI I 400
.00 / 1
4 04
z00
IL <9-a
44
* 55
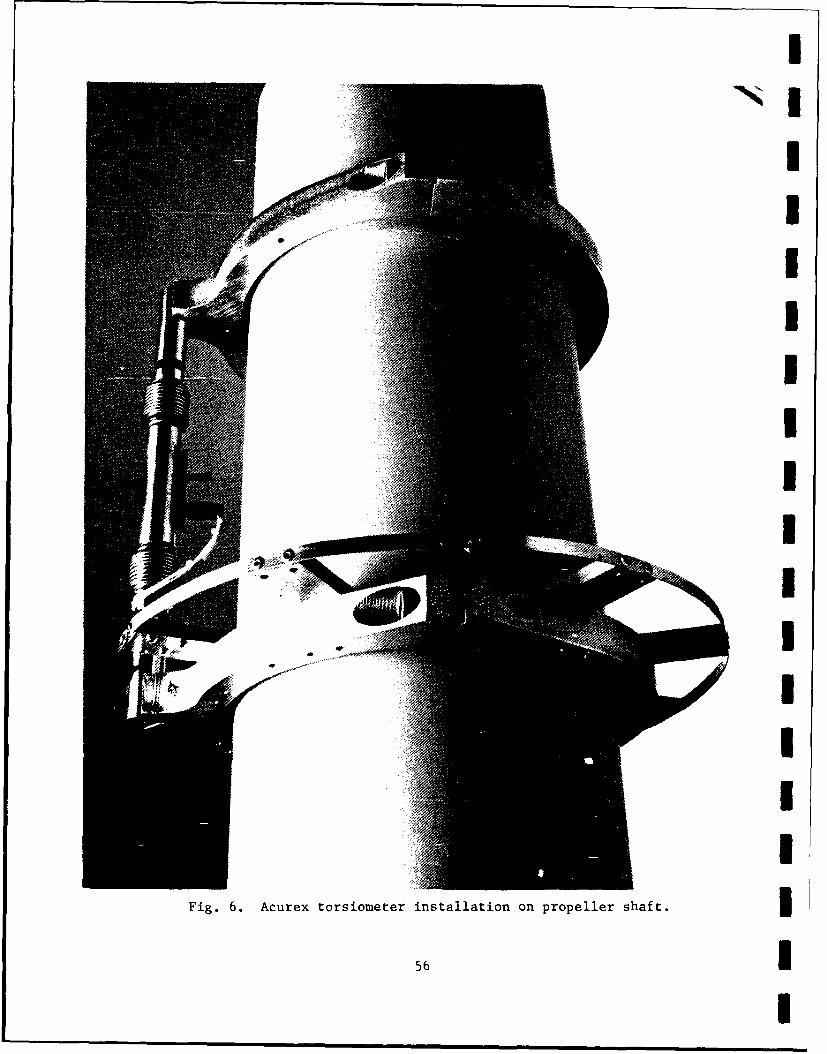
I
NI
IIIIIIIIIIUIII
Fig. 6. Acurex torsionieter installation on propeller shaft.
56 II
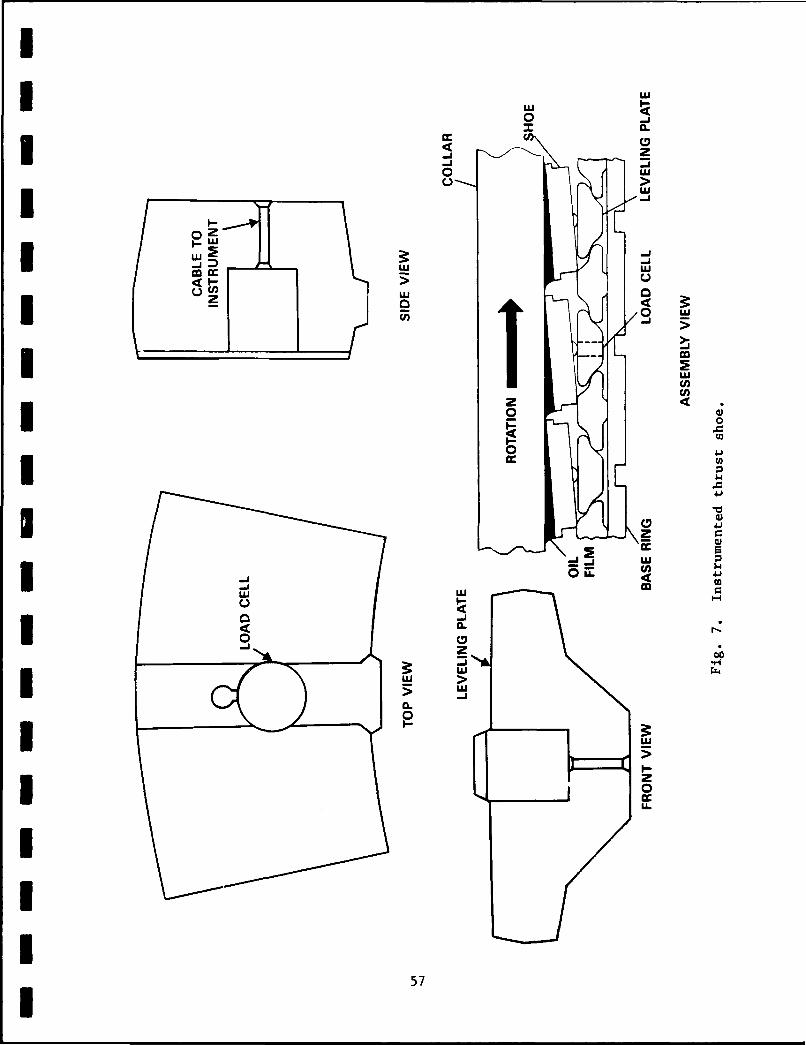
0 0
C'C,I -a zo 'Uo>
U)
I~ -j
-i
oz0ca cc U -U
41- U(~CI~ 'UI z 4z
0o
IIU
U.,
C)'Z4
00
cr.)
LL.3
I5
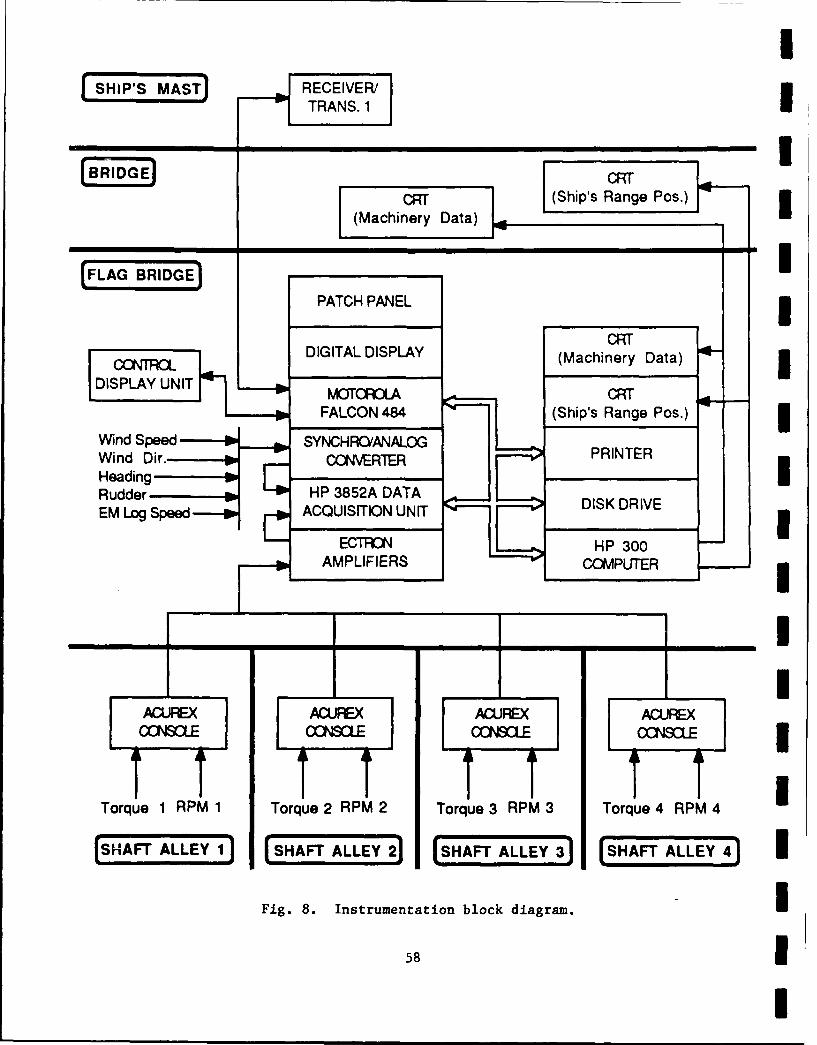
ISHS MASTREIV/
~I'i I ICRT (Ship's Range Pos.)I
(Machinery Data)
[FLAG BRIDGE)
PATCH PANEL 3CRT
CNR DIGITAL DISPLAY (Machinery Data)
9 1FALCON 484 (Ship's Range Pos.)I
HWin Spee SYNCH R'/A-RO PRINTERIHeading E -= HP 3852A DATAEM Log Speed , i ACQUISITION UNIT,' IKRV
ECTRON HP 300__ _AMPLIFIERS __COMPUTER I__ I- I
AUFEX 7 CJR ACUREX ACUREXCCNqSCLE CCSL CCSL ACNCRE
Torque 1 RPM 1 Torque 2 RPM 2 Torque 3 RPM 3 Torque 4 RPM4
ISHAFT ALLEY 1 SHAFT ALLEY 2) SHAFT ALLEY 3 [SHAFT ALLEY 4 I
Fig. 8. Instrumentation block diagram. I
583
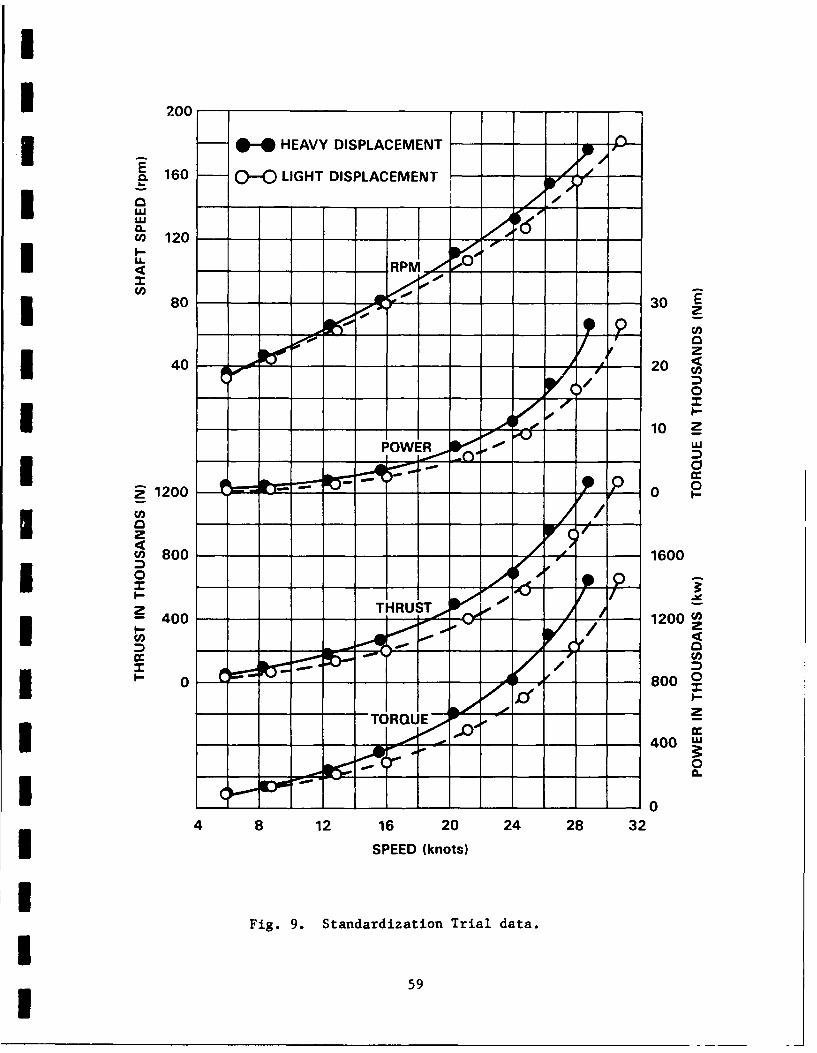
I 200 - " HEAVY DISPLACEMENT 1--~160O 0-0 LIGHT DISPLACEMENT --
0
I RPM80 - -- - - - - - - - - 30 E
e 0
40--------------------------- 20
AA 10
z1200p 0c,
w 800 :600~
0_
0 800 0
-.- -- --- -- 4 0 0 w
4 8 12 16 20 24 28 32* SPEED (knots)
Fig. 9. Standardization Trial data.
I 59

0 C)
_ _ I~~-7]
-0
4) .4 c-4
0 4)
CL.CL4
co-
xU
E -C
C.) ~60
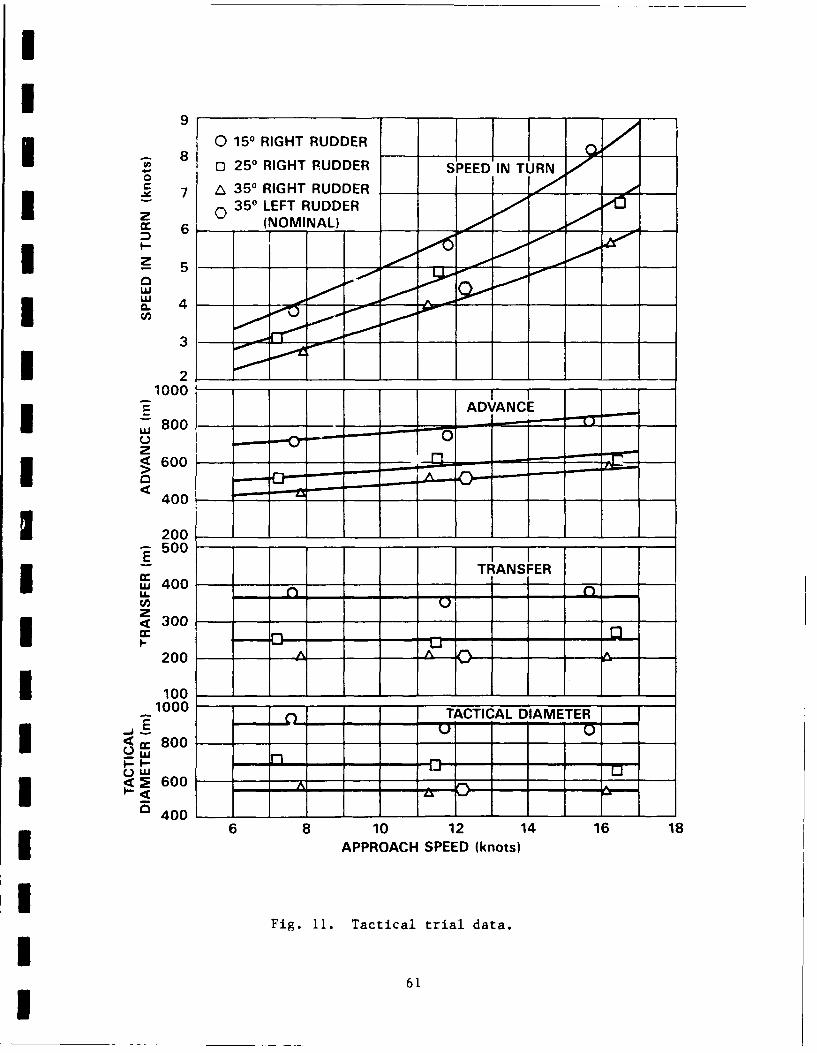
I
0 150 RIGHT RUDDER _
8 3 250 RIGHT RUDDER SPEED IN TURN
S7 Z 350 RIGHT RUDDER_ 350 LEFT RUDDER _
L
3
1000
z --I6ooo -- -- _00
400
I _200
5 01_ TRANSFERIr I4 I I_ - - I- ~uj 400
u. I
200 -
1 1001000 X- TACTICAL DIAMETER
= 800
600 A '
4006 8 10 12 14 16 18
APPROACH SPEED (knots)
IFig. 11. Tactical trial data.
I61I
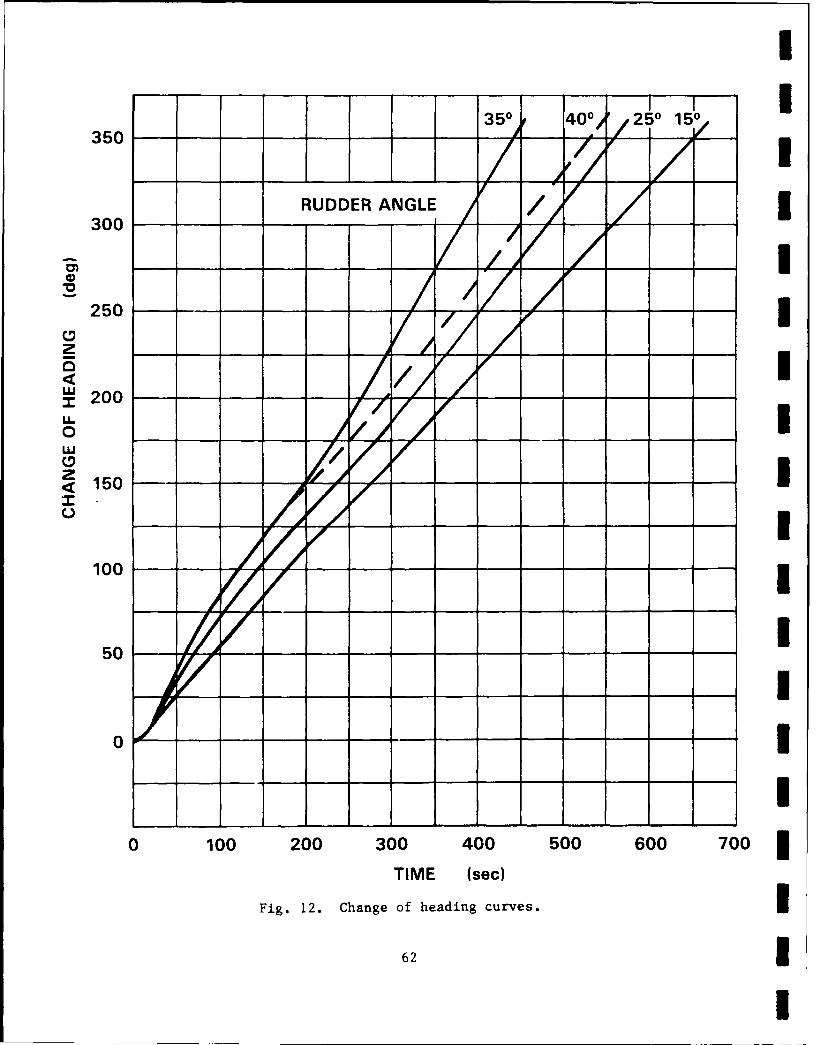
350 400/ 250 1 501
3501
300__ RUDDER ANGLE _ _ _
300
00
50
0 10 0 0 0 0 0 0
TIME ___ I50.1.Cag f edn uvs
___ __ __62
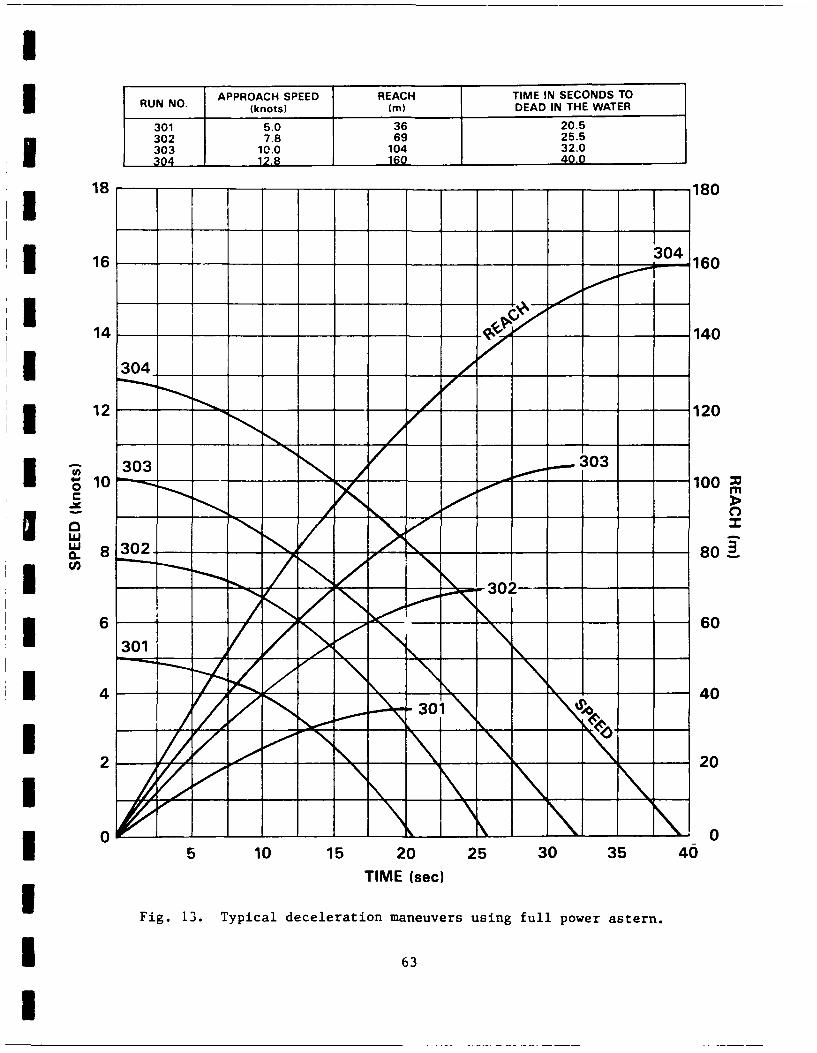
RNN. APPROACH SPEED REACH TIME IN SECONDS TORU N.(knots) (mn) DEAD IN THE WATER
301 5.0 36 20.5302 7.8 69 25.5303 10.0 104 32.0
1 3412.8 1160 40.0E 18 - ____ -180
16 ___ _34160
1 4 - - _ _ - - 1 4 0
I304 303__
10 _- - 100
0
I6 60_
21N
15 10 15 20 25 30 35 46TIME (sec)
Fig. 13. Typical deceleration maneuvers using full power astern.
1 63
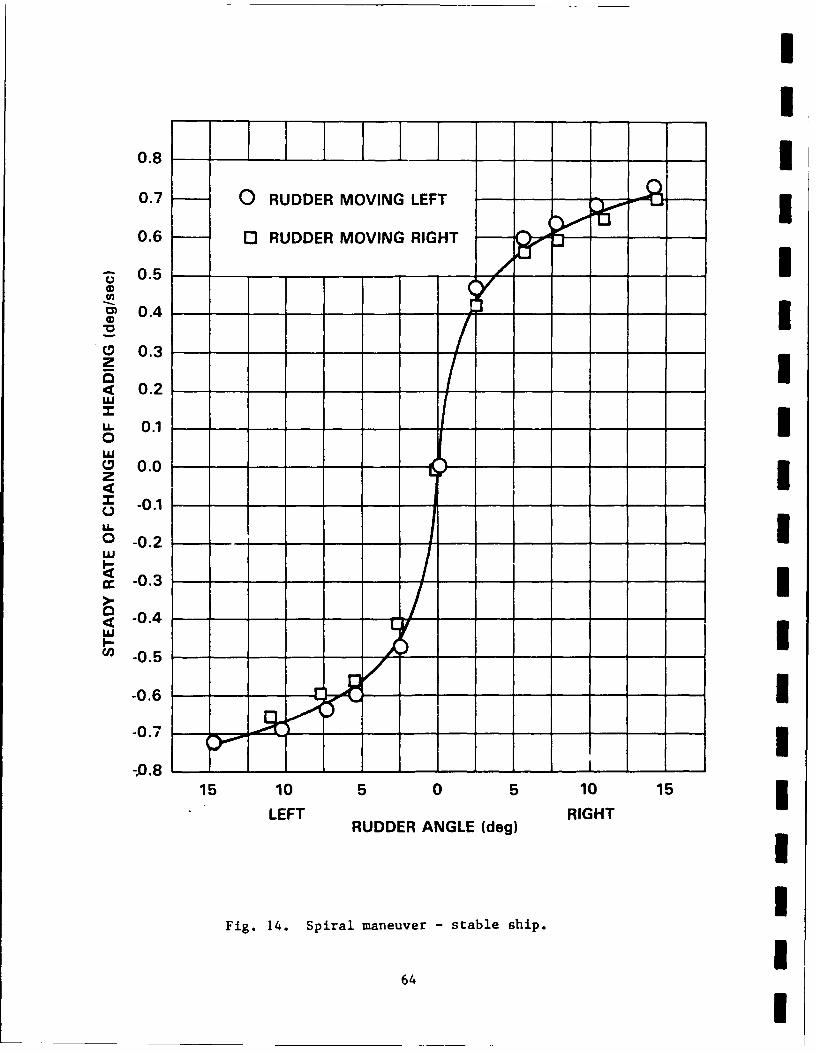
I
0.8 10.7 0 RUDDER MOVING LEFT - -- I
0.6 0 RUDDER MOVING RIGHT
- 0.5 / IS 0.4 - - - - - -- - -- -
o. ICD 0.3z
0.2-o0.2 - - - -|--wU. -0.1
0,-. 1------,- I
0
w/
aD 0.0-z
< o~ I . I
-0.1 -
15 -0.2 1 1
I
w
-0.3--I
,~-0.4-
Fi- 14Iprlmnuer-sal hp
~ -0.5 - - -
I
-0.7-
15 10 5 0 5 10 15
LEFT RIGHTRUDDER ANGLE (dog)
Fig. 14. Spiral maneuver - stable ship.
64
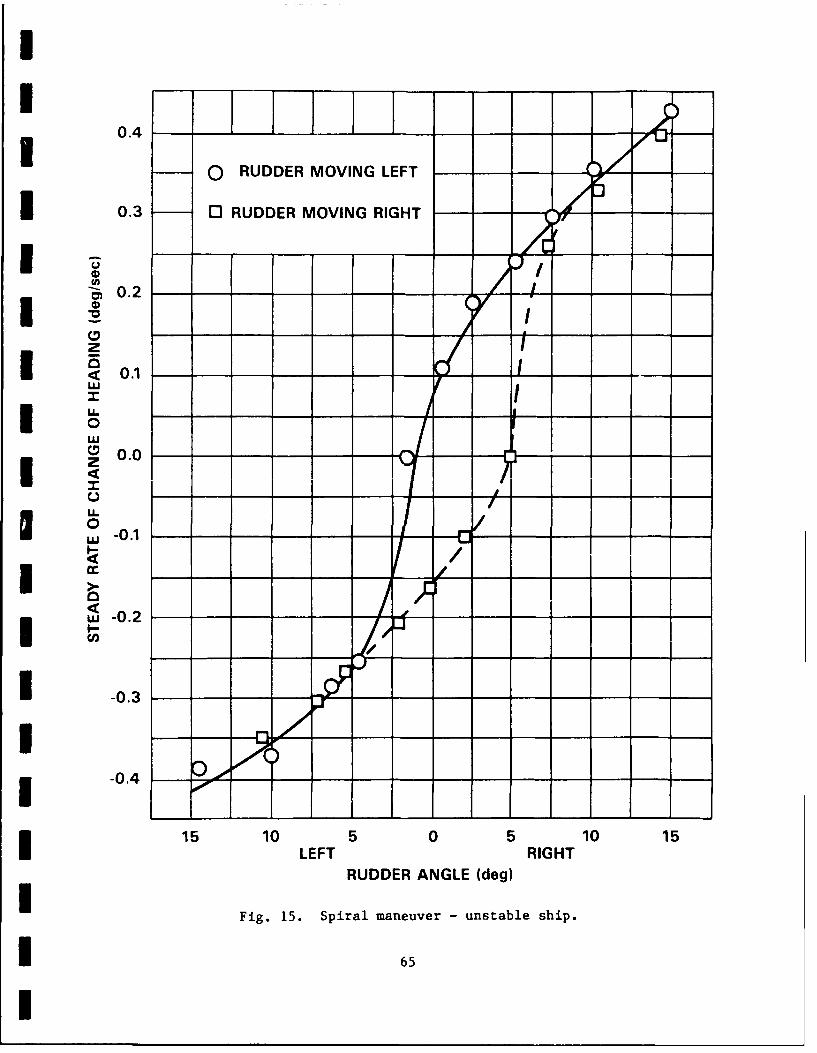
I
0.4 _-iQ RUDDER MOVING LEFT - - -- -
0.3 0 RUDDER MOVING RIGHT - -
== / /
W/0.2
z0.1
!. U
0I
z0 0.0
Hz.I ~~~LJ -0.1-------------------- - -
-0.2
I o-0.3 ---
-0.4
I15 10 5 0 5 10 15
ULEFT RIGHT
RUDDER ANGLE (deg)
U Fig. 15. Spiral maneuver - unstable ship.
* 65
I
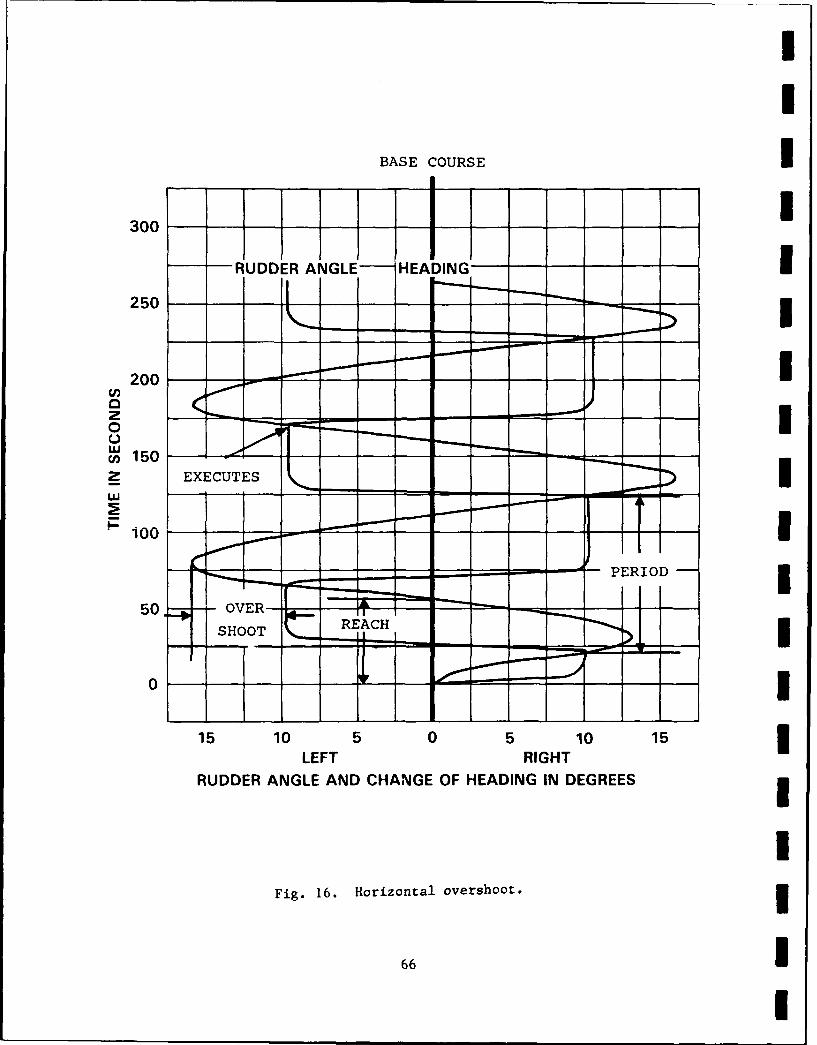
BASE COURSEI
300-11 1IRUDDER ANGLE- HEADIN---G
250 -
200 -- -- - - - - - - - - - - - - I0
I II100
PERII
50. OVER--- -
I R7I
15 10 LET5 0 5 RGT10 15
RUDDER ANGLE AND CHANGE OF HEADING IN DEGREES
Fig. 16. Horizontal overshoot.
663

I
U Table 1. Tracking range locations.
EAST COAST RANGES
Range Type of Range
* Hatteras East Coast Tracking Offshore RadarRange (HECTOR)Oregon Inlet, North Carolina
Atlantic Fleet Weapons Training AcousticFacility (AFWTF)St. Croix, U. S. Virgin Islands
Atlantic Undersea Test and Evaluation AcousticCenter (AUTEC)Andros Island, Bahamas
WEST COAST RANGES
Naval Torpedo Station Three Dimensional AcousticUnderwater Tracking RangeDabob Bay, Washington
Naval Torpedo Station Three Dimensional AcousticUnderwater Tracking Range
Nanoose, British Columbia
Santa Cruz Island Acoustic Range AcousticFacility (SCARF)Santa Barbara, California
HAWAII
Pacific Missile Range Facility Three AcousticDimensional Tracking Range
Barking Sands, Kauai, Hawaii
PREVIOUSLY USED PORTABLE RADAR TRACKING SYSTEM LOCATIONS
La Jolla, California Key West, FloridaLualualei, Oahu, Hawaii Point Reyes, CaliforniaYokosuka, Japan Kaneohe Bay, Hawaii
III 67
I
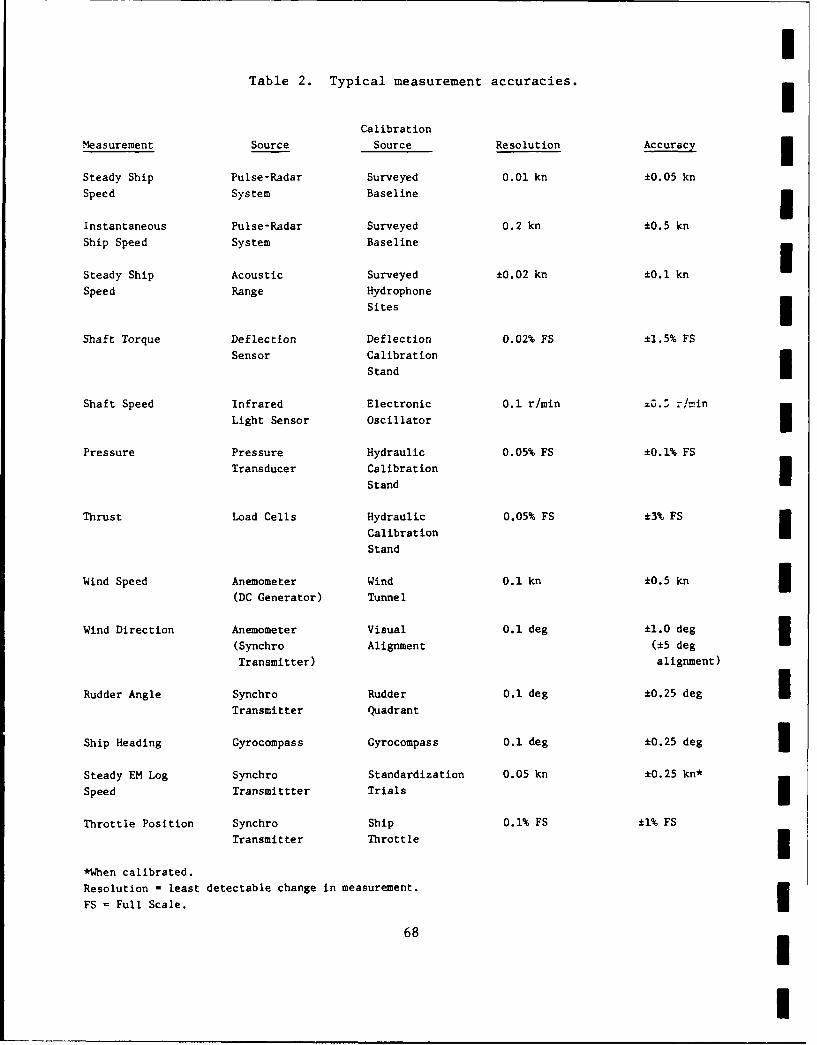
mTable 2. Typical measurement accuracies.
Calibration
Measurement Source Source Resolution Accuracy
Steady Ship Pulse-Radar Surveyed 0.01 kn ±0.05 kn
Speed System Baseline
Instantaneous Pulse-Radar Surveyed 0.2 kn ±0.5 kn
Ship Speed System Baseline
Steady Ship Acoustic Surveyed ±0.02 kn ±0.1 kn
Speed Range Hydrophone
Sites
Shaft Torque Deflection Deflection 0.02% FS ±1.5% FS
Sensor Calibration
Stand
Shaft Speed Infrared Electronic 0.1 r/min 3. r/mrin
Light Sensor Oscillator IPressure Pressure Hydraulic 0.05% FS ±0.1% FS
Transducer Calibration
Stand
Thrust Load Cells Hydraulic 0.05% FS ±3% FS
CalibrationStand
Wind Speed Anemometer Wind 0.1 kn ±0.5 kn
(DC Generator) Tunnel
Wind Direction Anemometer Visual 0.1 deg ±1.0 deg
(Synchro Alignment (±5 deg ITransmitter) alignment)
Rudder Angle Synchro Rudder 0.1 deg ±0.25 deg m
Transmitter Quadrant
Ship Heading Gyrocompass Gyrocompass 0.1 deg ±0.25 deg
Steady EM Log Synchro Standardization 0.05 kn ±0.25 kn*
Speed Transmittter Trials
Throttle Position Synchro Ship 0.1% FS ±1% FS
Transmitter Throttle
*When calibrated.
Resolution = least detectable change in measurement.
FS = Full Scale.
68