perennials 2014 - hornbaker gardens
TRANSCRIPT
half yearly report 2013
1
CONTENTS
Company Information 2 Directors’ Review 3
Independent Auditor’s Report on Review of Condensed Interim Financial Information to the Members 4
Condensed Interim Balance Sheet 5
Condensed Interim Profit and Loss Account 6
Condensed Interim Statement of Comprehensive Income 7
Condensed Interim Cash Flow Statement 8
Condensed Interim Statement of Changes in Equity 9
Notes to the Condensed Interim Financial Statements 10
Condensed Interim Consolidated Financial Statements 17
2
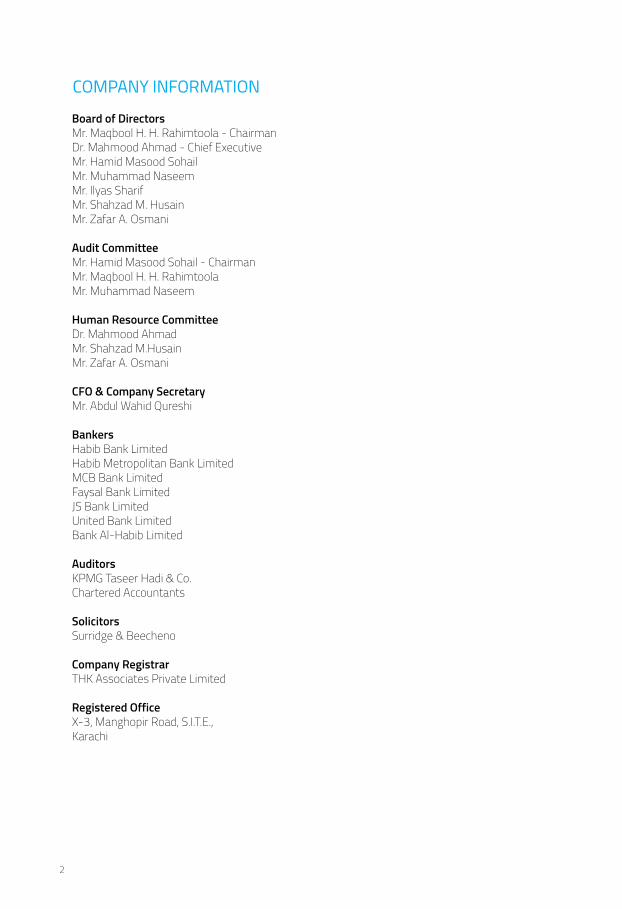
COMPANY INFORMATION
Board of DirectorsMr. Maqbool H. H. Rahimtoola - ChairmanDr. Mahmood Ahmad - Chief ExecutiveMr. Hamid Masood SohailMr. Muhammad NaseemMr. Ilyas SharifMr. Shahzad M. HusainMr. Zafar A. Osmani
Audit CommitteeMr. Hamid Masood Sohail - ChairmanMr. Maqbool H. H. RahimtoolaMr. Muhammad Naseem
Human Resource CommitteeDr. Mahmood AhmadMr. Shahzad M.HusainMr. Zafar A. Osmani CFO & Company SecretaryMr. Abdul Wahid Qureshi
BankersHabib Bank LimitedHabib Metropolitan Bank LimitedMCB Bank LimitedFaysal Bank LimitedJS Bank LimitedUnited Bank LimitedBank Al-Habib Limited
AuditorsKPMG Taseer Hadi & Co.Chartered Accountants
SolicitorsSurridge & Beecheno
Company RegistrarTHK Associates Private Limited
Registered OfficeX-3, Manghopir Road, S.I.T.E.,Karachi
half yearly report 2013
3
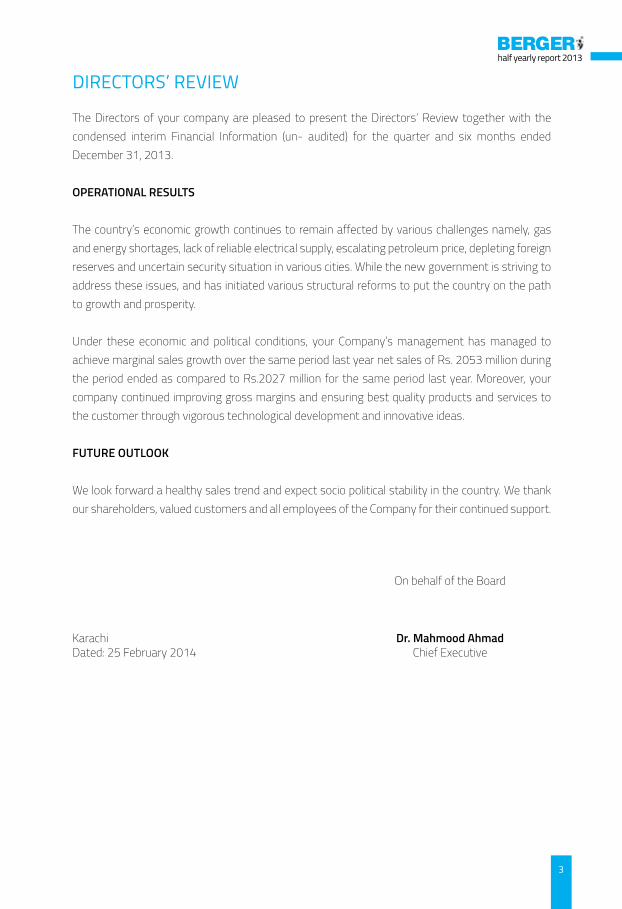
DIRECTORS’ REvIEw
The Directors of your company are pleased to present the Directors’ Review together with the condensed interim Financial Information (un- audited) for the quarter and six months ended December 31, 2013. OPERATIONAL RESULTS
The country’s economic growth continues to remain affected by various challenges namely, gas and energy shortages, lack of reliable electrical supply, escalating petroleum price, depleting foreign reserves and uncertain security situation in various cities. While the new government is striving to address these issues, and has initiated various structural reforms to put the country on the path to growth and prosperity.
Under these economic and political conditions, your Company’s management has managed to achieve marginal sales growth over the same period last year net sales of Rs. 2053 million during the period ended as compared to Rs.2027 million for the same period last year. Moreover, your company continued improving gross margins and ensuring best quality products and services to the customer through vigorous technological development and innovative ideas.
FUTURE OUTLOOk
We look forward a healthy sales trend and expect socio political stability in the country. We thank our shareholders, valued customers and all employees of the Company for their continued support.
On behalf of the Board
Karachi Dr. Mahmood AhmadDated: 25 February 2014 Chief Executive
4
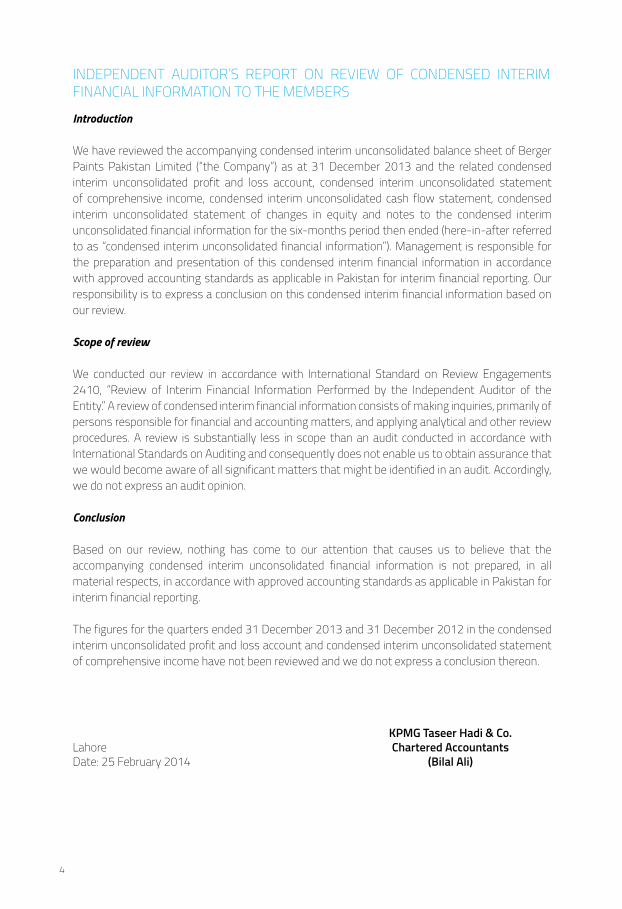
INDEPENDENT AUDITOR’S REPORT ON REvIEW OF CONDENSED INTERIM FINANCIAL INFORMATION TO THE MEMBERS
Introduction
We have reviewed the accompanying condensed interim unconsolidated balance sheet of Berger Paints Pakistan Limited (“the Company”) as at 31 December 2013 and the related condensed interim unconsolidated profit and loss account, condensed interim unconsolidated statement of comprehensive income, condensed interim unconsolidated cash flow statement, condensed interim unconsolidated statement of changes in equity and notes to the condensed interim unconsolidated financial information for the six-months period then ended (here-in-after referred to as “condensed interim unconsolidated financial information”). Management is responsible for the preparation and presentation of this condensed interim financial information in accordance with approved accounting standards as applicable in Pakistan for interim financial reporting. Our responsibility is to express a conclusion on this condensed interim financial information based on our review.
Scope of review
We conducted our review in accordance with International Standard on Review Engagements 2410, “Review of Interim Financial Information Performed by the Independent Auditor of the Entity.” A review of condensed interim financial information consists of making inquiries, primarily of persons responsible for financial and accounting matters, and applying analytical and other review procedures. A review is substantially less in scope than an audit conducted in accordance with International Standards on Auditing and consequently does not enable us to obtain assurance that we would become aware of all significant matters that might be identified in an audit. Accordingly, we do not express an audit opinion.
Conclusion
Based on our review, nothing has come to our attention that causes us to believe that the accompanying condensed interim unconsolidated financial information is not prepared, in all material respects, in accordance with approved accounting standards as applicable in Pakistan for interim financial reporting.
The figures for the quarters ended 31 December 2013 and 31 December 2012 in the condensed interim unconsolidated profit and loss account and condensed interim unconsolidated statement of comprehensive income have not been reviewed and we do not express a conclusion thereon.
kPMG Taseer Hadi & Co.Lahore Chartered AccountantsDate: 25 February 2014 (Bilal Ali)
half yearly report 2013
5
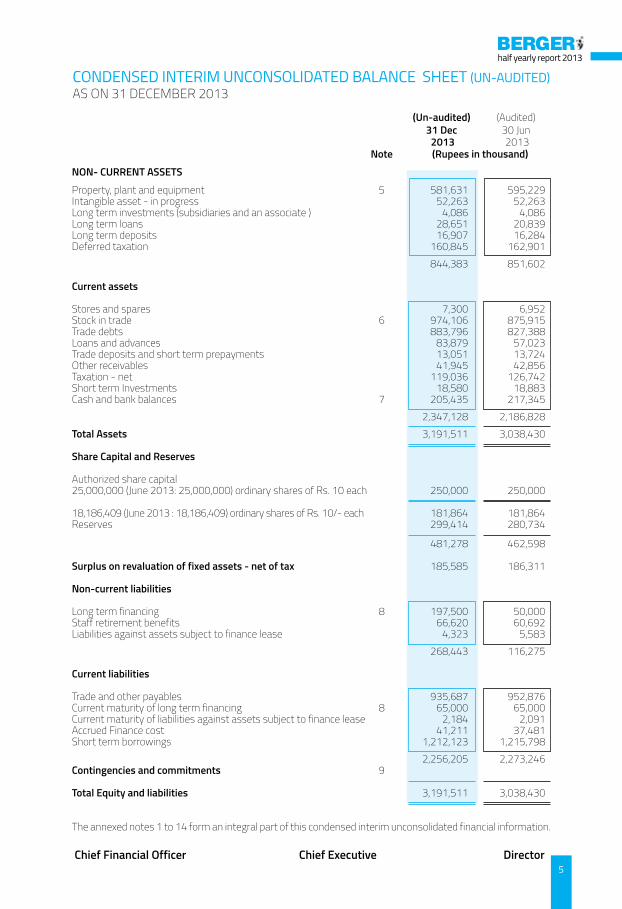
CONDENSED INTERIM UNCONSOLIDATED BALANCE SHEET (UN-AUDITED)AS ON 31 DECEMBER 2013
(Un-audited) (Audited) 31 Dec 30 Jun 2013 2013 Note (Rupees in thousand)NON- CURRENT ASSETS
Property, plant and equipment 5 581,631 595,229 Intangible asset - in progress 52,263 52,263 Long term investments (subsidiaries and an associate ) 4,086 4,086 Long term loans 28,651 20,839 Long term deposits 16,907 16,284 Deferred taxation 160,845 162,901 844,383 851,602 Current assets Stores and spares 7,300 6,952 Stock in trade 6 974,106 875,915 Trade debts 883,796 827,388 Loans and advances 83,879 57,023 Trade deposits and short term prepayments 13,051 13,724 Other receivables 41,945 42,856 Taxation - net 119,036 126,742 Short term Investments 18,580 18,883 Cash and bank balances 7 205,435 217,345 2,347,128 2,186,828 Total Assets 3,191,511 3,038,430 Share Capital and Reserves Authorized share capital 25,000,000 (June 2013: 25,000,000) ordinary shares of Rs. 10 each 250,000 250,000 18,186,409 (June 2013 : 18,186,409) ordinary shares of Rs. 10/- each 181,864 181,864 Reserves 299,414 280,734 481,278 462,598 Surplus on revaluation of fixed assets - net of tax 185,585 186,311 Non-current liabilities Long term financing 8 197,500 50,000 Staff retirement benefits 66,620 60,692 Liabilities against assets subject to finance lease 4,323 5,583 268,443 116,275 Current liabilities Trade and other payables 935,687 952,876 Current maturity of long term financing 8 65,000 65,000 Current maturity of liabilities against assets subject to finance lease 2,184 2,091 Accrued Finance cost 41,211 37,481 Short term borrowings 1,212,123 1,215,798 2,256,205 2,273,246 Contingencies and commitments 9 Total Equity and liabilities 3,191,511 3,038,430
The annexed notes 1 to 14 form an integral part of this condensed interim unconsolidated financial information.
Chief Financial Officer Chief Executive Director
6
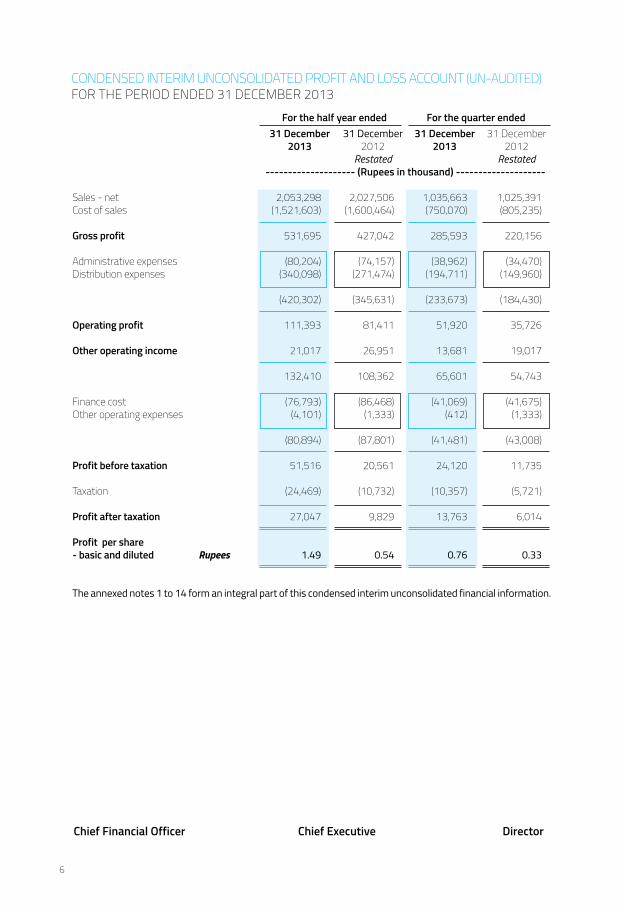
CONDENSED INTERIM UNCONSOLIDATED PROFIT AND LOSS ACCOUNT (UN-AUDITED)FOR THE PERIOD ENDED 31 DECEMBER 2013
Chief Financial Officer Chief Executive Director
For the half year ended For the quarter ended 31 December 31 December 31 December 31 December 2013 2012 2013 2012 Restated Restated -------------------- (Rupees in thousand) -------------------- Sales - net 2,053,298 2,027,506 1,035,663 1,025,391 Cost of sales (1,521,603) (1,600,464) (750,070) (805,235)
Gross profit 531,695 427,042 285,593 220,156 Administrative expenses (80,204) (74,157) (38,962) (34,470)Distribution expenses (340,098) (271,474) (194,711) (149,960)
(420,302) (345,631) (233,673) (184,430)
Operating profit 111,393 81,411 51,920 35,726 Other operating income 21,017 26,951 13,681 19,017
132,410 108,362 65,601 54,743 Finance cost (76,793) (86,468) (41,069) (41,675)Other operating expenses (4,101) (1,333) (412) (1,333)
(80,894) (87,801) (41,481) (43,008)
Profit before taxation 51,516 20,561 24,120 11,735 Taxation (24,469) (10,732) (10,357) (5,721) Profit after taxation 27,047 9,829 13,763 6,014 Profit per share - basic and diluted Rupees 1.49 0.54 0.76 0.33 The annexed notes 1 to 14 form an integral part of this condensed interim unconsolidated financial information.
half yearly report 2013
7
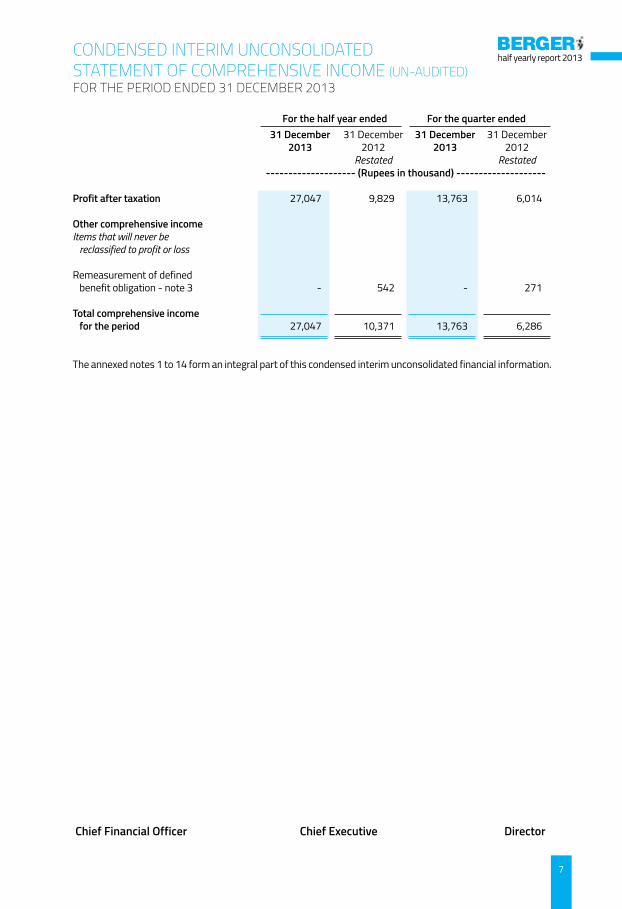
CONDENSED INTERIM UNCONSOLIDATED STATEMENT OF COMPREHENSIvE INCOME (UN-AUDITED)FOR THE PERIOD ENDED 31 DECEMBER 2013
Chief Financial Officer Chief Executive Director
For the half year ended For the quarter ended 31 December 31 December 31 December 31 December 2013 2012 2013 2012 Restated Restated -------------------- (Rupees in thousand) -------------------- Profit after taxation 27,047 9,829 13,763 6,014 Other comprehensive income Items that will never be reclassified to profit or loss Remeasurement of defined benefit obligation - note 3 - 542 - 271 Total comprehensive income for the period 27,047 10,371 13,763 6,286 The annexed notes 1 to 14 form an integral part of this condensed interim unconsolidated financial information.
8
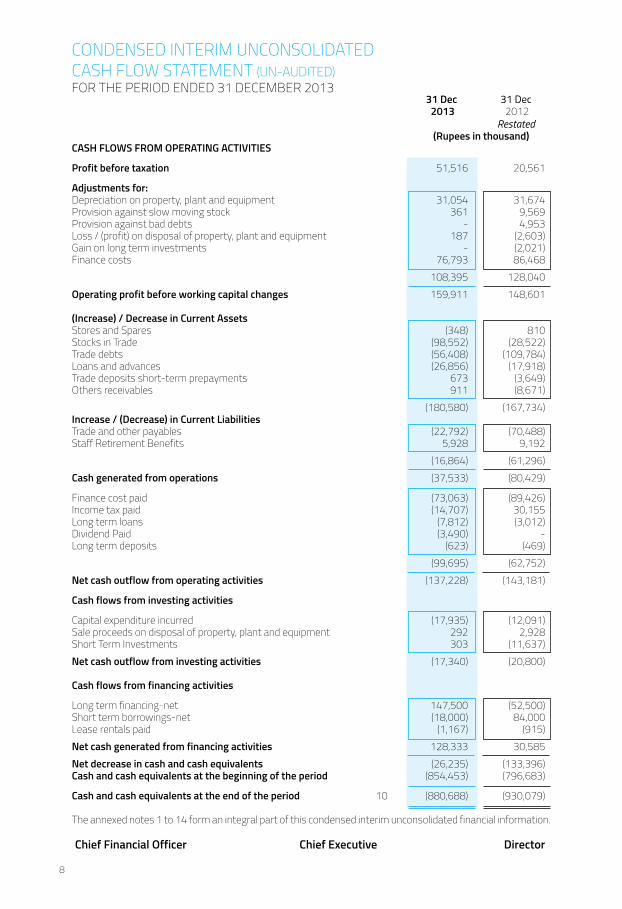
31 Dec 31 Dec 2013 2012
Restated (Rupees in thousand)CASH FLOWS FROM OPERATING ACTIVITIES Profit before taxation 51,516 20,561 Adjustments for: Depreciation on property, plant and equipment 31,054 31,674 Provision against slow moving stock 361 9,569 Provision against bad debts - 4,953 Loss / (profit) on disposal of property, plant and equipment 187 (2,603)Gain on long term investments - (2,021)Finance costs 76,793 86,468 108,395 128,040 Operating profit before working capital changes 159,911 148,601 (Increase) / Decrease in Current Assets Stores and Spares (348) 810 Stocks in Trade (98,552) (28,522)Trade debts (56,408) (109,784)Loans and advances (26,856) (17,918)Trade deposits short-term prepayments 673 (3,649)Others receivables 911 (8,671) (180,580) (167,734)Increase / (Decrease) in Current Liabilities Trade and other payables (22,792) (70,488)Staff Retirement Benefits 5,928 9,192 (16,864) (61,296)Cash generated from operations (37,533) (80,429) Finance cost paid (73,063) (89,426)Income tax paid (14,707) 30,155 Long term loans (7,812) (3,012)Dividend Paid (3,490) - Long term deposits (623) (469) (99,695) (62,752)Net cash outflow from operating activities (137,228) (143,181) Cash flows from investing activities Capital expenditure incurred (17,935) (12,091)Sale proceeds on disposal of property, plant and equipment 292 2,928 Short Term Investments 303 (11,637)Net cash outflow from investing activities (17,340) (20,800) Cash flows from financing activities Long term financing-net 147,500 (52,500)Short term borrowings-net (18,000) 84,000 Lease rentals paid (1,167) (915)Net cash generated from financing activities 128,333 30,585 Net decrease in cash and cash equivalents (26,235) (133,396)Cash and cash equivalents at the beginning of the period (854,453) (796,683)
Cash and cash equivalents at the end of the period 10 (880,688) (930,079) The annexed notes 1 to 14 form an integral part of this condensed interim unconsolidated financial information.
CONDENSED INTERIM UNCONSOLIDATED CASH FLOW STATEMENT (UN-AUDITED)FOR THE PERIOD ENDED 31 DECEMBER 2013
Chief Financial Officer Chief Executive Director
half yearly report 2013
9
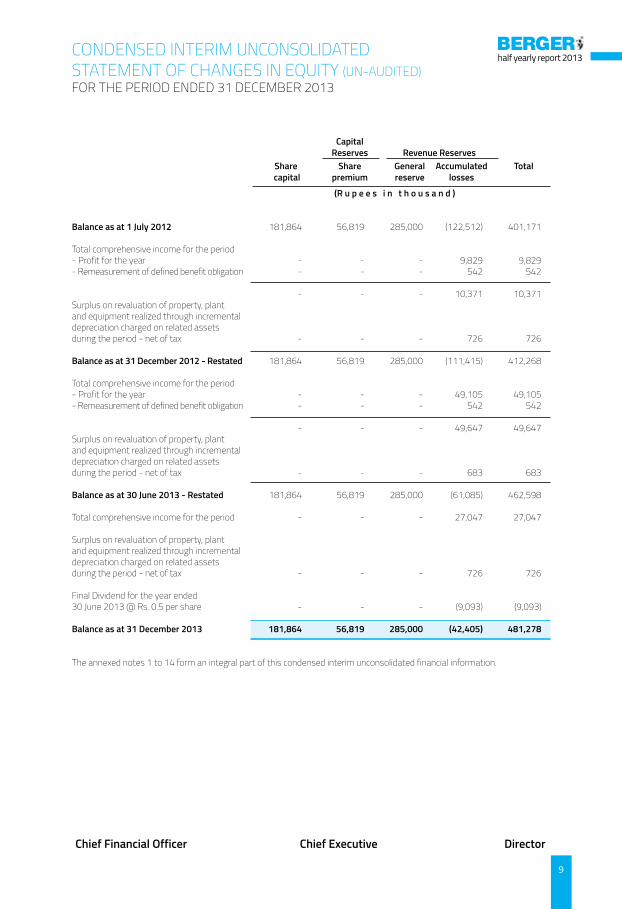
Capital Reserves Revenue Reserves Share Share General Accumulated Total capital premium reserve losses
(R u p e e s i n t h o u s a n d ) Balance as at 1 July 2012 181,864 56,819 285,000 (122,512) 401,171 Total comprehensive income for the period - Profit for the year - - - 9,829 9,829 - Remeasurement of defined benefit obligation - - - 542 542
- - - 10,371 10,371 Surplus on revaluation of property, plant and equipment realized through incremental depreciation charged on related assets during the period - net of tax - - - 726 726 Balance as at 31 December 2012 - Restated 181,864 56,819 285,000 (111,415) 412,268 Total comprehensive income for the period - Profit for the year - - - 49,105 49,105 - Remeasurement of defined benefit obligation - - - 542 542
- - - 49,647 49,647 Surplus on revaluation of property, plant and equipment realized through incremental depreciation charged on related assets during the period - net of tax - - - 683 683 Balance as at 30 June 2013 - Restated 181,864 56,819 285,000 (61,085) 462,598 Total comprehensive income for the period - - - 27,047 27,047 Surplus on revaluation of property, plant and equipment realized through incremental depreciation charged on related assets during the period - net of tax - - - 726 726 Final Dividend for the year ended 30 June 2013 @ Rs. 0.5 per share - - - (9,093) (9,093) Balance as at 31 December 2013 181,864 56,819 285,000 (42,405) 481,278
The annexed notes 1 to 14 form an integral part of this condensed interim unconsolidated financial information.
CONDENSED INTERIM UNCONSOLIDATED STATEMENT OF CHANGES IN EQUITY (UN-AUDITED)FOR THE PERIOD ENDED 31 DECEMBER 2013
Chief Financial Officer Chief Executive Director
10
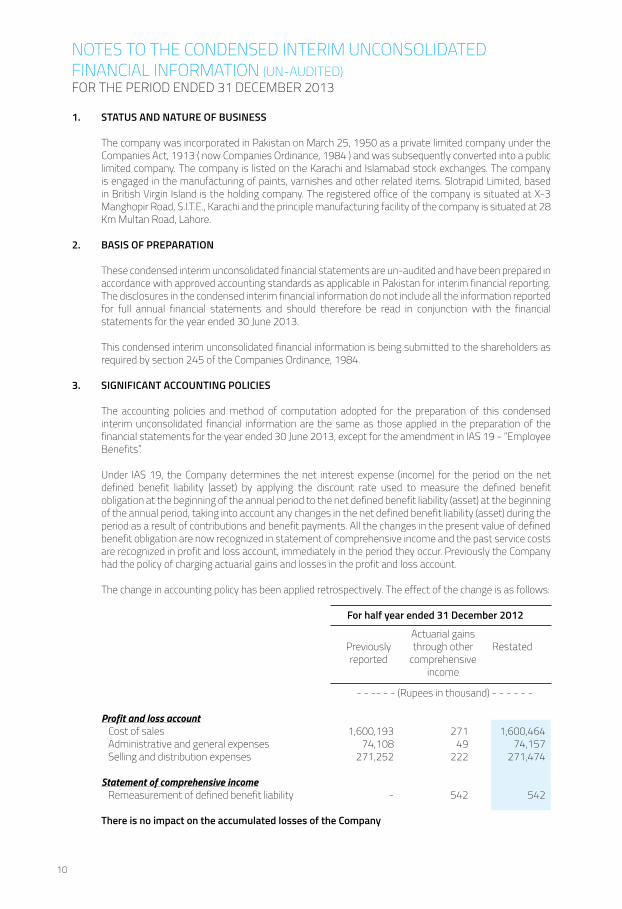
1. STATUS AND NATURE OF BUSINESS The company was incorporated in Pakistan on March 25, 1950 as a private limited company under the
Companies Act, 1913 ( now Companies Ordinance, 1984 ) and was subsequently converted into a public limited company. The company is listed on the Karachi and Islamabad stock exchanges. The company is engaged in the manufacturing of paints, varnishes and other related items. Slotrapid Limited, based in British virgin Island is the holding company. The registered office of the company is situated at X-3 Manghopir Road, S.I.T.E., Karachi and the principle manufacturing facility of the company is situated at 28 Km Multan Road, Lahore.
2. BASIS OF PREPARATION These condensed interim unconsolidated financial statements are un-audited and have been prepared in
accordance with approved accounting standards as applicable in Pakistan for interim financial reporting. The disclosures in the condensed interim financial information do not include all the information reported for full annual financial statements and should therefore be read in conjunction with the financial statements for the year ended 30 June 2013.
This condensed interim unconsolidated financial information is being submitted to the shareholders as
required by section 245 of the Companies Ordinance, 1984. 3. SIGNIFICANT ACCOUNTING POLICIES The accounting policies and method of computation adopted for the preparation of this condensed
interim unconsolidated financial information are the same as those applied in the preparation of the financial statements for the year ended 30 June 2013, except for the amendment in IAS 19 - “Employee Benefits”.
Under IAS 19, the Company determines the net interest expense (income) for the period on the net
defined benefit liability (asset) by applying the discount rate used to measure the defined benefit obligation at the beginning of the annual period to the net defined benefit liability (asset) at the beginning of the annual period, taking into account any changes in the net defined benefit liability (asset) during the period as a result of contributions and benefit payments. All the changes in the present value of defined benefit obligation are now recognized in statement of comprehensive income and the past service costs are recognized in profit and loss account, immediately in the period they occur. Previously the Company had the policy of charging actuarial gains and losses in the profit and loss account.
The change in accounting policy has been applied retrospectively. The effect of the change is as follows:
For half year ended 31 December 2012
Actuarial gains Previously through other Restated reported comprehensive income - - -- - - (Rupees in thousand) - - - - - - Profit and loss account Cost of sales 1,600,193 271 1,600,464 Administrative and general expenses 74,108 49 74,157 Selling and distribution expenses 271,252 222 271,474 Statement of comprehensive income Remeasurement of defined benefit liability - 542 542 There is no impact on the accumulated losses of the Company
NOTES TO THE CONDENSED INTERIM UNCONSOLIDATED FINANCIAL INFORMATION (UN-AUDITED)FOR THE PERIOD ENDED 31 DECEMBER 2013
half yearly report 2013
11
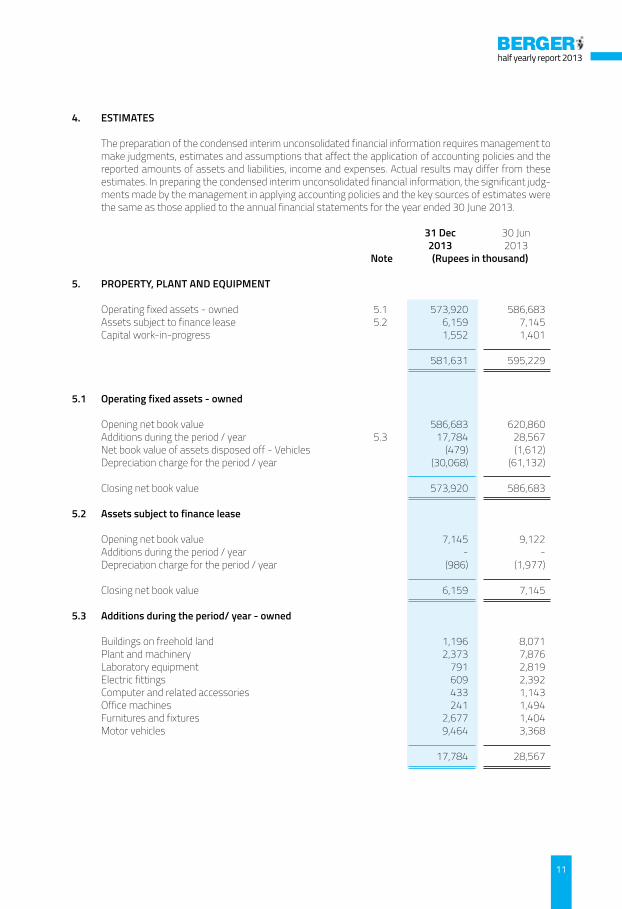
4. ESTIMATES The preparation of the condensed interim unconsolidated financial information requires management to
make judgments, estimates and assumptions that affect the application of accounting policies and the reported amounts of assets and liabilities, income and expenses. Actual results may differ from these estimates. In preparing the condensed interim unconsolidated financial information, the significant judg-ments made by the management in applying accounting policies and the key sources of estimates were the same as those applied to the annual financial statements for the year ended 30 June 2013.
31 Dec 30 Jun 2013 2013 Note (Rupees in thousand) 5. PROPERTy, PLANT AND EqUIPMENT Operating fixed assets - owned 5.1 573,920 586,683 Assets subject to finance lease 5.2 6,159 7,145 Capital work-in-progress 1,552 1,401
581,631 595,229 5.1 Operating fixed assets - owned Opening net book value 586,683 620,860 Additions during the period / year 5.3 17,784 28,567 Net book value of assets disposed off - vehicles (479) (1,612) Depreciation charge for the period / year (30,068) (61,132)
Closing net book value 573,920 586,683 5.2 Assets subject to finance lease Opening net book value 7,145 9,122 Additions during the period / year - - Depreciation charge for the period / year (986) (1,977)
Closing net book value 6,159 7,145 5.3 Additions during the period/ year - owned Buildings on freehold land 1,196 8,071 Plant and machinery 2,373 7,876 Laboratory equipment 791 2,819 Electric fittings 609 2,392 Computer and related accessories 433 1,143 Office machines 241 1,494 Furnitures and fixtures 2,677 1,404 Motor vehicles 9,464 3,368
17,784 28,567
12
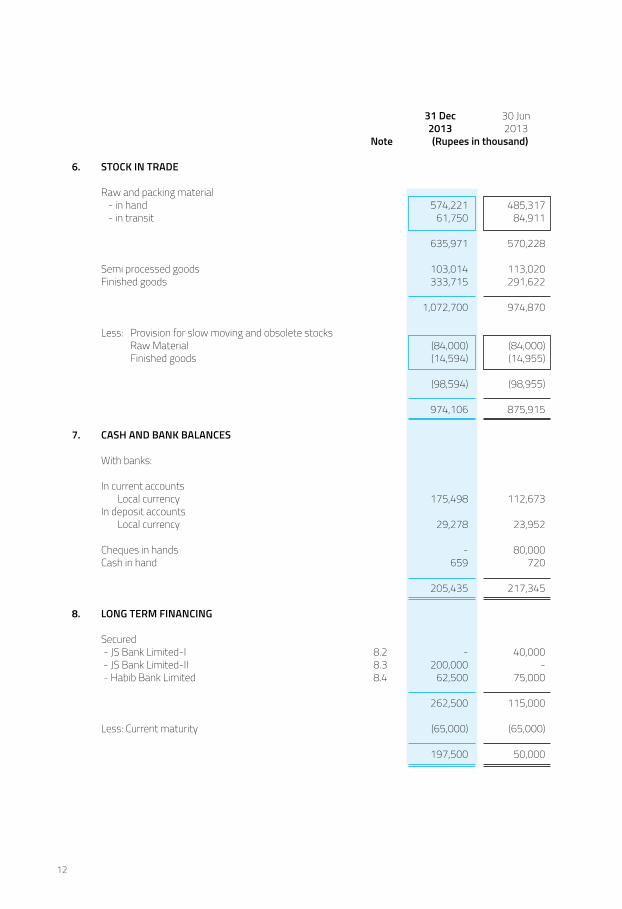
31 Dec 30 Jun 2013 2013 Note (Rupees in thousand) 6. STOCk IN TRADE Raw and packing material - in hand 574,221 485,317 - in transit 61,750 84,911
635,971 570,228 Semi processed goods 103,014 113,020 Finished goods 333,715 291,622
1,072,700 974,870 Less: Provision for slow moving and obsolete stocks Raw Material (84,000) (84,000) Finished goods (14,594) (14,955)
(98,594) (98,955)
974,106 875,915 7. CASH AND BANk BALANCES With banks: In current accounts Local currency 175,498 112,673 In deposit accounts Local currency 29,278 23,952 Cheques in hands - 80,000 Cash in hand 659 720
205,435 217,345 8. LONG TERM FINANCING Secured - JS Bank Limited-I 8.2 - 40,000 - JS Bank Limited-II 8.3 200,000 - - Habib Bank Limited 8.4 62,500 75,000
262,500 115,000 Less: Current maturity (65,000) (65,000)
197,500 50,000
half yearly report 2013
13
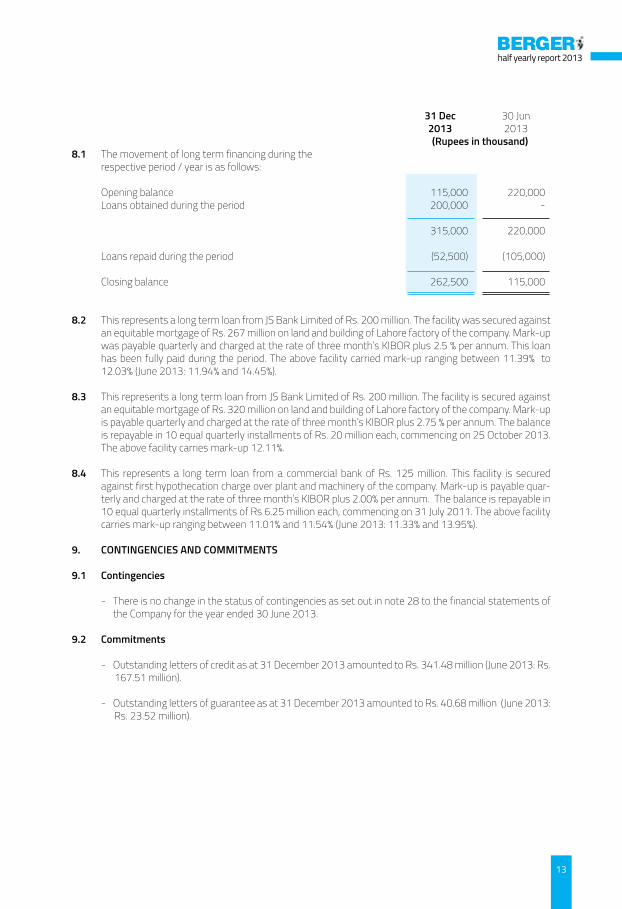
31 Dec 30 Jun 2013 2013 (Rupees in thousand)8.1 The movement of long term financing during the respective period / year is as follows: Opening balance 115,000 220,000 Loans obtained during the period 200,000 -
315,000 220,000 Loans repaid during the period (52,500) (105,000)
Closing balance 262,500 115,000
8.2 This represents a long term loan from JS Bank Limited of Rs. 200 million. The facility was secured against an equitable mortgage of Rs. 267 million on land and building of Lahore factory of the company. Mark-up was payable quarterly and charged at the rate of three month’s KIBOR plus 2.5 % per annum. This loan has been fully paid during the period. The above facility carried mark-up ranging between 11.39% to 12.03% (June 2013: 11.94% and 14.45%).
8.3 This represents a long term loan from JS Bank Limited of Rs. 200 million. The facility is secured against
an equitable mortgage of Rs. 320 million on land and building of Lahore factory of the company. Mark-up is payable quarterly and charged at the rate of three month’s KIBOR plus 2.75 % per annum. The balance is repayable in 10 equal quarterly installments of Rs. 20 million each, commencing on 25 October 2013. The above facility carries mark-up 12.11%.
8.4 This represents a long term loan from a commercial bank of Rs. 125 million. This facility is secured
against first hypothecation charge over plant and machinery of the company. Mark-up is payable quar-terly and charged at the rate of three month’s KIBOR plus 2.00% per annum. The balance is repayable in 10 equal quarterly installments of Rs 6.25 million each, commencing on 31 July 2011. The above facility carries mark-up ranging between 11.01% and 11.54% (June 2013: 11.33% and 13.95%).
9. CONTINGENCIES AND COMMITMENTS 9.1 Contingencies - There is no change in the status of contingencies as set out in note 28 to the financial statements of
the Company for the year ended 30 June 2013. 9.2 Commitments - Outstanding letters of credit as at 31 December 2013 amounted to Rs. 341.48 million (June 2013: Rs.
167.51 million). - Outstanding letters of guarantee as at 31 December 2013 amounted to Rs. 40.68 million (June 2013:
Rs. 23.52 million).
14
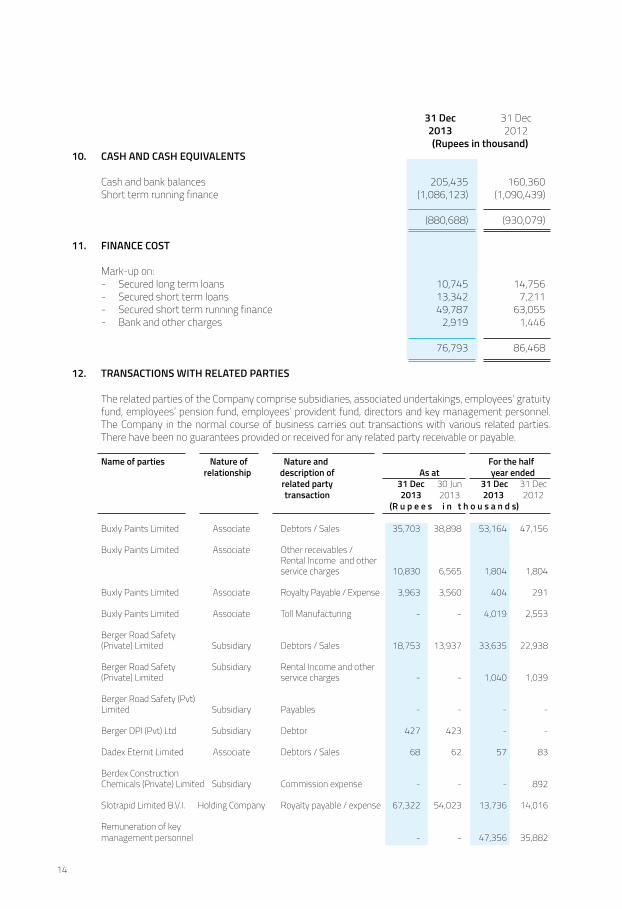
31 Dec 31 Dec 2013 2012 (Rupees in thousand)10. CASH AND CASH EqUIVALENTS Cash and bank balances 205,435 160,360 Short term running finance (1,086,123) (1,090,439)
(880,688) (930,079)
11. FINANCE COST Mark-up on: - Secured long term loans 10,745 14,756 - Secured short term loans 13,342 7,211 - Secured short term running finance 49,787 63,055 - Bank and other charges 2,919 1,446
76,793 86,468
12. TRANSACTIONS WITH RELATED PARTIES The related parties of the Company comprise subsidiaries, associated undertakings, employees’ gratuity
fund, employees’ pension fund, employees’ provident fund, directors and key management personnel. The Company in the normal course of business carries out transactions with various related parties. There have been no guarantees provided or received for any related party receivable or payable.
Name of parties Nature of Nature and For the half relationship description of As at year ended
related party 31 Dec 30 Jun 31 Dec 31 Dec transaction 2013 2013 2013 2012 (R u p e e s i n t h o u s a n d s)
Buxly Paints Limited Associate Debtors / Sales 35,703 38,898 53,164 47,156 Buxly Paints Limited Associate Other receivables / Rental Income and other service charges 10,830 6,565 1,804 1,804 Buxly Paints Limited Associate Royalty Payable / Expense 3,963 3,560 404 291 Buxly Paints Limited Associate Toll Manufacturing - - 4,019 2,553 Berger Road Safety (Private) Limited Subsidiary Debtors / Sales 18,753 13,937 33,635 22,938 Berger Road Safety Subsidiary Rental Income and other (Private) Limited service charges - - 1,040 1,039 Berger Road Safety (Pvt) Limited Subsidiary Payables - - - - Berger DPI (Pvt) Ltd Subsidiary Debtor 427 423 - - Dadex Eternit Limited Associate Debtors / Sales 68 62 57 83 Berdex Construction Chemicals (Private) Limited Subsidiary Commission expense - - - 892 Slotrapid Limited B.v.I. Holding Company Royalty payable / expense 67,322 54,023 13,736 14,016 Remuneration of key management personnel - - 47,356 35,882
half yearly report 2013
15
13. AUTHORIzATION This un-audited condensed interim financial information was authorized for issue by the Board of
Directors of the Company on 25 February 2014. 14. GENERAL 14.1 Figures have been rounded off to the nearest thousand of rupees unless otherwise stated. 14.2 Corresponding figures have been re-arranged or reclassified wherever necessary, for the purposes of
comparison. However, no significant re-arrangements or re-classification have been made. 14.3 All figures, except for 30 June 2013 figures, appearing in these condensed interim financial statements
are unaudited.
Chief Financial Officer Chief Executive Director

16
half yearly report 2013
17
CONDENSED INTERIM CONSOLIDATED FINANCIAL STATEMENTSFOR THE PERIOD ENDED
31 DECEMBER 2013
18
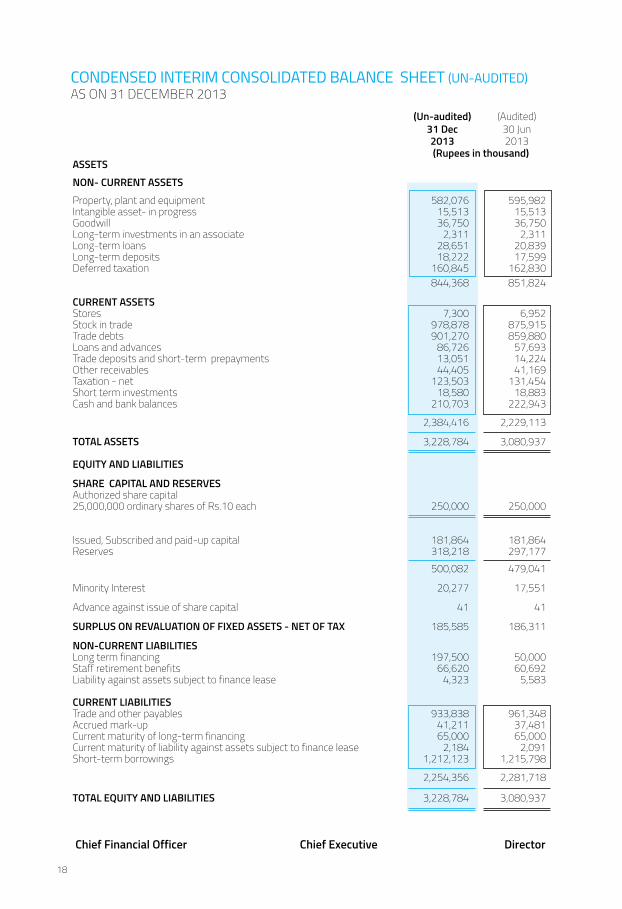
CONDENSED INTERIM CONSOLIDATED BALANCE SHEET (UN-AUDITED)AS ON 31 DECEMBER 2013 (Un-audited) (Audited) 31 Dec 30 Jun 2013 2013 (Rupees in thousand)ASSETSNON- CURRENT ASSETS
Property, plant and equipment 582,076 595,982 Intangible asset- in progress 15,513 15,513 Goodwill 36,750 36,750 Long-term investments in an associate 2,311 2,311 Long-term loans 28,651 20,839 Long-term deposits 18,222 17,599 Deferred taxation 160,845 162,830 844,368 851,824 CURRENT ASSETS Stores 7,300 6,952 Stock in trade 978,878 875,915 Trade debts 901,270 859,880 Loans and advances 86,726 57,693 Trade deposits and short-term prepayments 13,051 14,224 Other receivables 44,405 41,169 Taxation - net 123,503 131,454 Short term investments 18,580 18,883 Cash and bank balances 210,703 222,943
2,384,416 2,229,113 TOTAL ASSETS 3,228,784 3,080,937 EqUITy AND LIABILITIES SHARE CAPITAL AND RESERVES Authorized share capital 25,000,000 ordinary shares of Rs.10 each 250,000 250,000 Issued, Subscribed and paid-up capital 181,864 181,864 Reserves 318,218 297,177 500,082 479,041 Minority Interest 20,277 17,551 Advance against issue of share capital 41 41 SURPLUS ON REVALUATION OF FIXED ASSETS - NET OF TAX 185,585 186,311 NON-CURRENT LIABILITIES Long term financing 197,500 50,000 Staff retirement benefits 66,620 60,692 Liability against assets subject to finance lease 4,323 5,583 CURRENT LIABILITIES Trade and other payables 933,838 961,348 Accrued mark-up 41,211 37,481 Current maturity of long-term financing 65,000 65,000 Current maturity of liability against assets subject to finance lease 2,184 2,091 Short-term borrowings 1,212,123 1,215,798
2,254,356 2,281,718 TOTAL EqUITy AND LIABILITIES 3,228,784 3,080,937
Chief Financial Officer Chief Executive Director
half yearly report 2013
19
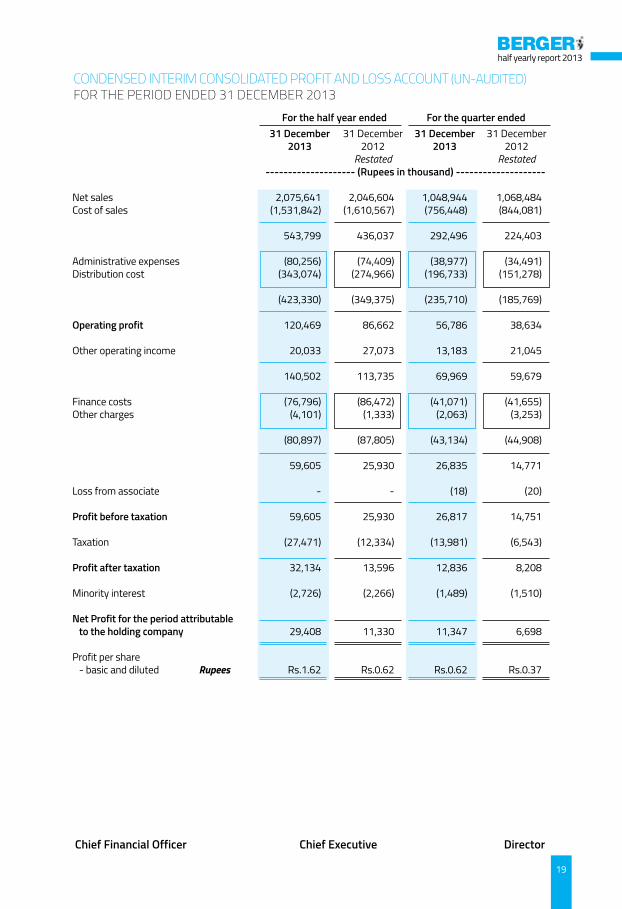
CONDENSED INTERIM CONSOLIDATED PROFIT AND LOSS ACCOUNT (UN-AUDITED)FOR THE PERIOD ENDED 31 DECEMBER 2013
Chief Financial Officer Chief Executive Director
For the half year ended For the quarter ended 31 December 31 December 31 December 31 December 2013 2012 2013 2012 Restated Restated -------------------- (Rupees in thousand) -------------------- Net sales 2,075,641 2,046,604 1,048,944 1,068,484 Cost of sales (1,531,842) (1,610,567) (756,448) (844,081)
543,799 436,037 292,496 224,403 Administrative expenses (80,256) (74,409) (38,977) (34,491)Distribution cost (343,074) (274,966) (196,733) (151,278)
(423,330) (349,375) (235,710) (185,769) Operating profit 120,469 86,662 56,786 38,634 Other operating income 20,033 27,073 13,183 21,045
140,502 113,735 69,969 59,679 Finance costs (76,796) (86,472) (41,071) (41,655)Other charges (4,101) (1,333) (2,063) (3,253)
(80,897) (87,805) (43,134) (44,908) 59,605 25,930 26,835 14,771 Loss from associate - - (18) (20)
Profit before taxation 59,605 25,930 26,817 14,751 Taxation (27,471) (12,334) (13,981) (6,543) Profit after taxation 32,134 13,596 12,836 8,208 Minority interest (2,726) (2,266) (1,489) (1,510) Net Profit for the period attributable to the holding company 29,408 11,330 11,347 6,698 Profit per share - basic and diluted Rupees Rs.1.62 Rs.0.62 Rs.0.62 Rs.0.37
20
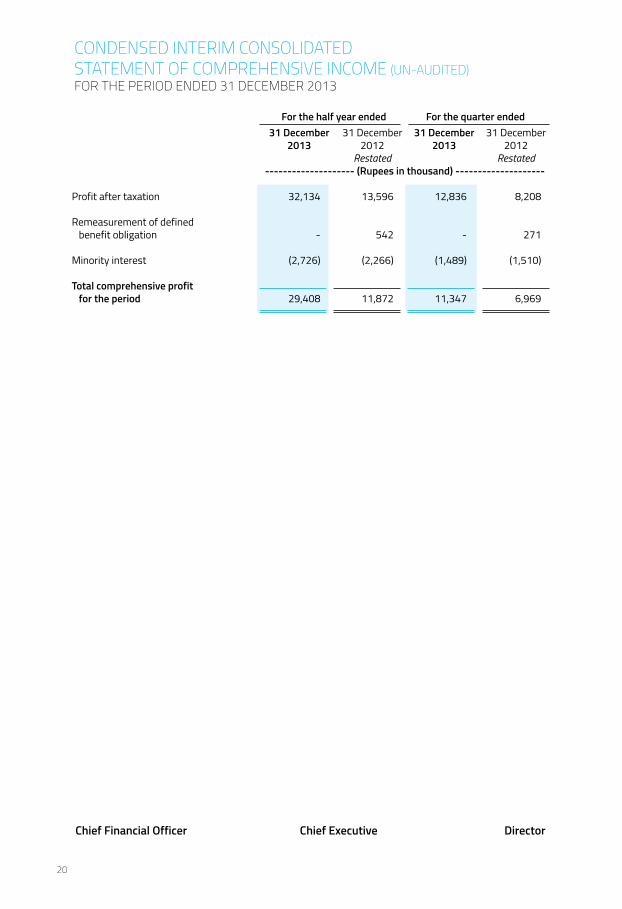
CONDENSED INTERIM CONSOLIDATED STATEMENT OF COMPREHENSIvE INCOME (UN-AUDITED)FOR THE PERIOD ENDED 31 DECEMBER 2013
Chief Financial Officer Chief Executive Director
For the half year ended For the quarter ended 31 December 31 December 31 December 31 December 2013 2012 2013 2012 Restated Restated -------------------- (Rupees in thousand) -------------------- Profit after taxation 32,134 13,596 12,836 8,208 Remeasurement of defined benefit obligation - 542 - 271 Minority interest (2,726) (2,266) (1,489) (1,510) Total comprehensive profit for the period 29,408 11,872 11,347 6,969
half yearly report 2013
21
31 Dec 31 Dec 2013 2012
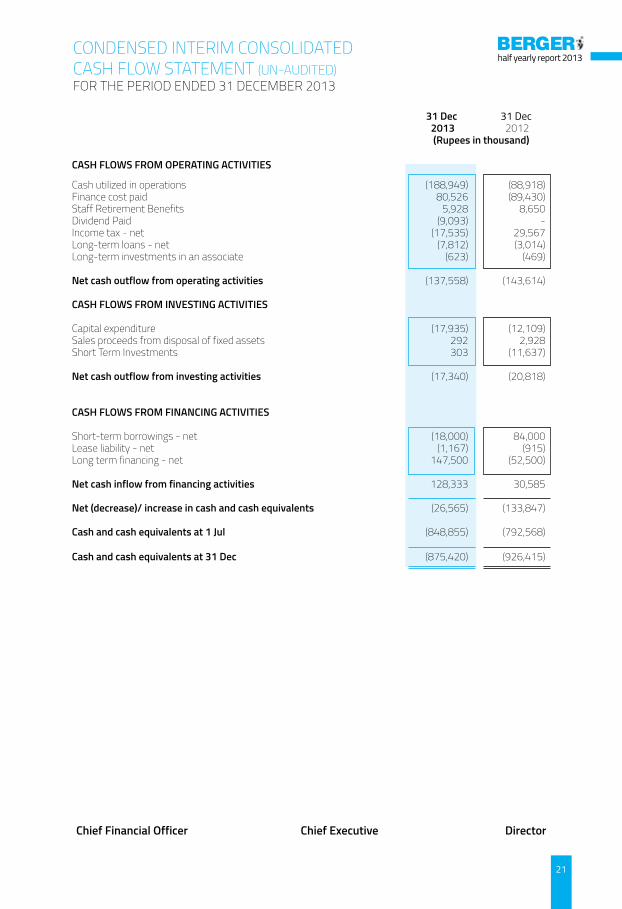
(Rupees in thousand) CASH FLOWS FROM OPERATING ACTIVITIES Cash utilized in operations (188,949) (88,918)Finance cost paid 80,526 (89,430)Staff Retirement Benefits 5,928 8,650 Dividend Paid (9,093) - Income tax - net (17,535) 29,567 Long-term loans - net (7,812) (3,014)Long-term investments in an associate (623) (469)
Net cash outflow from operating activities (137,558) (143,614) CASH FLOWS FROM INVESTING ACTIVITIES Capital expenditure (17,935) (12,109)Sales proceeds from disposal of fixed assets 292 2,928 Short Term Investments 303 (11,637)
Net cash outflow from investing activities (17,340) (20,818) CASH FLOWS FROM FINANCING ACTIVITIES Short-term borrowings - net (18,000) 84,000 Lease liability - net (1,167) (915)Long term financing - net 147,500 (52,500)
Net cash inflow from financing activities 128,333 30,585 Net (decrease)/ increase in cash and cash equivalents (26,565) (133,847) Cash and cash equivalents at 1 Jul (848,855) (792,568) Cash and cash equivalents at 31 Dec (875,420) (926,415)
CONDENSED INTERIM CONSOLIDATED CASH FLOW STATEMENT (UN-AUDITED)FOR THE PERIOD ENDED 31 DECEMBER 2013
Chief Financial Officer Chief Executive Director
22
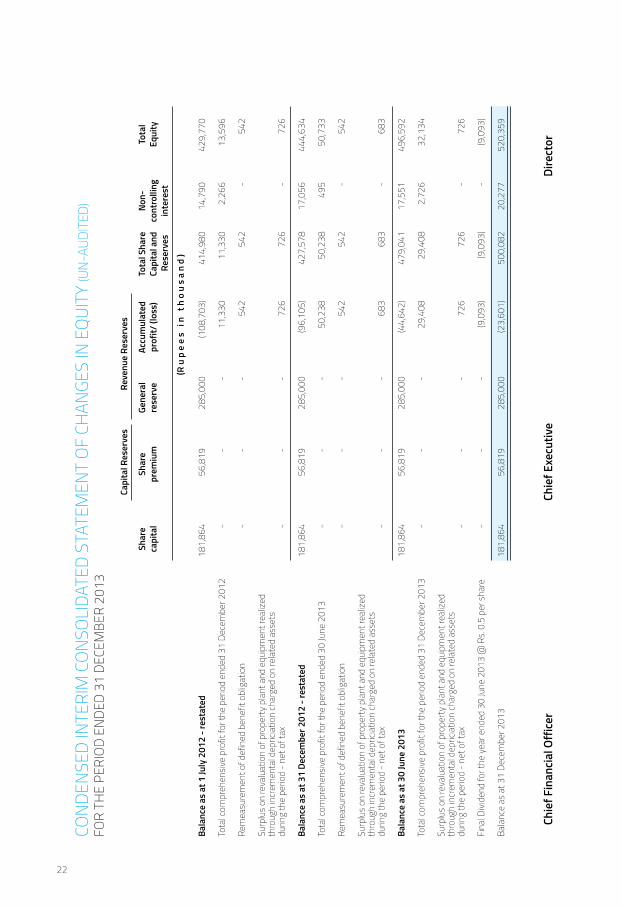
Chi
ef F
inan
cial O
ffice
r Ch
ief E
xecu
tive
Dire
ctor
Capi
tal R
eser
ves
Rev
enue
Res
erve
s
S
hare
Sh
are
Gene
ral
Accu
mul
ated
To
tal S
hare
No
n-
Tota
l
capi
tal
prem
ium
re
serv
e
prof
it/ (l
oss)
Ca
pita
l and
co
ntro
lling
Eq
uity
R
eser
ves
in
tere
st
(
R u
p e
e s
i n
t h
o u
s a
n d
)
Ba
lanc
e as
at 1
July
201
2 - r
esta
ted
181
,864
5
6,81
9
285
,000
(1
08,7
03)
414
,980
1
4,79
0
429
,770
Tota
l com
preh
ensiv
e pr
ofit
for t
he p
erio
d en
ded
31 D
ecem
ber 2
012
-
-
-
11,
330
1
1,33
0
2,2
66
13,
596
Rem
easu
rem
ent o
f def
ined
ben
efit
oblig
atio
n -
-
-
5
42
542
-
5
42
Surp
lus
on re
valu
atio
n of
pro
pert
y pl
ant a
nd e
quip
men
t rea
lized
th
roug
h in
crem
enta
l dep
ricia
tion
char
ged
on re
late
d as
sets
du
ring
the
perio
d -
net o
f tax
-
-
-
7
26
726
-
7
26
Ba
lanc
e as
at 3
1 De
cem
ber 2
012
- res
tate
d 1
81,8
64
56,
819
2
85,0
00
(96,
105)
4
27,5
78
17,
056
4
44,6
34
To
tal c
ompr
ehen
sive
prof
it fo
r the
per
iod
ende
d 30
June
201
3 -
-
-
5
0,23
8 5
0,23
8
495
5
0,73
3
Rem
easu
rem
ent o
f def
ined
ben
efit
oblig
atio
n -
-
-
5
42
542
-
5
42
Su
rplu
s on
reva
luat
ion
of p
rope
rty
plan
t and
equ
ipm
ent r
ealiz
ed
thro
ugh
incr
emen
tal d
epric
iatio
n ch
arge
d on
rela
ted
asse
ts
durin
g th
e pe
riod
- ne
t of t
ax
-
-
-
683
6
83
-
683
Bala
nce
as a
t 30
June
201
3 1
81,8
64
56,
819
2
85,0
00
(44,
642)
4
79,0
41
17,
551
4
96,5
92
To
tal c
ompr
ehen
sive
prof
it fo
r the
per
iod
ende
d 31
Dec
embe
r 201
3 -
-
-
2
9,40
8
29,
408
2
,726
3
2,13
4
Surp
lus
on re
valu
atio
n of
pro
pert
y pl
ant a
nd e
quip
men
t rea
lized
th
roug
h in
crem
enta
l dep
ricia
tion
char
ged
on re
late
d as
sets
du
ring
the
perio
d -
net o
f tax
-
-
-
7
26
726
-
7
26
Fi
nal D
ivide
nd fo
r the
yea
r end
ed 3
0 Ju
ne 2
013
@ R
s. 0.
5 pe
r sha
re
-
-
-
(9,0
93)
(9,0
93)
-
(9,0
93)
Ba
lanc
e as
at 3
1 De
cem
ber 2
013
181
,864
5
6,81
9
285
,000
(2
3,60
1)
500
,082
2
0,27
7
520
,359
CON
DEN
SED
INTE
RIM
CO
NSO
LIDA
TED
STAT
EMEN
T O
F CH
ANGE
S IN
EQ
UITY
(UN-
AUDI
TED)
FOR
THE
PERI
OD
ENDE
D 31
DEC
EMBE
R 20
13
half yearly report 2013
23

24