percent growth in gdp 8.0 global economic prospects january 2012 sub...
TRANSCRIPT
Global Economic Prospects January 2012 Sub-Saharan Africa Annex
Recent developments
Despite multiple shocks - heightened uncertainty
and slowdown in the global economy, volatile
and high fuel and food prices, disruptions to
supply chains from the Tohoku earthquake, and
bad weather conditions for some countries in the
region - growth in Sub-Saharan Africa continued
briskly in 2011.
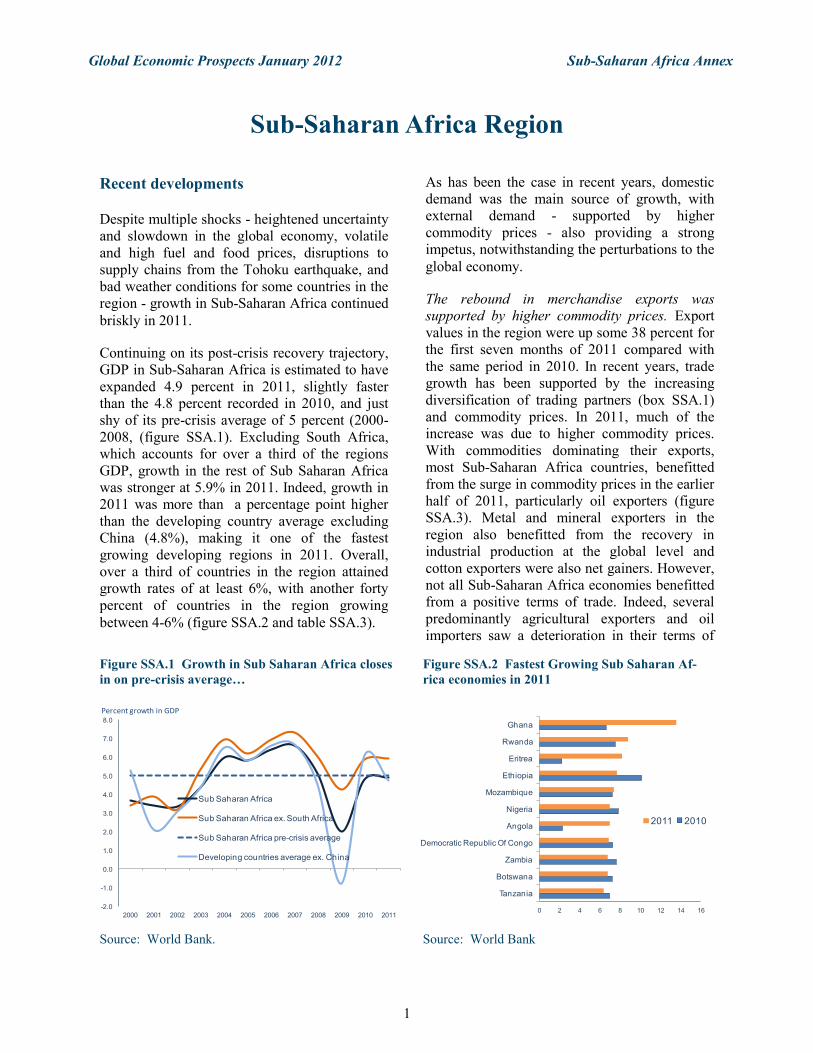
Continuing on its post-crisis recovery trajectory,
GDP in Sub-Saharan Africa is estimated to have
expanded 4.9 percent in 2011, slightly faster
than the 4.8 percent recorded in 2010, and just
shy of its pre-crisis average of 5 percent (2000-
2008, (figure SSA.1). Excluding South Africa,
which accounts for over a third of the regions
GDP, growth in the rest of Sub Saharan Africa
was stronger at 5.9% in 2011. Indeed, growth in
2011 was more than a percentage point higher
than the developing country average excluding
China (4.8%), making it one of the fastest
growing developing regions in 2011. Overall,
over a third of countries in the region attained
growth rates of at least 6%, with another forty
percent of countries in the region growing
between 4-6% (figure SSA.2 and table SSA.3).
As has been the case in recent years, domestic
demand was the main source of growth, with
external demand - supported by higher
commodity prices - also providing a strong
impetus, notwithstanding the perturbations to the
global economy.
The rebound in merchandise exports was
supported by higher commodity prices. Export
values in the region were up some 38 percent for
the first seven months of 2011 compared with
the same period in 2010. In recent years, trade
growth has been supported by the increasing
diversification of trading partners (box SSA.1)
and commodity prices. In 2011, much of the
increase was due to higher commodity prices.
With commodities dominating their exports,
most Sub-Saharan Africa countries, benefitted
from the surge in commodity prices in the earlier
half of 2011, particularly oil exporters (figure
SSA.3). Metal and mineral exporters in the
region also benefitted from the recovery in
industrial production at the global level and
cotton exporters were also net gainers. However,
not all Sub-Saharan Africa economies benefitted
from a positive terms of trade. Indeed, several
predominantly agricultural exporters and oil
importers saw a deterioration in their terms of
Sub-Saharan Africa Region
Figure SSA.1 Growth in Sub Saharan Africa closes
in on pre-crisis average…
Source: World Bank.
-2.0
-1.0
0.0
1.0
2.0
3.0
4.0
5.0
6.0
7.0
8.0
2000 2001 2002 2003 2004 2005 2006 2007 2008 2009 2010 2011
Sub Saharan Africa
Sub Saharan Africa ex. South Africa
Sub Saharan Africa pre-crisis average
Developing countries average ex. China
Percent growth in GDP
Figure SSA.2 Fastest Growing Sub Saharan Af-
rica economies in 2011
Source: World Bank
0 2 4 6 8 10 12 14 16
Tanzania
Botswana
Zambia
Democratic Republic Of Congo
Angola
Nigeria
Mozambique
Ethiopia
Eritrea
Rwanda
Ghana
2011 2010
1

Global Economic Prospects January 2012 Sub-Saharan Africa Annex
trade. For a number of countries, these shocks
compromised the re lat ively s table
macroeconomic environment they had hitherto
enjoyed (e.g. Ethiopia and Kenya).
Though commodity prices were the main driver
of the increase in export values, thanks to
increased exploratory activities, new mineral
exports continue to come on stream in several
countries, augmenting volumes and boosting
growth. Ghana, the region‘s fastest growing
economy in 2011, benefitted from the
commencement of oil exports. Mozambique also
began exporting coal from its large Moatize
mine, and Liberia and Sierra Leone commenced
iron-ore exports.
Services exports, mainly tourism, also picked up.
According to the World Tourism Organization,
international tourist arrivals were up 7 percent in
Sub-Saharan Africa for the first eight months of
2011, compared with the same period in 2010.
The slower growth in Europe does not appear to
have limited tourism arrivals, in part because
tourist arrivals to competing destinations in
North Africa were hurt by the Arab Spring
uprisings. In addition, a number of tourist
destinations in the region were successful in
attracting new tourists from Asian countries. For
example, in Mauritius, where European tourists
account for some 64 percent of tourist arrivals,
arrivals from Europe grew at 3.8 percent,
whereas arrivals from Asia increased by 21.7
percent (53.6 percent increase from China)
during the first half of 2011.
Increased export earnings provided the needed
foreign exchange to boost capital goods imports.
The value of capital goods imports increased by
32.2 percent during the first seven months of
2011, compared with the same period in 2010.
With infrastructure a binding constraint and
obsolete machinery impairing productivity, the
ability to obtain capital goods is critical for
growth over the long term. Indeed, several
studies on the determinants of long-run growth
Box SSA.1 Changing dynamics of trading partners
Growth in Sub-Saharan Africa exports has been supported by strong demand from other developing countries, in
particular China, given its relatively high resource intensity in production and its fast growth rate. Though high-
income countries are the destination for some 57 percent of the exports originating from Sub-Saharan Africa, weak
growth means that their contribution to the total growth of the sub-continent‘s exports is much smaller. As a result,
the share of high-income countries in total Sub-Saharan exports is falling. For instance in 2002, the EU accounted
for some 40 percent of all exports from Sub-Saharan Africa, but by 2010 that share had fallen to about 25 percent
– while China‘s share has increased from about 5 percent to 19 percent over the same period. For the first seven
months of 2011, growth in exports destined for China from Sub-Saharan Africa was 10 percentage points higher
than those destined for high-income countries.
Further, even though intra-regional trade in Sub-Saharan Africa remains well below potential due to weak infra-
structure, lack of harmonization of trade policies and cumbersome border procedures, recent efforts to address
these deficiencies are beginning to bear fruit. In East Africa where trade integration is more advanced, intra-
regional trade has been expanding relatively rapidly. According to data from the Central Bank of Kenya, exports to
other East African Community members (Uganda, Tanzania and Rwanda), during the first seven months of 2011,
exceeded its combined exports to traditional trading partners such as the U.K, Netherlands, Germany, France, as
well as the US.
Figure SSA.3 Oil Exporters benefit the most from
Terms of Trade changes
Source: World Bank
-15 -10 -5 0 5 10 15 20 25
Seychelles
Cape Verde
Lesotho
Kenya
Eritrea
Senegal
Mauritius
Sierra Leone
Malawi
Mali
Benin
Zambia
Nigeria
Angola
Gabon
Congo, Rep.
Equatorial Guinea
Terms of Trade changes as share of GDP (%) , January -September 2011.
2

Global Economic Prospects January 2012 Sub-Saharan Africa Annex
in Sub-Saharan Africa countries find
infrastructure investment to be a robust
determinant.1
Foreign direct investment flows to Sub-Saharan
Africa picked up in 2011. According to World
Bank estimates (table SSA.1), FDI flows to Sub-
Saharan Africa increased by 25 percent in 2011
following two years of decline (declines were
concentrated among the region‘s three largest
economies - Angola, Nigeria, and South Africa -
with the rest of the region experiencing gains).
Supported by high commodity prices and
regulatory improvements, the extractive sector
has attracted much of the increase in the value of
FDI flows to Sub-Saharan Africa. For many
countries in the region, FDI in the oil, base
metals, and minerals sectors underpins much of
the strong GDP growth in recent years (e.g.
Angola, Congo Republic, and Niger).
Unfortunately, the enclave nature of extractive
activities, means that such FDI flows to the
sector have generated fewer linkages to the rest
of the economy, and with the capital intensive
nature of investments, this likely means limited
job creation.
However, foreign investment (mainly private
equity—see box SSA.2) in the non-extractive
sector has also picked up in recent years –
reflecting opportunities opened up by strong
growth in the region, improved regulation, a
growing middle class with higher discretionary
income ($275 billion by one estimate), the fast
pace of urbanization which makes it easier to
reach consumers, and one of the highest rates of
return globally (UNCTAD, World Investment
Report, 2008).
Government public investment projects,
sometimes in partnership with others, continued
to support Sub-Saharan Africa growth in 2011.
With weak infrastructure identified as one of the
main binding constraints and with an estimated
infrastructural funding gap of some $32 billion
p.a (World Bank 2009), recent public
investments have focused on power,
Table SSA.1 Net capital flows to Sub-Saharan Africa
Source: World Bank.
$ billions
2004 2005 2006 2007 2008 2009 2010 2011e 2012f 2013f
Current account balance 2.2 19.4 19.8 -0.9 -11.9 -28.1 -37.7 -5.8 -11.1 -13.0
as % of GDP 0.4 3.1 2.7 -0.1 -1.2 -3.0 -3.5 -0.5 -0.9 -0.9
Financial flows:
Net private and official inflows 24.2 33.6 38.4 52.6 42.6 47.2 53.5 62.8
Net private inflows (equity+private debt) 21.9 34.5 40.4 49.8 37.6 37.4 40.5 48.2 45.8 60.0
..Net private inflows (% GDP) 4.0 5.4 5.4 5.8 3.8 4.0 3.7 3.9 3.5 4.4
Net equity inflows 17.8 26.6 33.0 38.4 31.8 43.0 36.5 39.5 40.3 52.0
..Net FDI inflows 11.2 18.6 16.2 28.3 37.5 32.8 28.5 35.6 35.8 47.0
..Net portfolio equity inflows 6.7 8.1 16.8 10.1 -5.7 10.2 8.0 3.9 4.5 5.0
Net debt flows 6.4 6.9 5.4 14.6 10.0 5.1 16.3
..Official creditors 2.3 -0.9 -1.9 2.8 4.9 9.8 13.0 14.6
....World Bank 2.5 2.4 2.2 2.4 1.9 3.1 4.0 4.2
....IMF -0.1 -0.4 -0.1 0.1 0.7 2.2 1.2 1.0
....Other official 0.0 -2.9 -3.8 0.3 2.3 4.5 7.9 9.4
..Private creditors 4.0 7.9 7.4 11.3 5.9 -5.6 3.9 8.7 5.5 8.0
....Net M-L term debt flows 2.7 4.9 -2.0 7.1 1.4 4.3 2.5 10.7
......Bonds 0.6 1.3 0.3 6.5 -0.7 1.9 1.4 7.2
......Banks 2.4 3.8 -1.7 1.3 2.2 1.6 0.7 3.5
......Other private -0.3 -0.3 -0.7 -0.8 -0.1 0.8 0.4 0.0
....Net short-term debt flows 1.4 3.0 9.4 4.3 4.5 -9.9 1.5 -2.0
Balancing item /a -4.7 -33.1 -25.8 -24.8 -19.8 -16.4 -17.6 -40.2
Change in reserves (- = increase) -21.6 -20.0 -32.4 -26.9 -10.9 -2.7 1.8 -16.7
Memorandum items
Migrant remittances /b 8.3 9.6 12.8 18.8 21.7 20.2 21.1 22.7 24.1 25.7
Source: The World Bank
Note :
e = estimate, f = forecast
/a Combination of errors and omissions and transfers to and capital outflows from developing countries.
/b Migrant remittances are defined as the sum of workers‘ remittances, compensation of employees, and migrant transfers
3

Global Economic Prospects January 2012 Sub-Saharan Africa Annex
transportation, and port infrastructure facilities.
Though a past legacy of low returns on public
investment raises questions on its efficacy, a
recent study (Gupta and others, 2011) suggests
that the productivity of public capital in low and
middle income countries is significantly
improved once adjustments are made for
shortcomings in the investment process (e.g.
bidding processes). Thus, given recent
improvements in governance that have occurred
in recent years, the productivity and ultimately
the social benefits of public capital spending in
Sub-Saharan Africa may have improved.
Increasingly, in addition to development finance
institutions and donor-supported programs, Sub-
Saharan Africa governments are issuing long-
term debt instruments (mainly local and foreign
sovereign bonds). For example, Namibia made
its first entry into the offshore bond market in
October 2011, issuing $500 million in 10-year
bonds. And in Ghana, which has already issued
Euro bonds, the government is extending the
yield curve of its local bonds by planning on
issuing 10-year fixed rate bonds to finance
infrastructure projects contained in its 2012
budget. Further, governments in many resource
rich Sub-Saharan Africa countries are leveraging
their resources in support of infrastructural
projects. Some prominent reported loan
agreements at various stages of ratification
involving China in 2011 include: a $5.8 billion
agreement with the Governments of Guinea
(alumina refinery, power plants, port); $3 billion
agreement with the Government of Ghana (gas
pipeline, mineral processing, agro-industrial
ventures); and a $1 billion agreement with the
Tanzanian Government (gas pipeline). The
Forum on China-Africa Cooperation estimates
that since 2000, some 2000 Chinese companies
have built 60,000km of road in Africa and 3.5
million KW in power generation.
Changes in fiscal balances depended on the
composition of exports. The direction of shifts in
fiscal balances in 2011 depended on the
composition of exports (figure SSA.4). Prudent
macroeconomic management over the past
decade has underpinned the robust growth
performance in Sub-Saharan Africa. However,
Box SSA.2 Recent private equity activity in Sub-Saharan Africa
In 2010, ECP Africa Fund raised the then record amount of $613m for an Africa focused fund, however in 2011,
the London-based Helios Investment Partners announced that it had succeeded in raising $900 million (the fund
was oversubscribed by a $1 billion) for its Africa dedicated fund. Several other Africa dedicated funds continue
to be launched, including from the Carlyle Group – the second largest private equity fund globally - which plans
on raising a reported $750 million fund.
Further evidence of increased private equity investment in the region is the 21.9 percent increase in cross-border
mergers and acquisitions during the first nine months of 2011, according to estimates from UNCTAD. Signifi-
cant transactions in 2011 included the $2.4 billion purchase of the South African retail giant Massmart (which
has operations in over a dozen countries in the region) by Walmart – the world‘s largest retailer.
Firms from Sub-Saharan Africa are also participating in cross-border equity investments. In the retail sector
South African mega retailers (Massmart, Shoprite etc) have been very active in carrying out acquisitions or
greenfield investment in several countries in the region; Nigerian bankers have set up branches across West Af-
rica and are increasing their foot prints elsewhere; and in East Africa firms can now cross-list across the different
bourses in the region.
Figure SSA.4 Fiscal balances deteriorate for non-
resource rich and improve for oil exporters
Source: IMF WEO database and World Bank
-8.0
-6.0
-4.0
-2.0
0.0
2.0
4.0
6.0
8.0
10.0
12.0
14.0
Non-resource rich Non-oil resource rich Oil Exporters
2007 2008 2009 2010 2011
(% share of GDP)
4

Global Economic Prospects January 2012 Sub-Saharan Africa Annex
the implementation of countercyclical fiscal
policy by some countries in the region in
response to the financial crisis, and the rise in
fuel and food prices in 2011 (which was
mitigated in some Sub-Saharan Africa countries
by increased subsidies) has reduced their fiscal
buffers in the event of a significant downturn in
the global economy. The situation however
differs by country. On the one hand, oil
exporters had a fiscal surplus of 5.4 percent of
GDP in 2011, up from 1.3 percent in 2010,
thanks to the higher oil prices. However, non-oil
exporter‘s fiscal balances deteriorated further in
2011 to a deficit of 5.3 percent from 4.3 percent
in 2010. Even among the non-oil exporters there
were differences in performance; with resource
rich non-oil exporters, mostly metal and mineral
exporters keeping their deficits steady, while for
other non-oil and non-mineral exporters the
deficits widened by 1.7 percentage points to 5.7
percent in 2011, thus giving them limited fiscal
space to maneuver in the event of another
significant global downturn.
Private consumption expenditures, which
accounts for some 60 percent of Sub-Saharan
Africa GDP, has picked up in recent years. This
rise in consumption has been supported by
recent robust GDP growth rates (box SSA.3).
Using three-year moving averages to smooth the
volatility in data, private consumption growth
has picked up from a low of 0.1 percent in 1994
to a pre-crisis peak of 6.3 percent in 2007 (figure
SSA.5). It fell with the 2008/9 crisis and has
averaged 4.2 percent during 2009-2011 and is
projected to pick-up over the forecast horizon.
Survey data on retail spending are unavailable
for many countries in the region, making it
difficult to gauge recent developments in private
consumption. Data on car imports (excluding
trucks and buses) suggest strong growth, at least
among wealthier consumers. Imports of cars rose
by 31.2 percent in the first seven months of 2011
compared with the same period of 2010. The
strength of consumer spending in 2011 was
supported by a variety of factors, including
rising incomes, improved access to credit, real
wage increases and historically low interest rates
(e.g. South Africa).
Inflation picked up in a number of Sub-Saharan
Africa countries. Median headline inflation in
the region rose from 4.3 percent by the end of
2010 to 7.0% within the first five months of
2011, and after a few months of slow down in
inflationary pressures picked up again in
September to 7.2 percent (figure SSA.6).
However, the situation across countries in the
region reflects significant differences.
Median inflation in Sub-Saharan Africa oil
exporters remained unchanged during the first
six months of 2011. However, due to the
escalation in oil and food prices during this
period, inflation picked up among non-oil
exporters in the region, with land-locked non-oil
Figure SSA.5 Growth of Private Consumption in
Sub Saharan Africa
Source: World Bank
0.0
1.0
2.0
3.0
4.0
5.0
6.0
7.0
1983 1985 1987 1989 1991 1993 1995 1997 1999 2001 2003 2005 2007 2009 2011
3-year moving average of real private consumption
Trend line
Private consumption (3 yr moving average)
Figure SSA.6 Inflationary pressures pick-up in
Sub Saharan Africa…
Source: World Bank
2.0
3.0
4.0
5.0
6.0
7.0
8.0
2010M01 2010M05 2010M09 2011M01 2011M05 2011M09
(%,ch)
5

Global Economic Prospects January 2012 Sub-Saharan Africa Annex
exporters experiencing the highest increase in
headline inflation (from 8.7 percent in 2010 to
13.8 percent). East African economies were
particularly hard hit, not only because of the rise
in food and fuel prices but also due to the very
poor rains and harvest earlier in the year. In
Ethiopia, inflation peaked at 40.1 percent (in
September) from 14.5 percent at the beginning
of the year; in Kenya, it reached 19.7 percent in
November; and in Uganda, it hit 30.5 percent in
October. High levels of inflation, particularly
above the 10% threshold are noted in a number
of studies to be inimical to the growth process
(IMF, 2005). Hence, the recent episodes of high
inflation in these economies, if not reined in,
threatens to curtail the robust growth that has
occurred in these countries. In this regard, the
moderate decline in inflation in Kenya (18.9
percent) and Uganda (27.0 percent) in
December 2011 is a step in the right direction.
Medium-term outlook
The underlying factors supporting growth
dynamics in Sub-Saharan Africa are expected to
continue over next several years. However,
considerable headwinds from slower growth in
the global economy, lower commodity prices,
heightened uncertainty in global financial
markets, and monetary policy tightening in
some countries, could dampen prospects.
Moreover, as emphasized in the main text, the
global outlook is particularly precarious at this
time and much worse outcomes could arise if
conditions in high-income Europe deteriorate.
Assuming a muddling through in the high-
income world, GDP in Sub-Saharan Africa
should expand by around 5.3 percent in 2012
and by 5.6 percent in 2013 (table SSA.2).
However, excluding South Africa, the largest
economy in the region, GDP growth would be
much higher in 2012 (6.6 percent) and 6.4
percent in 2013. This anticipated acceleration in
2012 reflects new oil and mineral capacity
coming on stream in 2012 and increased
investments in these sectors in several countries
including: Congo, Guinea, Lesotho, Liberia,
Madagascar, Mauritania, Mozambique, Niger,
and Sierra Leone; as well as the projected robust
bounce back in Cote d‘Ivoire, which contracted
by 6 percent in 2011. Under our baseline
scenario, in 2012, a third of countries in the
region will grow by at least 6 percent (similar to
2011), another third will grow between 4.7
percent and below 6 percent, and the remaining
third will grow by less than 4.7 percent (table
SSA.3).
Growth prospects in the largest economies.
Supported by historically low interest rates, and
above-inflation wage increases, the South
African consumer will continue to remain the
dominant driving force for GDP growth.
However, the contribution of consumer spending
Box SSA.3 Consumer demand in Sub-Saharan Africa rises
Improved economic governance, a more stable political environment, and increased investments in infrastructure
and human capital has supported growth, and rising employment opportunities in Sub-Sahara Africa over the past
decade. The robust growth and job creation is thereby supporting consumer spending. A recent study by the Afri-
can Development Bank (2011) finds that between 1990 and 2008, the number of people in Sub-Saharan Africa
with incomes between $2-$20 per day almost doubled (rising from 109 million to 206 million).
Typically, middle income consumers demand better governance and are more active in civil society. They also
have the means to demand better services including financial services (e.g mortgages), telecommunication (mobile
phone subscriptions), education and healthcare, and discretionary incomes to purchase durable consumer products
(Banerjee, A and Duflo, 2008).
Notwithstanding recent gains, the African Development Bank study shows that for Sub-Saharan Africa, some 33
percent of the middle class ($2-$20) remain vulnerable to slipping back in to poverty in the event of exogenous
shocks, because the bulk of these households have per capita incomes just above the $2 poverty line (between $2
and $4). Further, World Bank projections show that by 2015 between 38.0 percent and 43.8 percent of Sub-
Saharan Africa‘s population will still be living below the $1.25 poverty line – a shortfall of 9 to 14 percent above
Millennium Development Goals, but an improvement from the 2005 level of 50.9 percent.
6

Global Economic Prospects January 2012 Sub-Saharan Africa Annex
to GDP growth is projected to wane over the
forecast horizon as household debt remains high
and the recent pick-up in inflation reduces
purchasing power. The boost to growth from
increased government spending will remain
strong in 2012, but is likely to wane as stimulus
gives way to consolidation. Private investment
growth, which picked up in 2011, is projected to
ease due to the uncertain global recovery, low
business confidence, low capacity utilization in
manufacturing, labor disputes, and the strong
rand. Reflecting many of these same factors, net
exports will continue to drag on GDP growth. As
a result, GDP in South Africa is projected to
expand a modest 3.1 percent in 2012 before
strengthening somewhat in 2013 at a relatively
subdued level of 3.7 percent, as the global
economy picks up.
Growth prospects in Nigeria, the region‘s second
largest economy, remain robust (7.1 percent and
7.4 percent for 2012 and 2013 respectively). As
has been the case in recent years, growth will be
largely driven by the non-oil sector. The
consumer services sector (financial,
telecommunication, wholesale and retail) one of
the main targets of private equity investors in
Sub-Saharan Africa‘s most populous economy,
will continue to provide a strong impetus to
growth and job creation. Favorable weather
conditions and targeted interventions in the
agricultural sector should also support growth
there. However, uncertainty in the global
economy and domestic production challenges in
its oil sector, which accounts for some 15% of
GDP, will continue to limit the sector‘s
contribution to GDP growth.
Angola’s growth prospects continue to hinge on
its fortunes in the oil sector. Though Angola
benefitted from higher oil prices in 2011,
technical glitches prevented any significant
expansion in output. These problems should be
resolved by 2012, paving the way for an increase
Table SSA.2 Sub-Saharan Africa forecast summary
Source: World Bank.
Est.
98-07a2008 2009 2010 2011 2012 2013
GDP at market prices (2005 US$) b 4.2 5.1 2.0 4.8 4.9 5.3 5.6
GDP per capita (units in US$) 1.9 3.1 0.0 2.8 2.9 3.3 3.6
PPP GDP c 4.4 5.6 2.5 5.1 5.2 5.6 5.9
Private consumption 2.2 3.7 1.6 5.3 5.0 4.3 4.7
Public consumption 5.4 7.5 5.8 6.6 5.6 4.2 4.9
Fixed investment 8.0 11.6 4.3 12.0 7.7 6.2 10.0
Exports, GNFS d 4.0 4.2 -6.4 6.3 10.3 9.7 9.5
Imports, GNFS d 6.5 6.6 -3.8 7.9 10.4 5.8 8.8
Net exports, contribution to growth -0.7 -1.1 -0.7 -0.9 -0.6 0.9 -0.2
Current account bal/GDP (%) -0.8 -1.5 -3.7 -3.3 -0.3 -0.7 -0.8
GDP deflator (median, LCU) 6.1 11.0 4.6 6.9 5.5 6.2 6.2
Fiscal balance/GDP (%) -0.6 1.0 -5.5 -4.4 -3.4 -2.9 -2.3
Memo items: GDP
SSA excluding South Africa 4.5 6.0 4.2 5.9 5.9 6.6 6.4
Oil exporters e 4.9 6.7 4.7 5.7 5.8 6.7 6.9
CFA countries f 3.5 4.1 2.7 4.0 2.8 4.8 4.9
South Africa 3.7 3.7 -1.8 2.8 3.2 3.1 3.7
Nigeria 5.0 6.0 7.0 7.8 7.0 7.1 7.4
Angola 9.7 13.8 2.4 2.3 7.0 8.1 8.5
(annual percent change unless indicated otherwise)
Source : World Bank.
a. Growth rates over intervals are compound average; growth contributions, ratios and the GDP deflator
are averages.
b. GDP measured in constant 2005 U.S. dollars.
c. GDP measured at PPP exchange rates.
d. Exports and imports of goods and non-factor services (GNFS).
e. Oil Exporters: Angola, Cote d Ivoire, Cameroon, Congo, Rep., Gabon, Nigeria, Sudan, Chad, Congo,
Dem. Rep.
f. CFA Countries: Benin, Burkina Faso, Central African Republic, Cote d Ivoire, Cameroon, Congo,
Rep., Gabon, Equatorial Guinea, Mali, Niger, Senegal, Chad, Togo.
g. Estimate.
h. Forecast.
Forecast
7

Global Economic Prospects January 2012 Sub-Saharan Africa Annex
in output from 1.65 million bpd to 2.1 million
bpd over the forecast horizon – reflecting both
new wells and increased production from the
Pazflor deepwater field. Gas output is also likely
to rise as the $9 billion liquefied natural gas
project gets underway. However, developments
in the hydrocarbons sector have limited linkages
with the rest of the economy. Government
efforts to support the non-oil sector, will
continue to be hindered by high transactions cost
and a difficult business environment. GDP
growth is projected to reach 8.1 percent and 8.5
percent in 2012 and 2013 respectively.
Risks and vulnerabilities
Slowdown in global economy. In the current
global context, the risk of a serious downturn in
the global economy is very real and would carry
with it serious implications for Sub-Saharan
Africa, reducing global demand for the region‘s
exports, yielding potentially sharp declines in
commodity prices and ,therefore, government
revenues, and potentially large declines in
remittance and tourism flows.
In the small contained European crisis outlined
in the main text, growth in Sub-Saharan Africa
could decline by 1.3 percentage points compared
to the current forecasts for 2012, with oil and
metal prices falling by as much as 18 percent and
food prices by 4.5 percent. Indeed, the fiscal
impact of commodity price declines could be as
high as 1.7 percent of regional GDP (see main
text). In 2008, several Sub-Saharan Africa
countries had the fiscal buffers to make up these
shortfalls. Governments in the region had much
healthier fiscal balances in 2007 and thus could
undertake expansionary fiscal policies (e.g. in
Kenya, Tanzania and Uganda) to compensate for
the fall in external demand. In 2011, however,
the aggregate fiscal deficit in Sub-Saharan
Africa is estimated at 3.4 percent of GDP, and
not many countries in the region are well placed
to carry out countercyclical fiscal policies, if the
global downturn worsens significantly. The
situation could become even more difficult if
donors cut aid flows to low-income countries
receiving high levels of budget support (e.g.
Burundi, São Tomé and Príncipe, Rwanda),
though Lesotho and Cape-Verde, both middle-
income economies, also remain vulnerable to
sharper than anticipated aid cuts (figure SSA.7).
With fiscal space much more restricted, and in a
context where external financing may well not
be available, governments may be forced to cut
deeply into spending – thereby exacerbating the
downturn. However, reduced fiscal space during
a downturn need not translate into higher
poverty levels if mechanisms are already in place
to help protect targeted spending on the most
vulnerable groups. One such successful program
in Sub-Saharan Africa is Ethiopia‘s Productive
Safety Net Program, which delivers social
transfers through public work activities (food for
cash, cash for work etc), as well as direct support
to households that are labor constrained. Besides
fiscal policy, in economies that have inflationary
expectations under control and that have
monetary policy space, loosening policy rates to
stimulate domestic demand could support
aggregate demand in the face of declining
external demand. However, given structural
rigidities and limited links between interest rates
and credit in low-income Sub-Saharan African
economies, monetary policy tends to be less
effective than fiscal policies in these economies.
Fall in trade. The trade impacts of a sharp
slowdown in Europe could significantly impact
Figure SSA.7 SSA economies with the highest
budgetary support (grants) as a share of GDP.
Source: IMF WEO database and World Bank Staff
calculations
0 5 10 15
Rwanda
Guinea-Bissau
Comoros
Congo, Dem. Rep. of
Mozambique
Malawi
Sierra Leone
Lesotho
Burkina Faso
Cape Verde
Niger
Central African Rep.
Tanzania
Gambia, The
Ethiopia
Eritrea
Mali
Seychelles
UgandaGrants as share of GDP (average, 2009-2011)
(%)
8

Global Economic Prospects January 2012 Sub-Saharan Africa Annex
Sub Saharan African economies given that
European Union member states account for 37
percent of the regions non-oil exports. And for
tourism dependent economies in the region (e.g.
Cape Verde, Gambia, Kenya, Tanzania,
Mauritius, Seychelles, etc), arrivals from
Eurozone member states constitute the bulk of
total tourist arrivals. Impacts will differ, though,
depending on individual countries‘ exposure to
the hardest hit European economies as well as
the composition of exports. While merchandise
exports to the high-spread Euro Area economies
account for only 9 percent of total Sub-Saharan
African non-oil merchandise exports, in Cape
Verde some 92 percent of merchandise exports
are destined for these economies (figure SSA.8).
However, for Cape Verde‘s service-oriented
economy outturns from tourism flows will be of
more importance than merchandise exports.
Other economies with high exposure export
demand from high-spread Euro Area economies
include Guinea and Mauritania where some 25
percent and 19 percent respectively of their non-
oil exports are destined.
Indeed, if the current concerns were to escalate
and encompass some of Sub-Saharan Africa‘s
major trading partners in the Euro Area, this
would significantly dampen Sub-Saharan Africa
exports. Further diversification of export
composition and trading partners (including with
other countries in the region) should, over the
longer term, help Sub-Saharan Africa economies
become less vulnerable to shocks originating
from specific regions (see Trade Annex).
Fall in commodity prices. A fall in commodity
prices is likely to reduce incomes and slow
investment flows to the resource sector—an
important growth sector for many economies.
The slowdown in export revenues is likely to be
stronger in the lesser diversified economies in
the region, and in particular in those whose
exports are dominated by oil, minerals and
metals, since, during a slow down in the global
economy these commodities are more likely to
be negatively impacted than agricultural exports.
Indeed, some 70 percent of Sub-Saharan Africa
export revenues come from agricultural
products, oil, metals and minerals. In Angola and
the Republic of Congo, where the oil sector
accounts for over 60 percent of GDP, a 10
percent decline in oil prices could translate into a
2.7 percent and 4.4 percent decline in GDP,
respectively. In Nigeria, where the oil sector
accounts for 15.9 percent of GDP, a similar
decline in oil prices could reduce its GDP by 1.8
percent.
Further, for many economies in the region that
operate a flexible exchange rate regime, adverse
terms of trade shocks translate to depreciation in
their currencies, with potential for increased
macroeconomic instability. For instance, during
the downturn in 2009, a third of local currencies
in the region depreciated by over 10% (figure
SSA.9). However, on the upside, a more
pronounced decline in oil prices would provide
a welcome relief for the region‘s oil importers
that were hard hit by the spike in oil prices
earlier in 2011 (Ethiopia, Kenya, Malawi,
Mauritius, Swaziland, Sudan, and Uganda).
Fall in capital flows. With financial markets
underdeveloped in many Sub-Saharan Africa
countries, the region is the least integrated with
global financial markets. As a result, the direct
impact on the region‘s banking sector, in the
event of a worsening of the Euro Area debt crisis
would be rather limited in terms of the
deterioration in asset quality, non-performing
Figure SSA.8 SSA economies with the highest
share of exports destined to Portugal Greece, Ire-
land, Italy and Spain
Source: UN Comtrade database and World Bank staff
0.00 0.20 0.40 0.60 0.80 1.00
Cape Verde
Guinea
Mauritania
Cameroon
Namibia
Mauritius
Gabon
Nigeria
Senegal
Cote d'Ivoire
Seychelles
Madagascar
Ethiopia
Uganda
Malawi
9

Global Economic Prospects January 2012 Sub-Saharan Africa Annex
loans etc. Nonetheless, there are other sub-
channels through which countries in the region
could be affected in a non-trivial way.
Heightened uncertainty in global financial
markets will adversely impact short-term
portfolio equity and investment in bonds.
Indeed, between April and October 2011, while
the MSCI World Index fell by 23%, indices in
the three most liquid stock exchanges in the
region fell sharply: South Africa by 24%,
Nigeria by 21%, and Kenya by 43%. Hence for
economies in the region with more liquid
financial markets (stock and bond markets), the
downturn could lead to destabilizing capital
flows with negative consequences on exchange
rate volatility. Indeed, in the aftermath of the
turmoil in financial markets in August 2011, the
South African rand was one of the currencies to
have depreciated the most globally.
However, for most countries in the region,
private capital flows are in the form of foreign
direct investment, which is less volatile than
other types of capital flows and hence are
somewhat shielded from sudden capital flights.
Nonetheless, an intensification of the Euro Area
debt crisis could well result in a fall in foreign
direct investment as occurred during the 2008/09
financial crisis when foreign direct investment
fell by a cumulative 24% over the 2008-2010
period.
Heightened financial market uncertainty could
affect participation in bond issuance– both local
and foreign. For instance, plans by a number of
Sub-Saharan African countries (Kenya,
Tanzania, Zambia) to issue international bonds
may be further postponed if the premiums
required remain high due to elevated investor
risk averseness related to the Euro debt situation.
This could therefore delay the prospect of
addressing some of the binding infrastructural
constraints to growth in these countries.
Fall in remittances. Another channel of
transmission that a slowdown in the global
economy could engender is a fall in remittance
inflows. With remittance flows supporting
household spending and local currencies, a sharp
decline in remittances could dampen growth
prospects. World Bank estimates that
remittances to Sub-Sahara Africa will rise to $24
billion and $26 billion in 2012 and 2013
respectively. Given that remittance flows were
resilient during the 2008/09 crisis (falling by
only 4.6% in 2009), they are likely to hold
steady in the medium term. However, in the
event of a sharper slowdown than anticipated in
the baseline, remittances could deviate from
current projections by declining between 2.8% to
6.2%, depending on the severity of the
downturn. The effects among Sub-Saharan
Africa countries would however differ. As a
share of GDP, Cape Verde, Senegal and Guinea-
Bissau are the most dependent on remittance
flows from the high-spread Euro Area countries
(figure SSA.10), thus likely to be the most
vulnerable through this channel.
Internal risks. While external risks are most
prominent – a number of domestic challenges
could also cause outturns to sour. Indeed,
disruptions to productive activity in the
aftermath of elections are important potential
downside risks, as investment, merchandise
trade and tourism receipts, all important growth
drivers, are likely to suffer. The 6 percent
contraction in output in Cote d‘Ivoire in 2011
was due to the civil unrest following the
Figure SSA.9 A fall in commodity prices, as oc-
curred in 2009, could contribute to significant
depreciation of local currencies in the region.
Source: World Bank.
0 5 10 15 20 25 30 35 40 45 50
CFA economies
Angola
Sudan
Mauritania
Tanzania, United Rep.
Mozambique
Sierra Leone
Kenya
Uganda
Mauritius
Madagascar
Gambia, The
Ethiopia
Nigeria
Ghana
Zambia
Congo, Dem. Rep.
Depreciation in nominal exchange rate to US dollar (2009)
10

Global Economic Prospects January 2012 Sub-Saharan Africa Annex
elections in 2010. In 2012 about a sixth of Sub-
Saharan Africa countries have scheduled
presidential elections.
Another downside risk stems from adverse
weather conditions. With the agricultural sector
accounting for about 20 percent to 40 percent of
GDP in most Sub-Sahara African countries, and
with much of it dependent on good rains, the
impact of poor rains on GDP growth in the
region can be significant, not just to the
agricultural sector but also for services and
industries as they depend on the generation of
power from hydroelectric sources. In 2011,
lower food production in parts of Kenya, due to
poor rains led, to an escalation of food prices and
a contraction in the electricity and water supply
sector (by 12.1%, y/y, in the third quarter); and
in Tanzania extensive power rationing due to
lower water levels cut into manufacturing
output.
Notes:
1. Estache et. al (2006) demonstrate that
infrastructure investments accelerated
growth convergence in Africa by over 13
percent. And Calderon (2008) estimates that
infrastructure contributed 0.99 percentage
points to per capita economic growth during
the 1990-2005 period.
References:
African Development Bank (2011), The Middle
of the Pyramid: Dynamics of the Middle Class in
Africa, Market Brief April 2011.
Banerjee, A and E., Dufflo (2008), ―What is
Middle Class about, the Middle Classes Around
the World?‖, Journal of Economic Perspectives,
Vol. 22, No. 2.
Calderon, C., and L. Serven, (2008).
"Infrastructure and Economic Development in
Sub-Saharan Africa," Policy Research Working
Paper Series 4712, The World Bank.
Estache, A., B. Speciale, and D. Veredas,
(2006). How Much Does Infrastructure Matter to
Growth in Sub-Saharan Africa? The World
Bank, Washington, D.C.
Estache, A. and Q. Wodon, (2010).
Infrastructure and Poverty in Sub-Saharan
Africa, Forthcoming.
Gupta, S., A. Kangur, C. Papageorgiou, and A.
Wane (2011). ―Efficiency-Adjusted Public
Capital and Growth,‖ IMF Working Paper
(forthcoming).
International Monetary Fund (2005), ‗Monetary
and Fiscal Policy Design Issues in Low-Income
Countries‘, IMF Policy Paper , August 2005.
UNCTAD (2008), World Investment Report
2008: Transnational Corporations and the
Infrastructure Challenge, New York and Geneva:
United Nations.
UNCTAD (2011), Global Investment Trends
Monitor No. 7, October, New York and Geneva:
United Nations.
World Bank (2010), Global Monitoring Report
2010: the MDGs after the Crisis, The World
Bank, Washington DC.
Figure SSA.10 Sub Saharan Africa countries with
high remittances from high-spread Euro Area
countries
Source: World Bank
0.0 0.5 1.0 1.5 2.0 2.5 3.0
Côte d'Ivoire
Seychelles
Sierra Leone
Rwanda
Niger
Lesotho
Kenya
Benin
Mauritius
Gambia, The
Mozambique
Togo
Nigeria
Guinea-Bissau
Senegal
Cape Verde
Remittances as a share of GDP (%)
11
Global Economic Prospects January 2012 Sub-Saharan Africa Annex
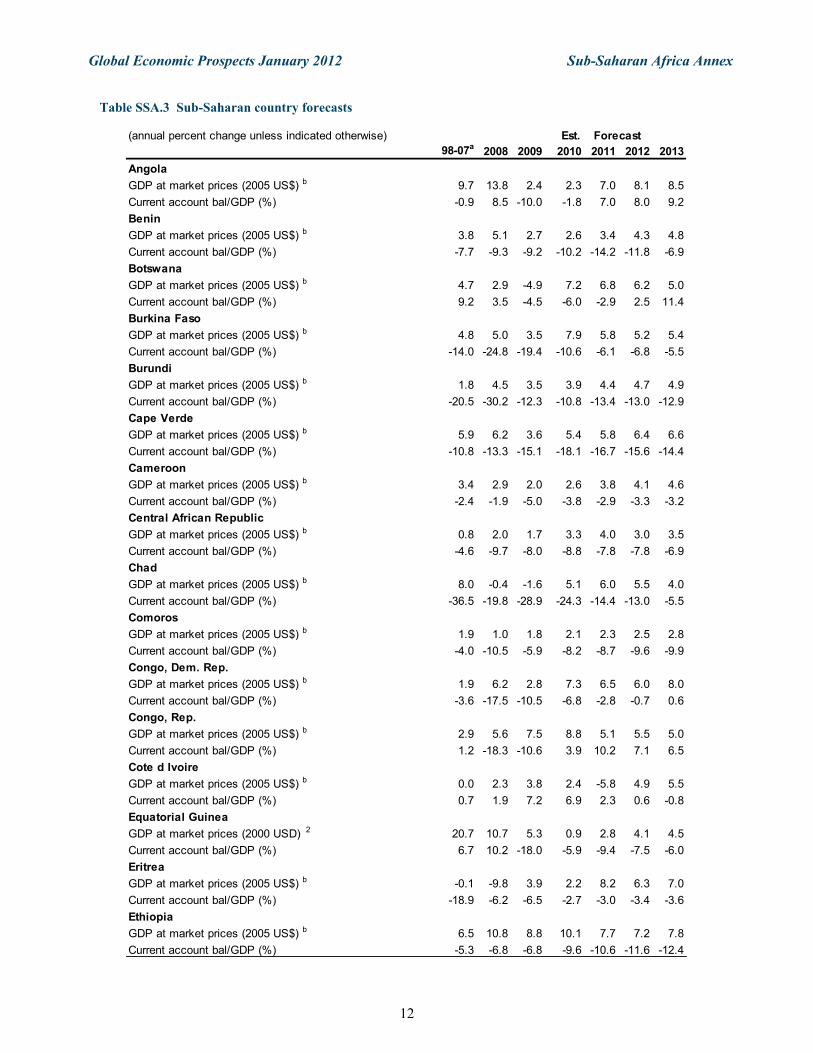
Table SSA.3 Sub-Saharan country forecasts
Est.
98-07a2008 2009 2010 2011 2012 2013
Angola
GDP at market prices (2005 US$) b 9.7 13.8 2.4 2.3 7.0 8.1 8.5
Current account bal/GDP (%) -0.9 8.5 -10.0 -1.8 7.0 8.0 9.2
Benin
GDP at market prices (2005 US$) b 3.8 5.1 2.7 2.6 3.4 4.3 4.8
Current account bal/GDP (%) -7.7 -9.3 -9.2 -10.2 -14.2 -11.8 -6.9
Botswana
GDP at market prices (2005 US$) b 4.7 2.9 -4.9 7.2 6.8 6.2 5.0
Current account bal/GDP (%) 9.2 3.5 -4.5 -6.0 -2.9 2.5 11.4
Burkina Faso
GDP at market prices (2005 US$) b 4.8 5.0 3.5 7.9 5.8 5.2 5.4
Current account bal/GDP (%) -14.0 -24.8 -19.4 -10.6 -6.1 -6.8 -5.5
Burundi
GDP at market prices (2005 US$) b 1.8 4.5 3.5 3.9 4.4 4.7 4.9
Current account bal/GDP (%) -20.5 -30.2 -12.3 -10.8 -13.4 -13.0 -12.9
Cape Verde
GDP at market prices (2005 US$) b 5.9 6.2 3.6 5.4 5.8 6.4 6.6
Current account bal/GDP (%) -10.8 -13.3 -15.1 -18.1 -16.7 -15.6 -14.4
Cameroon
GDP at market prices (2005 US$) b 3.4 2.9 2.0 2.6 3.8 4.1 4.6
Current account bal/GDP (%) -2.4 -1.9 -5.0 -3.8 -2.9 -3.3 -3.2
Central African Republic
GDP at market prices (2005 US$) b 0.8 2.0 1.7 3.3 4.0 3.0 3.5
Current account bal/GDP (%) -4.6 -9.7 -8.0 -8.8 -7.8 -7.8 -6.9
Chad
GDP at market prices (2005 US$) b 8.0 -0.4 -1.6 5.1 6.0 5.5 4.0
Current account bal/GDP (%) -36.5 -19.8 -28.9 -24.3 -14.4 -13.0 -5.5
Comoros
GDP at market prices (2005 US$) b 1.9 1.0 1.8 2.1 2.3 2.5 2.8
Current account bal/GDP (%) -4.0 -10.5 -5.9 -8.2 -8.7 -9.6 -9.9
Congo, Dem. Rep.
GDP at market prices (2005 US$) b 1.9 6.2 2.8 7.3 6.5 6.0 8.0
Current account bal/GDP (%) -3.6 -17.5 -10.5 -6.8 -2.8 -0.7 0.6
Congo, Rep.
GDP at market prices (2005 US$) b 2.9 5.6 7.5 8.8 5.1 5.5 5.0
Current account bal/GDP (%) 1.2 -18.3 -10.6 3.9 10.2 7.1 6.5
Cote d Ivoire
GDP at market prices (2005 US$) b 0.0 2.3 3.8 2.4 -5.8 4.9 5.5
Current account bal/GDP (%) 0.7 1.9 7.2 6.9 2.3 0.6 -0.8
Equatorial Guinea
GDP at market prices (2000 USD) 2 20.7 10.7 5.3 0.9 2.8 4.1 4.5
Current account bal/GDP (%) 6.7 10.2 -18.0 -5.9 -9.4 -7.5 -6.0
Eritrea
GDP at market prices (2005 US$) b -0.1 -9.8 3.9 2.2 8.2 6.3 7.0
Current account bal/GDP (%) -18.9 -6.2 -6.5 -2.7 -3.0 -3.4 -3.6
Ethiopia
GDP at market prices (2005 US$) b 6.5 10.8 8.8 10.1 7.7 7.2 7.8
Current account bal/GDP (%) -5.3 -6.8 -6.8 -9.6 -10.6 -11.6 -12.4
(annual percent change unless indicated otherwise) Forecast
12

Global Economic Prospects January 2012 Sub-Saharan Africa Annex
Est.
98-07a2008 2009 2010 2011 2012 2013
Gabon
GDP at market prices (2005 US$) b 0.4 2.3 -1.4 5.7 6.0 5.1 4.1
Current account bal/GDP (%) 10.9 22.2 13.5 11.4 15.0 12.1 11.3
Gambia, The
GDP at market prices (2005 US$) b 3.4 5.4 6.2 5.6 5.3 5.4 5.8
Current account bal/GDP (%) -9.4 0.4 4.0 2.1 1.9 1.3 0.8
Ghana
GDP at market prices (2005 US$) b 4.6 8.4 4.7 6.6 13.6 9.0 8.0
Current account bal/GDP (%) -6.4 -12.4 -3.6 -7.2 -7.0 -5.9 -4.4
Guinea
GDP at market prices (2005 US$) b 2.8 4.9 -0.3 1.9 4.3 4.5 5.0
Current account bal/GDP (%) -6.1 -11.6 -10.1 -13.1 -14.2 -12.2 -13.6
Guinea-Bissau
GDP at market prices (2005 US$) b 1.8 3.2 3.0 3.5 4.8 4.7 5.0
Current account bal/GDP (%) -7.3 -11.0 -8.5 -11.1 -11.4 -10.6 -10.3
Kenya
GDP at market prices (2005 US$) b 3.4 1.6 2.6 5.6 4.3 5.0 5.5
Current account bal/GDP (%) -4.9 -6.6 -5.7 -7.7 -10.0 -6.6 -5.9
Lesotho
GDP at market prices (2005 US$) b 2.9 4.7 3.1 3.3 3.1 5.1 4.9
Current account bal/GDP (%) -3.5 9.0 -0.1 -19.7 -24.5 -17.8 -13.5
Madagascar
GDP at market prices (2005 US$) b 3.2 7.1 -4.6 1.6 2.6 3.0 4.5
Current account bal/GDP (%) -9.5 -17.5 -15.4 -8.1 -8.5 -8.3 -8.3
Malawi
GDP at market prices (2005 US$) b 2.8 8.6 7.6 6.7 5.6 5.0 5.6
Current account bal/GDP (%) -4.7 -7.1 -9.6 -2.7 -4.7 -5.1 -5.5
Mali
GDP at market prices (2005 US$) b 5.1 5.0 4.5 4.5 5.4 5.1 5.9
Current account bal/GDP (%) -7.9 -12.2 -7.3 -7.6 -8.0 -8.1 -7.8
Mauritania
GDP at market prices (2005 US$) b 4.1 3.5 -1.2 5.2 5.1 5.7 6.0
Current account bal/GDP (%) -5.8 -12.6 -13.2 -10.1 -11.2 -11.7 -12.2
Mauritius
GDP at market prices (2005 US$) b 3.6 5.5 3.0 4.0 4.1 3.3 4.3
Current account bal/GDP (%) -1.2 -10.1 -7.4 -8.2 -11.1 -11.2 -10.2
Mozambique
GDP at market prices (2005 US$) b 6.8 6.8 6.4 7.2 7.4 7.6 8.5
Current account bal/GDP (%) -14.6 -11.9 -11.8 -15.4 -13.6 -12.4 -11.1
Namibia
GDP at market prices (2005 US$) b 4.4 4.3 -0.8 6.6 3.9 4.2 5.1
Current account bal/GDP (%) 4.0 0.5 -1.2 -0.7 -0.5 -1.5 -2.4
Niger
GDP at market prices (2005 US$) b 2.7 8.7 -1.2 8.8 6.0 8.5 6.8
Current account bal/GDP (%) -7.4 -12.1 -19.3 -18.8 -19.2 -16.7 -14.4
Nigeria
GDP at market prices (2005 US$) b 5.0 6.0 7.0 7.8 7.0 7.1 7.4
Current account bal/GDP (%) 11.0 13.6 7.8 1.5 14.3 13.3 11.4
(annual percent change unless indicated otherwise) Forecast
13

Global Economic Prospects January 2012 Sub-Saharan Africa Annex
Est.
98-07a2008 2009 2010 2011 2012 2013
Rwanda
GDP at market prices (2005 US$) b 6.8 11.2 4.1 7.5 8.8 7.6 7.0
Current account bal/GDP (%) -6.0 -5.3 -7.2 -6.0 -6.1 -4.3 -2.1
Senegal
GDP at market prices (2005 US$) b 4.0 3.3 2.2 4.2 4.2 4.4 4.4
Current account bal/GDP (%) -7.0 -14.3 -12.9 -13.2 -13.4 -14.1 -14.6
Seychelles
GDP at market prices (2005 US$) b 2.1 -1.3 0.7 6.2 4.0 4.7 5.0
Current account bal/GDP (%) -16.4 -44.2 -32.1 -51.6 -25.4 -17.6 -15.4
Sierra Leone
GDP at market prices (2005 US$) b 7.5 5.5 3.2 4.9 5.6 44.0 13.0
Current account bal/GDP (%) -12.2 -15.3 -15.7 -13.1 -12.6 -12.2 -11.9
South Africa
GDP at market prices (2005 US$) b 3.7 3.7 -1.8 2.8 3.2 3.1 3.7
Current account bal/GDP (%) -2.1 -7.1 -4.1 -2.8 -3.0 -3.7 -4.1
Sudan
GDP at market prices (2005 US$) b 5.9 6.8 4.0 4.5 5.3 5.8 5.8
Current account bal/GDP (%) -7.1 -2.3 -7.7 -1.9 -7.2 -7.3 -7.4
Swaziland
GDP at market prices (2005 US$) b 3.1 2.4 0.4 2.0 -2.1 0.6 1.5
Current account bal/GDP (%) -1.3 -8.1 -14.4 -15.2 -15.8 -13.1 -12.1
Tanzania
GDP at market prices (2005 US$) b 5.9 7.4 6.0 7.0 6.4 6.7 6.9
Current account bal/GDP (%) -5.8 -12.9 -9.0 -8.6 -9.1 -10.4 -11.8
Togo
GDP at market prices (2005 US$) b 1.9 2.4 3.2 3.4 3.7 4.0 4.1
Current account bal/GDP (%) -9.5 -6.9 -5.6 -5.9 -4.6 -4.9 -4.9
Uganda
GDP at market prices (2005 US$) b 6.4 8.7 7.2 6.4 6.3 6.2 7.0
Current account bal/GDP (%) -5.4 -9.1 -6.7 -10.1 -12.1 -15.3 -11.2
Zambia
GDP at market prices (2005 US$) b 4.2 5.7 6.4 7.6 6.8 6.7 6.0
Current account bal/GDP (%) -13.7 -9.3 1.9 2.5 3.5 2.4 2.1
Source : World Bank.
World Bank forecasts are frequently updated based on new information and changing (global)
circumstances. Consequently, projections presented here may differ from those contained in other
Bank documents, even if basic assessments of countries’ prospects do not significantly differ at any
given moment in time.
Liberia, Somalia, Sao Tome and Principe are not forecast owing to data limitations.
a. Growth rates over intervals are compound average; growth contributions, ratios and the GDP deflator
are averages.
b. GDP measured in constant 2005 U.S. dollars.
c. Estimate.
(annual percent change unless indicated otherwise) Forecast
14