pensacola international airport master plan update …€¦ · pensacola international airport...
TRANSCRIPT
PENSACOLA
INTERNATIONAL
AIRPORT
MASTER PLAN
UPDATE
WORKING PAPER 3
AVIATION ACTIVITY
FORECASTS
NOVEMBER 2016
In association with
InterVISTAS Consulting Inc.
Pensacola International Airport Master Plan Update –Working Paper 3
Table of Contents CHAPTER 3 AVIATION ACTIVITY FORECASTS
3.1 Introduction................................................................................................................................................................... 3-1
3.2 Airport Service Area ................................................................................................................................................... 3-1
3.3 Historical Aviation Activity ....................................................................................................................................... 3-3
3.3.1 Annual Aircraft Operations ................................................................................................................................ 3-5
3.3.2 Aircraft Fleet Mix .................................................................................................................................................... 3-6
3.3.3 Based Aircraft........................................................................................................................................................... 3-8
3.3.4 Passenger Enplanements .................................................................................................................................... 3-8
3.3.5 Cargo Activity ........................................................................................................................................................ 3-10
3.4 Analysis of Air traffic and Forecast ..................................................................................................................... 3-14
3.5 Trend Forecasts .......................................................................................................................................................... 3-15
3.6 Econometric Modeling............................................................................................................................................ 3-16
3.7 Bottom-Up Scenario Forecasts ............................................................................................................................ 3-19
3.8 Annual Passenger and Cargo Forecasts ........................................................................................................... 3-19
3.8.1 Annual Passenger Enplanement Forecast .................................................................................................. 3-19
3.8.2 Annual Air Cargo Volume Forecast ............................................................................................................... 3-21
3.9 Peak Hour / Peak Day Forecasts ......................................................................................................................... 3-23
3.10 Forecast Case and TAF Comparison .................................................................................................................. 3-25
3.10.1 Air Passengers .................................................................................................................................................. 3-27
3.10.2 Airline Air Operations .................................................................................................................................... 3-28
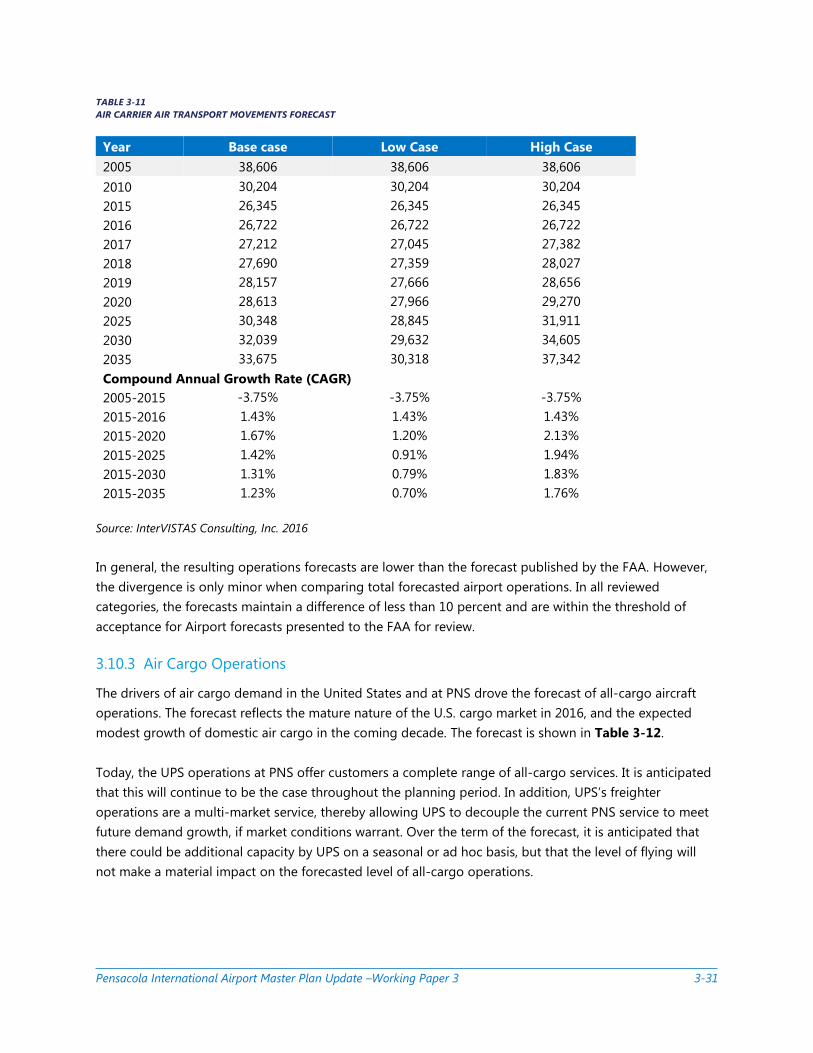
3.10.3 Air Cargo Operations..................................................................................................................................... 3-31
3.10.4 General Aviation Operations ...................................................................................................................... 3-32
3.10.5 Annual Military Operations ......................................................................................................................... 3-33
3.11 Air Transportation Market Study ........................................................................................................................ 3-33
3.11.1 Low Cost and Ultra-Low Cost Carrier Developments ....................................................................... 3-36
3.11.2 Airline Consolidation ..................................................................................................................................... 3-40
3.11.3 Economic Growth ............................................................................................................................................ 3-42
3.11.4 The Economic Outlook ................................................................................................................................. 3-48
3.11.5 Competition Among Airports .................................................................................................................... 3-48
3.12 Critical Aircraft Selection ........................................................................................................................................ 3-51
3.13 Forecast Summary .................................................................................................................................................... 3-53
List of Figures Figure 3-1 PNS Service Area ...................................................................................................................................................... 3-2
Figure 3-2 Service Map and Daily Service Summary ......................................................................................................... 3-3
Figure 3-3 2005-2016 Passenger Traffic ................................................................................................................................ 3-4
Pensacola International Airport Master Plan Update –Working Paper 3
Figure 3-4 Passenger Seasonality by Month ........................................................................................................................ 3-5
Figure 3-5 Aircraft Operations 2004-2015 ........................................................................................................................... 3-6
Figure 3-6 Annual Outbound Seats ......................................................................................................................................... 3-7
Figure 3-7 Annual Departure Operations .............................................................................................................................. 3-7
Figure 3-8 Based Aircraft 2005-2016 ....................................................................................................................................... 3-8
Figure 3-9 Historical Passenger Enplanements and Growth Rate ............................................................................... 3-9
Figure 3-10 Passenger Market Share By Airline 2015 ..................................................................................................... 3-10
Figure 3-11 Air Cargo Tonnage At Area Airports, 2015 ................................................................................................. 3-11
Figure 3-12 UPS Air Cargo Weight By Airport (2006-2015) ......................................................................................... 3-12
Figure 3-13 Air Cargo Weight At PNS (2000-2015) ......................................................................................................... 3-13
Figure 3-14 Carrier Market Share of Cargo Weight (Lbs) (2015) ................................................................................ 3-14
Figure 3-15 Goodness of Fit Econometric Model For Enplanements ....................................................................... 3-16
Figure 3-16 Enplaned Passengers by Commercial Category ....................................................................................... 3-21
Figure 3-17 Passenger Enplanements Forecast Compared to FAA TAF .................................................................. 3-28
Figure 3-18 US Average Load Factor and Domestic Seat Departures ..................................................................... 3-34
Figure 3-19 Average Seats Per Departure, By Carrier (2010 and 2016) ................................................................... 3-35
Figure 3-20 Air Service Changes, 2007 vs 2016 ................................................................................................................ 3-35
Figure 3-21 Low-Cost Airlines Domestic Seat Capacity ................................................................................................. 3-36
Figure 3-22 Ultra Low-Cost Carriers Domestic Seat Capacity ..................................................................................... 3-37
Figure 3-23 Low-Cost And Ultra-Low-Cost Carrier Points Served By Hub Size ................................................... 3-38
Figure 3-24 Southwest Airlines Percentage of Total PNS Capacity ........................................................................... 3-39
Figure 3-25 Airline Merger Timeline ...................................................................................................................................... 3-40
Figure 3-26 Number of Points With Service to Small and Non-Hub Airports ...................................................... 3-41
Figure 3-27 City Pair Combinations Served by Allegiant, 2016 .................................................................................. 3-42
Figure 3-28 Gulf Coast passenger Market Share by Airline (2015) ........................................................................... 3-50
Figure 3-29 Annual Enplanements Forecast Summary, 2002-2035 .......................................................................... 3-53
Figure 3-30 Annual Operations Forecast Summary, 2002-2035 ................................................................................ 3-55
List of Tables Table 3-1 Top Domestic Markets .............................................................................................................................................. 3-4
Table 3-2 Gross Domestic National, State, and Regional Product ............................................................................ 3-18
Table 3-3 Enplaned Passenger Forecasts ............................................................................................................................. 3-20
Table 3-4 Air Cargo Forecast Summary (2016-2035) ...................................................................................................... 3-23
Table 3-5 Peak Commercial Operations, 2015 .................................................................................................................. 3-23
Table 3-6 Forecasted Peak Operations (2016-2035) ....................................................................................................... 3-24
Table 3-7 Forecasted Peak Enplanements (2016-2035) ................................................................................................. 3-25
Table 3-8 Enplanements and Operations Forecast Summary ..................................................................................... 3-26
Table 3-9 Comparison of Base Case Forecast to FAA TAF ............................................................................................ 3-27
Table 3-10 Fleet Mix Projections ............................................................................................................................................. 3-30
Table 3-11 Air Carrier Air Transport Movements Forecast ........................................................................................... 3-31
Table 3-12 Cargo Aircraft Operations ................................................................................................................................... 3-32
Table 3-13 General Aviation Operations Forecast ........................................................................................................... 3-32

Pensacola International Airport Master Plan Update –Working Paper 3
Table 3-14 Military Operations Forecast .............................................................................................................................. 3-33
Table 3-15 Gross Domestic/State/Regional Product (Millions of 2009 dollars) ................................................... 3-43
Table 3-16 US/State/MSA Population (thousands) ......................................................................................................... 3-44
Table 3-17 US/State/MSA Per Capita Income (2009 Dollars) ...................................................................................... 3-45
Table 3-18 Largest Private Sector Employers, Pensacola MSA ................................................................................... 3-47
Table 3-19 Largest Private Sector Employers, Daphne-Fairhope MSA .................................................................... 3-48
Table 3-20 Passenger Seat Departures by Airport ........................................................................................................... 3-50
Table 3-21 Regional Passenger Traffic By Airport (2015) .............................................................................................. 3-51
Table 3-22 Critical Aircraft ......................................................................................................................................................... 3-52

Pensacola International Airport Master Plan Update –Working Paper 3
C HA PT ER 3
AVIATION ACTIVITY FORECASTS
Pensacola International Airport Master Plan Update –Working Paper 3 3-1
3.1 INTRODUCTION
Air traffic forecasts serve to establish the anticipated future demand for passenger enplanements and
aircraft operations, which ensure the facilities are properly sized to allow cost-effective and efficient
operations. This aviation activity forecast for Pensacola International Airport (PNS) includes a Base (most
likely) forecast, a Low forecast, and a High forecast that cover the period 2015 to 2035. These forecasts
outline anticipated:
» Fiscal year passenger enplanements
» Fiscal year air cargo volumes
» Fiscal year air transport movements (commercial, general aviation, and military)
» Peak hour and peak month forecasts
The forecasts are based on the FAA’s most recent Terminal Area Forecast (TAF) as well as information
regarding economic outlook and market developments, InterVISTAS’ analysis, and other industry
intelligence. However, as with any forecast, there are uncertainties regarding these factors, and
unforeseen changes and events (e.g., natural disasters, political instability, and global economic recession)
could result in traffic development deviating from the forecasts.
The Master Plan Update Team prepared this aviation activity forecast for the Pensacola International
Airport Master Plan Update (MPU). This MPU forecasts aircraft movements and enplaned passenger
activity for the period 2016 through 2035. The analysis developed projections of passenger enplanements,
aircraft movements, and cargo volumes. Forecasts for general aviation (GA) movements are based on the
Federal Aviation Administration (FAA) Aerospace Forecast, Fiscal Year 2016-2035 projected GA national
growth rate and military movements are based on the FAA’s 2015 Terminal Area Forecast (TAF) for PNS.
Fiscal year 2015 is used as the base year for all forecasts.
3.2 AIRPORT SERVICE AREA
The catchment area for PNS is defined by its economic and demographic profile, which drives demand for
air service. The catchment area’s economic and demographic characteristics are quantifiable via various
data sources, including the U.S. Department of Commerce, U.S. Office of Management and Budget, and
U.S. Bureau of Census (Bureau). The Bureau combines economic and demographic data to identify
micropolitan and metropolitan statistical areas (MSA) in order to create an economic and demographic
profile of the market to assess the economic drivers of future demand. For PNS, the core of the Pensacola
Catchment Area comprises the Pensacola-Ferry Pass-Brent, Florida MSA and the Baldwin County, Alabama
MSA.
Defining and assessing an airport’s primary, secondary and tertiary catchment areas requires an evaluation
of a number of factors. They include the accessibility of the airport and consideration of the alternative air
travel options available within the regional market. In the case of the air travel market in Northwest Florida
and Southeast Alabama, commercial air service is provided at four airports: Pensacola International
Pensacola International Airport Master Plan Update –Working Paper 3 3-2
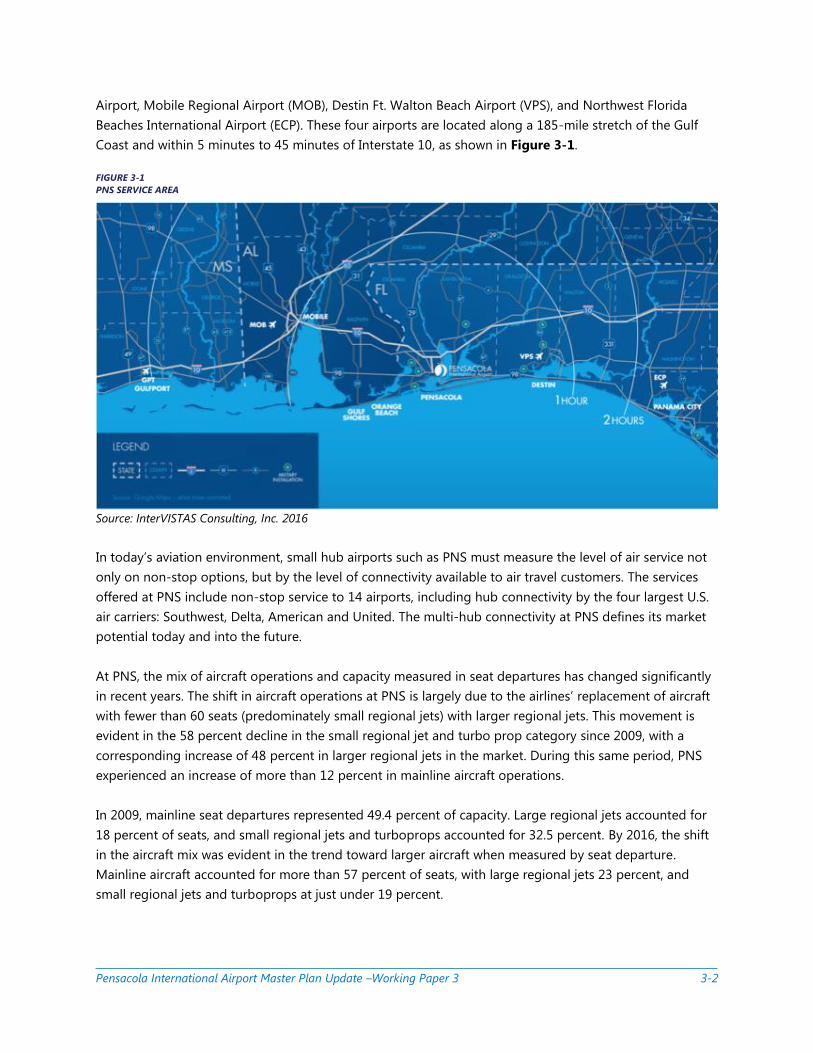
Airport, Mobile Regional Airport (MOB), Destin Ft. Walton Beach Airport (VPS), and Northwest Florida
Beaches International Airport (ECP). These four airports are located along a 185-mile stretch of the Gulf
Coast and within 5 minutes to 45 minutes of Interstate 10, as shown in Figure 3-1.
FIGURE 3-1
PNS SERVICE AREA
Source: InterVISTAS Consulting, Inc. 2016
In today’s aviation environment, small hub airports such as PNS must measure the level of air service not
only on non-stop options, but by the level of connectivity available to air travel customers. The services
offered at PNS include non-stop service to 14 airports, including hub connectivity by the four largest U.S.
air carriers: Southwest, Delta, American and United. The multi-hub connectivity at PNS defines its market
potential today and into the future.
At PNS, the mix of aircraft operations and capacity measured in seat departures has changed significantly
in recent years. The shift in aircraft operations at PNS is largely due to the airlines’ replacement of aircraft
with fewer than 60 seats (predominately small regional jets) with larger regional jets. This movement is
evident in the 58 percent decline in the small regional jet and turbo prop category since 2009, with a
corresponding increase of 48 percent in larger regional jets in the market. During this same period, PNS
experienced an increase of more than 12 percent in mainline aircraft operations.
In 2009, mainline seat departures represented 49.4 percent of capacity. Large regional jets accounted for
18 percent of seats, and small regional jets and turboprops accounted for 32.5 percent. By 2016, the shift
in the aircraft mix was evident in the trend toward larger aircraft when measured by seat departure.
Mainline aircraft accounted for more than 57 percent of seats, with large regional jets 23 percent, and
small regional jets and turboprops at just under 19 percent.
Pensacola International Airport Master Plan Update –Working Paper 3 3-3
3.3 HISTORICAL AVIATION ACTIVITY
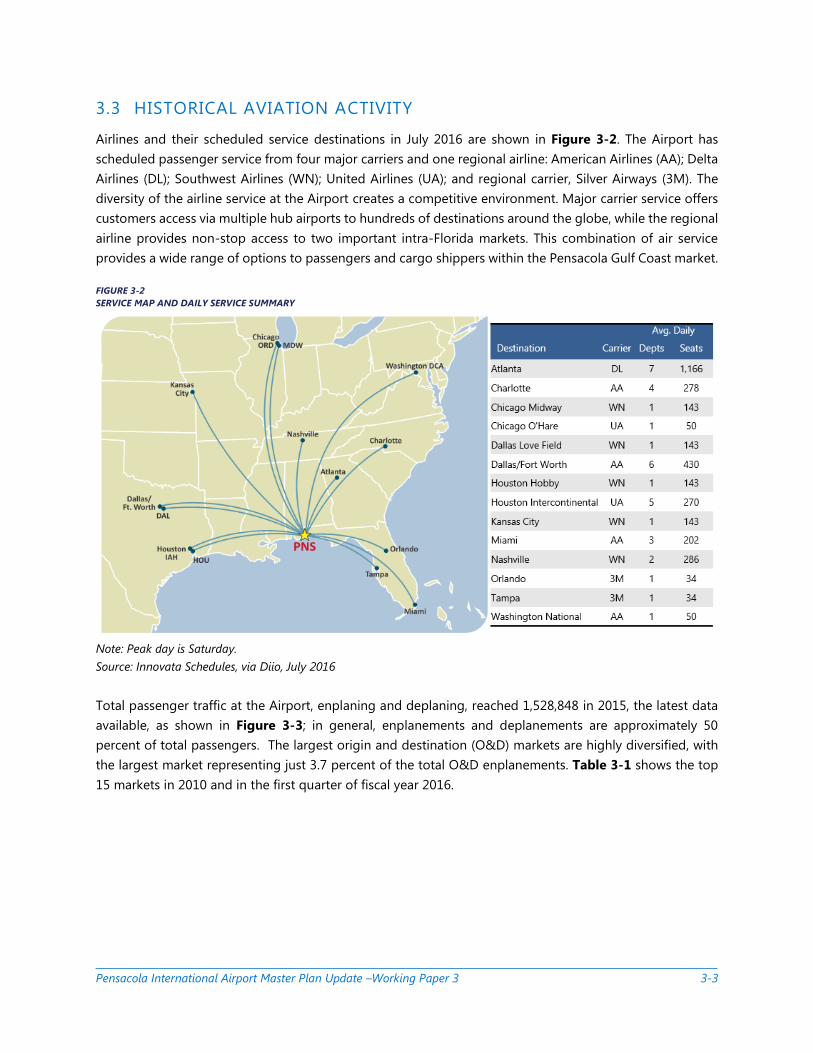
Airlines and their scheduled service destinations in July 2016 are shown in Figure 3-2. The Airport has
scheduled passenger service from four major carriers and one regional airline: American Airlines (AA); Delta
Airlines (DL); Southwest Airlines (WN); United Airlines (UA); and regional carrier, Silver Airways (3M). The
diversity of the airline service at the Airport creates a competitive environment. Major carrier service offers
customers access via multiple hub airports to hundreds of destinations around the globe, while the regional
airline provides non-stop access to two important intra-Florida markets. This combination of air service
provides a wide range of options to passengers and cargo shippers within the Pensacola Gulf Coast market.
FIGURE 3-2
SERVICE MAP AND DAILY SERVICE SUMMARY
Note: Peak day is Saturday.
Source: Innovata Schedules, via Diio, July 2016
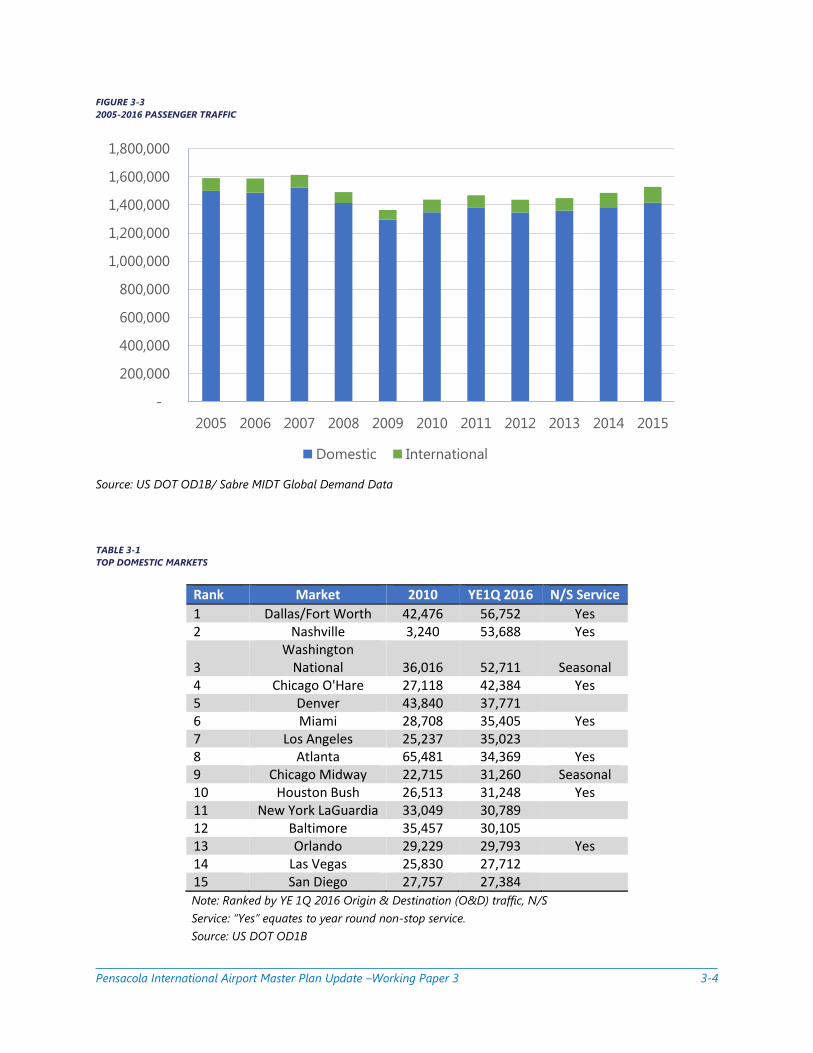
Total passenger traffic at the Airport, enplaning and deplaning, reached 1,528,848 in 2015, the latest data
available, as shown in Figure 3-3; in general, enplanements and deplanements are approximately 50
percent of total passengers. The largest origin and destination (O&D) markets are highly diversified, with
the largest market representing just 3.7 percent of the total O&D enplanements. Table 3-1 shows the top
15 markets in 2010 and in the first quarter of fiscal year 2016.
Pensacola International Airport Master Plan Update –Working Paper 3 3-4
FIGURE 3-3
2005-2016 PASSENGER TRAFFIC
Source: US DOT OD1B/ Sabre MIDT Global Demand Data
TABLE 3-1
TOP DOMESTIC MARKETS
Rank Market 2010 YE1Q 2016 N/S Service
1 Dallas/Fort Worth 42,476 56,752 Yes 2 Nashville 3,240 53,688 Yes
3 Washington
National 36,016 52,711 Seasonal 4 Chicago O'Hare 27,118 42,384 Yes 5 Denver 43,840 37,771 6 Miami 28,708 35,405 Yes 7 Los Angeles 25,237 35,023 8 Atlanta 65,481 34,369 Yes 9 Chicago Midway 22,715 31,260 Seasonal 10 Houston Bush 26,513 31,248 Yes 11 New York LaGuardia 33,049 30,789 12 Baltimore 35,457 30,105 13 Orlando 29,229 29,793 Yes 14 Las Vegas 25,830 27,712 15 San Diego 27,757 27,384 Note: Ranked by YE 1Q 2016 Origin & Destination (O&D) traffic, N/S
Service: “Yes” equates to year round non-stop service.
Source: US DOT OD1B
-
200,000
400,000
600,000
800,000
1,000,000
1,200,000
1,400,000
1,600,000
1,800,000
2005 2006 2007 2008 2009 2010 2011 2012 2013 2014 2015
Domestic International
Pensacola International Airport Master Plan Update –Working Paper 3 3-5
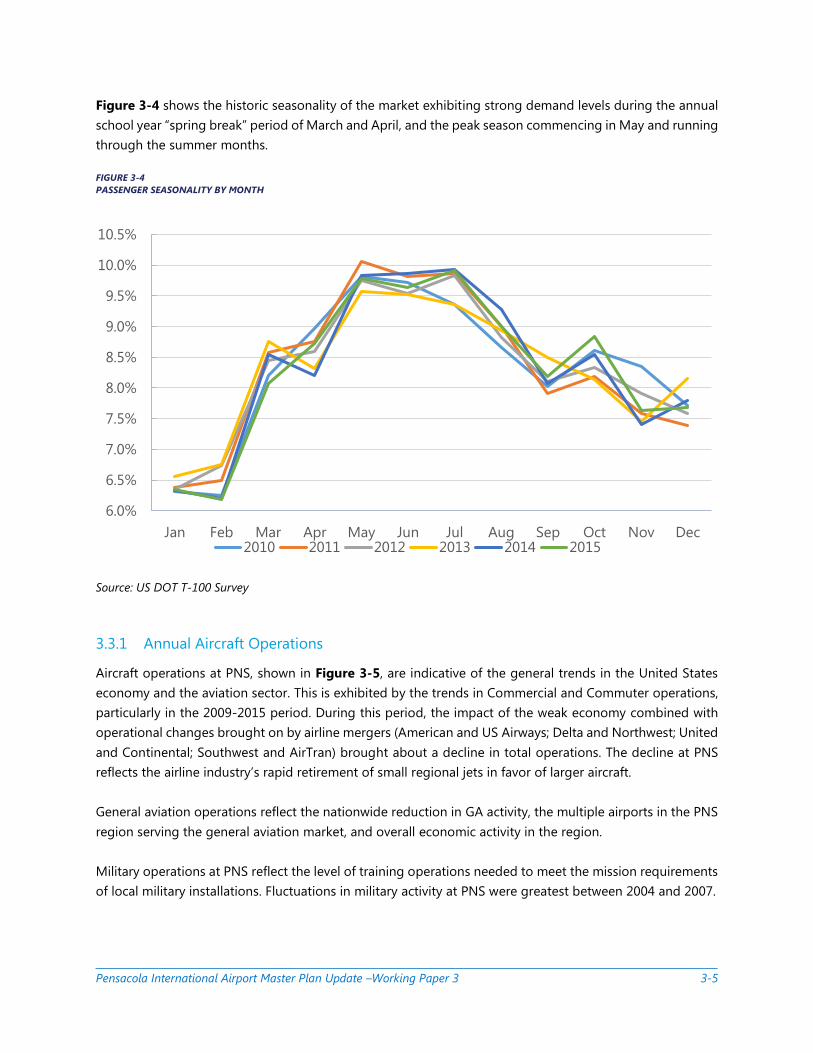
Figure 3-4 shows the historic seasonality of the market exhibiting strong demand levels during the annual
school year “spring break” period of March and April, and the peak season commencing in May and running
through the summer months.
FIGURE 3-4
PASSENGER SEASONALITY BY MONTH
Source: US DOT T-100 Survey
3.3.1 Annual Aircraft Operations
Aircraft operations at PNS, shown in Figure 3-5, are indicative of the general trends in the United States
economy and the aviation sector. This is exhibited by the trends in Commercial and Commuter operations,
particularly in the 2009-2015 period. During this period, the impact of the weak economy combined with
operational changes brought on by airline mergers (American and US Airways; Delta and Northwest; United
and Continental; Southwest and AirTran) brought about a decline in total operations. The decline at PNS
reflects the airline industry’s rapid retirement of small regional jets in favor of larger aircraft.
General aviation operations reflect the nationwide reduction in GA activity, the multiple airports in the PNS
region serving the general aviation market, and overall economic activity in the region.
Military operations at PNS reflect the level of training operations needed to meet the mission requirements
of local military installations. Fluctuations in military activity at PNS were greatest between 2004 and 2007.
6.0%
6.5%
7.0%
7.5%
8.0%
8.5%
9.0%
9.5%
10.0%
10.5%
Jan Feb Mar Apr May Jun Jul Aug Sep Oct Nov Dec2010 2011 2012 2013 2014 2015

Pensacola International Airport Master Plan Update –Working Paper 3 3-6
FIGURE 3-5
AIRCRAFT OPERATIONS 2004-2015
Source: Pensacola International Airport
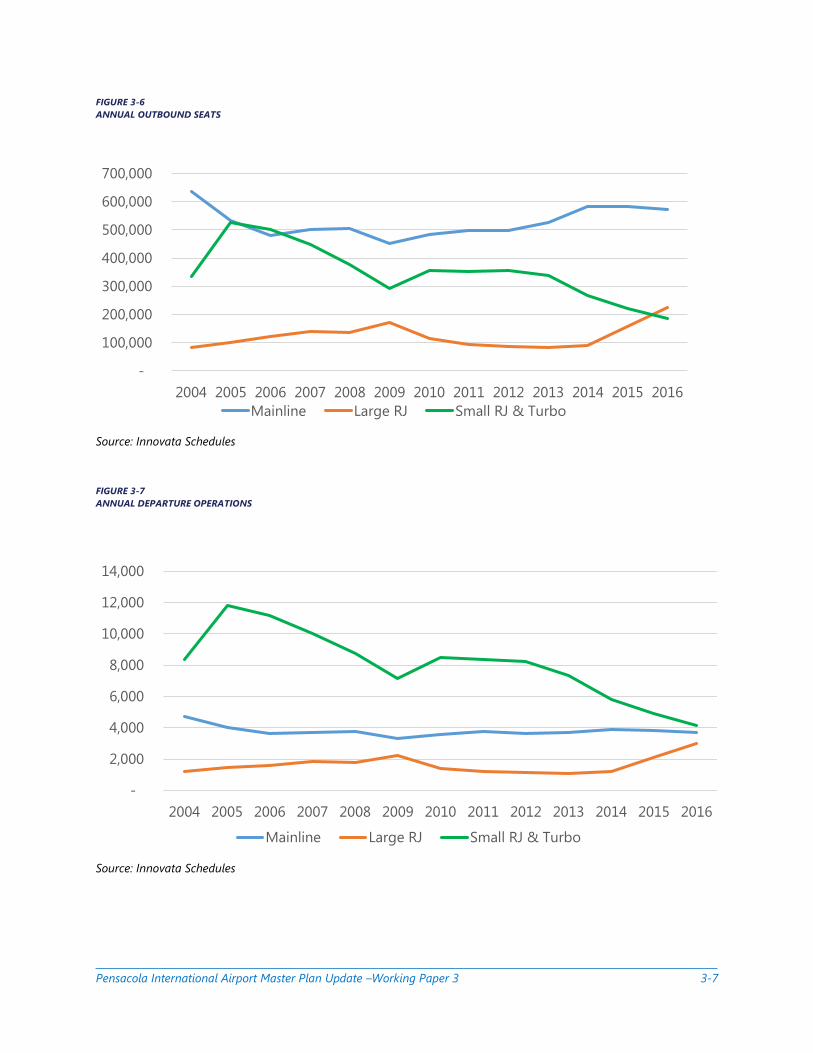
3.3.2 Aircraft Fleet Mix
Figure 3-6 and Figure 3-7 demonstrate the shift from smaller aircraft to larger aircraft – a trend that
appears consistently among small hub airports. The trend reflects the airlines’ decision to replace smaller
regional equipment with a mix of large regional jets and mainline equipment. At PNS, the major impact on
the aircraft fleet mix has been the substantial reduction of small regional jet and turboprop operations. In
2009, these operations represented 53 percent of the annual departures, and by 2016 they accounted for
only 38 percent. This trend in upgauging of equipment can be seen in 2016, as capacity on large regional
jets at PNS (measured in outbound seat departures) surpassed that offered on small regional aircraft for
the first time.
-
20,000
40,000
60,000
80,000
100,000
120,000
140,000
2004 2005 2006 2007 2008 2009 2010 2011 2012 2013 2014 2015Commercial & Commuter General Aviation Military
127,848 129,269
114,887 108,636 109,141
96,233
125,552 117,053
105,333 102,502
105,630 104,400
Pensacola International Airport Master Plan Update –Working Paper 3 3-7
FIGURE 3-6
ANNUAL OUTBOUND SEATS
Source: Innovata Schedules
FIGURE 3-7
ANNUAL DEPARTURE OPERATIONS
Source: Innovata Schedules
-
100,000
200,000
300,000
400,000
500,000
600,000
700,000
2004 2005 2006 2007 2008 2009 2010 2011 2012 2013 2014 2015 2016
Mainline Large RJ Small RJ & Turbo
-
2,000
4,000
6,000
8,000
10,000
12,000
14,000
2004 2005 2006 2007 2008 2009 2010 2011 2012 2013 2014 2015 2016
Mainline Large RJ Small RJ & Turbo
Pensacola International Airport Master Plan Update –Working Paper 3 3-8
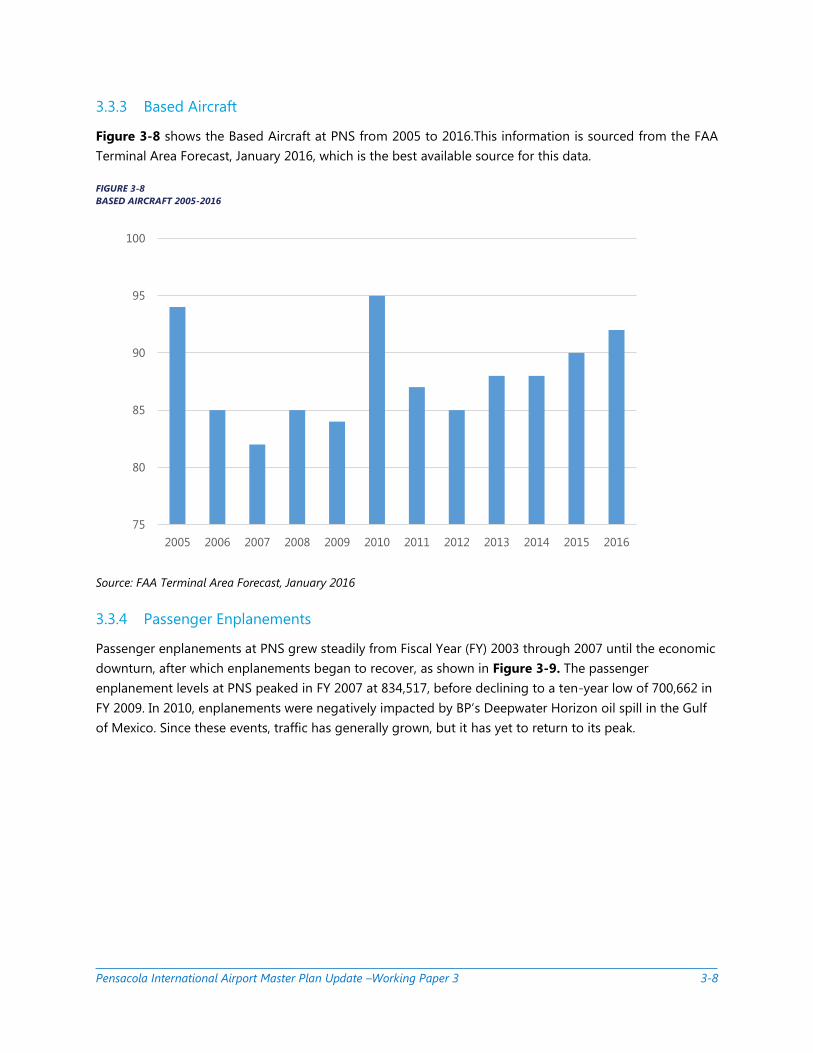
3.3.3 Based Aircraft
Figure 3-8 shows the Based Aircraft at PNS from 2005 to 2016.This information is sourced from the FAA
Terminal Area Forecast, January 2016, which is the best available source for this data.
FIGURE 3-8
BASED AIRCRAFT 2005-2016
Source: FAA Terminal Area Forecast, January 2016
3.3.4 Passenger Enplanements
Passenger enplanements at PNS grew steadily from Fiscal Year (FY) 2003 through 2007 until the economic
downturn, after which enplanements began to recover, as shown in Figure 3-9. The passenger
enplanement levels at PNS peaked in FY 2007 at 834,517, before declining to a ten-year low of 700,662 in
FY 2009. In 2010, enplanements were negatively impacted by BP’s Deepwater Horizon oil spill in the Gulf
of Mexico. Since these events, traffic has generally grown, but it has yet to return to its peak.
75
80
85
90
95
100
2005 2006 2007 2008 2009 2010 2011 2012 2013 2014 2015 2016

Pensacola International Airport Master Plan Update –Working Paper 3 3-9
FIGURE 3-9
HISTORICAL PASSENGER ENPLANEMENTS AND GROWTH RATE
Source: Pensacola International Airport Data
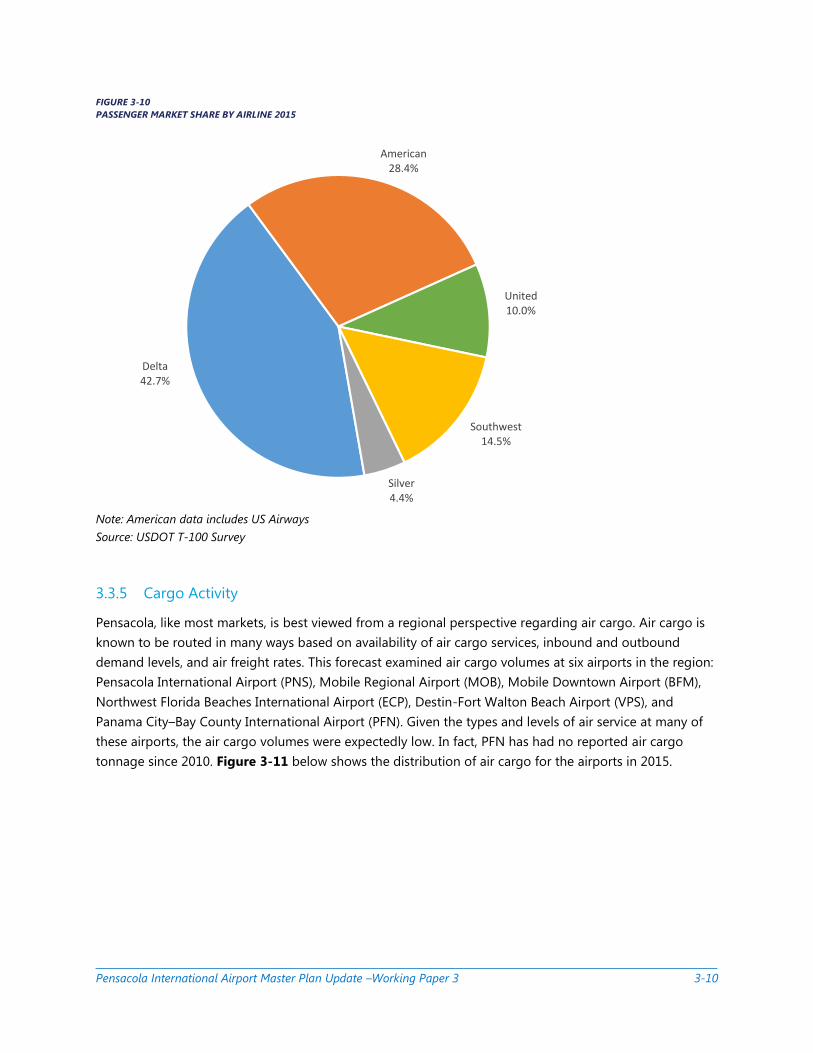
Figure 3-10 shows the 2015 enplanements by carrier at PNS - Delta, American, United, Southwest, and
Silver. Delta is the largest carrier at PNS, accounting for 43% of the total passengers.
-20%
-15%
-10%
-5%
0%
5%
10%
15%
0
100
200
300
400
500
600
700
800
900
Th
ou
san
ds
FY Enplanements Growth Rate
Pensacola International Airport Master Plan Update –Working Paper 3 3-10
FIGURE 3-10
PASSENGER MARKET SHARE BY AIRLINE 2015
Note: American data includes US Airways
Source: USDOT T-100 Survey
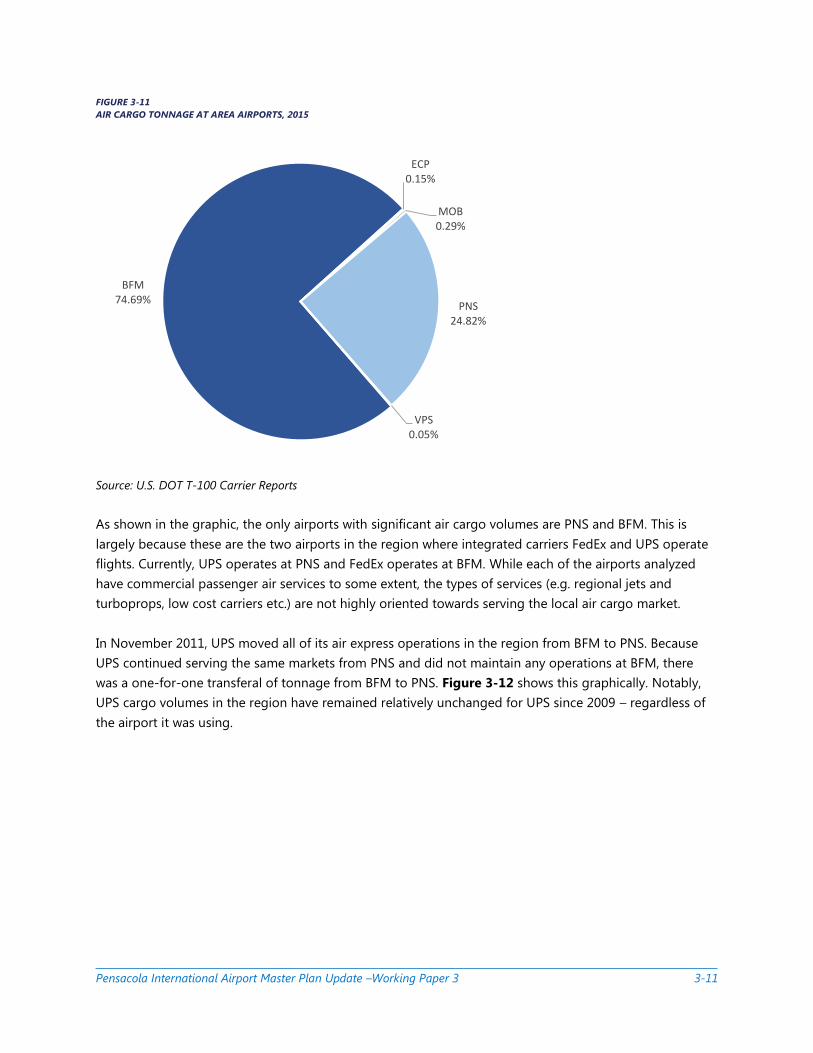
3.3.5 Cargo Activity
Pensacola, like most markets, is best viewed from a regional perspective regarding air cargo. Air cargo is
known to be routed in many ways based on availability of air cargo services, inbound and outbound
demand levels, and air freight rates. This forecast examined air cargo volumes at six airports in the region:
Pensacola International Airport (PNS), Mobile Regional Airport (MOB), Mobile Downtown Airport (BFM),
Northwest Florida Beaches International Airport (ECP), Destin-Fort Walton Beach Airport (VPS), and
Panama City–Bay County International Airport (PFN). Given the types and levels of air service at many of
these airports, the air cargo volumes were expectedly low. In fact, PFN has had no reported air cargo
tonnage since 2010. Figure 3-11 below shows the distribution of air cargo for the airports in 2015.
Delta42.7%
American28.4%
United10.0%
Southwest14.5%
Silver4.4%
Pensacola International Airport Master Plan Update –Working Paper 3 3-11
FIGURE 3-11
AIR CARGO TONNAGE AT AREA AIRPORTS, 2015
Source: U.S. DOT T-100 Carrier Reports
As shown in the graphic, the only airports with significant air cargo volumes are PNS and BFM. This is
largely because these are the two airports in the region where integrated carriers FedEx and UPS operate
flights. Currently, UPS operates at PNS and FedEx operates at BFM. While each of the airports analyzed
have commercial passenger air services to some extent, the types of services (e.g. regional jets and
turboprops, low cost carriers etc.) are not highly oriented towards serving the local air cargo market.
In November 2011, UPS moved all of its air express operations in the region from BFM to PNS. Because
UPS continued serving the same markets from PNS and did not maintain any operations at BFM, there
was a one-for-one transferal of tonnage from BFM to PNS. Figure 3-12 shows this graphically. Notably,
UPS cargo volumes in the region have remained relatively unchanged for UPS since 2009 – regardless of
the airport it was using.
BFM74.69%
ECP0.15%
MOB0.29%
PNS24.82%
VPS0.05%

Pensacola International Airport Master Plan Update –Working Paper 3 3-12
FIGURE 3-12
UPS AIR CARGO WEIGHT BY AIRPORT (2006-2015)
Source: U.S. DOT T-100 Carrier Reports
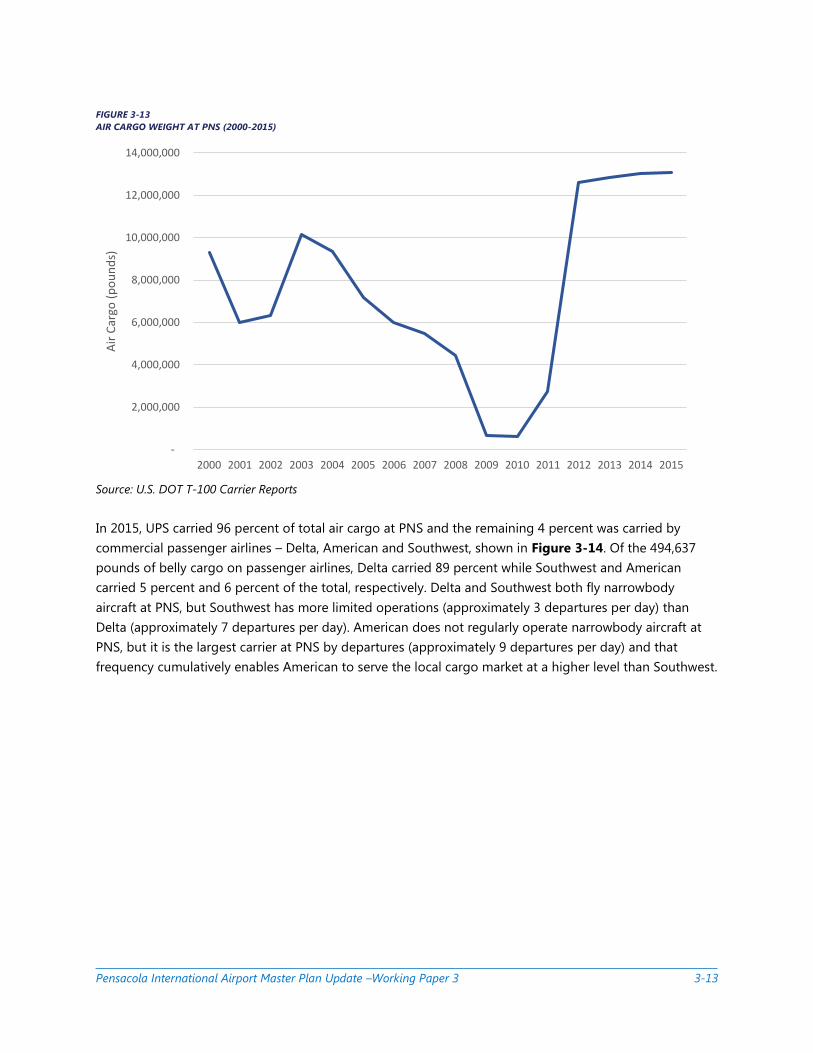
Prior to the entry of UPS at PNS in late 2011, air cargo volumes at PNS had been declining rapidly since
2003, as shown in Figure 3-13. Reasons for the loss of air cargo at PNS include:
» The security measures enacted after 9/11 which pushed much domestic air cargo to larger
airports and onto trucks
» The award of the U.S. Postal Service’s air mail contract to FedEx, which took away large volumes of
air mail from commercial passenger airlines
» The higher use of regional jets in smaller U.S. markets that had previously been served by larger
narrowbody aircraft with more cargo carrying capacity
» Bottoming out of the recession in 2010-2011.
0
2,000,000
4,000,000
6,000,000
8,000,000
10,000,000
12,000,000
14,000,000
16,000,000
2006 2007 2008 2009 2010 2011 2012 2013 2014 2015
Air
Car
go (
po
un
ds)
BFM PNS
Pensacola International Airport Master Plan Update –Working Paper 3 3-13
FIGURE 3-13
AIR CARGO WEIGHT AT PNS (2000-2015)
Source: U.S. DOT T-100 Carrier Reports
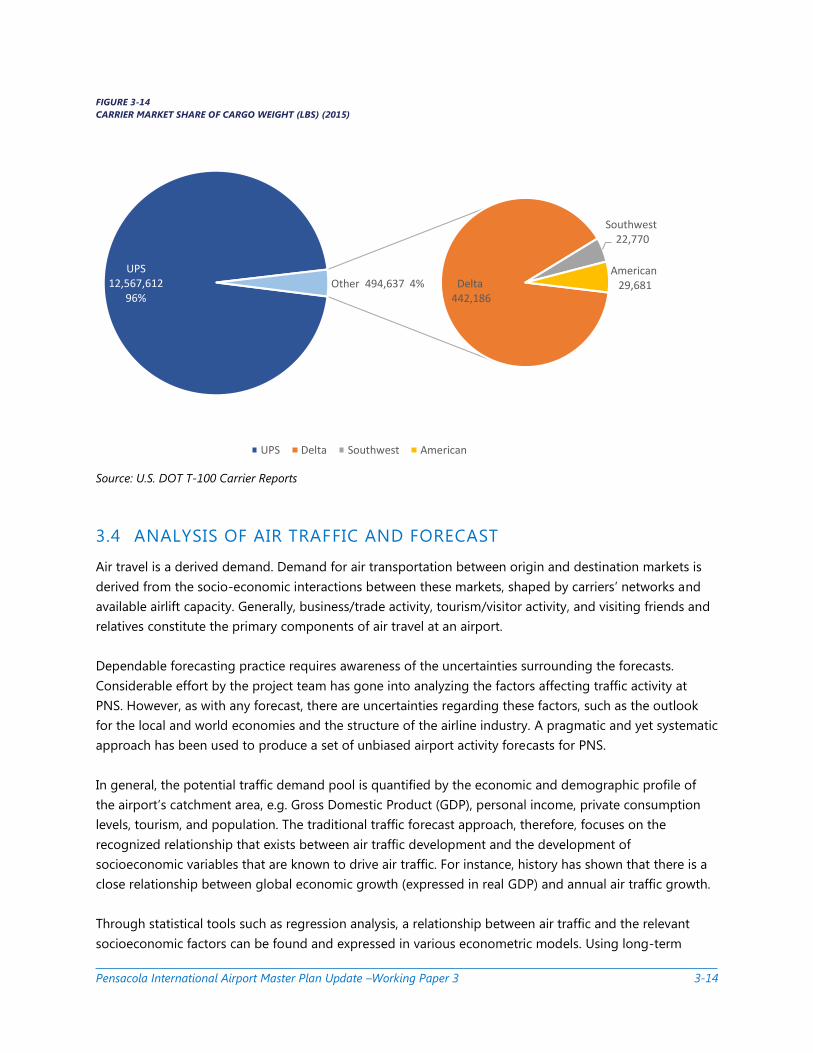
In 2015, UPS carried 96 percent of total air cargo at PNS and the remaining 4 percent was carried by
commercial passenger airlines – Delta, American and Southwest, shown in Figure 3-14. Of the 494,637
pounds of belly cargo on passenger airlines, Delta carried 89 percent while Southwest and American
carried 5 percent and 6 percent of the total, respectively. Delta and Southwest both fly narrowbody
aircraft at PNS, but Southwest has more limited operations (approximately 3 departures per day) than
Delta (approximately 7 departures per day). American does not regularly operate narrowbody aircraft at
PNS, but it is the largest carrier at PNS by departures (approximately 9 departures per day) and that
frequency cumulatively enables American to serve the local cargo market at a higher level than Southwest.
-
2,000,000
4,000,000
6,000,000
8,000,000
10,000,000
12,000,000
14,000,000
2000 2001 2002 2003 2004 2005 2006 2007 2008 2009 2010 2011 2012 2013 2014 2015
Air
Car
go (
po
un
ds)
Pensacola International Airport Master Plan Update –Working Paper 3 3-14
FIGURE 3-14
CARRIER MARKET SHARE OF CARGO WEIGHT (LBS) (2015)
Source: U.S. DOT T-100 Carrier Reports
3.4 ANALYSIS OF AIR TRAFFIC AND FORECAST
Air travel is a derived demand. Demand for air transportation between origin and destination markets is
derived from the socio-economic interactions between these markets, shaped by carriers’ networks and
available airlift capacity. Generally, business/trade activity, tourism/visitor activity, and visiting friends and
relatives constitute the primary components of air travel at an airport.
Dependable forecasting practice requires awareness of the uncertainties surrounding the forecasts.
Considerable effort by the project team has gone into analyzing the factors affecting traffic activity at
PNS. However, as with any forecast, there are uncertainties regarding these factors, such as the outlook
for the local and world economies and the structure of the airline industry. A pragmatic and yet systematic
approach has been used to produce a set of unbiased airport activity forecasts for PNS.
In general, the potential traffic demand pool is quantified by the economic and demographic profile of
the airport’s catchment area, e.g. Gross Domestic Product (GDP), personal income, private consumption
levels, tourism, and population. The traditional traffic forecast approach, therefore, focuses on the
recognized relationship that exists between air traffic development and the development of
socioeconomic variables that are known to drive air traffic. For instance, history has shown that there is a
close relationship between global economic growth (expressed in real GDP) and annual air traffic growth.
Through statistical tools such as regression analysis, a relationship between air traffic and the relevant
socioeconomic factors can be found and expressed in various econometric models. Using long-term
UPS12,567,612
96%Delta
442,186
Southwest22,770
American29,681 Other 494,637 4%
UPS Delta Southwest American
Pensacola International Airport Master Plan Update –Working Paper 3 3-15
projections of the independent variables like GDP, income, etc., a level of future traffic can then be
predicted.
The project team analyzed the various factors that have historically driven air traffic activity in the
Pensacola catchment area. It is reasonable to assume that the factors that have historically driven air travel
demand will continue to drive air travel demand in the future, and in the same proportions. For instance,
all things being equal, if a one percent increase in regional GDP is found to be highly correlated to a one
percent increase in air travel historically, an analytical model can be developed to then estimate future air
travel levels based on forecasts of GDP. Econometric models enable this forecasting technique and allow
for testing to ensure that the forecast results are reasonable and acceptable.
As described in the rest of this chapter, forecasts have been produced for the following:
» Enplaned passengers
» Aircraft operations (commercial, general aviation, and military)
» Air cargo volume
The following sections describe the methodology used to forecast each separate segment; the results are
presented in the next section.
3.5 TREND FORECASTS
The Base Case Enplaned Passenger Forecast process began with a review of the most up-to-date versions
of the regional forecasts published by aviation industry’s leading sources. These sources include:
» FAA Aerospace Forecast – FY2016-2036
» FAA 2015 Terminal Area Forecast (TAF) – Published January 2016
» Boeing Current Market Outlook – 2016-2035
» Airbus, Global Market Forecast – 2016-2035
The trends identified in these reports were used to help formulate several parts of the Base Case forecasts.
The FAA Aerospace Forecast projects a 4.2 percent growth rate year-over-year for 2015 to 2016 in the
domestic enplanement passenger sector, with an average annual growth rate of 1.9 percent over the full
forecast period. Additionally, the FAA TAF Forecast for PNS projects a compound annual growth rate of
2.0 percent for enplanements for 2015 through 2035. These growth rates are in line with and have been
used to confirm appropriateness of the growth rates projected in the Base Case Forecast in the sections
that follow.
These FAA forecasts were also used to develop the forecasts for General Aviation operations, Military
operations, and based aircraft.
Pensacola International Airport Master Plan Update –Working Paper 3 3-16
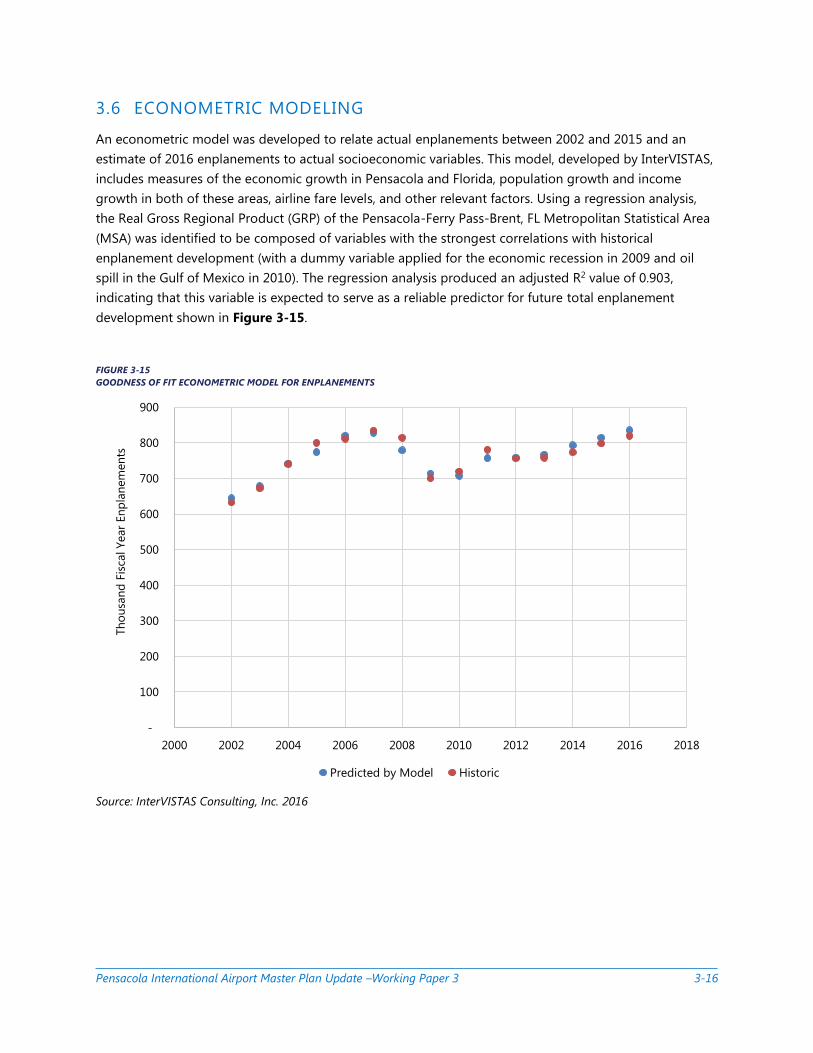
3.6 ECONOMETRIC MODELING
An econometric model was developed to relate actual enplanements between 2002 and 2015 and an
estimate of 2016 enplanements to actual socioeconomic variables. This model, developed by InterVISTAS,
includes measures of the economic growth in Pensacola and Florida, population growth and income
growth in both of these areas, airline fare levels, and other relevant factors. Using a regression analysis,
the Real Gross Regional Product (GRP) of the Pensacola-Ferry Pass-Brent, FL Metropolitan Statistical Area
(MSA) was identified to be composed of variables with the strongest correlations with historical
enplanement development (with a dummy variable applied for the economic recession in 2009 and oil
spill in the Gulf of Mexico in 2010). The regression analysis produced an adjusted R2 value of 0.903,
indicating that this variable is expected to serve as a reliable predictor for future total enplanement
development shown in Figure 3-15.
FIGURE 3-15
GOODNESS OF FIT ECONOMETRIC MODEL FOR ENPLANEMENTS
Source: InterVISTAS Consulting, Inc. 2016
-
100
200
300
400
500
600
700
800
900
2000 2002 2004 2006 2008 2010 2012 2014 2016 2018
Th
ou
san
d F
isca
l Year
En
pla
nem
en
ts
Predicted by Model Historic
Pensacola International Airport Master Plan Update –Working Paper 3 3-17
The model for determining total O&D traffic can be described by the following equation:
Enplanements = c1 + c2 * (Real Pensacola GRP)
where:
» Enplanements are fiscal year enplaned passengers at PNS
» Real Pensacola GRP is the Pensacola-Ferry Pass-Brent, FL MSA Gross Regional Product adjusted
for inflation
» c1 and c2 are the estimated model parameters capturing the impact of various factors on
enplanement growth at the airport, where the c1 coefficient represents the intercept of the linear
regression formula and the c2 coefficient represents the slope of the linear regression formula
» c1 coefficient = -150327.152
» c2 coefficient = 60.204
For the independent variable of historical and forecast data for the Pensacola-Ferry Pass-Brent, FL MSA
Gross Regional Product, this model utilized the long-term economic forecast published in the 2015
edition of the Complete Economic and Demographic Data Source (CEDDS) by Woods & Poole Economics.
This is a reputable source for economic forecasting for markets within the United States and is also an
approved source under the FAA guidelines published in Forecasting Aviation Activity by Airport.
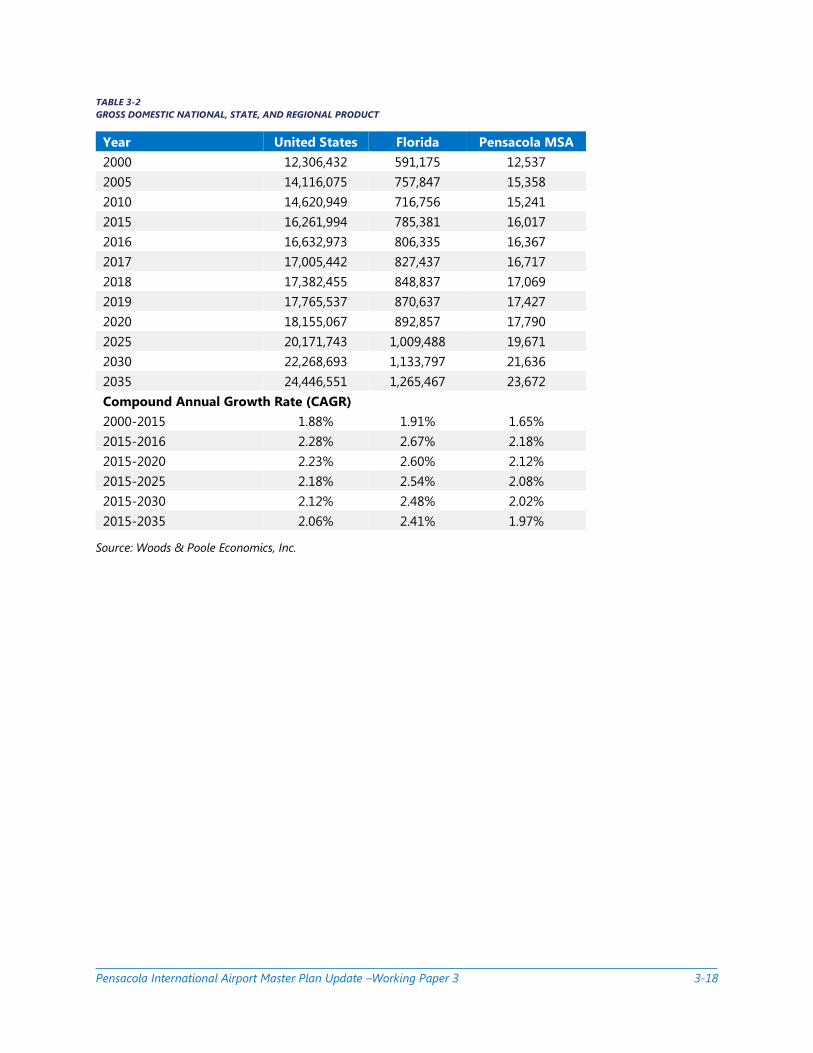
The following forecast of Gross Domestic, State, and Regional Product for the United States, Florida, and
the Pensacola-Ferry Pass-Brent, FL MSA are displayed in Table 3-2.
Pensacola International Airport Master Plan Update –Working Paper 3 3-18
TABLE 3-2
GROSS DOMESTIC NATIONAL, STATE, AND REGIONAL PRODUCT
Source: Woods & Poole Economics, Inc.
Year United States Florida Pensacola MSA
2000 12,306,432 591,175 12,537
2005 14,116,075 757,847 15,358
2010 14,620,949 716,756 15,241
2015 16,261,994 785,381 16,017
2016 16,632,973 806,335 16,367
2017 17,005,442 827,437 16,717
2018 17,382,455 848,837 17,069
2019 17,765,537 870,637 17,427
2020 18,155,067 892,857 17,790
2025 20,171,743 1,009,488 19,671
2030 22,268,693 1,133,797 21,636
2035 24,446,551 1,265,467 23,672
Compound Annual Growth Rate (CAGR)
2000-2015 1.88% 1.91% 1.65%
2015-2016 2.28% 2.67% 2.18%
2015-2020 2.23% 2.60% 2.12%
2015-2025 2.18% 2.54% 2.08%
2015-2030 2.12% 2.48% 2.02%
2015-2035 2.06% 2.41% 1.97%
Pensacola International Airport Master Plan Update –Working Paper 3 3-19
3.7 BOTTOM-UP SCENARIO FORECASTS
The bottom-up scenario portion of the forecast consists of an estimate of near-term future total
enplanements for 2016 through 2020, based on growth in capacity projected by carriers currently serving
PNS combined with the GRP of the Pensacola MSA. These estimates are supplemented by expected
changes in passenger demand patterns based on information gathered via site visits, direct airline and
stakeholder input, industry intelligence and other information sources.
The following list of base assumptions were informed by the aforementioned sources. The subsequent
assumptions were considered when calculating the bottom-up estimates for the next five years and the
econometric modeling for the longer term projections in Base Case Passenger Enplanements Forecast:
» The Air Carrier category will continue to outpace the Air Commuter/Air Taxi category as the core
carriers continue to introduce mainline equipment at PNS. The Air Carrier category is expected to
account for approximately 65 percent of the commercial enplanements by 2035
» Delta plans to grow capacity in the market three percent year-over-year for the next few years
» Southwest service has stabilized at three times daily service with limited Saturday only seasonal
services
» American Airlines and United Airlines are upgauging capacity as appropriate on a seasonal basis
» Silver plans to maintain current service levels for the foreseeable future
» The regional jet fleet will continue its growth in available seats due to the retirement of 60- to
100-seat regional jets and the influx of 100- to 150-seat regional jets.
» A “dummy variable” is applied to the regression analysis to normalize the data for the impacts of
the economic recession in 2009 and Deep Horizon oil spill in the Gulf of Mexico in 2010
» High and Low Case forecast scenarios will be calculated utilizing Penacola GRP forecasted growth
projections that are increased and decreased by 10 percent, respectively, to account for over- and
under-achieving economic conditions
» All the forecasts provided are unconstrained forecasts that have been developed without
consideration of the ability of the current or future airport facilities to handle the forecast traffic. If
airport capacity is suitable to fully accommodate future unconstrained demand, some of this
traffic may not materialize
3.8 ANNUAL PASSENGER AND CARGO FORECASTS
3.8.1 Annual Passenger Enplanement Forecast
The Base Case Forecast and two sensitivity forecasts were calculated to reflect the possibility of the
economic forecasts underachieving (Low Case) or overachieving (High Case) the levels put forth in the
Woods & Poole Gross Domestic Product Forecast for the Pensacola MSA. The Low Case utilizes the Base
Case GDP growth reduced by 10 percent, while the High Case applies a 10 percent increase to the
forecast GDP growth rate. Overall Compound Annual Growth Rates for the forecast period of 2015
through 2035 are expected to be 2.37 percent in the Base Case, 1.83 percent in the Low Case, and 2.90
percent in High Case. The Base Case of enplaned passengers at PNS and the subsequent sensitivity
analysis forecasts for the Low and High Cases are displayed in Table 3-3.

Pensacola International Airport Master Plan Update –Working Paper 3 3-20
TABLE 3-3
ENPLANED PASSENGER FORECASTS
Year Base Case Low Case High Case
2002 632,379 632,379 632,379
2005 799,759 799,759 799,759
2010 719,648 719,648 719,648
2015 797,854 797,854 797,854
2016 819,396 819,396 819,396
2017 844,722 839,516 850,005
2018 870,048 859,635 880,614
2019 895,373 879,755 911,223
2020 920,699 899,874 941,832
2025 1,033,956 982,753 1,087,206
2030 1,152,239 1,065,651 1,244,523
2035 1,274,815 1,147,731 1,413,625
Compound Annual Growth Rate (CAGR)
2002-2015 1.80% 1.80% 1.80%
2015-2016 2.70% 2.70% 2.70%
2015-2020 2.91% 2.44% 3.37%
2015-2025 2.63% 2.11% 3.14%
2015-2030 2.48% 1.95% 3.01%
2015-2035 2.37% 1.83% 2.90%
Source: InterVISTAS Consulting, Inc. 2016
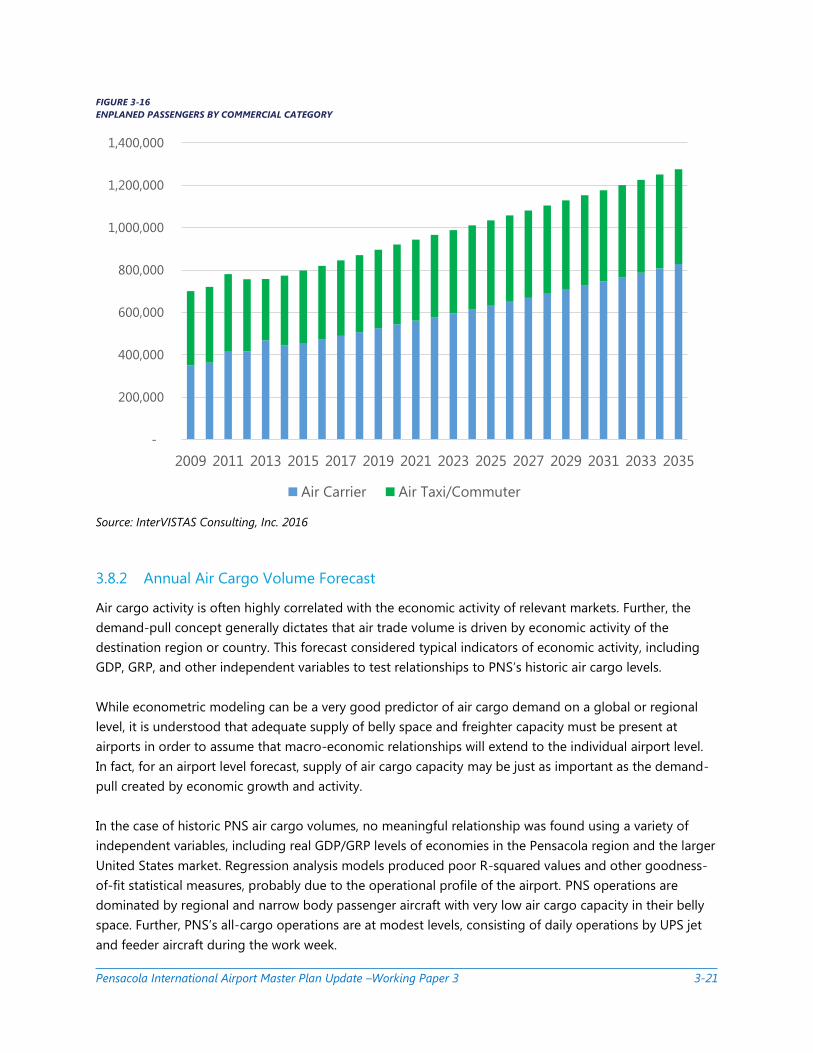
Figure 3-16 breaks down the Base Case enplaned passenger forecast by commercial carrier category
type: Air Carrier and Air Taxi/Commuter. Air Carrier enplanements are those passengers departing PNS on
flights operated by mainline air carriers on aircraft with 60 or more seats whereas Air Taxi/Commuter
enplanements are those passengers departing on flights operated by regional carriers on aircraft with
fewer than 60 seats. In 2015, the Air Carrier category represented 43 percent of all enplanements, which is
forecast to grow to 65 percent by 2035.
Pensacola International Airport Master Plan Update –Working Paper 3 3-21
FIGURE 3-16
ENPLANED PASSENGERS BY COMMERCIAL CATEGORY
Source: InterVISTAS Consulting, Inc. 2016
3.8.2 Annual Air Cargo Volume Forecast
Air cargo activity is often highly correlated with the economic activity of relevant markets. Further, the
demand-pull concept generally dictates that air trade volume is driven by economic activity of the
destination region or country. This forecast considered typical indicators of economic activity, including
GDP, GRP, and other independent variables to test relationships to PNS’s historic air cargo levels.
While econometric modeling can be a very good predictor of air cargo demand on a global or regional
level, it is understood that adequate supply of belly space and freighter capacity must be present at
airports in order to assume that macro-economic relationships will extend to the individual airport level.
In fact, for an airport level forecast, supply of air cargo capacity may be just as important as the demand-
pull created by economic growth and activity.
In the case of historic PNS air cargo volumes, no meaningful relationship was found using a variety of
independent variables, including real GDP/GRP levels of economies in the Pensacola region and the larger
United States market. Regression analysis models produced poor R-squared values and other goodness-
of-fit statistical measures, probably due to the operational profile of the airport. PNS operations are
dominated by regional and narrow body passenger aircraft with very low air cargo capacity in their belly
space. Further, PNS’s all-cargo operations are at modest levels, consisting of daily operations by UPS jet
and feeder aircraft during the work week.
-
200,000
400,000
600,000
800,000
1,000,000
1,200,000
1,400,000
2009 2011 2013 2015 2017 2019 2021 2023 2025 2027 2029 2031 2033 2035
Air Carrier Air Taxi/Commuter
Pensacola International Airport Master Plan Update –Working Paper 3 3-22
For these reasons, macro-economic air cargo relationships should not be expected to be reflected in the
historic air cargo statistics at the airport. An alternative method of forecasting air cargo at PNS uses
estimates of cargo that will be carried in the bellies of passenger aircraft and by all-cargo aircraft.
Using the forecasted passengers and passenger aircraft movements at PNS, the alternative forecast
applied assumptions of belly cargo capacity and typical tonnage for those aircraft during each year of the
forecast. For passenger belly cargo forecasts, the forecast further distinguished between mainline aircraft
(i.e. true narrowbodies) and regional aircraft (i.e. regional jets and turboprops). Since 2009, belly cargo
onboard mainline passenger aircraft has declined from 97 pounds per mainline air transport movement to
56 pounds in 2015. This decline is largely due to two factors: 1) Delta mainline aircraft carried fewer cargo
pounds per operation and 2) Southwest operates many of its PNS flights with no inbound or outbound
cargo.
Despite these recent declines in average pounds per mainline operation, the forecast also assumes that
more belly cargo will be moved by those airlines as PNS carriers upgauge and add mainline aircraft
operations. This assumption was validated through the interview process with the airlines currently serving
PNS. By 2035, an average of 70 pounds will be carried per mainline operation.
In addition, very small amounts of cargo are carried by regional aircraft (typically averaging between 0.5
and 1.5 pounds per operation). Applying the estimated annual average cargo pounds per passenger
operation type to the previously forecasted commercial passenger operations yields an annual belly cargo
forecast at PNS.
To complete the cargo forecast, the tonnage to be carried by all-cargo freighter aircraft was calculated.
UPS has approximately 10 operations per week with jet aircraft and 10 operations per week with smaller
turboprop aircraft (operated by Ameriflight). Since UPS moved its regional air operations to PNS from
Mobile in 2011, all-cargo aircraft have consistently operated at levels close to these counts. In fact, even
before the move to PNS, UPS operated the same number of flights at Mobile for many years. Interviews
with UPS revealed the airline has no plans to change its level of flight operations at the Airport and will
likely continue to operate consistent with past levels.
Based on recent growth rates and market dynamics, the cargo forecast concluded there would be modest
development of the cargo pounds per operation over the forecast period. This conclusion was supported
by direct interview responses from UPS, as well as historic air cargo levels at MOB and PNS over a
sustained period of time.
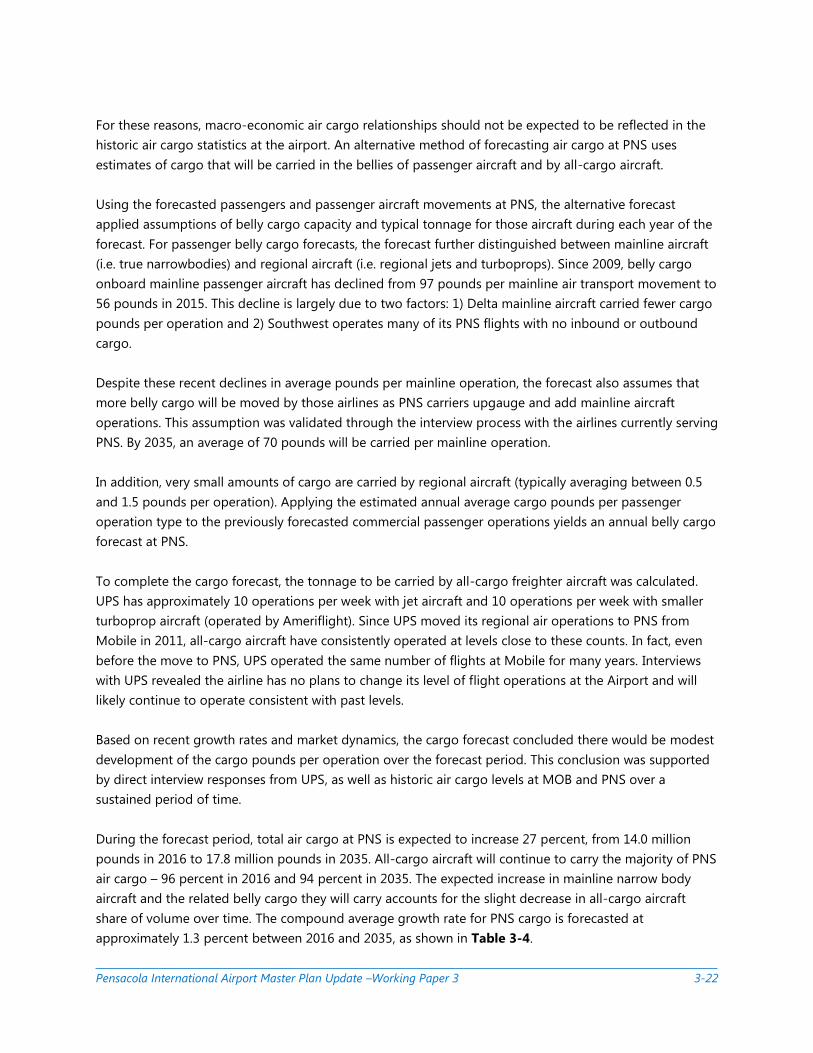
During the forecast period, total air cargo at PNS is expected to increase 27 percent, from 14.0 million
pounds in 2016 to 17.8 million pounds in 2035. All-cargo aircraft will continue to carry the majority of PNS
air cargo – 96 percent in 2016 and 94 percent in 2035. The expected increase in mainline narrow body
aircraft and the related belly cargo they will carry accounts for the slight decrease in all-cargo aircraft
share of volume over time. The compound average growth rate for PNS cargo is forecasted at
approximately 1.3 percent between 2016 and 2035, as shown in Table 3-4.
Pensacola International Airport Master Plan Update –Working Paper 3 3-23
TABLE 3-4
AIR CARGO FORECAST SUMMARY (2016-2035)
Year Air Cargo
(pounds)
Compound Avg. Growth
Rate (relative to Base Year)
Historic
2011 2,747,535
2012 12,625,683
2013 12,818,948
2014 13,038,818
2015 13,062,249
Base Year
2016 14,005,129
Forecast
2020 14,863,418 0
2025 16,017,562 1.50%
2030 16,859,185 1.30%
2035 17,754,388 1.30%
Source: InterVISTAS Consulting, Inc. 2016
3.9 PEAK HOUR / PEAK DAY FORECASTS
To support the airport facilities planning process, peak period forecasts were derived from the annual
forecast numbers. Peak period forecasts present the air traffic activity levels that can be expected during
peak hours. Typically the peak number of aircraft movements drives the layout of the airfield, and peak
hour passenger enplanements drives the requirements for holdrooms, baggage and concourse space.
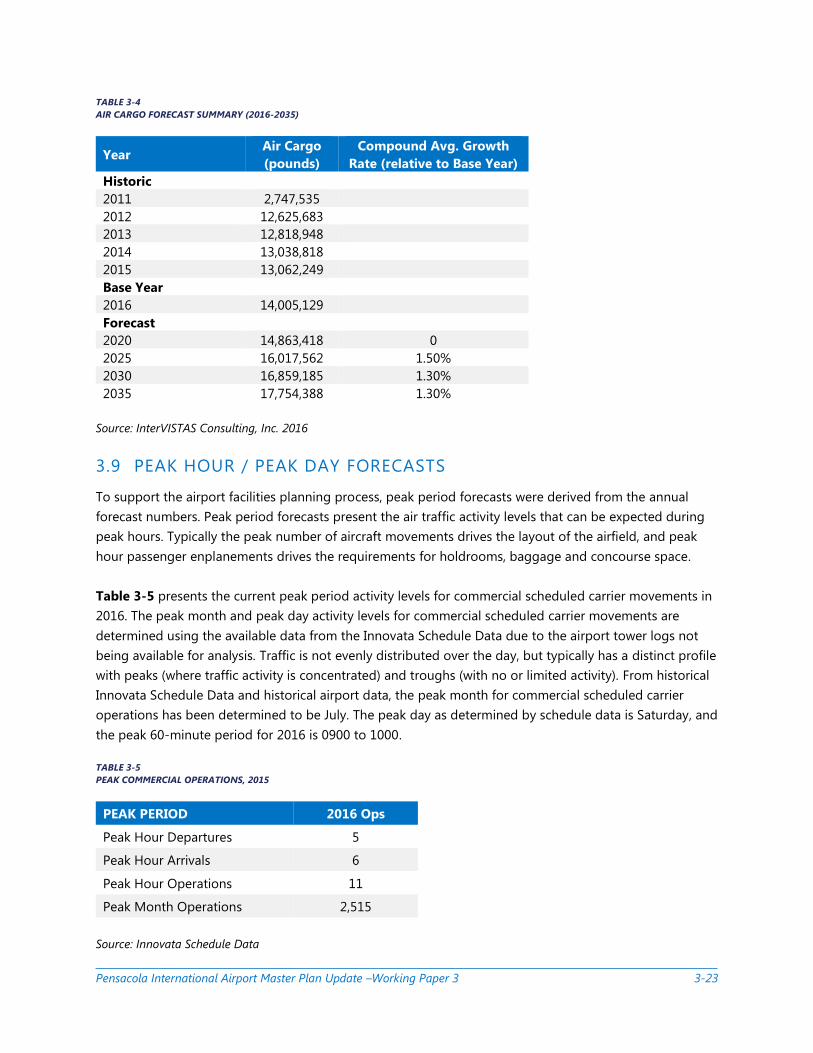
Table 3-5 presents the current peak period activity levels for commercial scheduled carrier movements in
2016. The peak month and peak day activity levels for commercial scheduled carrier movements are
determined using the available data from the Innovata Schedule Data due to the airport tower logs not
being available for analysis. Traffic is not evenly distributed over the day, but typically has a distinct profile
with peaks (where traffic activity is concentrated) and troughs (with no or limited activity). From historical
Innovata Schedule Data and historical airport data, the peak month for commercial scheduled carrier
operations has been determined to be July. The peak day as determined by schedule data is Saturday, and
the peak 60-minute period for 2016 is 0900 to 1000.
TABLE 3-5
PEAK COMMERCIAL OPERATIONS, 2015
PEAK PERIOD 2016 Ops
Peak Hour Departures 5
Peak Hour Arrivals 6
Peak Hour Operations 11
Peak Month Operations 2,515
Source: Innovata Schedule Data
Pensacola International Airport Master Plan Update –Working Paper 3 3-24
The ratio of peak month aircraft operations to annual aircraft operations was used to forecast peak month
operations for 2017 through 2035. The ratio of peak month operations to annual operations is expected
to remain constant during the forecast period. Utilizing this methodology, the forecast of commercial
scheduled carrier peak month operations was calculated off the base 2016 movements and grown by this
ratio.
Utilizing the peak month operations forecast, a ratio of the peak hour operations to peak month
operations calculated. The forecast of commercial scheduled carrier peak hour operations were calculated
off the base 2016 peak hour operations and grown by this ratio. The ratio of peak hour operations to peak
month operations is expected to remain constant during the forecast period.
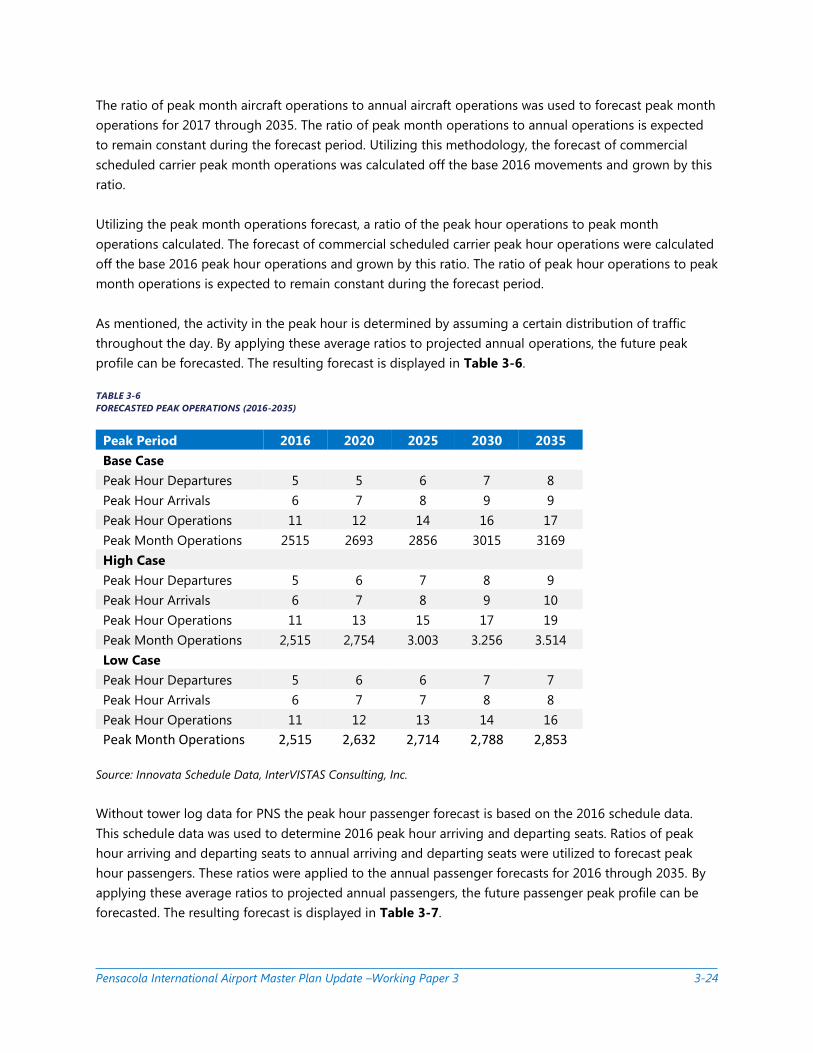
As mentioned, the activity in the peak hour is determined by assuming a certain distribution of traffic
throughout the day. By applying these average ratios to projected annual operations, the future peak
profile can be forecasted. The resulting forecast is displayed in Table 3-6.
TABLE 3-6
FORECASTED PEAK OPERATIONS (2016-2035)
Peak Period 2016 2020 2025 2030 2035
Base Case
Peak Hour Departures 5 5 6 7 8
Peak Hour Arrivals 6 7 8 9 9
Peak Hour Operations 11 12 14 16 17
Peak Month Operations 2515 2693 2856 3015 3169
High Case
Peak Hour Departures 5 6 7 8 9
Peak Hour Arrivals 6 7 8 9 10
Peak Hour Operations 11 13 15 17 19
Peak Month Operations 2,515 2,754 3.003 3.256 3.514
Low Case
Peak Hour Departures 5 6 6 7 7
Peak Hour Arrivals 6 7 7 8 8
Peak Hour Operations 11 12 13 14 16
Peak Month Operations 2,515 2,632 2,714 2,788 2,853
Source: Innovata Schedule Data, InterVISTAS Consulting, Inc.
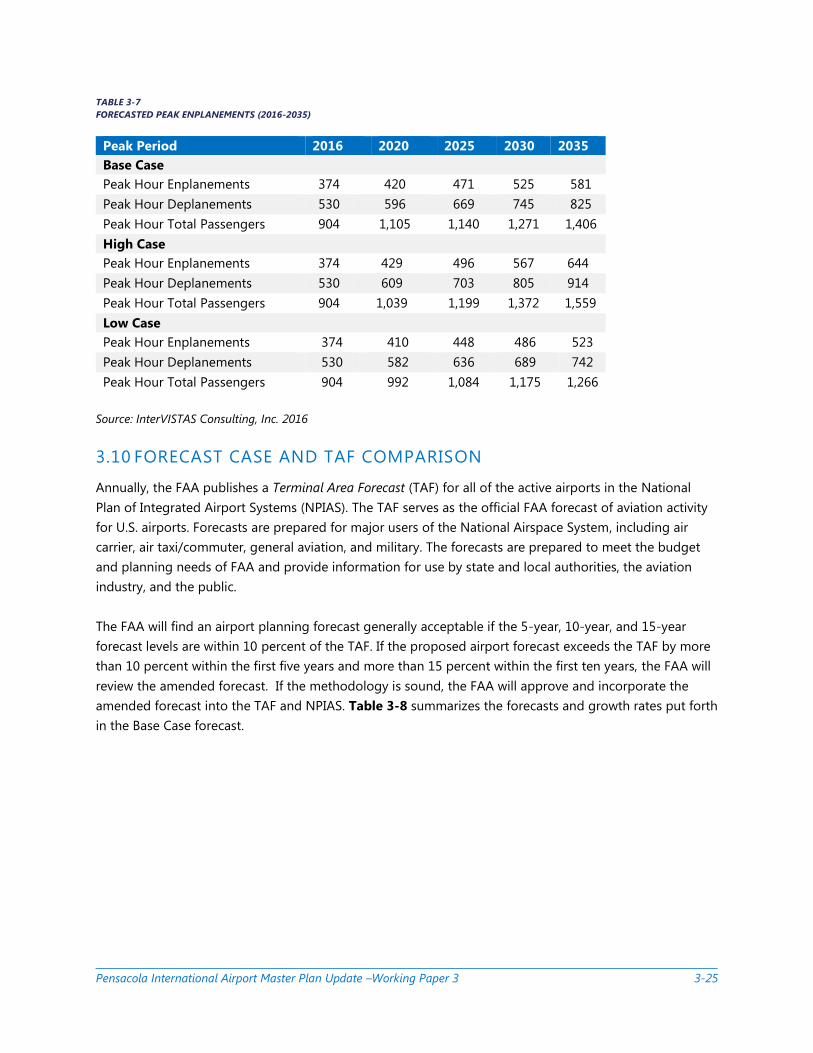
Without tower log data for PNS the peak hour passenger forecast is based on the 2016 schedule data.
This schedule data was used to determine 2016 peak hour arriving and departing seats. Ratios of peak
hour arriving and departing seats to annual arriving and departing seats were utilized to forecast peak
hour passengers. These ratios were applied to the annual passenger forecasts for 2016 through 2035. By
applying these average ratios to projected annual passengers, the future passenger peak profile can be
forecasted. The resulting forecast is displayed in Table 3-7.
Pensacola International Airport Master Plan Update –Working Paper 3 3-25
TABLE 3-7
FORECASTED PEAK ENPLANEMENTS (2016-2035)
Peak Period 2016 2020 2025 2030 2035
Base Case
Peak Hour Enplanements 374 420 471 525 581
Peak Hour Deplanements 530 596 669 745 825
Peak Hour Total Passengers 904 1,105 1,140 1,271 1,406
High Case
Peak Hour Enplanements 374 429 496 567 644
Peak Hour Deplanements 530 609 703 805 914
Peak Hour Total Passengers 904 1,039 1,199 1,372 1,559
Low Case
Peak Hour Enplanements 374 410 448 486 523
Peak Hour Deplanements 530 582 636 689 742
Peak Hour Total Passengers 904 992 1,084 1,175 1,266
Source: InterVISTAS Consulting, Inc. 2016
3.10 FORECAST CASE AND TAF COMPARISON
Annually, the FAA publishes a Terminal Area Forecast (TAF) for all of the active airports in the National
Plan of Integrated Airport Systems (NPIAS). The TAF serves as the official FAA forecast of aviation activity
for U.S. airports. Forecasts are prepared for major users of the National Airspace System, including air
carrier, air taxi/commuter, general aviation, and military. The forecasts are prepared to meet the budget
and planning needs of FAA and provide information for use by state and local authorities, the aviation
industry, and the public.
The FAA will find an airport planning forecast generally acceptable if the 5-year, 10-year, and 15-year
forecast levels are within 10 percent of the TAF. If the proposed airport forecast exceeds the TAF by more
than 10 percent within the first five years and more than 15 percent within the first ten years, the FAA will
review the amended forecast. If the methodology is sound, the FAA will approve and incorporate the
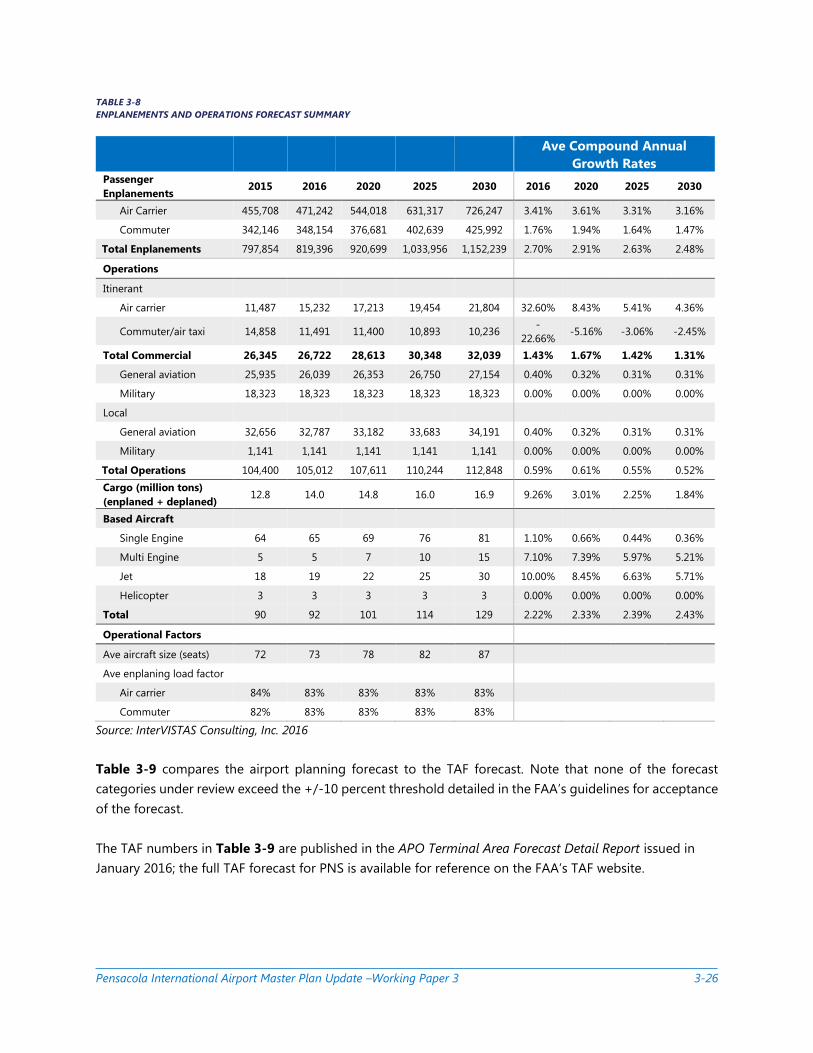
amended forecast into the TAF and NPIAS. Table 3-8 summarizes the forecasts and growth rates put forth
in the Base Case forecast.
Pensacola International Airport Master Plan Update –Working Paper 3 3-26
TABLE 3-8
ENPLANEMENTS AND OPERATIONS FORECAST SUMMARY
Ave Compound Annual
Growth Rates Passenger
Enplanements 2015 2016 2020 2025 2030 2016 2020 2025 2030
Air Carrier 455,708 471,242 544,018 631,317 726,247 3.41% 3.61% 3.31% 3.16%
Commuter 342,146 348,154 376,681 402,639 425,992 1.76% 1.94% 1.64% 1.47%
Total Enplanements 797,854 819,396 920,699 1,033,956 1,152,239 2.70% 2.91% 2.63% 2.48%
Operations
Itinerant
Air carrier 11,487 15,232 17,213 19,454 21,804 32.60% 8.43% 5.41% 4.36%
Commuter/air taxi 14,858 11,491 11,400 10,893 10,236 -
22.66% -5.16% -3.06% -2.45%
Total Commercial 26,345 26,722 28,613 30,348 32,039 1.43% 1.67% 1.42% 1.31%
General aviation 25,935 26,039 26,353 26,750 27,154 0.40% 0.32% 0.31% 0.31%
Military 18,323 18,323 18,323 18,323 18,323 0.00% 0.00% 0.00% 0.00%
Local
General aviation 32,656 32,787 33,182 33,683 34,191 0.40% 0.32% 0.31% 0.31%
Military 1,141 1,141 1,141 1,141 1,141 0.00% 0.00% 0.00% 0.00%
Total Operations 104,400 105,012 107,611 110,244 112,848 0.59% 0.61% 0.55% 0.52%
Cargo (million tons)
(enplaned + deplaned) 12.8 14.0 14.8 16.0 16.9 9.26% 3.01% 2.25% 1.84%
Based Aircraft
Single Engine 64 65 69 76 81 1.10% 0.66% 0.44% 0.36%
Multi Engine 5 5 7 10 15 7.10% 7.39% 5.97% 5.21%
Jet 18 19 22 25 30 10.00% 8.45% 6.63% 5.71%
Helicopter 3 3 3 3 3 0.00% 0.00% 0.00% 0.00%
Total 90 92 101 114 129 2.22% 2.33% 2.39% 2.43%
Operational Factors
Ave aircraft size (seats) 72 73 78 82 87
Ave enplaning load factor
Air carrier 84% 83% 83% 83% 83%
Commuter 82% 83% 83% 83% 83%
Source: InterVISTAS Consulting, Inc. 2016
Table 3-9 compares the airport planning forecast to the TAF forecast. Note that none of the forecast
categories under review exceed the +/-10 percent threshold detailed in the FAA’s guidelines for acceptance
of the forecast.
The TAF numbers in Table 3-9 are published in the APO Terminal Area Forecast Detail Report issued in
January 2016; the full TAF forecast for PNS is available for reference on the FAA’s TAF website.

Pensacola International Airport Master Plan Update –Working Paper 3 3-27
TABLE 3-9
COMPARISON OF BASE CASE FORECAST TO FAA TAF
Year Forecast TAF % Difference)
Passenger Enplanements
2015 797,854 772,649 3.26%
2020 920,699 896,255 2.73%
2025 1,033,956 983,507 5.13%
2030 1,152,239 1,057,190 8.99%
Commercial Operations
2015 26,345 26,345 0.00%
2020 28,613 29,310 -2.38%
2025 30,348 32,229 -5.84%
2030 32,039 34,589 -7.37%
Total Operations
2015 104,400 104,400 0.00%
2020 107,611 107,919 -0.28%
2025 110,244 111,430 -1.06%
2030 112,848 114,389 -1.35%
Source: InterVISTAS Consulting, Inc. 2016
3.10.1 Air Passengers
As mentioned in a previous section, the Base Case Enplaned Passenger Forecast is the most likely
projection of forecasted enplanements at PNS. Therefore, the Base Case is the most appropriate case to
present for comparison to FAA Terminal Area Forecast.
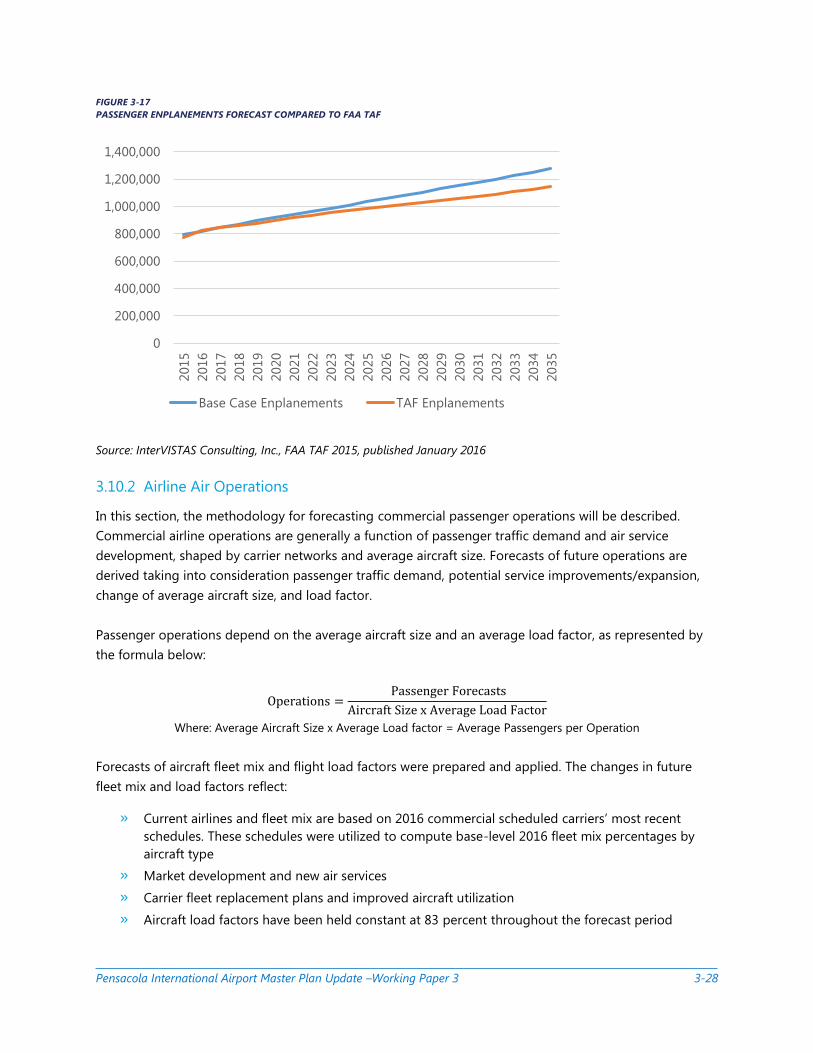
Figure 3-17 shows that in the near-term, the two forecasts diverge at a rate of less than 3 percent. In the
later term, the base case begins to diverge at a greater rate. However, it should be noted that the
forecasts do not at any point diverge more than 10 percent, which is the threshold maintained by the FAA
for acceptance of airport forecasts that are presented for review.
Pensacola International Airport Master Plan Update –Working Paper 3 3-28
FIGURE 3-17
PASSENGER ENPLANEMENTS FORECAST COMPARED TO FAA TAF
Source: InterVISTAS Consulting, Inc., FAA TAF 2015, published January 2016
3.10.2 Airline Air Operations
In this section, the methodology for forecasting commercial passenger operations will be described.
Commercial airline operations are generally a function of passenger traffic demand and air service
development, shaped by carrier networks and average aircraft size. Forecasts of future operations are
derived taking into consideration passenger traffic demand, potential service improvements/expansion,
change of average aircraft size, and load factor.
Passenger operations depend on the average aircraft size and an average load factor, as represented by
the formula below:
Operations = Passenger Forecasts
Aircraft Size x Average Load Factor
Where: Average Aircraft Size x Average Load factor = Average Passengers per Operation
Forecasts of aircraft fleet mix and flight load factors were prepared and applied. The changes in future
fleet mix and load factors reflect:
» Current airlines and fleet mix are based on 2016 commercial scheduled carriers’ most recent
schedules. These schedules were utilized to compute base-level 2016 fleet mix percentages by
aircraft type
» Market development and new air services
» Carrier fleet replacement plans and improved aircraft utilization
» Aircraft load factors have been held constant at 83 percent throughout the forecast period
0
200,000
400,000
600,000
800,000
1,000,000
1,200,000
1,400,000
2015
2016
2017
2018
2019
2020
2021
2022
2023
2024
2025
2026
2027
2028
2029
2030
2031
2032
2033
2034
2035
Base Case Enplanements TAF Enplanements
Pensacola International Airport Master Plan Update –Working Paper 3 3-29
Separate forecasts were developed for domestic commercial scheduled traffic, including breakdowns by
aircraft size. Forecasts of air cargo, military and general aviation operations were also produced in order to
forecast total operations at the airport.
The commercial fleet mix during the forecast period is expected to reflect the general trends of the
broader industry. The fleet renewal strategies of U.S airlines are driven by the requirement to optimize
operational efficiency and capacity in order to maximize shareholder returns. The focus of the fleet
renewal plans in the U.S. is to deploy more efficient next generation narrow body and larger regional
aircraft.
The primary commercial scheduled service pattern throughout the forecast period is expected to be
operations to airline hubs and major connecting points. Therefore, the expected fleet mix at PNS will
continue to evolve in line with the airline industry fleet renewal trends for aircraft serving the domestic
market.
The fleet mix forecast envisions the continued introduction of new and more efficient narrow body aircraft
and the replacement of small (50 seats or less) regional jets with larger regional jets (70-seat class). The
FAA Aerospace Forecast Fiscal Year 2016 – 2036 anticipates that by 2025 only a small number of 50-seat
jet and turboprop aircraft will remain in the U.S. airline fleet. This projection of the future composition of
the U.S. airline fleets is supported by the rapid retirement of small regional jets and turboprop aircraft,
and the lack of future orders from major U.S. air carriers for aircraft with a design capacity of fewer than
70 seats.
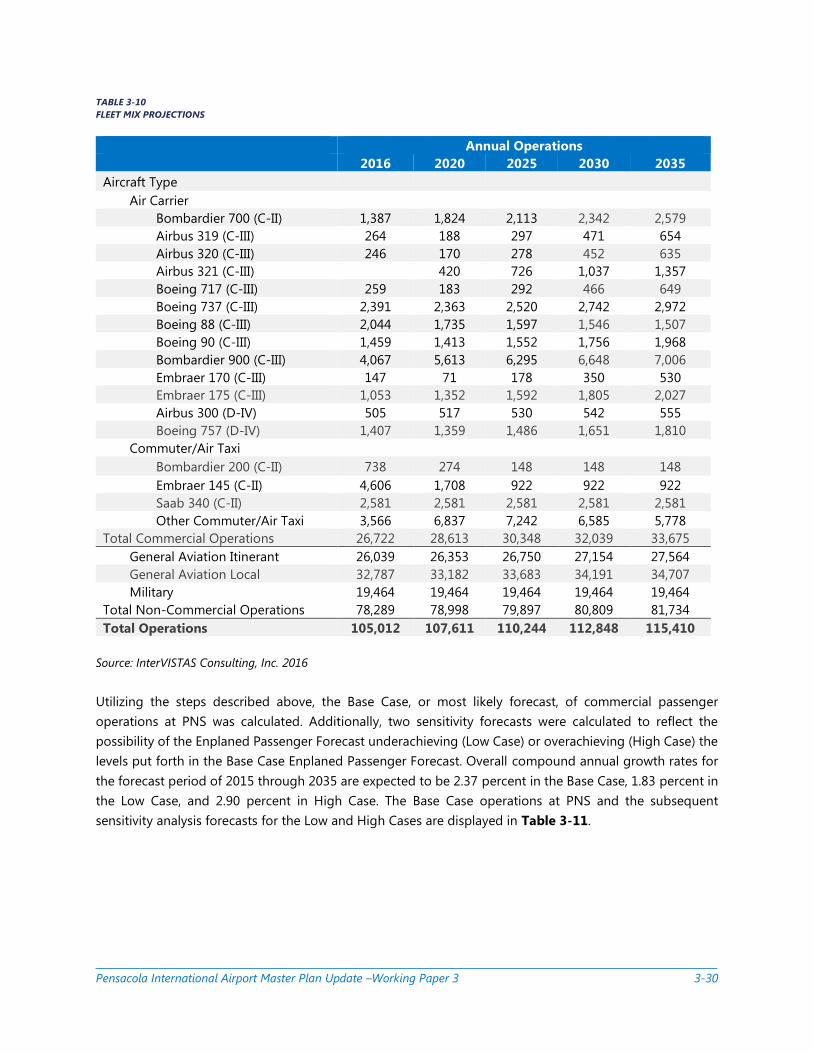
The projection of the fleet mix is influenced by a number of factors, including discussions with
representatives of the airlines and the publicly announced fleet renewal plans of the four largest U.S. air
carriers: Delta Air Lines, Southwest Airlines, American Airlines, and United Airlines. The results of the Fleet
Mix projections are displayed in Table 3-10.
Pensacola International Airport Master Plan Update –Working Paper 3 3-30
TABLE 3-10
FLEET MIX PROJECTIONS
Annual Operations
2016 2020 2025 2030 2035
Aircraft Type
Air Carrier
Bombardier 700 (C-II) 1,387 1,824 2,113 2,342 2,579
Airbus 319 (C-III) 264 188 297 471 654
Airbus 320 (C-III) 246 170 278 452 635
Airbus 321 (C-III) 420 726 1,037 1,357
Boeing 717 (C-III) 259 183 292 466 649
Boeing 737 (C-III) 2,391 2,363 2,520 2,742 2,972
Boeing 88 (C-III) 2,044 1,735 1,597 1,546 1,507
Boeing 90 (C-III) 1,459 1,413 1,552 1,756 1,968
Bombardier 900 (C-III) 4,067 5,613 6,295 6,648 7,006
Embraer 170 (C-III) 147 71 178 350 530
Embraer 175 (C-III) 1,053 1,352 1,592 1,805 2,027
Airbus 300 (D-IV) 505 517 530 542 555
Boeing 757 (D-IV) 1,407 1,359 1,486 1,651 1,810
Commuter/Air Taxi Bombardier 200 (C-II) 738 274 148 148 148
Embraer 145 (C-II) 4,606 1,708 922 922 922
Saab 340 (C-II) 2,581 2,581 2,581 2,581 2,581
Other Commuter/Air Taxi 3,566 6,837 7,242 6,585 5,778
Total Commercial Operations 26,722 28,613 30,348 32,039 33,675
General Aviation Itinerant 26,039 26,353 26,750 27,154 27,564
General Aviation Local 32,787 33,182 33,683 34,191 34,707
Military 19,464 19,464 19,464 19,464 19,464
Total Non-Commercial Operations 78,289 78,998 79,897 80,809 81,734
Total Operations 105,012 107,611 110,244 112,848 115,410
Source: InterVISTAS Consulting, Inc. 2016
Utilizing the steps described above, the Base Case, or most likely forecast, of commercial passenger
operations at PNS was calculated. Additionally, two sensitivity forecasts were calculated to reflect the
possibility of the Enplaned Passenger Forecast underachieving (Low Case) or overachieving (High Case) the
levels put forth in the Base Case Enplaned Passenger Forecast. Overall compound annual growth rates for
the forecast period of 2015 through 2035 are expected to be 2.37 percent in the Base Case, 1.83 percent in
the Low Case, and 2.90 percent in High Case. The Base Case operations at PNS and the subsequent
sensitivity analysis forecasts for the Low and High Cases are displayed in Table 3-11.
Pensacola International Airport Master Plan Update –Working Paper 3 3-31
TABLE 3-11
AIR CARRIER AIR TRANSPORT MOVEMENTS FORECAST
Year Base case Low Case High Case
2005 38,606 38,606 38,606
2010 30,204 30,204 30,204
2015 26,345 26,345 26,345
2016 26,722 26,722 26,722
2017 27,212 27,045 27,382
2018 27,690 27,359 28,027
2019 28,157 27,666 28,656
2020 28,613 27,966 29,270
2025 30,348 28,845 31,911
2030 32,039 29,632 34,605
2035 33,675 30,318 37,342
Compound Annual Growth Rate (CAGR)
2005-2015 -3.75% -3.75% -3.75%
2015-2016 1.43% 1.43% 1.43%
2015-2020 1.67% 1.20% 2.13%
2015-2025 1.42% 0.91% 1.94%
2015-2030 1.31% 0.79% 1.83%
2015-2035 1.23% 0.70% 1.76%
Source: InterVISTAS Consulting, Inc. 2016
In general, the resulting operations forecasts are lower than the forecast published by the FAA. However,
the divergence is only minor when comparing total forecasted airport operations. In all reviewed
categories, the forecasts maintain a difference of less than 10 percent and are within the threshold of
acceptance for Airport forecasts presented to the FAA for review.
3.10.3 Air Cargo Operations
The drivers of air cargo demand in the United States and at PNS drove the forecast of all-cargo aircraft
operations. The forecast reflects the mature nature of the U.S. cargo market in 2016, and the expected
modest growth of domestic air cargo in the coming decade. The forecast is shown in Table 3-12.
Today, the UPS operations at PNS offer customers a complete range of all-cargo services. It is anticipated
that this will continue to be the case throughout the planning period. In addition, UPS’s freighter
operations are a multi-market service, thereby allowing UPS to decouple the current PNS service to meet
future demand growth, if market conditions warrant. Over the term of the forecast, it is anticipated that
there could be additional capacity by UPS on a seasonal or ad hoc basis, but that the level of flying will
not make a material impact on the forecasted level of all-cargo operations.

Pensacola International Airport Master Plan Update –Working Paper 3 3-32
TABLE 3-12
CARGO AIRCRAFT OPERATIONS
Carrier 2016 2020 2025 2030
UPS 535 535 535 540
Ameriflight 510 510 510 510
Total 1,045 1,045 1,045 1,050
Source: InterVISTAS Consulting, Inc. 2016
3.10.4 General Aviation Operations
Data from the Fixed Base Operators (FBOs) currently operating at the Airport indicates that using the
FAA’s projected industry growth rates for GA operations would be the most appropriate methodology for
forecasting the GA category. This forecast uses the projected GA growth rates published in the FAA
Aerospace Forecast, Fiscal Year 2016-2035, which estimates GA growth nationally to be 0.4 percent for
2015 to 2016 and then approximately 0.3 percent per year through the end of the forecast period in 2035,
as shown in Table 3-13.
TABLE 3-13
GENERAL AVIATION OPERATIONS FORECAST
Year Operations
2005 63,083
2010 71,369
2015 58,591
2016 58,825
2017 59,002
2018 59,179
2019 59,356
2020 59,534
2025 60,433
2030 61,345
2035 62,270
Compound Annual Growth Rate (CAGR)
2005-2015 -0.74%
2015-2016 0.40%
2015-2020 0.32%
2015-2025 0.31%
2015-2030 0.31%
2015-2035 0.30%
Source: InterVISTAS Consulting, Inc. 2016
Pensacola International Airport Master Plan Update –Working Paper 3 3-33
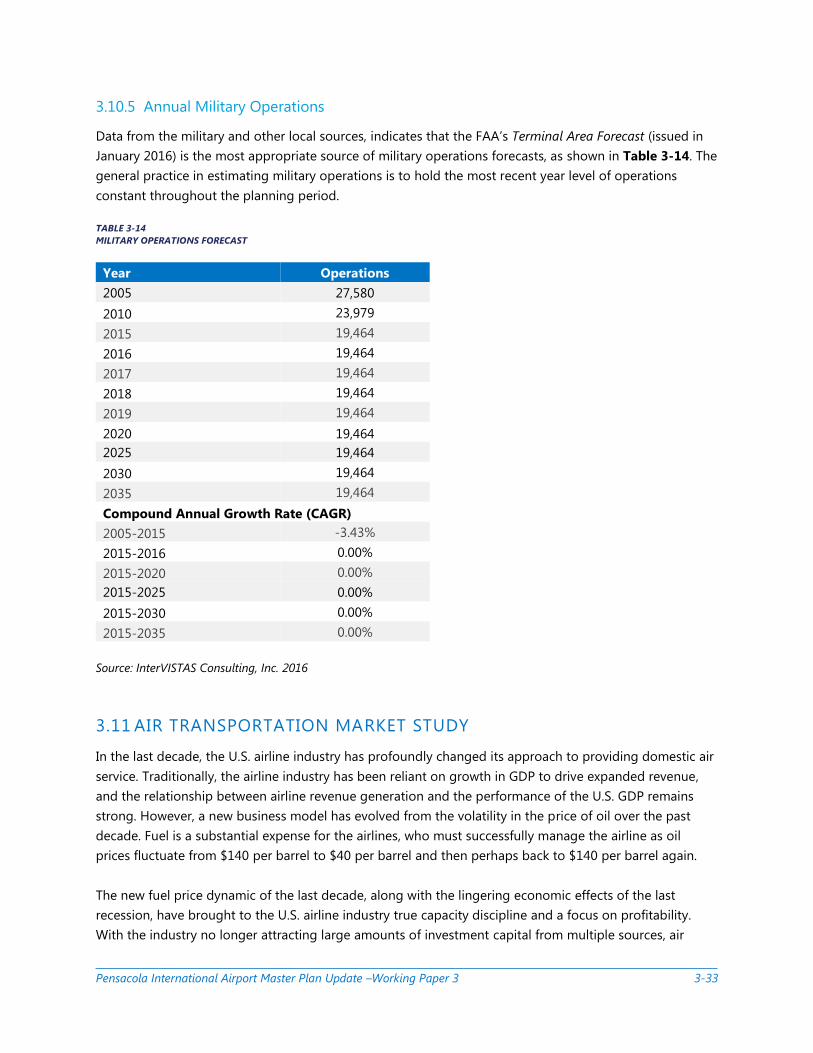
3.10.5 Annual Military Operations
Data from the military and other local sources, indicates that the FAA’s Terminal Area Forecast (issued in
January 2016) is the most appropriate source of military operations forecasts, as shown in Table 3-14. The
general practice in estimating military operations is to hold the most recent year level of operations
constant throughout the planning period.
TABLE 3-14
MILITARY OPERATIONS FORECAST
Year Operations
2005 27,580
2010 23,979
2015 19,464
2016 19,464
2017 19,464
2018 19,464
2019 19,464
2020 19,464
2025 19,464
2030 19,464
2035 19,464
Compound Annual Growth Rate (CAGR)
2005-2015 -3.43%
2015-2016 0.00%
2015-2020 0.00%
2015-2025 0.00%
2015-2030 0.00%
2015-2035 0.00%
Source: InterVISTAS Consulting, Inc. 2016
3.11 AIR TRANSPORTATION MARKET STUDY
In the last decade, the U.S. airline industry has profoundly changed its approach to providing domestic air
service. Traditionally, the airline industry has been reliant on growth in GDP to drive expanded revenue,
and the relationship between airline revenue generation and the performance of the U.S. GDP remains
strong. However, a new business model has evolved from the volatility in the price of oil over the past
decade. Fuel is a substantial expense for the airlines, who must successfully manage the airline as oil
prices fluctuate from $140 per barrel to $40 per barrel and then perhaps back to $140 per barrel again.
The new fuel price dynamic of the last decade, along with the lingering economic effects of the last
recession, have brought to the U.S. airline industry true capacity discipline and a focus on profitability.
With the industry no longer attracting large amounts of investment capital from multiple sources, air
Pensacola International Airport Master Plan Update –Working Paper 3 3-34
carrier face a new drive for sustainable profitability, no matter the price of oil. This drive for predictable
profitability has resulted in changes in the airline business model that directly affect service at all U.S.
airports. These fundamental changes in the airline business model can be simply defined as no longer
chasing market share, but seeking to drive profitability through capacity discipline and product
differentiation than generates ancillary fee revenue.
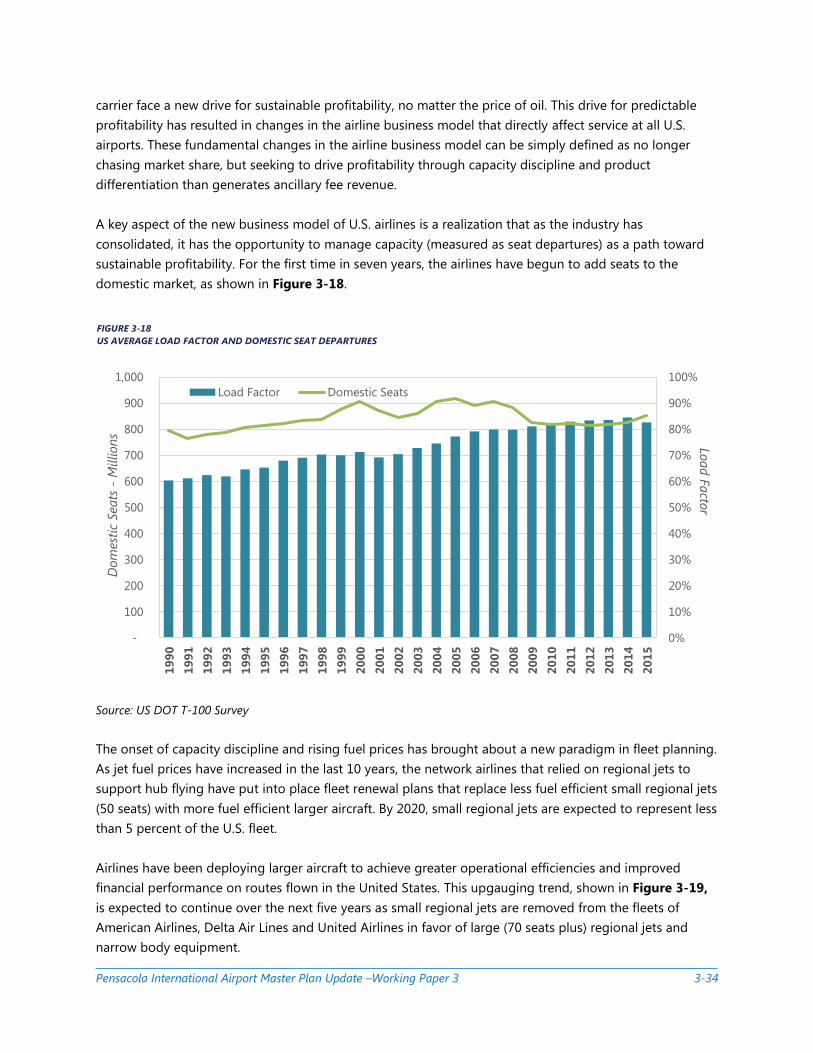
A key aspect of the new business model of U.S. airlines is a realization that as the industry has
consolidated, it has the opportunity to manage capacity (measured as seat departures) as a path toward
sustainable profitability. For the first time in seven years, the airlines have begun to add seats to the
domestic market, as shown in Figure 3-18.
Source: US DOT T-100 Survey
The onset of capacity discipline and rising fuel prices has brought about a new paradigm in fleet planning.
As jet fuel prices have increased in the last 10 years, the network airlines that relied on regional jets to
support hub flying have put into place fleet renewal plans that replace less fuel efficient small regional jets
(50 seats) with more fuel efficient larger aircraft. By 2020, small regional jets are expected to represent less
than 5 percent of the U.S. fleet.
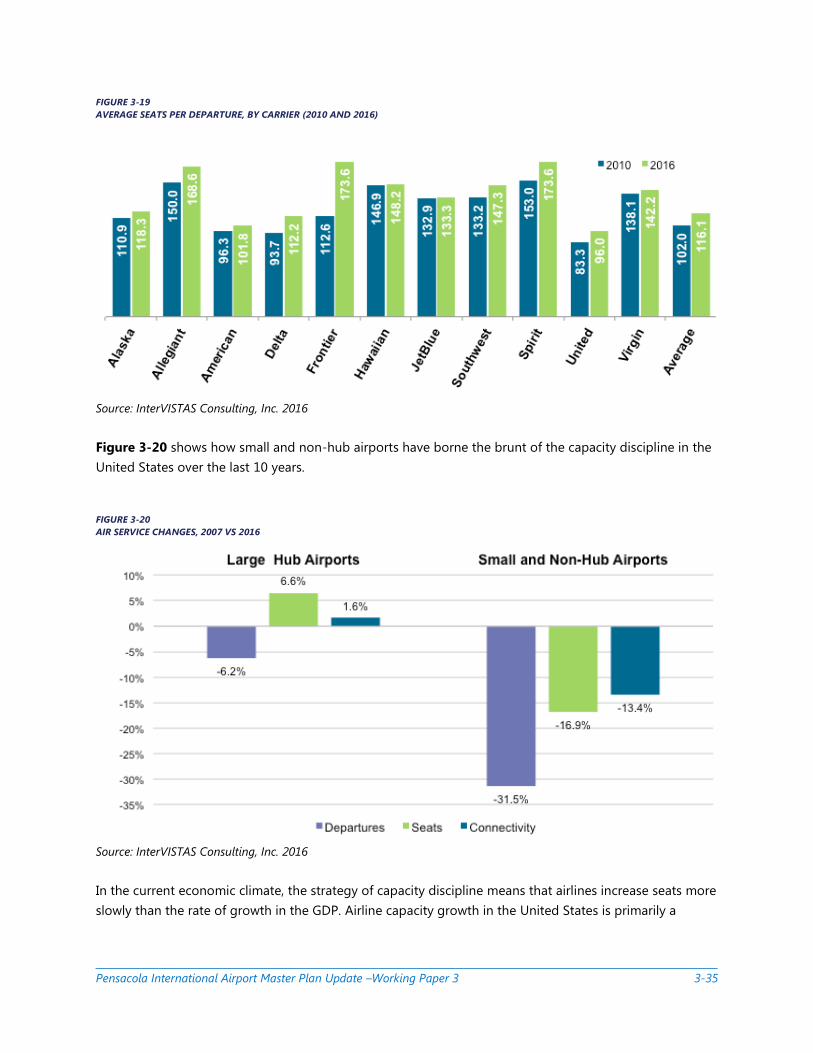
Airlines have been deploying larger aircraft to achieve greater operational efficiencies and improved
financial performance on routes flown in the United States. This upgauging trend, shown in Figure 3-19,
is expected to continue over the next five years as small regional jets are removed from the fleets of
American Airlines, Delta Air Lines and United Airlines in favor of large (70 seats plus) regional jets and
narrow body equipment.
0%
10%
20%
30%
40%
50%
60%
70%
80%
90%
100%
-
100
200
300
400
500
600
700
800
900
1,000
19
90
19
91
19
92
19
93
19
94
19
95
19
96
19
97
19
98
19
99
20
00
20
01
20
02
20
03
20
04
20
05
20
06
20
07
20
08
20
09
20
10
20
11
20
12
20
13
20
14
20
15
Load F
acto
rD
om
est
ic S
eats
-M
illion
s
Load Factor Domestic Seats
FIGURE 3-18
US AVERAGE LOAD FACTOR AND DOMESTIC SEAT DEPARTURES
Pensacola International Airport Master Plan Update –Working Paper 3 3-35
FIGURE 3-19
AVERAGE SEATS PER DEPARTURE, BY CARRIER (2010 AND 2016)
Source: InterVISTAS Consulting, Inc. 2016
Figure 3-20 shows how small and non-hub airports have borne the brunt of the capacity discipline in the
United States over the last 10 years.
FIGURE 3-20
AIR SERVICE CHANGES, 2007 VS 2016
Source: InterVISTAS Consulting, Inc. 2016
In the current economic climate, the strategy of capacity discipline means that airlines increase seats more
slowly than the rate of growth in the GDP. Airline capacity growth in the United States is primarily a
Pensacola International Airport Master Plan Update –Working Paper 3 3-36
function of the introduction of larger aircraft as the industry continues to marginalize flying by the
regional carriers, particularly in small hub and non-hub markets.
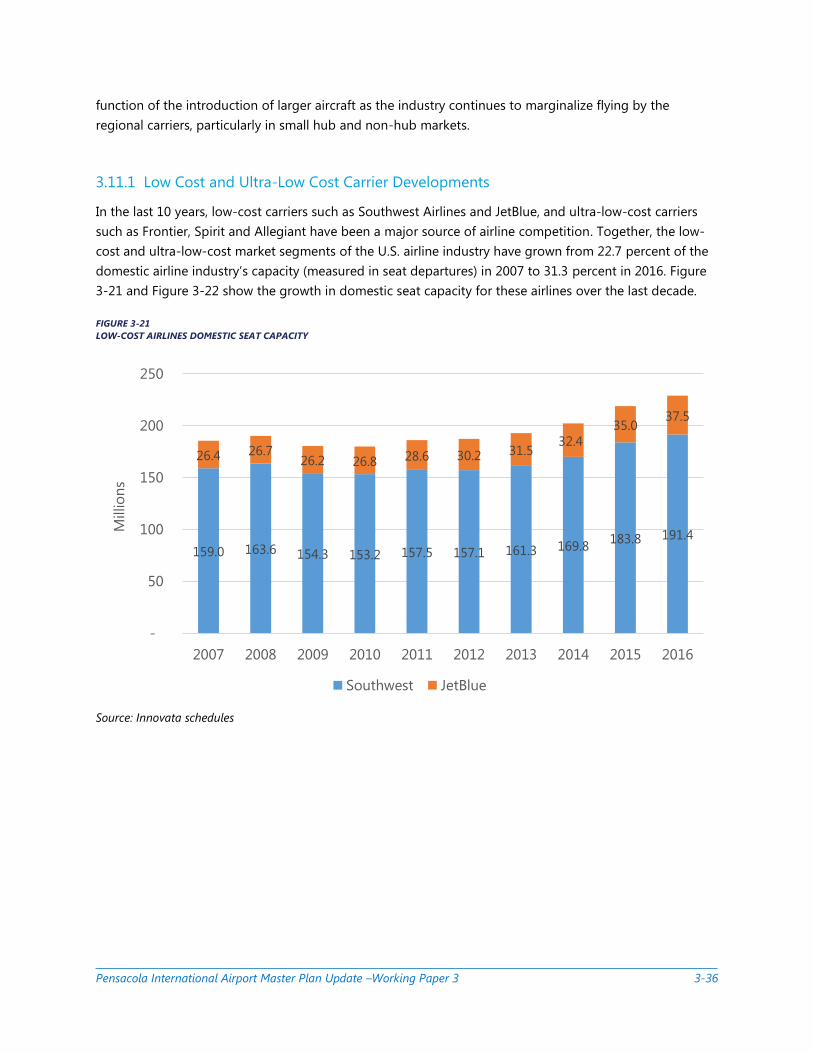
3.11.1 Low Cost and Ultra-Low Cost Carrier Developments
In the last 10 years, low-cost carriers such as Southwest Airlines and JetBlue, and ultra-low-cost carriers
such as Frontier, Spirit and Allegiant have been a major source of airline competition. Together, the low-
cost and ultra-low-cost market segments of the U.S. airline industry have grown from 22.7 percent of the
domestic airline industry’s capacity (measured in seat departures) in 2007 to 31.3 percent in 2016. Figure
3-21 and Figure 3-22 show the growth in domestic seat capacity for these airlines over the last decade.
FIGURE 3-21
LOW-COST AIRLINES DOMESTIC SEAT CAPACITY
Source: Innovata schedules
159.0 163.6 154.3 153.2 157.5 157.1 161.3 169.8183.8 191.4
26.4 26.726.2 26.8 28.6 30.2 31.5
32.4
35.037.5
-
50
100
150
200
250
2007 2008 2009 2010 2011 2012 2013 2014 2015 2016
Millio
ns
Southwest JetBlue
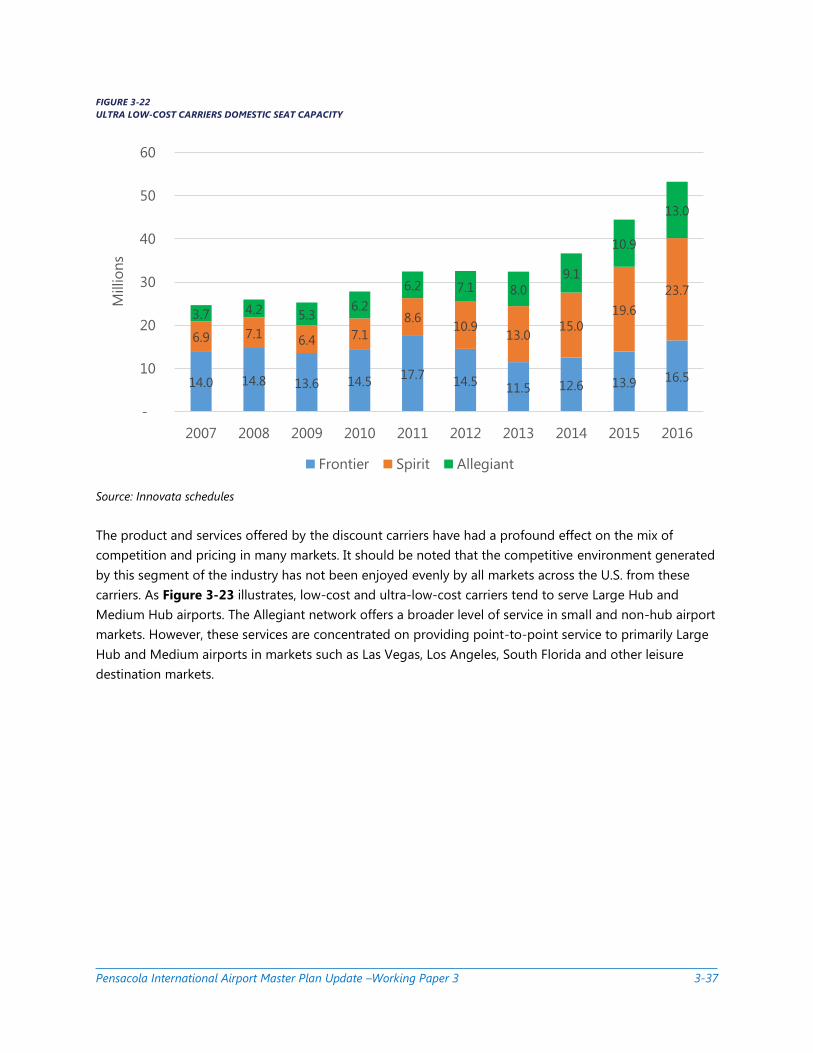
Pensacola International Airport Master Plan Update –Working Paper 3 3-37
FIGURE 3-22
ULTRA LOW-COST CARRIERS DOMESTIC SEAT CAPACITY
Source: Innovata schedules
The product and services offered by the discount carriers have had a profound effect on the mix of
competition and pricing in many markets. It should be noted that the competitive environment generated
by this segment of the industry has not been enjoyed evenly by all markets across the U.S. from these
carriers. As Figure 3-23 illustrates, low-cost and ultra-low-cost carriers tend to serve Large Hub and
Medium Hub airports. The Allegiant network offers a broader level of service in small and non-hub airport
markets. However, these services are concentrated on providing point-to-point service to primarily Large
Hub and Medium airports in markets such as Las Vegas, Los Angeles, South Florida and other leisure
destination markets.
14.0 14.8 13.6 14.517.7
14.511.5 12.6 13.9 16.5
6.9 7.16.4 7.1
8.610.9
13.015.0
19.6
23.7
3.7 4.2 5.36.2
6.2 7.1 8.0
9.1
10.9
13.0
-
10
20
30
40
50
60
2007 2008 2009 2010 2011 2012 2013 2014 2015 2016
Millio
ns
Frontier Spirit Allegiant
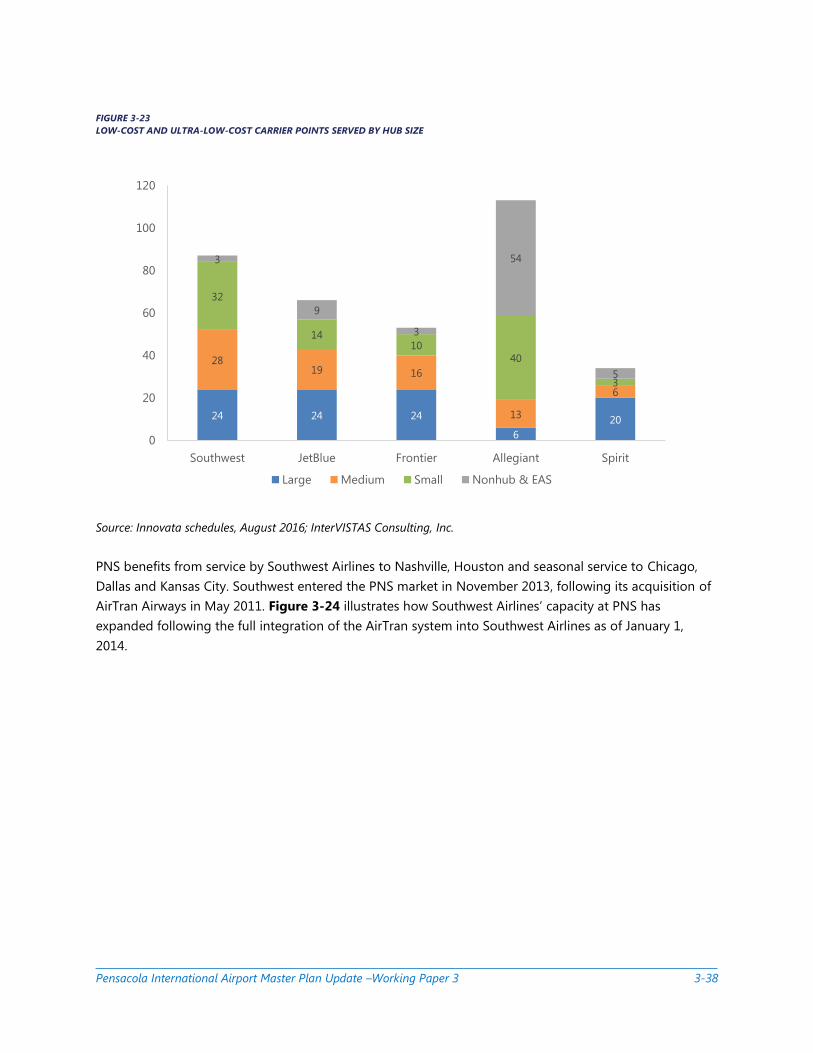
Pensacola International Airport Master Plan Update –Working Paper 3 3-38
Source: Innovata schedules, August 2016; InterVISTAS Consulting, Inc.
PNS benefits from service by Southwest Airlines to Nashville, Houston and seasonal service to Chicago,
Dallas and Kansas City. Southwest entered the PNS market in November 2013, following its acquisition of
AirTran Airways in May 2011. Figure 3-24 illustrates how Southwest Airlines’ capacity at PNS has
expanded following the full integration of the AirTran system into Southwest Airlines as of January 1,
2014.
24 24 24
6
20
2819 16
13
6
32
1410
40
3
3
9
3
54
5
0
20
40
60
80
100
120
Southwest JetBlue Frontier Allegiant Spirit
Large Medium Small Nonhub & EAS
FIGURE 3-23
LOW-COST AND ULTRA-LOW-COST CARRIER POINTS SERVED BY HUB SIZE
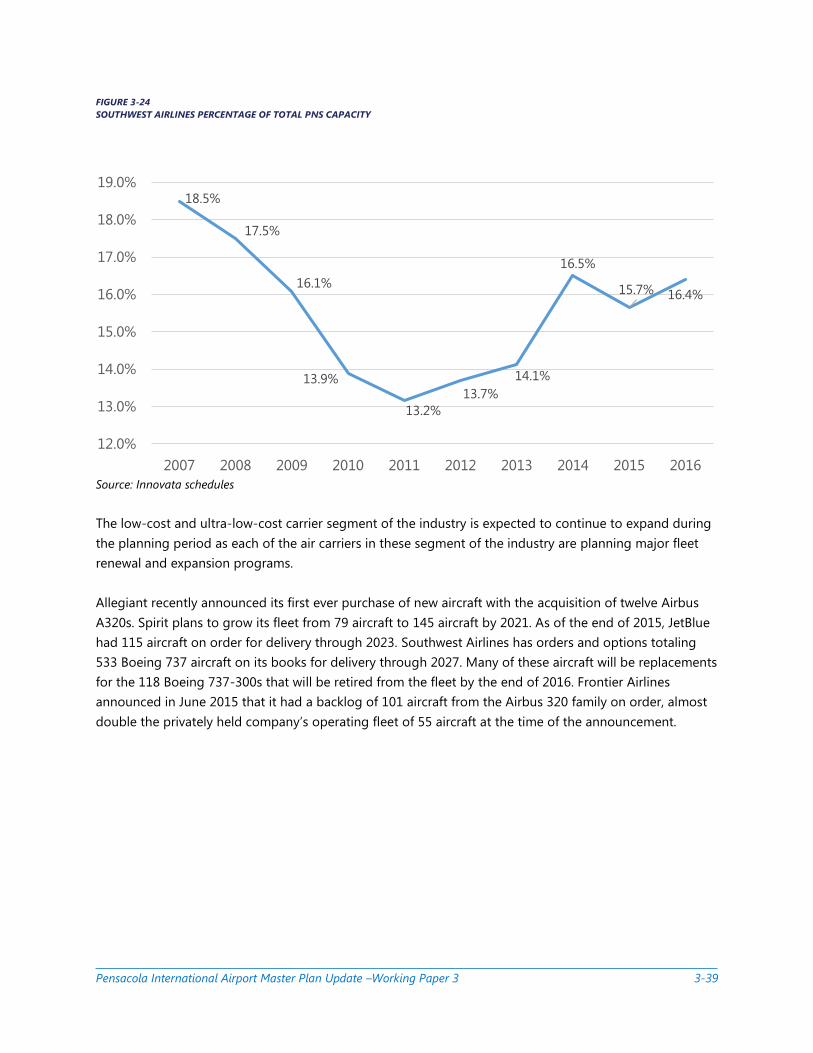
Pensacola International Airport Master Plan Update –Working Paper 3 3-39
FIGURE 3-24
SOUTHWEST AIRLINES PERCENTAGE OF TOTAL PNS CAPACITY
Source: Innovata schedules
The low-cost and ultra-low-cost carrier segment of the industry is expected to continue to expand during
the planning period as each of the air carriers in these segment of the industry are planning major fleet
renewal and expansion programs.
Allegiant recently announced its first ever purchase of new aircraft with the acquisition of twelve Airbus
A320s. Spirit plans to grow its fleet from 79 aircraft to 145 aircraft by 2021. As of the end of 2015, JetBlue
had 115 aircraft on order for delivery through 2023. Southwest Airlines has orders and options totaling
533 Boeing 737 aircraft on its books for delivery through 2027. Many of these aircraft will be replacements
for the 118 Boeing 737-300s that will be retired from the fleet by the end of 2016. Frontier Airlines
announced in June 2015 that it had a backlog of 101 aircraft from the Airbus 320 family on order, almost
double the privately held company’s operating fleet of 55 aircraft at the time of the announcement.
18.5%
17.5%
16.1%
13.9%
13.2%
13.7%
14.1%
16.5%
15.7% 16.4%
12.0%
13.0%
14.0%
15.0%
16.0%
17.0%
18.0%
19.0%
2007 2008 2009 2010 2011 2012 2013 2014 2015 2016
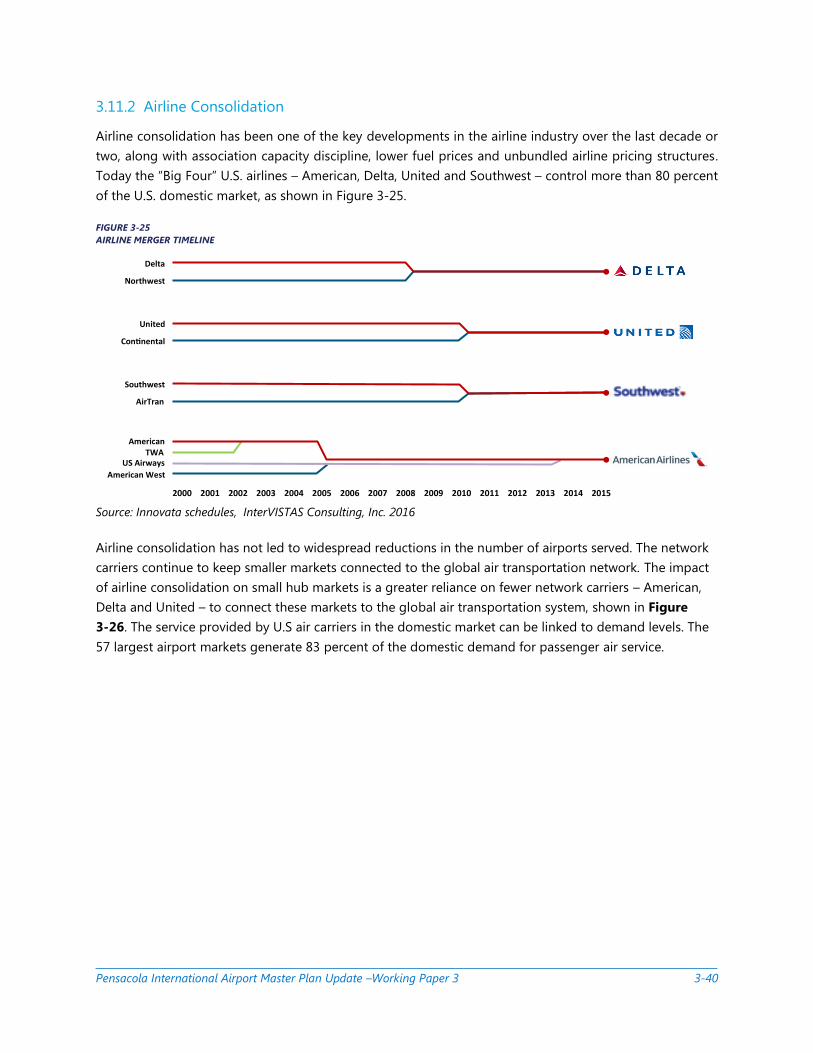
Pensacola International Airport Master Plan Update –Working Paper 3 3-40
3.11.2 Airline Consolidation
Airline consolidation has been one of the key developments in the airline industry over the last decade or
two, along with association capacity discipline, lower fuel prices and unbundled airline pricing structures.
Today the “Big Four” U.S. airlines – American, Delta, United and Southwest – control more than 80 percent
of the U.S. domestic market, as shown in Figure 3-25.
Source: Innovata schedules, InterVISTAS Consulting, Inc. 2016
Airline consolidation has not led to widespread reductions in the number of airports served. The network
carriers continue to keep smaller markets connected to the global air transportation network. The impact
of airline consolidation on small hub markets is a greater reliance on fewer network carriers – American,
Delta and United – to connect these markets to the global air transportation system, shown in Figure
3-26. The service provided by U.S air carriers in the domestic market can be linked to demand levels. The
57 largest airport markets generate 83 percent of the domestic demand for passenger air service.
TodayTheBig4U.S.AirlinesHold80%OfTheDomes cMarket
2000200120022003200420052006200720082009201020112012201320142015
American
AmericanWest
USAirwaysTWA
Southwest
AirTran
United
Con nental
Delta
Northwest
Source:Innovataschedules,InterVISTASanalysis,basedonASMs.
FIGURE 3-25
AIRLINE MERGER TIMELINE
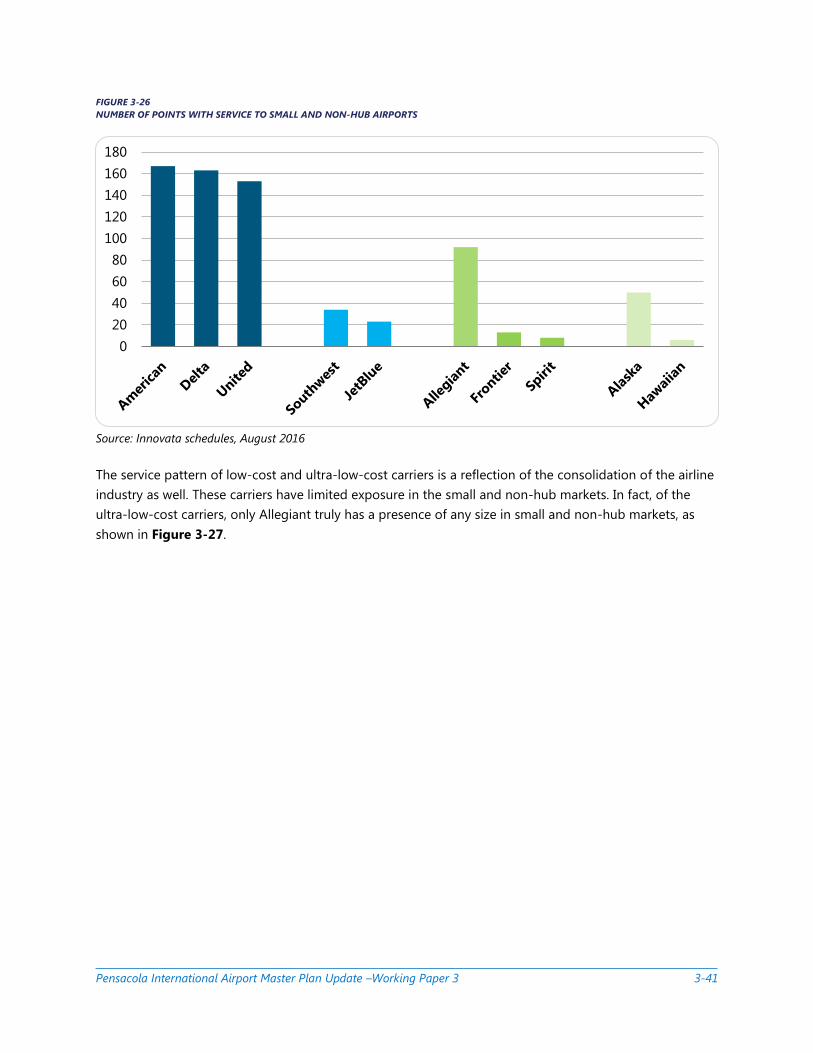
Pensacola International Airport Master Plan Update –Working Paper 3 3-41
FIGURE 3-26
NUMBER OF POINTS WITH SERVICE TO SMALL AND NON-HUB AIRPORTS
Source: Innovata schedules, August 2016
The service pattern of low-cost and ultra-low-cost carriers is a reflection of the consolidation of the airline
industry as well. These carriers have limited exposure in the small and non-hub markets. In fact, of the
ultra-low-cost carriers, only Allegiant truly has a presence of any size in small and non-hub markets, as
shown in Figure 3-27.
0
20
40
60
80
100
120
140
160
180

Pensacola International Airport Master Plan Update –Working Paper 3 3-42
FIGURE 3-27
CITY PAIR COMBINATIONS SERVED BY ALLEGIANT, 2016
Note: Hub definition is based on the major metro airport; Allegiant may serve secondary airport
Source: Innovata schedules, January through September 2016
As opportunities in small and non-hub markets have not kept pace with the market expectations for
Allegiant, its initial strategy to focus on moving travelers from these size markets has begun to shift.
Allegiant is now entering medium hub markets when capacity is reduced or fares rise. Sprit and Frontier
are now focused almost exclusively on expansion in larger hub markets, although Spirit’s management
has indicated it may be willing to consider service to medium and smaller markets in the future.
3.11.3 Economic Growth
The economies of the Pensacola Metropolitan Statistical Area (MSA) and the adjacent Daphne-Fairhope
MSA are the major drivers of air travel demand at PNS. The combination of the Pensacola and Daphne-
Fairhope MSAs creates the largest market northwest Florida and southern Alabama.
The Pensacola Gulf Coast market enjoys the benefits of a highly diversified economy. In 2015, the Gross
Regional Product of Pensacola was estimated at $21.5 billion, with a projected growth to $24.3 billion by
2020. As the accompanying Tables 3-15 through 3-17 illustrate below, the market is forecasted to
experience continued growth gross regional product (GRP), population and income per capita on par with
or exceeding the growth expected for the United States overall. These positive trends in key demographic
and economic indicators are an essential element of the underlying basis for continued growth in air
travel demand at PNS.
Large - Large, 9
Large - Medium, 23
Large - Small & Nonhub, 202
Medium - Medium, 10
Medium - Small & Nonhub, 19
Intra Small & Nonhub, 84
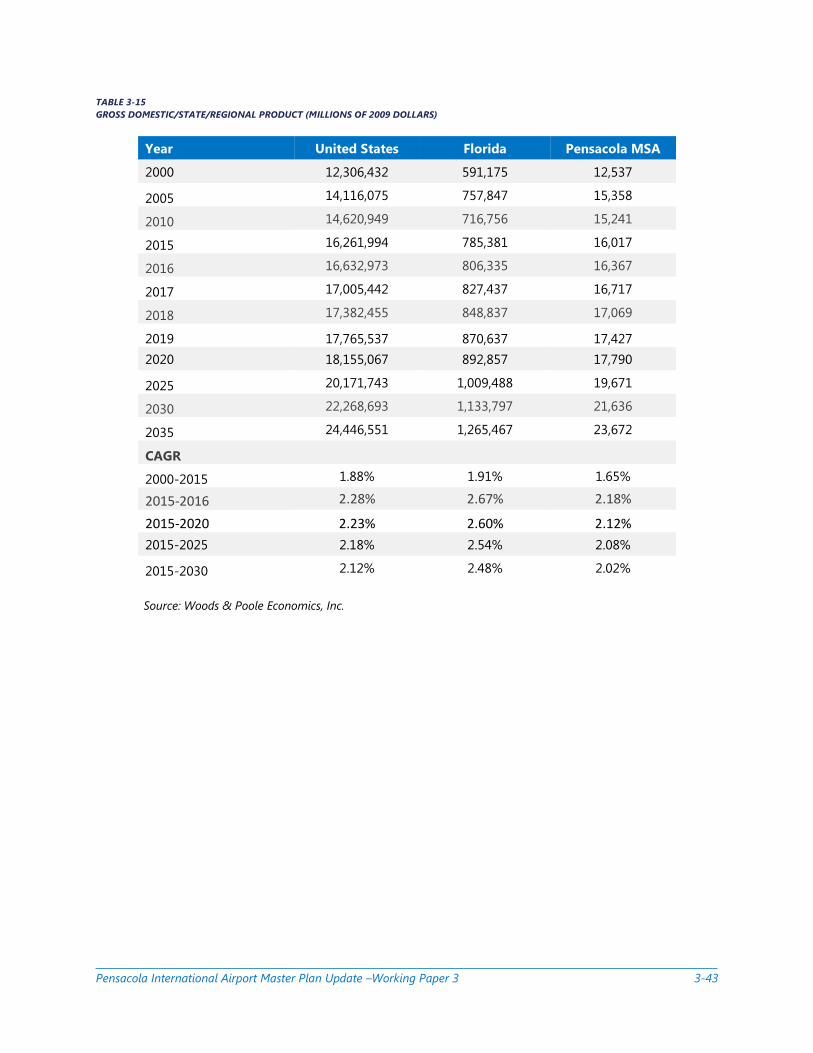
Pensacola International Airport Master Plan Update –Working Paper 3 3-43
TABLE 3-15
GROSS DOMESTIC/STATE/REGIONAL PRODUCT (MILLIONS OF 2009 DOLLARS)
Year United States Florida Pensacola MSA
2000 12,306,432 591,175 12,537
2005 14,116,075 757,847 15,358
2010 14,620,949 716,756 15,241
2015 16,261,994 785,381 16,017
2016 16,632,973 806,335 16,367
2017 17,005,442 827,437 16,717
2018 17,382,455 848,837 17,069
2019 17,765,537 870,637 17,427
2020 18,155,067 892,857 17,790
2025 20,171,743 1,009,488 19,671
2030 22,268,693 1,133,797 21,636
2035 24,446,551 1,265,467 23,672
CAGR
2000-2015 1.88% 1.91% 1.65%
2015-2016 2.28% 2.67% 2.18%
2015-2020 2.23% 2.60% 2.12%
2015-2025 2.18% 2.54% 2.08%
2015-2030 2.12% 2.48% 2.02%
Source: Woods & Poole Economics, Inc.

Pensacola International Airport Master Plan Update –Working Paper 3 3-44
TABLE 3-16
US/STATE/MSA POPULATION (THOUSANDS)
Year United States Florida Pensacola MSA
2000 282,162 16,048 413
2005 295,517 17,842 439
2010 309,326 18,846 451
2015 321,449 20,061 475
2016 324,392 20,335 480
2017 327,372 20,613 485
2018 330,383 20,895 490
2019 333,427 21,180 494
2020 336,500 21,469 499
2025 352,281 22,967 524
2030 368,462 24,534 549
2035 384,208 26,116 574
CAGR
2000-2015 0.87% 1.50% 0.94%
2015-2016 0.92% 1.37% 0.99%
2015-2020 0.92% 1.37% 0.99%
2015-2025 0.92% 1.36% 0.98%
2015-2030 0.91% 1.35% 0.97%
2015-2035 0.90% 1.33% 0.94%
Source: Woods & Poole Economics, Inc.
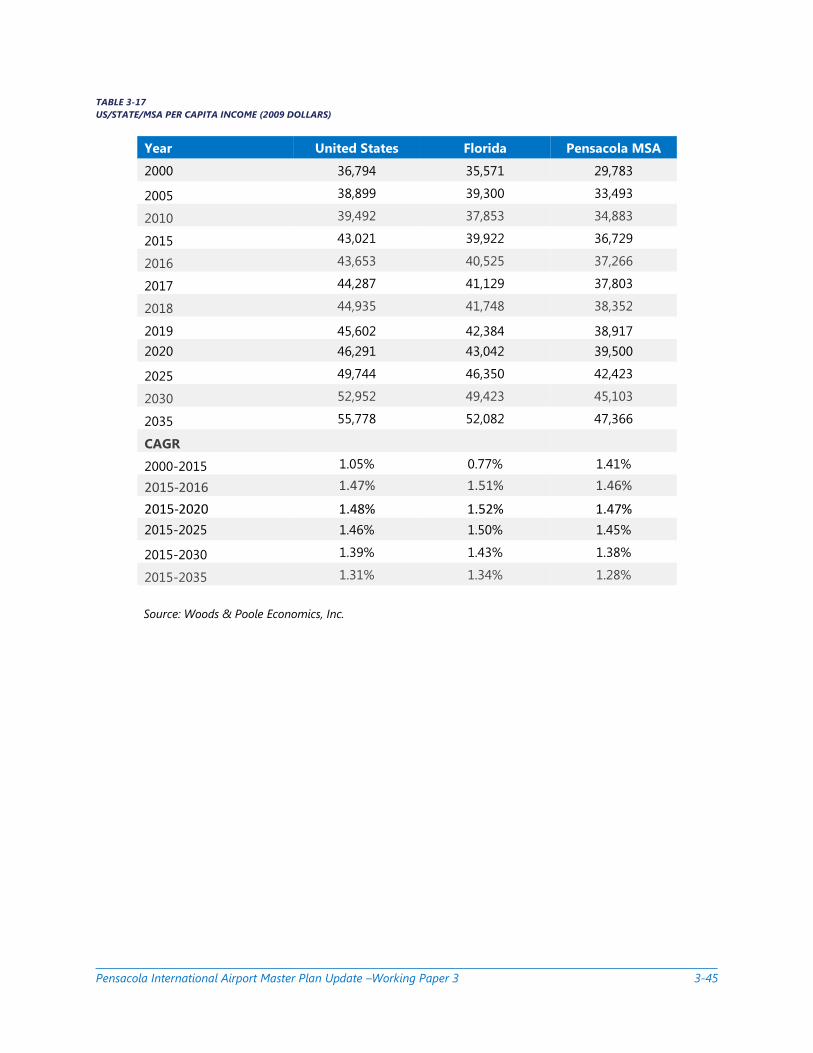
Pensacola International Airport Master Plan Update –Working Paper 3 3-45
TABLE 3-17
US/STATE/MSA PER CAPITA INCOME (2009 DOLLARS)
Year United States Florida Pensacola MSA
2000 36,794 35,571 29,783
2005 38,899 39,300 33,493
2010 39,492 37,853 34,883
2015 43,021 39,922 36,729
2016 43,653 40,525 37,266
2017 44,287 41,129 37,803
2018 44,935 41,748 38,352
2019 45,602 42,384 38,917
2020 46,291 43,042 39,500
2025 49,744 46,350 42,423
2030 52,952 49,423 45,103
2035 55,778 52,082 47,366
CAGR
2000-2015 1.05% 0.77% 1.41%
2015-2016 1.47% 1.51% 1.46%
2015-2020 1.48% 1.52% 1.47%
2015-2025 1.46% 1.50% 1.45%
2015-2030 1.39% 1.43% 1.38%
2015-2035 1.31% 1.34% 1.28%
Source: Woods & Poole Economics, Inc.

Pensacola International Airport Master Plan Update –Working Paper 3 3-46
The Pensacola Gulf Coast Market – Major Economic Sectors
The United States Department of Defense (DOD) is a major driver of the economy. An estimated $8.4 billion
in economic impact is derived from the four major military installations in the region:
» Naval Air Station Pensacola - Flight training and home to multiple DOD Commands
» Corry Station – Center for Information Dominance – DHS Cyber Warfare Unit
» Saufley Field – Naval Education, Development, Technology and Training Center
» Naval Air Station Whiting Field – Training Facility for Military Aviation
The key industry sectors in the market are:
» Healthcare services
» Aviation, aerospace, and defense
» Homeland and cyber security
» Financial and professional services
» Tourism
As a major leisure and tourism market, the Pensacola Gulf Coast is experiencing continued growth in tourism
demand, as shown by the increase in bed tax collections, a key metric of hospitality sector growth. The three
counties of the Airport Service Area are seeing double digit increases in bed tax collections, which is
indicative of a robust tourist market.
In the 21st century economy markets with a strong base to grow intellectual capital to support economic
development will be well positioned for the future. In the Pensacola Gulf Coast market, the University of
West Florida (UWF enrolls over 13,000 students per annum) is the major center for the development of the
workforce to support the diversified industry sectors of the market. In addition, to UWF, Pensacola State
College and a cluster of career and technical schools serve to meet the needs of employers for highly trained
individuals that are the key to expanding their businesses.
The major private sector employers in the Pensacola MSA, as shown in Table 3-18, are a diverse mix of
healthcare, financial services, manufacturing and professional services companies.
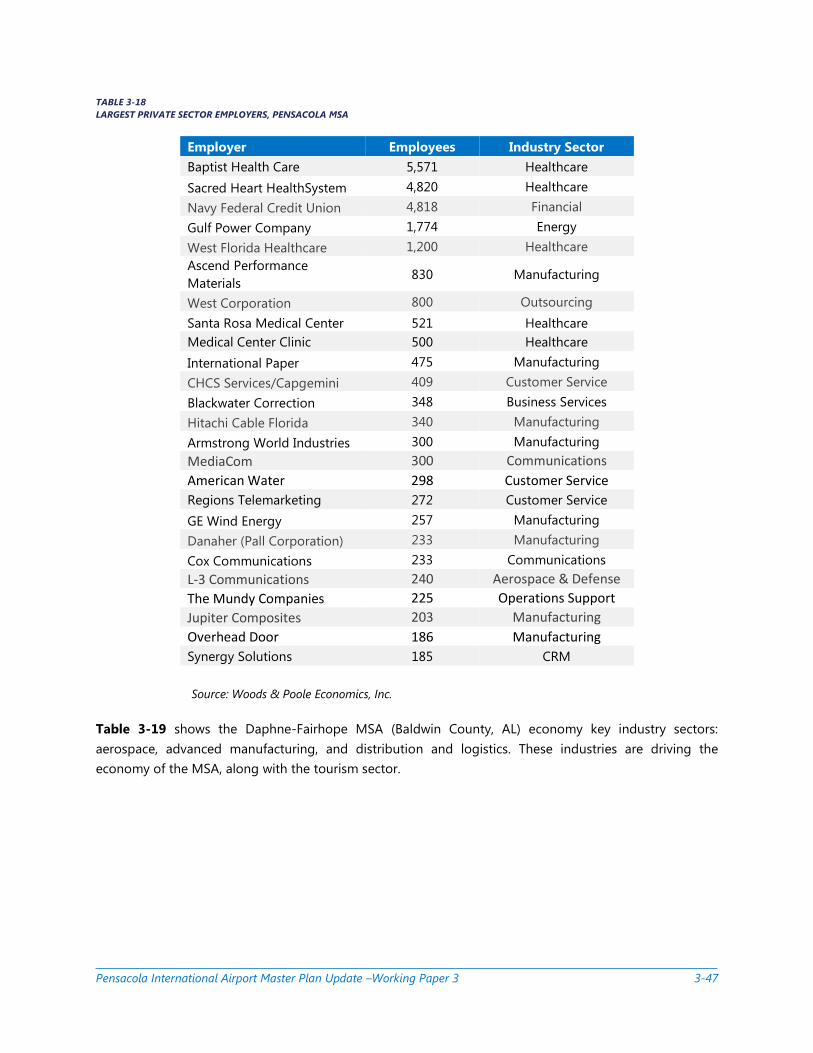
Pensacola International Airport Master Plan Update –Working Paper 3 3-47
TABLE 3-18
LARGEST PRIVATE SECTOR EMPLOYERS, PENSACOLA MSA
Employer Employees Industry Sector
Baptist Health Care 5,571 Healthcare
Sacred Heart HealthSystem 4,820 Healthcare
Navy Federal Credit Union 4,818 Financial
Gulf Power Company 1,774 Energy
West Florida Healthcare 1,200 Healthcare
Ascend Performance
Materials 830 Manufacturing
West Corporation 800 Outsourcing
Santa Rosa Medical Center 521 Healthcare
Medical Center Clinic 500 Healthcare
International Paper 475 Manufacturing
CHCS Services/Capgemini 409 Customer Service
Blackwater Correction 348 Business Services
Hitachi Cable Florida 340 Manufacturing
Armstrong World Industries 300 Manufacturing
MediaCom 300 Communications
American Water 298 Customer Service
Regions Telemarketing 272 Customer Service
GE Wind Energy 257 Manufacturing
Danaher (Pall Corporation) 233 Manufacturing
Cox Communications 233 Communications
L-3 Communications 240 Aerospace & Defense
The Mundy Companies 225 Operations Support
Jupiter Composites 203 Manufacturing
Overhead Door 186 Manufacturing
Synergy Solutions 185 CRM
Source: Woods & Poole Economics, Inc.
Table 3-19 shows the Daphne-Fairhope MSA (Baldwin County, AL) economy key industry sectors:
aerospace, advanced manufacturing, and distribution and logistics. These industries are driving the
economy of the MSA, along with the tourism sector.
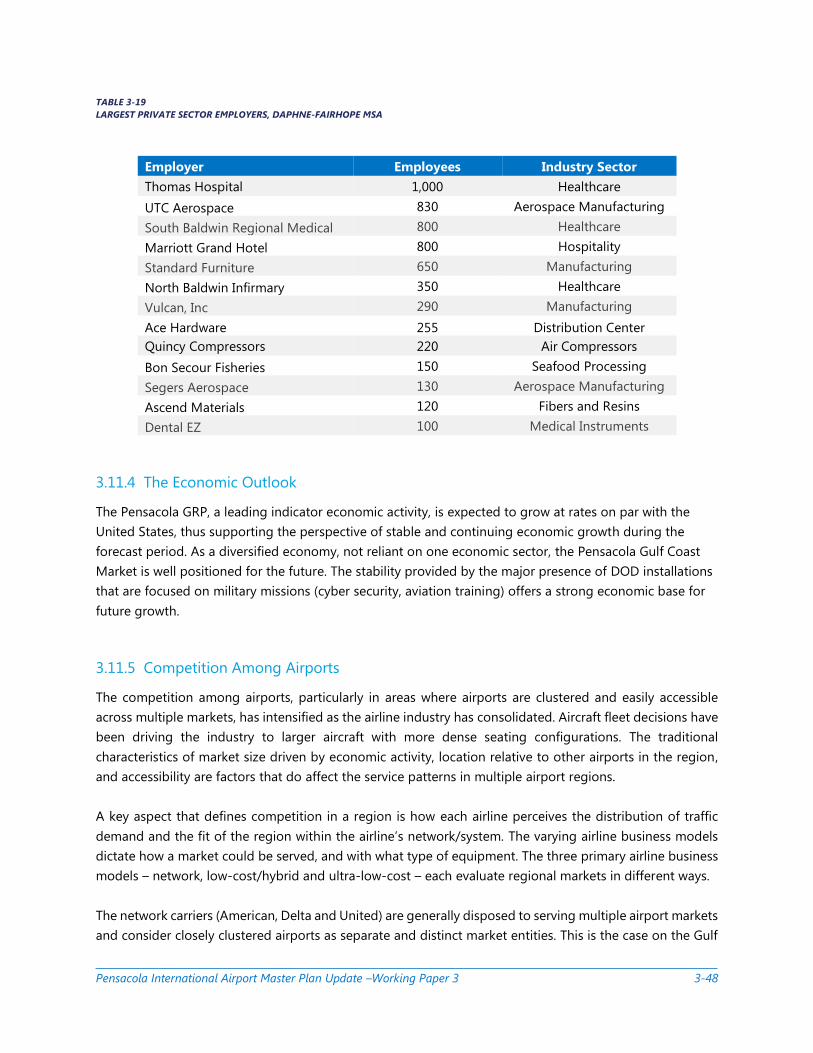
Pensacola International Airport Master Plan Update –Working Paper 3 3-48
TABLE 3-19
LARGEST PRIVATE SECTOR EMPLOYERS, DAPHNE-FAIRHOPE MSA
Employer Employees Industry Sector
Thomas Hospital 1,000 Healthcare
UTC Aerospace 830 Aerospace Manufacturing
South Baldwin Regional Medical 800 Healthcare
Marriott Grand Hotel 800 Hospitality
Standard Furniture 650 Manufacturing
North Baldwin Infirmary 350 Healthcare
Vulcan, Inc 290 Manufacturing
Ace Hardware 255 Distribution Center
Quincy Compressors 220 Air Compressors
Bon Secour Fisheries 150 Seafood Processing
Segers Aerospace 130 Aerospace Manufacturing
Ascend Materials 120 Fibers and Resins
Dental EZ 100 Medical Instruments
3.11.4 The Economic Outlook
The Pensacola GRP, a leading indicator economic activity, is expected to grow at rates on par with the
United States, thus supporting the perspective of stable and continuing economic growth during the
forecast period. As a diversified economy, not reliant on one economic sector, the Pensacola Gulf Coast
Market is well positioned for the future. The stability provided by the major presence of DOD installations
that are focused on military missions (cyber security, aviation training) offers a strong economic base for
future growth.
3.11.5 Competition Among Airports
The competition among airports, particularly in areas where airports are clustered and easily accessible
across multiple markets, has intensified as the airline industry has consolidated. Aircraft fleet decisions have
been driving the industry to larger aircraft with more dense seating configurations. The traditional
characteristics of market size driven by economic activity, location relative to other airports in the region,
and accessibility are factors that do affect the service patterns in multiple airport regions.
A key aspect that defines competition in a region is how each airline perceives the distribution of traffic
demand and the fit of the region within the airline’s network/system. The varying airline business models
dictate how a market could be served, and with what type of equipment. The three primary airline business
models – network, low-cost/hybrid and ultra-low-cost – each evaluate regional markets in different ways.
The network carriers (American, Delta and United) are generally disposed to serving multiple airport markets
and consider closely clustered airports as separate and distinct market entities. This is the case on the Gulf
Pensacola International Airport Master Plan Update –Working Paper 3 3-49
Coast near Pensacola, as the three network carriers all serve three of the four airports in the region. The
exception is the Northwest Florida Beaches International Airport (ECP) that does not have service by
American Airlines.
The Low Cost Carrier (LCC) model is defined by a focus on cost control to enable these carriers to offer
customers lower fares than competitor airlines. The LCCs’ major market segment continues to be the
leisure traveler. LCC fleets are usually limited to one or two high-density single class narrow body aircraft
types. Fleet simplicity is a key component of the approach taken to cost control by LCCs.
The LCC business model in multi-airport markets, such as the Gulf Coast, is predicated on serving the local
market demand first but also attracting customers from adjacent market areas. The expectation is that
lower fares will convince travelers to drive to a nearby airport in the region rather than use a Network
carrier or other competitor’s service at an airport closer to their home or business. The LCC model in
multiple airport markets usually results in service at one to two airports in the region, not at every airport.
This is the case on the Gulf Coast, where Southwest Airlines serves Pensacola International Airport and
Northwest Florida Beaches International Airport.
The Ultra-Low-Cost Carrier (ULCC) business model is distinguished from other airline business models by
pricing that can be characterized as an airfare plus model. Each service (such as checking a bag, seat
assignments, etc.) involves a separate fee. This pricing scheme is designed to offer the lowest possible up-
front airfare compared to other airline business models. As with the LCCs, ULCCs operate high-density
single class aircraft. They focus on high-demand markets and/or markets with the potential for substantial
traffic growth through price stimulation. Spirit, Frontier, and Allegiant are generally considered to be
ULCCs.
It should be noted that the ULCC model continues to evolve. The primary focus of Spirit and Frontier
continues to be on serving high-fare and high-demand markets. High demand markets can generally be
defined as those with local market demand at or above 200 passengers per day each way. A high level of
market demand and above average fares are the primary market metrics to be evaluated when trying to
determine what airports Spirit and Frontier might serve in the next few years. Today neither, Spirit or
Frontier serves the Pensacola Gulf Coast regional market.
Allegiant’s ULCC business model differs somewhat from Spirit and Frontier in that Allegiant’s system is
built on serving destination markets. Allegiant does not offer connecting services on its system. All of its
customers fly point to point. Allegiant’s business model is designed to generate discretionary traffic to
leisure destination markets. Allegiant offers its service to destination markets on a less than daily basis
and in many cases the service patterns are seasonal only. The destination markets served by Allegiant
have until recently all been large in-bound tourist market. Recently Allegiant expanded its destination
focused business model by adding service to small and medium sized destination markets such as Mytle
Beach, SC, Punta Gorda, FL and most recently on the Gulf Coast – Destin-Ft. Walton Beach.
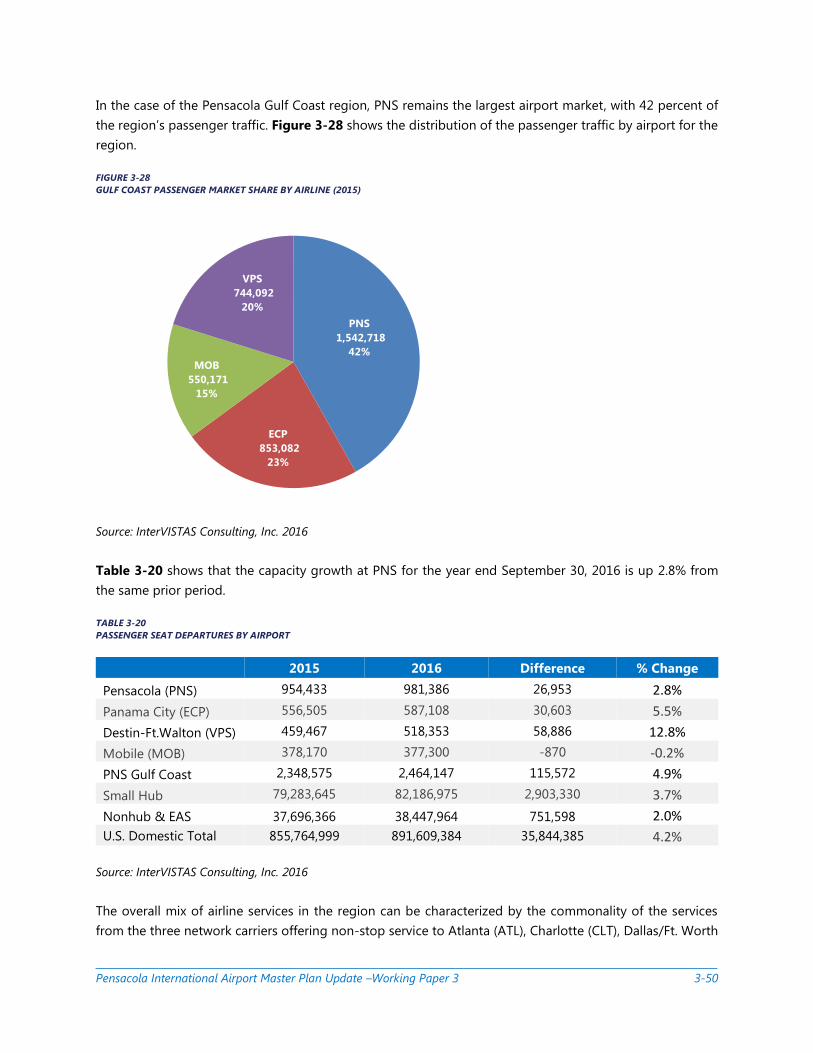
Pensacola International Airport Master Plan Update –Working Paper 3 3-50
In the case of the Pensacola Gulf Coast region, PNS remains the largest airport market, with 42 percent of
the region’s passenger traffic. Figure 3-28 shows the distribution of the passenger traffic by airport for the
region.
FIGURE 3-28
GULF COAST PASSENGER MARKET SHARE BY AIRLINE (2015)
Source: InterVISTAS Consulting, Inc. 2016
Table 3-20 shows that the capacity growth at PNS for the year end September 30, 2016 is up 2.8% from
the same prior period.
TABLE 3-20
PASSENGER SEAT DEPARTURES BY AIRPORT
2015 2016 Difference % Change
Pensacola (PNS) 954,433 981,386 26,953 2.8%
Panama City (ECP) 556,505 587,108 30,603 5.5%
Destin-Ft.Walton (VPS) 459,467 518,353 58,886 12.8%
Mobile (MOB) 378,170 377,300 -870 -0.2%
PNS Gulf Coast 2,348,575 2,464,147 115,572 4.9%
Small Hub 79,283,645 82,186,975 2,903,330 3.7%
Nonhub & EAS 37,696,366 38,447,964 751,598 2.0%
U.S. Domestic Total 855,764,999 891,609,384 35,844,385 4.2%
Source: InterVISTAS Consulting, Inc. 2016
The overall mix of airline services in the region can be characterized by the commonality of the services
from the three network carriers offering non-stop service to Atlanta (ATL), Charlotte (CLT), Dallas/Ft. Worth
PNS
1,542,718
42%
ECP
853,082
23%
MOB
550,171
15%
VPS
744,092
20%

Pensacola International Airport Master Plan Update –Working Paper 3 3-51
(DFW), and Houston Intercontinental (IAH) from all four airports. This hub connectivity, as mentioned earlier,
is the foundation for small and non-hub airports in the era of airline consolidation and capacity discipline.
Among the four airports in the region, PNS and ECP are served by Southwest Airlines with year-round daily
service to Nashville (BNA) and Houston-Hobby (HOU). Southwest offers seasonal weekend and seasonal
daily service at both airports to markets such as Dallas-Love Field (DAL), St. Louis (STL), Baltimore (BWI),
Kansas City (MCI), and Chicago-Midway (MDW). On a regional basis, Silver Airways offers intra-Florida
service from PNS to Tampa (TPA) and Orlando (MCO).
The most recent development in the regional market is the introduction by Allegiant of seasonal service at
VPS to seven markets. Allegiant will offer seasonal two times or three times weekly service to Belleville, IL
(St. Louis) (BLV), Memphis (MEM), Ft. Lauderdale (FLL), Oklahoma City (OKC), Cincinnati (CVG), Knoxville
(TYS), and Las Vegas (LAS).
Pensacola International Airport is the largest market between New Orleans and Tampa on the Gulf Coast,
and offers customers the greatest diversity of service, based on non-stop markets served on a year-round
and seasonal basis. As shown in Table 3-21, PNS outpaces other airports in the region in the key metrics
of: departures, seats, number of airlines serving the market, passenger load factor, traffic and revenue.
TABLE 3-21
REGIONAL PASSENGER TRAFFIC BY AIRPORT (2015)
Weekly Operations Domestic Flights
Airport Departures Outbound
Seats Airlines
Nonstop
Markets
Served
Load
Factors
Revenue
(Millions)
Yield
(CPM)
PNS 232 20,879 5 14 83.3% $293.8 22.1
ECP 113 13,486 4 9 75.1% $152.6 22.1
MOB 134 7,475 3 5 76.1% $120.9 26.7
VPS 162 13,019 4 11 81.3% $151.2 22.8
Notes: Points served include seasonal services. The mileage for stage length adjustment is 1,000 miles. O&D traffic, fare,
revenue, yield, and load factor data are for calendar year 2015. Operational data are based on July 2016 schedules.
Silver Airways discontinued service at ECP in August 2016.
Source: InterVISTAS Consulting, Inc. 2016
3.12 CRITICAL AIRCRAFT SELECTION
The critical aircraft decision at PNS takes into consideration the current and future airline fleet plans of all
U.S. airlines, regardless of whether the air carriers operate at PNS today. During the forecasting process,
current and future aircraft utilization at PNS was discussed with Delta, American, Southwest, United, and
UPS. It was determined that the fleet mix at PNS is not expected to deviate substantially from national
trends during the forecast period. Because Delta is the dominant carrier, its fleet plans were reviewed to
assess any potential impacts on the critical aircraft recommendations for PNS.
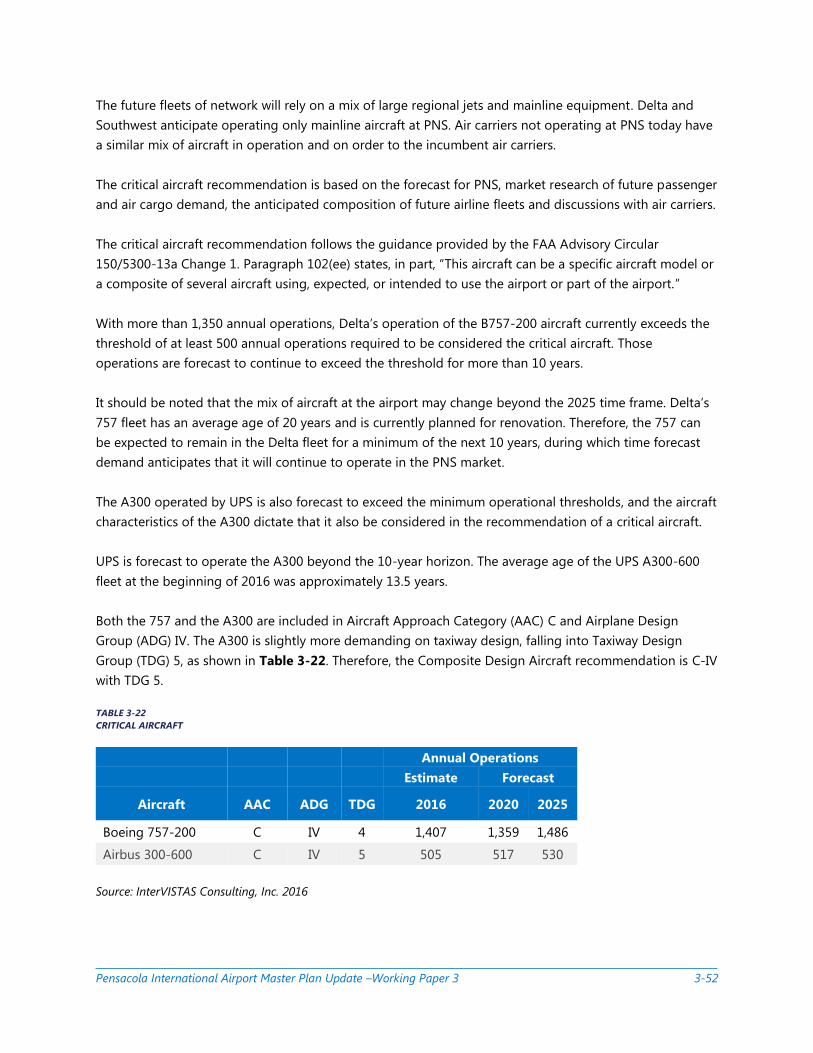
Pensacola International Airport Master Plan Update –Working Paper 3 3-52
The future fleets of network will rely on a mix of large regional jets and mainline equipment. Delta and
Southwest anticipate operating only mainline aircraft at PNS. Air carriers not operating at PNS today have
a similar mix of aircraft in operation and on order to the incumbent air carriers.
The critical aircraft recommendation is based on the forecast for PNS, market research of future passenger
and air cargo demand, the anticipated composition of future airline fleets and discussions with air carriers.
The critical aircraft recommendation follows the guidance provided by the FAA Advisory Circular
150/5300-13a Change 1. Paragraph 102(ee) states, in part, “This aircraft can be a specific aircraft model or
a composite of several aircraft using, expected, or intended to use the airport or part of the airport.”
With more than 1,350 annual operations, Delta’s operation of the B757-200 aircraft currently exceeds the
threshold of at least 500 annual operations required to be considered the critical aircraft. Those
operations are forecast to continue to exceed the threshold for more than 10 years.
It should be noted that the mix of aircraft at the airport may change beyond the 2025 time frame. Delta’s
757 fleet has an average age of 20 years and is currently planned for renovation. Therefore, the 757 can
be expected to remain in the Delta fleet for a minimum of the next 10 years, during which time forecast
demand anticipates that it will continue to operate in the PNS market.
The A300 operated by UPS is also forecast to exceed the minimum operational thresholds, and the aircraft
characteristics of the A300 dictate that it also be considered in the recommendation of a critical aircraft.
UPS is forecast to operate the A300 beyond the 10-year horizon. The average age of the UPS A300-600
fleet at the beginning of 2016 was approximately 13.5 years.
Both the 757 and the A300 are included in Aircraft Approach Category (AAC) C and Airplane Design
Group (ADG) IV. The A300 is slightly more demanding on taxiway design, falling into Taxiway Design
Group (TDG) 5, as shown in Table 3-22. Therefore, the Composite Design Aircraft recommendation is C-IV
with TDG 5.
TABLE 3-22
CRITICAL AIRCRAFT
Annual Operations
Estimate Forecast
Aircraft AAC ADG TDG 2016 2020 2025
Boeing 757-200 C IV 4 1,407 1,359 1,486
Airbus 300-600 C IV 5 505 517 530
Source: InterVISTAS Consulting, Inc. 2016
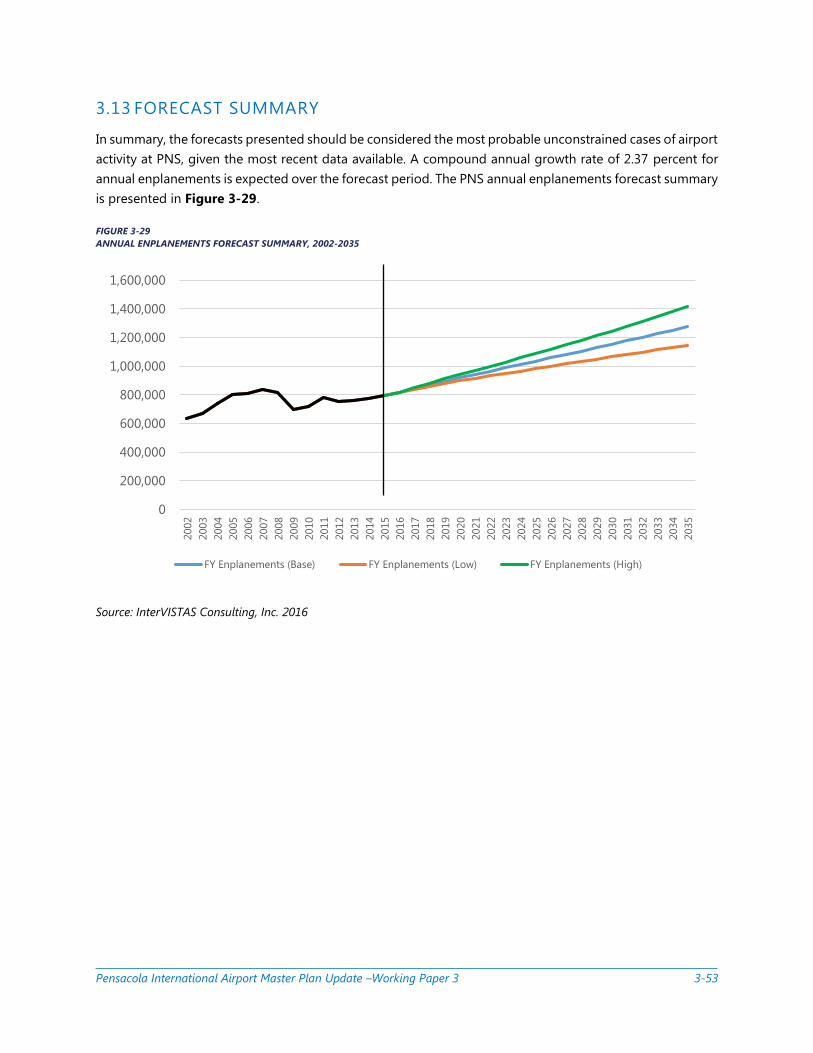
Pensacola International Airport Master Plan Update –Working Paper 3 3-53
3.13 FORECAST SUMMARY
In summary, the forecasts presented should be considered the most probable unconstrained cases of airport
activity at PNS, given the most recent data available. A compound annual growth rate of 2.37 percent for
annual enplanements is expected over the forecast period. The PNS annual enplanements forecast summary
is presented in Figure 3-29.
FIGURE 3-29
ANNUAL ENPLANEMENTS FORECAST SUMMARY, 2002-2035
Source: InterVISTAS Consulting, Inc. 2016
0
200,000
400,000
600,000
800,000
1,000,000
1,200,000
1,400,000
1,600,000
2002
2003
2004
2005
2006
2007
2008
2009
2010
2011
2012
2013
2014
2015
2016
2017
2018
2019
2020
2021
2022
2023
2024
2025
2026
2027
2028
2029
2030
2031
2032
2033
2034
2035
FY Enplanements (Base) FY Enplanements (Low) FY Enplanements (High)

Pensacola International Airport Master Plan Update –Working Paper 3 3-54
A compound annual growth rate of 1.23 percent for annual operations is expected over the forecast period.
The PNS annual operations forecast summary is presented in Figure 3-30.
Source: InterVISTAS Consulting, Inc. 2016
0
5,000
10,000
15,000
20,000
25,000
30,000
35,000
40,000
45,000
2004
2005
2006
2007
2008
2009
2010
2011
2012
2013
2014
2015
2016
2017
2018
2019
2020
2021
2022
2023
2024
2025
2026
2027
2028
2029
2030
2031
2032
2033
2034
2035
Total ATMs (Base) Total ATMs (Low) Total ATMs (High)
FIGURE 3-30
ANNUAL OPERATIONS FORECAST SUMMARY, 2002-2035