penny lab radioactivity. materials shoebox with lid 64 pennies graph paper stopwatch colored pencils...
TRANSCRIPT

Penny Lab
Radioactivity
Materials
• Shoebox with lid
• 64 pennies
• Graph paper
• Stopwatch
• Colored pencils and rulers
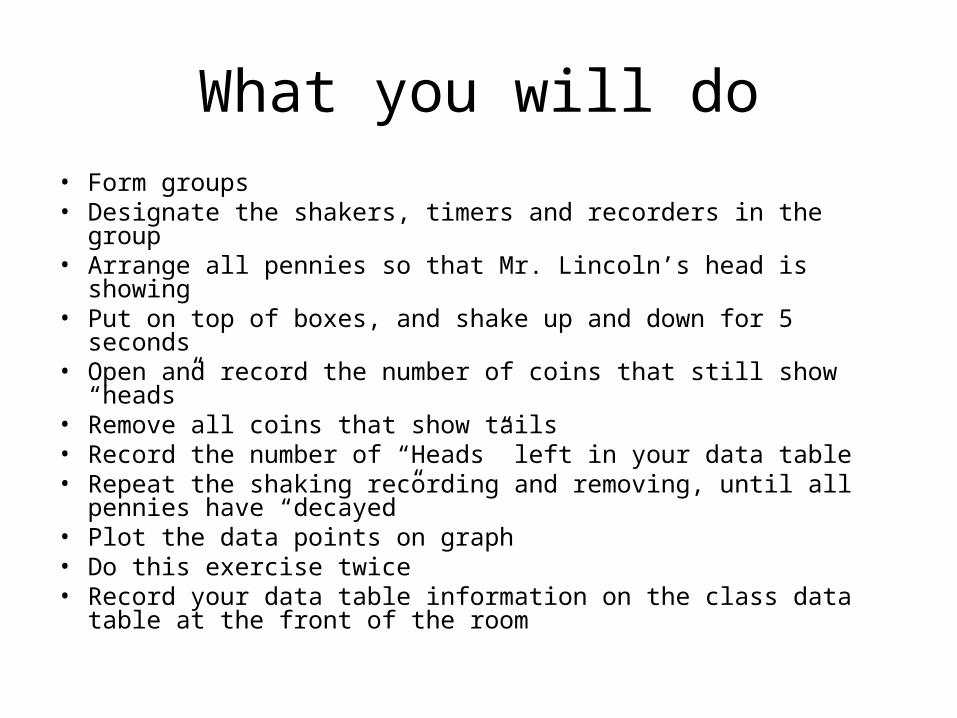
What you will do• Form groups• Designate the shakers, timers and recorders in the group• Arrange all pennies so that Mr. Lincoln’s head is showing• Put on top of boxes, and shake up and down for 5 seconds• Open and record the number of coins that still show “heads”• Remove all coins that show tails• Record the number of “Heads” left in your data table• Repeat the shaking recording and removing, until all pennies
have “decayed”• Plot the data points on graph• Do this exercise twice• Record your data table information on the class data table at
the front of the room
Make a prediction
• Fill in the table with your prediction of the number of pennies you expect to remain heads after each time spent shaking the box for the first trial
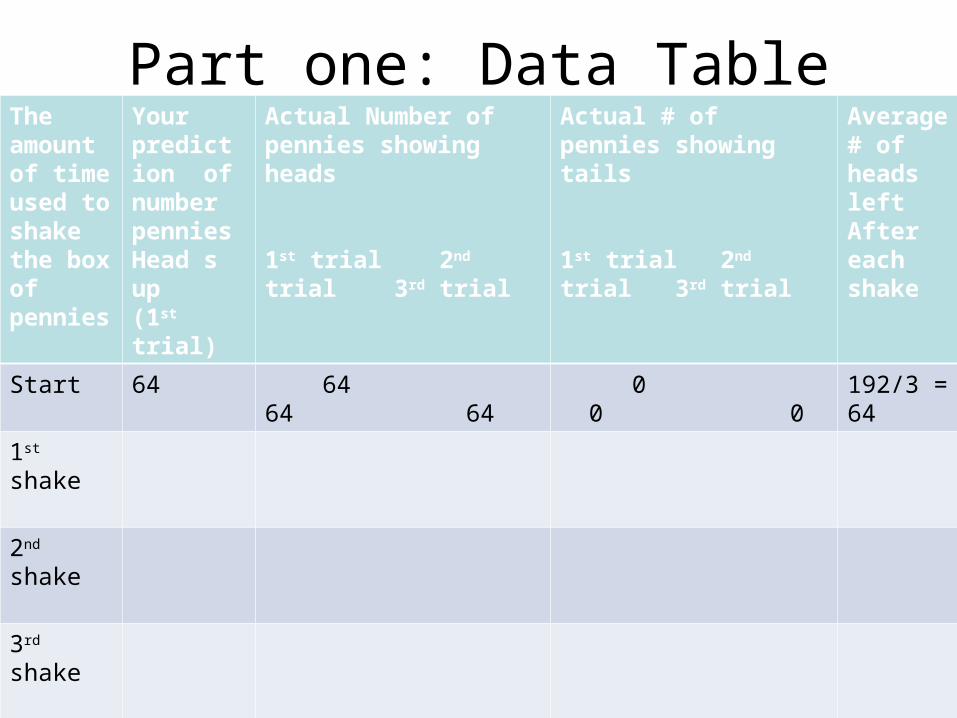
Part one: Data TableThe amount of time used to shake the box of pennies
Your prediction of number pennies Head s up (1st trial)
Actual Number of pennies showing heads
1st trial 2nd trial 3rd trial
Actual # of pennies showing tails
1st trial 2nd trial 3rd trial
Average# of heads leftAfter each shake
Start 64 64 64 64
0 0 0 192/3 = 64
1st shake
2nd shake
3rd shake
4th shake
5th shake
6th shake
7th shake
8th shake
9th shake
Make sure all data is recorded on graph
• Vertical: number of pennies• Horizontal: number of seconds shaking
• Each group does the experiment three times (3 trials)
• Average all trials before producing graph
Class Data
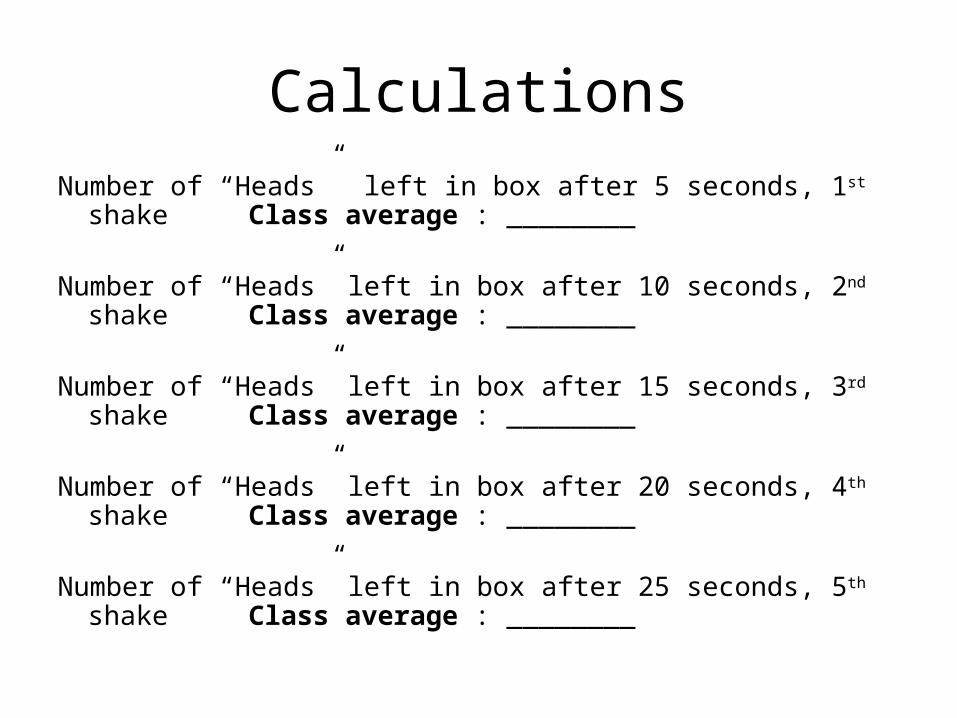
Calculations
Number of “Heads” left in box after 5 seconds, 1st shakeClass average : ________
Number of “Heads” left in box after 10 seconds, 2nd shakeClass average : ________
Number of “Heads” left in box after 15 seconds, 3rd shakeClass average : ________
Number of “Heads” left in box after 20 seconds, 4th shakeClass average : ________
Number of “Heads” left in box after 25 seconds, 5th shakeClass average : ________
Discussion of graph
• What is the shape of the graph?
• Is it linear? If not, is there another name used to describe a type of graph that better fits?
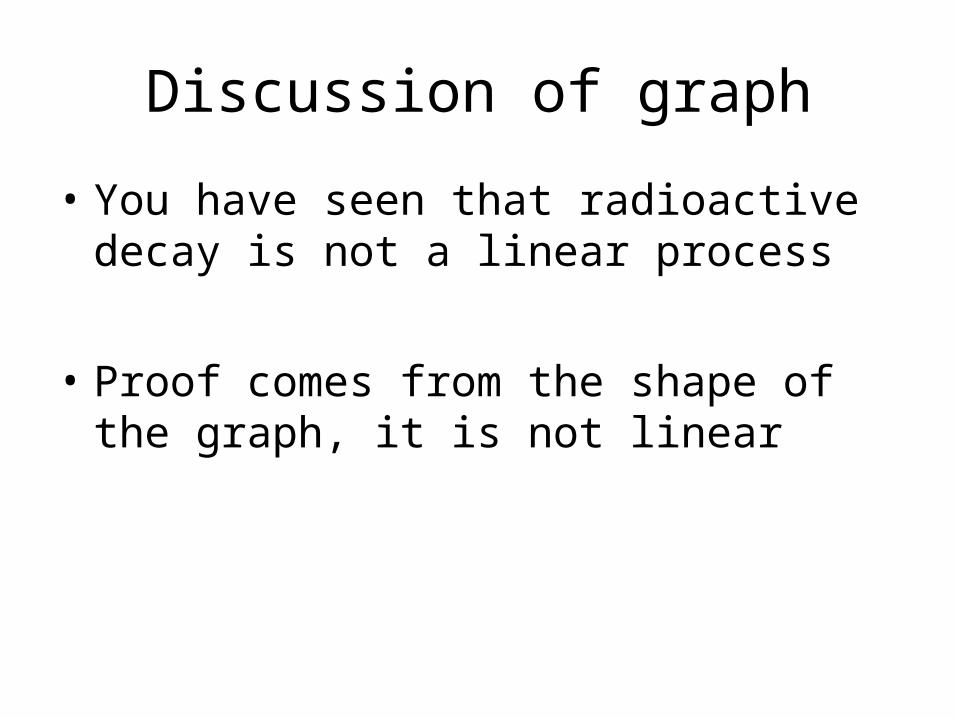
Discussion of graph
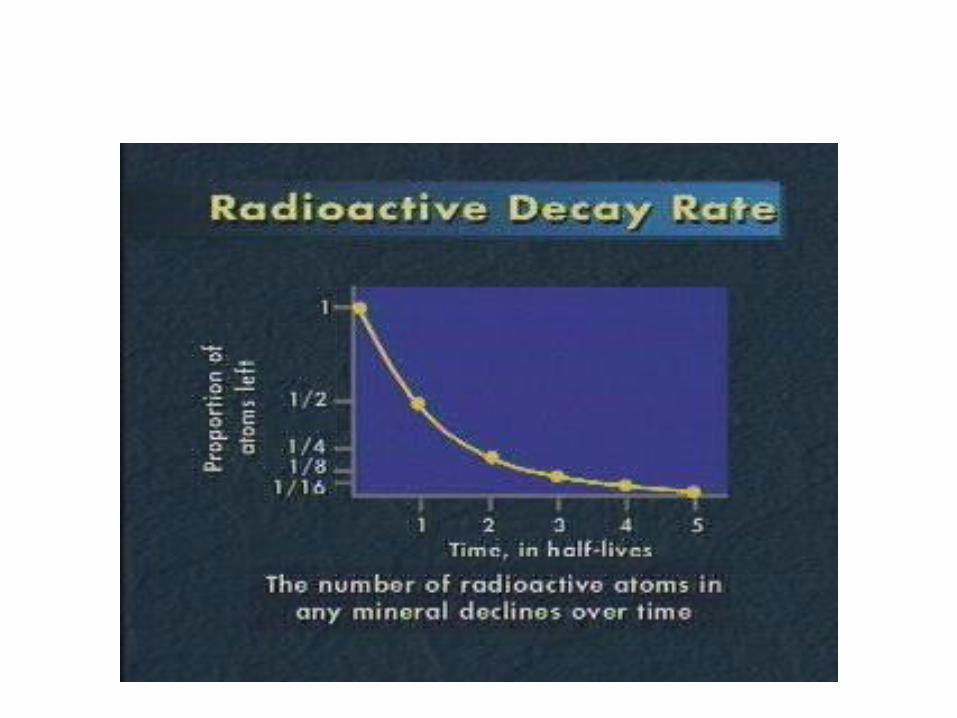
• You have seen that radioactive decay is not a linear process
• Proof comes from the shape of the graph, it is not linear
Discussion of data
• How close were the average values for heads in the class at each stage?
• Did it significantly matter how you shook the box?
• Did it matter which pennies turned tails
• Did the same pennies always turn tails after the first stage?
Randomness and your experiment
• If would be hard to predict which penny was tails at the end of a stage.
• It is easier to predict how many of the pennies will be tails after each stage
• Probability
Connection to science
• The pennies act like isotopes of elements
• The flipping to tails represents radioactive decay of unstable isotopes
• The shaking represents time it takes for half of the isotopes of an element to radioactively decay
What is an isotope?
• In the chemistry unit, you learned that all atoms of an individual element are not all the same.
• While atoms of the same element have the same number of protons, they do not always have the same number of neutrons.
• Atoms of the same element with different numbers of neutrons are called isotopes of that element.
Chemical properties of isotopes
• Isotopes of the same element behave the same way in chemical reactions, since they have the same number of protons and electrons.
What you didn’t know about isotopes…
• Ratio of protons to neutrons is important
• Only certain ratios are stable
• If ratio is not right, atom will break apart, spontaneously
• This break down includes breaking up the nucleus and release of energy (not fission but creation and the release of alpha particles)
An Unstable atom is a radioactive atom
• Isotopes that are unstable are described as radioactive.
• The break down process is called nuclear decay, radioactive decay, or radioactivity.
Randomness and decay
• It is important to recognize that radioactive decay cannot be controlled by any physical or chemical process.
• While we cannot predict exactly when any specific nucleus will decay, but we can determine how long it takes half of a group to decay
• Each radioactive isotope breaks down at a specific rate so scientists can use the proportion of isotopes to determine the age of a rock or fossil.
• While all isotopes decay in the same manner, their half-lives are not the same.
Most common isotopes used…
• Carbon-14 to determine age of organic material formed within the last 50,000 years
• Uranium-238 to determine age of rocks
Uranium-238 has a half-life of 4 510 000 000 (four and a half billion) years.
At the other end of the scale, Astatine-215 has a half-life of 100 microseconds.
Connection to lab
• The shaking represented the time it took half of the isotope atoms to decay
• The time needed for ½ of the atoms to decay is called a half-life.
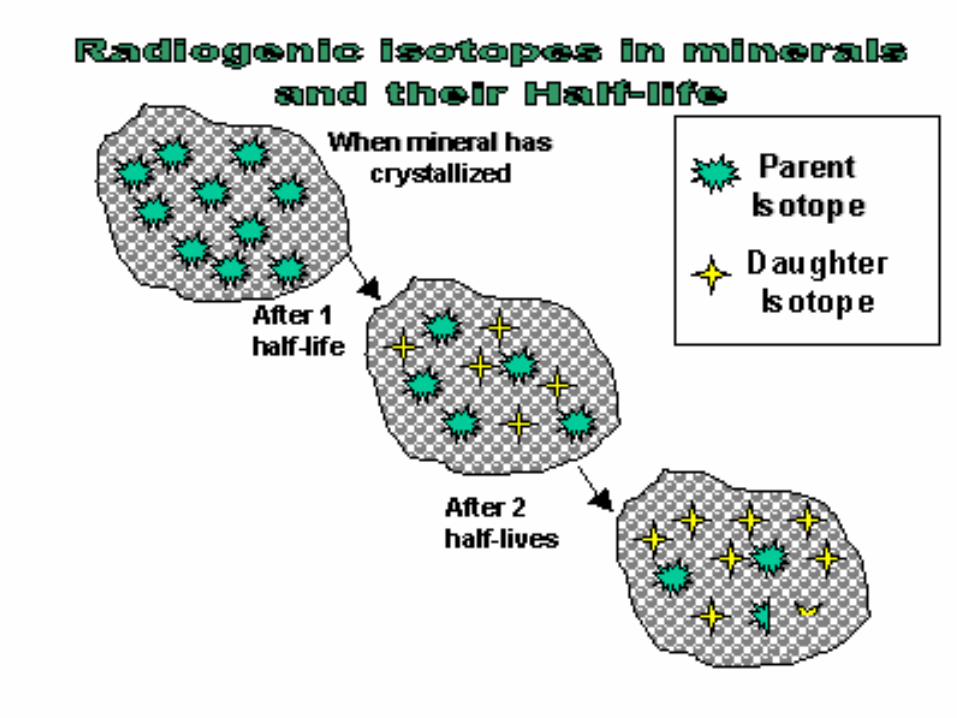
How to measure time
• 1 Half life means that half or the parent material has converted to the daughter material– Equal amounts of he parent and daughter material should be
found in the rock
• 2 half lives means that half of the remaining parent material has converted as well– Therefore, 3 times as much of the daughter material should be
found compared to the parent material in the rock

Connection to heat
• Each time an tom decays it releases energy
• A sizeable portion of energy is converted into heat (thermal energy) for the surrounding atoms
• This is one of the primary sources of heat inside the Earth
How to tell time
• The ratio of parent to daughter material indicates the age of the rock
• The higher amount of parent, the younger the rock
What elements are used to date rocks
• Only those materials that convert very slowly are used to date rocks
• The most common are:
• Uranium Lead
• Potassium Argon
• Rubidium Strontium
Read in your textbook
• Pages 286-291
• Especially 289-291
• Homework in book p292 1-5 in “Practice”\
• Homework in book same page towards bottom 6, 7, 8
Questions based on penny calculations
1. What was the average number of pennies that “decayed” or turned up tails after the first 5 second time period? What proportion of the original 64 pennies is this value?
2. What is the average number of pennies that turned up tail
after the second 5 second shaking? What proportion of the pennies in the box is this? What proportion of the original 64 pennies is this?
3. What pattern emerges from the class average data? Support your response.
More Questions based on penny values
4) Why is it important to use class average data instead of individual data for the analysis of this investigation?
5) How many trials did it take for half of the original amount of pennies in your box to come up tails?
6) What are the chances of a penny coming up heads after shaking? Chances of the penny coming up tails?
6a) Would it be easy to predict if a specific penny would be heads or tails after a round of being shook in the box?
7) Approximately what percentage of the remaining pennies were removed from the shoebox
after each shaking? 8) On average, how many times did you shake the box before only one penny was left?