pelagic industry processing effluents innovative and ... · pelagic industry processing effluents...
TRANSCRIPT

NORDIC INNOVATION PUBLICATION 2015:11 // NOVEMBER 2015
PIPE Pelagic Industry Processing Effluents Innovative and Sustainable Solutions


PIPE Pelagic Industry Processing Effluents Innovative and Sustainable Solutions
Author(s): Caroline P. Baron, Carsten ØsterbergChristian KempEva Rós BrinkGudrun OlafsdottirSusanne FolmerNina GringerCatharina ErikssonTore SvendsenIngrid Undeland
November 2015
Nordic Innovation publication 2015

Copyright Nordic Innovation 2015. All rights reserved.This publication includes material protected under copyright law, the copyright for which is held by Nordic Innovation or a third party. Material contained here may not be used for commercial purposes. The contents are the opinion of the writers concerned and do not represent the official Nordic Innovation position. Nordic Innovation bears no responsibility for any possible damage arising from the use of this material. The original source must be mentioned when quoting from this publication.
PIPEPelagic Industry Processing Effluents Innovative and Sustainable Solutions
Nordic Innovation Publication 2015:09© Nordic Innovation, Oslo 2015
ISBN 978-82-8277-082-8 (Print)ISBN 978-82-8277-081-1 (URL: http://www.nordicinnovation.org/publications)
Production: Melkeveien Designkontor AS
Printed on environmentally friendly paperThis publication can be downloaded free of charge as a pdf-file from www.nordicinnovation.org/publications.
Other Nordic Innovation publications are also freely available at the same web address.
PublisherNordic Innovation, Stensberggata 25, NO-0170 Oslo, NorwayPhone: (+47) 22 61 44 00. Fax: (+47) 22 55 65 56. E-mail: [email protected] www.nordicinnovation.org
Cover photo: Coulorbox


Project participants
DenmarkTechnical University of Denmark (DTU)Caroline P. Baron Associate [email protected]
LiqTechTore SvendsenResearch [email protected]
Fisk og Fødevare SupportCarsten Ø[email protected]
A-FactoryChristian [email protected]
Lykkeberg A/S Susanne Folmer [email protected]
SwedenChalmers University of TechnologyIngrid Undeland [email protected]
Paul Mattson ABChrister [email protected]
IcelandUniversity of Iceland Guðrún Ólafsdóttir Project manager [email protected]
Project evaluationLisbeth Due Schönemann-Paul, Corporate Sustainability Manager, Royal Greenland A/S
Sami Sassi CEO, CIL North A/S
Abbreviations
A* Antioxidant radical
AAS Absorption Spectroscopy
ABTS
AHANOVA
2,2´-azino-bis(3-ethylbenzthiazoline-6-sulphonic acid)Antioxidant moleculeAnalysis of variance
BCA Bicinchoninic Acid
BHA Butylated hydroxyanisole
BHT Butylated hydroxytoluene
BOD Biological oxygen demand
BOD5 Biological oxygen demand by microorganisms during the first 5 days of biodegradation at 20ºC
BSA bovine serum albumin
CA Cellulose acetate
CBA Cost-benefit analysis
Cfeed Concentration in feed
COD Chemical oxygen demand
CPCPI
Concentration polarisationConsumer price index
CpermeateCUPRAC
Concentration in permeateCupric reducing antioxidant capacity
DAF Dissolved air flotation
DHADM
DMF
Docosahexaenoic acidDry matterdimethylformamide
D-TSa Desalting brine TSa
D-TSpEAI
EDTA
desalting brine TSpEmulsification activity indexEthylenediaminetetraacetic acid, disodium salt
EFEF-
OUTLET
Electrochemical flocculationElectrochemical flocculation outlet
EPAESI
Eicosapentaenoic acidEmulsion stability index
FC Foaming capacity
FOG Fats, oils and greases
FPCP Fish protein co-products
FPH Fish protein hydrolysates
FSFV
Foaming stabilityFuture value
GDPGC-MS
Gross dimestic productsGas chromatography-mass spectroscopy
Hb Hemoglobin
HMW High molecular weight
ISP Isolated soy protein
L Lipid
LC-MS liquid chromatography-mass spectroscopy
LC-PUFA Long chain polyunsaturated fatty acid
LMW Low molecular weight
MA Molar absorbance
MF Microfiltration
MSP Membrane separation process
MWCO Molecular weight cut-off
MDAMDAE
MalondialdehydeMalondialdehyde equivalent
MUFA Monounsaturated fatty acids
N Nitrogen
NF Nanofiltration
NPV Net present value
ODORAC
Optical densityOxygen radical antioxidant capacity
P Phosphorous
PAN PAGE
PolyacrylonitrilePolyacrylamide gel electrophoresis
PESPG
Polyethersulfonepropylgallate
PFPF-PERPF-RET
PP
Polypropylene filtrationPolypropylene filtration permeatePolypropylene filtration retentatePolypropylene
PSO Polysulfone
PUFAPVPV
Polyunsaturated fatty acidsPeroxide valuePresent value
PVDF Polyvinylidene difluoride
PVP Polyvinyl-pyrollidone

PW Processing water
RRFU
RO
RetentionRelative fluorescence intensityReverse osmosis
RSWRP
Refrigerated sea waterRipening brine
SB Salt brines
SC Spice-cured herring brine
SDS Sodium dodecyl sulphate
SFA Saturated fatty acids
SiC Silicon carbide
SW Storage water
TCA Trichloroacetic acid
TE Trolox equivalents
TEAC Trolox equivalents antioxidant capacity
TMP Trans-membrane pressure
TBA Thiobarbituric acid
TBARS Thiobarbituric acid reactive substances
TSa Traditional barrel-salted herring brine
TSp Traditional barrel-salted spice-cured herring brine
TSS Total suspended solids
TVB_NUF
VAT
Total Volatile basic nitrogenUltrafiltrationValue added tax
VCW
WPWPC
WT
Vinegar-cured herring brine WaterWork packageWhey protein concentrateWeight

Contents
List of Figures & Tables . . . . . . . . . . . . . . . . . . . . . . . . . . . . . . . . . . . . . . . . . . . . . . . . . . . . . . . . . . . . . . . . 14Preface & acknowledgments . . . . . . . . . . . . . . . . . . . . . . . . . . . . . . . . . . . . . . . . . . . . . . . . . . . . . . . . . . . 16Disseminations . . . . . . . . . . . . . . . . . . . . . . . . . . . . . . . . . . . . . . . . . . . . . . . . . . . . . . . . . . . . . . . . . . . . . . . . 17Executive summary . . . . . . . . . . . . . . . . . . . . . . . . . . . . . . . . . . . . . . . . . . . . . . . . . . . . . . . . . . . . . . . . . . . .201. Herring Production . . . . . . . . . . . . . . . . . . . . . . . . . . . . . . . . . . . . . . . . . . . . . . . . . . . . . . . . . . . . . . . . 23
1.1. Herring processing . . . . . . . . . . . . . . . . . . . . . . . . . . . . . . . . . . . . . . . . . . . . . . . . . . . . . . . . . . . . . . . 232. Waste water treatment . . . . . . . . . . . . . . . . . . . . . . . . . . . . . . . . . . . . . . . . . . . . . . . . . . . . . . . . . . . . . 27
2.1. Treatment of food processing wastewater . . . . . . . . . . . . . . . . . . . . . . . . . . . . . . . . . . . . . . . . . . . . 272.2. Separation technologies . . . . . . . . . . . . . . . . . . . . . . . . . . . . . . . . . . . . . . . . . . . . . . . . . . . . . . . . . . . 29
2.2.1. Electro-flocculation . . . . . . . . . . . . . . . . . . . . . . . . . . . . . . . . . . . . . . . . . . . . . . . . . . . . . . . . .302.2.2. Membrane separation processes . . . . . . . . . . . . . . . . . . . . . . . . . . . . . . . . . . . . . . . . . . . . . . 312.2.2.1. Microfiltration . . . . . . . . . . . . . . . . . . . . . . . . . . . . . . . . . . . . . . . . . . . . . . . . . . . . . . . . . . . . 342.2.2.2. Ultrafiltration . . . . . . . . . . . . . . . . . . . . . . . . . . . . . . . . . . . . . . . . . . . . . . . . . . . . . . . . . . . . 34
2.3. Applied separation and recovery techniques in the food industry . . . . . . . . . . . . . . . . . . . . . . . . . 363. Valorisation of marine biomass . . . . . . . . . . . . . . . . . . . . . . . . . . . . . . . . . . . . . . . . . . . . . . . . . . . . 39
3.1. Bioactives compounds . . . . . . . . . . . . . . . . . . . . . . . . . . . . . . . . . . . . . . . . . . . . . . . . . . . . . . . . . . . . . 393.2. Fish protein hydrolysates . . . . . . . . . . . . . . . . . . . . . . . . . . . . . . . . . . . . . . . . . . . . . . . . . . . . . . . . . .403.3. Antioxidant peptides . . . . . . . . . . . . . . . . . . . . . . . . . . . . . . . . . . . . . . . . . . . . . . . . . . . . . . . . . . . . . . 42
4. Characterisation of process waters . . . . . . . . . . . . . . . . . . . . . . . . . . . . . . . . . . . . . . . . . . . . . . . . . 444.1. Sampling . . . . . . . . . . . . . . . . . . . . . . . . . . . . . . . . . . . . . . . . . . . . . . . . . . . . . . . . . . . . . . . . . . . . . . . 44
4.1.1. Sampling at Primary Producer . . . . . . . . . . . . . . . . . . . . . . . . . . . . . . . . . . . . . . . . . . . . . . . . 444.1.2. Sampling at Secondary Producer . . . . . . . . . . . . . . . . . . . . . . . . . . . . . . . . . . . . . . . . . . . . . . 44
4.2. Methods . . . . . . . . . . . . . . . . . . . . . . . . . . . . . . . . . . . . . . . . . . . . . . . . . . . . . . . . . . . . . . . . . . . . . . . . 454.2.1. Dry matter, pH and ionic strength . . . . . . . . . . . . . . . . . . . . . . . . . . . . . . . . . . . . . . . . . . . . 454.2.2. Total proteins and polypeptide profile . . . . . . . . . . . . . . . . . . . . . . . . . . . . . . . . . . . . . . . . . 454.2.3. Total and free amino acids . . . . . . . . . . . . . . . . . . . . . . . . . . . . . . . . . . . . . . . . . . . . . . . . . . . 454.2.4. Total fatty acids . . . . . . . . . . . . . . . . . . . . . . . . . . . . . . . . . . . . . . . . . . . . . . . . . . . . . . . . . . . . 464.2.5. Trace elements . . . . . . . . . . . . . . . . . . . . . . . . . . . . . . . . . . . . . . . . . . . . . . . . . . . . . . . . . . . . . 464.2.6. Total Volatile Basic Nitrogen (TVB-N) & Thiobarbituric reactive substances (TBARS) . 464.2.7. Enzymatic activity . . . . . . . . . . . . . . . . . . . . . . . . . . . . . . . . . . . . . . . . . . . . . . . . . . . . . . . . . . 474.2.8. Statistical analysis . . . . . . . . . . . . . . . . . . . . . . . . . . . . . . . . . . . . . . . . . . . . . . . . . . . . . . . . . . 47
4.3. Results & Discussion . . . . . . . . . . . . . . . . . . . . . . . . . . . . . . . . . . . . . . . . . . . . . . . . . . . . . . . . . . . . . . 474.3.1. Primary producer process waters . . . . . . . . . . . . . . . . . . . . . . . . . . . . . . . . . . . . . . . . . . . . . . 474.3.2. Secondary producer brines . . . . . . . . . . . . . . . . . . . . . . . . . . . . . . . . . . . . . . . . . . . . . . . . . . . 554.3.2.1. Proximate composition . . . . . . . . . . . . . . . . . . . . . . . . . . . . . . . . . . . . . . . . . . . . . . . . . . . . . 554.3.2.2. Enzymatic activity . . . . . . . . . . . . . . . . . . . . . . . . . . . . . . . . . . . . . . . . . . . . . . . . . . . . . . . . . 564.3.2.3. Polypeptides profile . . . . . . . . . . . . . . . . . . . . . . . . . . . . . . . . . . . . . . . . . . . . . . . . . . . . . . . . 564.3.3. Estimation of loss of biomass in the marinated herring industry . . . . . . . . . . . . . . . . . . . 57

5. Separation & recovery . . . . . . . . . . . . . . . . . . . . . . . . . . . . . . . . . . . . . . . . . . . . . . . . . . . . . . . . . . . . . 595.1. Sampling & Treatments . . . . . . . . . . . . . . . . . . . . . . . . . . . . . . . . . . . . . . . . . . . . . . . . . . . . . . . . . . . 59
5.1.1. Primary producers . . . . . . . . . . . . . . . . . . . . . . . . . . . . . . . . . . . . . . . . . . . . . . . . . . . . . . . . . . 595.1.2. Secondary producers . . . . . . . . . . . . . . . . . . . . . . . . . . . . . . . . . . . . . . . . . . . . . . . . . . . . . . . . 595.1.2.1. Pre-treatment; Electroflocculation (EF) or polypropylene filter (PF) . . . . . . . . . . . . . . . 595.1.2.2. Ultrafiltration (UF). . . . . . . . . . . . . . . . . . . . . . . . . . . . . . . . . . . . . . . . . . . . . . . . . . . . . . . . .60
5.2. Methods . . . . . . . . . . . . . . . . . . . . . . . . . . . . . . . . . . . . . . . . . . . . . . . . . . . . . . . . . . . . . . . . . . . . . . . . 615.2.1. Proximate composition . . . . . . . . . . . . . . . . . . . . . . . . . . . . . . . . . . . . . . . . . . . . . . . . . . . . . . 615.2.2. Oxidation during filtration . . . . . . . . . . . . . . . . . . . . . . . . . . . . . . . . . . . . . . . . . . . . . . . . . . . 615.2.3. Water quality indicators . . . . . . . . . . . . . . . . . . . . . . . . . . . . . . . . . . . . . . . . . . . . . . . . . . . . . 615.2.4. Statistical analysis . . . . . . . . . . . . . . . . . . . . . . . . . . . . . . . . . . . . . . . . . . . . . . . . . . . . . . . . . . 62
5.3. Results and Discussion . . . . . . . . . . . . . . . . . . . . . . . . . . . . . . . . . . . . . . . . . . . . . . . . . . . . . . . . . . . . 625.3.1. Primary producer trials . . . . . . . . . . . . . . . . . . . . . . . . . . . . . . . . . . . . . . . . . . . . . . . . . . . . . . 625.3.2. Secondary producer trials . . . . . . . . . . . . . . . . . . . . . . . . . . . . . . . . . . . . . . . . . . . . . . . . . . . 645.3.2.1. Pre-treatment. . . . . . . . . . . . . . . . . . . . . . . . . . . . . . . . . . . . . . . . . . . . . . . . . . . . . . . . . . . . . 645.3.2.2. Consecutive PF and UF . . . . . . . . . . . . . . . . . . . . . . . . . . . . . . . . . . . . . . . . . . . . . . . . . . . . . 65
6. Valorisation . . . . . . . . . . . . . . . . . . . . . . . . . . . . . . . . . . . . . . . . . . . . . . . . . . . . . . . . . . . . . . . . . . . . . . . .686.1. Sampling & Treatment . . . . . . . . . . . . . . . . . . . . . . . . . . . . . . . . . . . . . . . . . . . . . . . . . . . . . . . . . . . .68
6.1.1. Antioxidant and functionality testing in model systems . . . . . . . . . . . . . . . . . . . . . . . . . . . 686.1.2. Antioxidant testing in food systems . . . . . . . . . . . . . . . . . . . . . . . . . . . . . . . . . . . . . . . . . . . . 686.1.2.1. Frozen herring coating . . . . . . . . . . . . . . . . . . . . . . . . . . . . . . . . . . . . . . . . . . . . . . . . . . . . .686.1.2.2. Additions to mince . . . . . . . . . . . . . . . . . . . . . . . . . . . . . . . . . . . . . . . . . . . . . . . . . . . . . . . . .68
6.2. Methods . . . . . . . . . . . . . . . . . . . . . . . . . . . . . . . . . . . . . . . . . . . . . . . . . . . . . . . . . . . . . . . . . . . . . . . . 696.2.1. Functionality testing of primary producers brines and separation trial outlets . . . . . . . . 696.2.2. Antioxidant testing of primary producers process waters . . . . . . . . . . . . . . . . . . . . . . . . . . 696.2.2.1. Cupric reducing antioxidant capacity (CUPRAC) assay . . . . . . . . . . . . . . . . . . . . . . . . . . 696.2.2.2. ORAC-assay (peroxyl radical scavenging activity) . . . . . . . . . . . . . . . . . . . . . . . . . . . . . . . 706.2.3. Microalgae growh media from primary producers brines . . . . . . . . . . . . . . . . . . . . . . . . . 706.2.4. Antioxidant testing of secondary producers brines . . . . . . . . . . . . . . . . . . . . . . . . . . . . . . . 716.2.4.1. Antioxidant assays . . . . . . . . . . . . . . . . . . . . . . . . . . . . . . . . . . . . . . . . . . . . . . . . . . . . . . . . . 716.2.5. Antioxidant activity in food systems . . . . . . . . . . . . . . . . . . . . . . . . . . . . . . . . . . . . . . . . . . . 716.2.6. Statisitcs. . . . . . . . . . . . . . . . . . . . . . . . . . . . . . . . . . . . . . . . . . . . . . . . . . . . . . . . . . . . . . . . . . . 72
6.3. Result and Discussion . . . . . . . . . . . . . . . . . . . . . . . . . . . . . . . . . . . . . . . . . . . . . . . . . . . . . . . . . . . . . 726.3.1. Primary producers . . . . . . . . . . . . . . . . . . . . . . . . . . . . . . . . . . . . . . . . . . . . . . . . . . . . . . . . . . 726.3.1.1. Functionality of inlet and recovered fractions during separation trials . . . . . . . . . . . . . 726.3.1.2. Antioxidant activity testing of primary producers waters . . . . . . . . . . . . . . . . . . . . . . . . 736.3.1.3. Microalgae growth media . . . . . . . . . . . . . . . . . . . . . . . . . . . . . . . . . . . . . . . . . . . . . . . . . . . 756.3.2. Secondary producer . . . . . . . . . . . . . . . . . . . . . . . . . . . . . . . . . . . . . . . . . . . . . . . . . . . . . . . . . 76

6.3.2.1. Antioxidant assays . . . . . . . . . . . . . . . . . . . . . . . . . . . . . . . . . . . . . . . . . . . . . . . . . . . . . . . . . 766.3.2.2. Antioxidant testing in food system . . . . . . . . . . . . . . . . . . . . . . . . . . . . . . . . . . . . . . . . . . . 77
7. CostBenefitAnalysis . . . . . . . . . . . . . . . . . . . . . . . . . . . . . . . . . . . . . . . . . . . . . . . . . . . . . . . . . . . . . . . 827.1. Theory & concepts . . . . . . . . . . . . . . . . . . . . . . . . . . . . . . . . . . . . . . . . . . . . . . . . . . . . . . . . . . . . . . . . 82
7.1.1. Cost-benefit analysis . . . . . . . . . . . . . . . . . . . . . . . . . . . . . . . . . . . . . . . . . . . . . . . . . . . . . . . . 827.1.2. Net Present Value . . . . . . . . . . . . . . . . . . . . . . . . . . . . . . . . . . . . . . . . . . . . . . . . . . . . . . . . . . . 837.1.3. Inflation . . . . . . . . . . . . . . . . . . . . . . . . . . . . . . . . . . . . . . . . . . . . . . . . . . . . . . . . . . . . . . . . . . .84
7.2. Methods . . . . . . . . . . . . . . . . . . . . . . . . . . . . . . . . . . . . . . . . . . . . . . . . . . . . . . . . . . . . . . . . . . . . . . . .847.2.1. Market Analysis . . . . . . . . . . . . . . . . . . . . . . . . . . . . . . . . . . . . . . . . . . . . . . . . . . . . . . . . . . . .847.2.2. Cost-Benefit Analysis . . . . . . . . . . . . . . . . . . . . . . . . . . . . . . . . . . . . . . . . . . . . . . . . . . . . . . . . 85
7.3. Results & Discussion . . . . . . . . . . . . . . . . . . . . . . . . . . . . . . . . . . . . . . . . . . . . . . . . . . . . . . . . . . . . . . 857.3.1. Market Analysis . . . . . . . . . . . . . . . . . . . . . . . . . . . . . . . . . . . . . . . . . . . . . . . . . . . . . . . . . . . . 857.3.1.1. Fish processing industry . . . . . . . . . . . . . . . . . . . . . . . . . . . . . . . . . . . . . . . . . . . . . . . . . . . . 857.3.1.2. Fish feed industry . . . . . . . . . . . . . . . . . . . . . . . . . . . . . . . . . . . . . . . . . . . . . . . . . . . . . . . . . . 917.3.2. Cost-Benefit Analysis . . . . . . . . . . . . . . . . . . . . . . . . . . . . . . . . . . . . . . . . . . . . . . . . . . . . . . . . 927.3.2.1. Cost & benefit . . . . . . . . . . . . . . . . . . . . . . . . . . . . . . . . . . . . . . . . . . . . . . . . . . . . . . . . . . . . . 927.3.2.2. Analysis . . . . . . . . . . . . . . . . . . . . . . . . . . . . . . . . . . . . . . . . . . . . . . . . . . . . . . . . . . . . . . . . . .98
8. Conclusions & Perspectives. . . . . . . . . . . . . . . . . . . . . . . . . . . . . . . . . . . . . . . . . . . . . . . . . . . . . . . . 1109. References . . . . . . . . . . . . . . . . . . . . . . . . . . . . . . . . . . . . . . . . . . . . . . . . . . . . . . . . . . . . . . . . . . . . . . . 11210.Appendixes . . . . . . . . . . . . . . . . . . . . . . . . . . . . . . . . . . . . . . . . . . . . . . . . . . . . . . . . . . . . . . . . . . . . . . . 121
List of Figures & Tables
FiguresFigure 1: Marinated herring processing steps from boat to jars. . . . . . . . . . . . . . . . . . . . . . . . . . . . . . . . . . 24Figure 2: Production flow chart with the different process waters and brines generated during
marinated herring production; from primary to secondary producers. . . . . . . . . . . . . . . . . . . . . . . . . 25Figure 3: Typical treatment process for wastewater from the food industry, with indication of the main
purpose and main techniques used in the pre-, primary-, secondary- and tertiary treatments. . . . . 28Figure 4: Common separation technologies for food processing wastes/wastewaters. . . . . . . . . . . . . . . 30Figure 5: Schematic illustration of the principle behind electro-flocculation . . . . . . . . . . . . . . . . . . . . . . 31Figure 6: Approx. molecular weight (MW in Da) cut-off values (in microns, µm) of membranes
used in separation processes with examples of relative size of common materials. . . . . . . . . . . . . . . 32Figure 7: Flux (L/m2h) decline is caused by concentration polarisation (CP) and fouling.
The pure water flux is indicated by (•). . . . . . . . . . . . . . . . . . . . . . . . . . . . . . . . . . . . . . . . . . . . . . . . . . . . 33Figure 8: Membrane separation with membrane types and typical material retained.. . . . . . . . . . . . . . . 34Figure 9: . . . . . . . . . . . . . . . . . . . . . . . . . . . . . . . . . . . . . . . . . . . . . . . . . . . . . . . . . . . . . . . . . . . . . . . . . . . . . . . 35Figure 10: Protein and fatty acids in SW (March 2012) over time expressed as mg/ml.. . . . . . . . . . . . . . 48Figure 11: Protein and fatty acids in SB (March 2012) incubated with a) Cut C or b) cut A for up to 25h
expressed as mg/ml. . . . . . . . . . . . . . . . . . . . . . . . . . . . . . . . . . . . . . . . . . . . . . . . . . . . . . . . . . . . . . . . . . . 49Figure 12: Proteins as a function of incubation time in SW and SB obtained a) in September 2012 (-S)
and b) in February 2013(-F) . . . . . . . . . . . . . . . . . . . . . . . . . . . . . . . . . . . . . . . . . . . . . . . . . . . . . . . . . . . . 50Figure 13: Content (mg/ml) of fatty acids as a function of time a) in September 2012 (-S) and b)
in February 2013(-F) . . . . . . . . . . . . . . . . . . . . . . . . . . . . . . . . . . . . . . . . . . . . . . . . . . . . . . . . . . . . . . . . . . 51Figure 14: SDS PAGE of different process waters from different cuts. . . . . . . . . . . . . . . . . . . . . . . . . . . . . 52Figure 15: SDS PAGE of different process water and impact of incubation time . . . . . . . . . . . . . . . . . . . . 53Figure 16: SDS PAGE of different effluents. . . . . . . . . . . . . . . . . . . . . . . . . . . . . . . . . . . . . . . . . . . . . . . . . . . 57Figure 17: Pilot unit used for UF . . . . . . . . . . . . . . . . . . . . . . . . . . . . . . . . . . . . . . . . . . . . . . . . . . . . . . . . . . .60Figure 18: Pilot unit for EF with the cathode . . . . . . . . . . . . . . . . . . . . . . . . . . . . . . . . . . . . . . . . . . . . . . . . .60Figure 19: Flow chart of the pilot scale units. . . . . . . . . . . . . . . . . . . . . . . . . . . . . . . . . . . . . . . . . . . . . . . . . . 61Figure 20: TBARS in the different water before and after UF treatment. . . . . . . . . . . . . . . . . . . . . . . . . . . 66Figure 21: Results from the CUPRAC assay (reducing capacity) expressed per ml process water. . . . . . 74Figure 22: Results from the CUPRAC assay (reducing capacity) expressed per mg protein of the
different process waters. . . . . . . . . . . . . . . . . . . . . . . . . . . . . . . . . . . . . . . . . . . . . . . . . . . . . . . . . . . . . . . . 74Figure 23: Peroxyl radical scavenging capacity per L of samples expressed as
Trolox equivalents (TE). . . . . . . . . . . . . . . . . . . . . . . . . . . . . . . . . . . . . . . . . . . . . . . . . . . . . . . . . . . . . . . . 75Figure 24: Peroxyl radical scavenging capacity per g of protein in the sample expressed as Trolox
equivalent (TE). . . . . . . . . . . . . . . . . . . . . . . . . . . . . . . . . . . . . . . . . . . . . . . . . . . . . . . . . . . . . . . . . . . . . . . 75Figure 25: Example of incubating experiment of brine from primary producers with different
strain of microalgae. . . . . . . . . . . . . . . . . . . . . . . . . . . . . . . . . . . . . . . . . . . . . . . . . . . . . . . . . . . . . . . . . . . 76

Figure 26: Iron chelating activity (%) in the six brines. The activity of the samples is plotted against the dilution factor. . . . . . . . . . . . . . . . . . . . . . . . . . . . . . . . . . . . . . . . . . . . . . . . . . . . . . . . . . . . . . 76
Figure 27: Reducing power (OD700) in the brines. The activity of the samples is plotted against the dilution factor. . . . . . . . . . . . . . . . . . . . . . . . . . . . . . . . . . . . . . . . . . . . . . . . . . . . . . . . . . . . . . . . . . . . . . . . 77
Figure 28: Peroxide value (PV) (meq of O2 per kilogram of oil) during storage of brine coated frozen fillets at -10°C for 4 and 10 weeks from SC, TSa, TSp, . . . . . . . . . . . . . . . . . . . . . . . . . . . . . . . . 78
Figure 29: Relationship between present value, discount rate and time. . . . . . . . . . . . . . . . . . . . . . . . . . . 83Figure 30: Number of participant per country in the survey . . . . . . . . . . . . . . . . . . . . . . . . . . . . . . . . . . . . 86Figure 31: Different products that the companies produce. . . . . . . . . . . . . . . . . . . . . . . . . . . . . . . . . . . . . . 86Figure 32: Technologies used by participants for wastewater treatment . . . . . . . . . . . . . . . . . . . . . . . . . . 87Figure 33: Interest in a technology that lowers COD/BOD levels . . . . . . . . . . . . . . . . . . . . . . . . . . . . . . . . 87Figure 34: Interest in a technology that allows reuse of water . . . . . . . . . . . . . . . . . . . . . . . . . . . . . . . . . . .88Figure 35: Interest depending on country of origin . . . . . . . . . . . . . . . . . . . . . . . . . . . . . . . . . . . . . . . . . . . .88Figure 36: The participants’ willingness to invest to keep a low environmental profile . . . . . . . . . . . . . .90Figure 37: Maximum investment the participants are willing to make to save 1 million NOK a year . . .90Figure 38: Sensitivity of the NPV for secondary producers . . . . . . . . . . . . . . . . . . . . . . . . . . . . . . . . . . . . 100Figure 39: Sensitivity of the NPV for secondary producer, including tax and water reuse benefits . . . 101Figure 40: Sensitivity of the NPV for Option 1 for the primary producers . . . . . . . . . . . . . . . . . . . . . . . . 102Figure 41: Sensitivity of the NPV for option 1 for the primary producers including tax and
water reuse benefits . . . . . . . . . . . . . . . . . . . . . . . . . . . . . . . . . . . . . . . . . . . . . . . . . . . . . . . . . . . . . . . . . . 103Figure 42: Sensitivity of the NPV for option 2 for primary producer . . . . . . . . . . . . . . . . . . . . . . . . . . . . 105Figure 43: Sensitivity of the NPV for Option 2 including tax and water reuse benefits . . . . . . . . . . . . . 106Figure 44: Sensitivity of the NPV for Option 3 for primary producers . . . . . . . . . . . . . . . . . . . . . . . . . . . 107Figure 45: Sensitivity of the NPV for Option 3 including tax and water reuse benefits . . . . . . . . . . . . . . 108
TablesTable 1: Applied separation and treatment techniques for process water in the food industry. . . . . . . . 37Table 2: Peptide sequences with antioxidant activity. . . . . . . . . . . . . . . . . . . . . . . . . . . . . . . . . . . . . . . . . . . 42Table 3: Protein and fatty acids in SW (March 2012) over time expressed as mg/ml . . . . . . . . . . . . . . . . 48Table 4: Dry matter in the different processing brine RSW, SW, and SB (March, 2012). . . . . . . . . . . . . . 49Table 5: Trace elements in selected effluent expressed as µg/ml with incubation time in bracket . . . . . 53Table 6: Stability of different process waters from September 2012 (-S) and February 2013 (-F) as
a function of incubation time expressed as TVB-N in mg/100 ml and TBARS in mM. . . . . . . . . . . . . 54Table 7: Proximate composition of processing brines including salt, dry matter, soluble protein,
total fatty acids as well as enzymatic activity. . . . . . . . . . . . . . . . . . . . . . . . . . . . . . . . . . . . . . . . . . . . . . . 55Table 8: Amount of protein and lipid in the processing waters for primary producers . . . . . . . . . . . . . . 58Table 9: Amount of protein and lipid in the processing waters for secondary producers . . . . . . . . . . . . . 58Table 10: Content of proteins, fatty acids, dry matter and chemical oxygen demand (COD) during
the different steps of the concentration trials applied on selected process waters. . . . . . . . . . . . . . . 63Table 11: Aluminum content (mg/L) in UF-permeate and UF-retentate after EF and
PF pre-treatments. . . . . . . . . . . . . . . . . . . . . . . . . . . . . . . . . . . . . . . . . . . . . . . . . . . . . . . . . . . . . . . . . . . . . 65Table 12: Mass balances based on consecutive PF and UF treatment of TSp and SC. . . . . . . . . . . . . . . . . 65Table 13: COD (g/L), BOD5 (g/L), TSS (g/L) and salt content (wt%) in inlets, PF-Permeate,
UF-Permeate and UF-Retentate after consecutive PF and UF treatment of TSp and SC. . . . . . . . . . 66Table 14: Primary production samples subjected to antioxidant testing . . . . . . . . . . . . . . . . . . . . . . . . . . 69Table 15: Foaming capacity (FC %), foaming stability (FS %) after 60 min and emulsifying activity
index EAI m2 g-1, and emulsion stability index ( ESI %) of initial feeds and concentrates from trials 1-2. . . . . . . . . . . . . . . . . . . . . . . . . . . . . . . . . . . . . . . . . . . . . . . . . . . . . . . . . . . . . . . . . . . . . . . . 73

Table 16: Development of volatiles (ng per g minced) during storage of brine coated frozen fillets at -10°C for 4 and 10 weeks. . . . . . . . . . . . . . . . . . . . . . . . . . . . . . . . . . . . . . . . . . . . . . . . . . . . . . . . . . . . . . . 79
Table 17: PV (meq per Kg of oil) and TBARS (µmol malondialdehyde (MDA) per Kg of muscle) for herring minced stored at 5ºC and added 1000 mg/kg of SC, TSa, TSp brine or 125 mg per Kg salt (NaCl) and/or 600 mg per Kg bovine serum albumin (BSA). . . . . . . . . . . . . . . . . . . . . . . . . . . . .80
Table 18: Elements likely to change in the near future. . . . . . . . . . . . . . . . . . . . . . . . . . . . . . . . . . . . . . . . . . 89Table 19: Challenging elements if the technology is to be implemented . . . . . . . . . . . . . . . . . . . . . . . . . . . 91Table 20: Costs and benefits of the technology . . . . . . . . . . . . . . . . . . . . . . . . . . . . . . . . . . . . . . . . . . . . . . . 92Table 21: Prices of buffer tanks of different sizes, with or without cooling jacket . . . . . . . . . . . . . . . . . . . 93Table 22: Costs allocated to buying and operating a buffer tank . . . . . . . . . . . . . . . . . . . . . . . . . . . . . . . . . 93Table 23: Costs allocated to buying and operating a filtering unit . . . . . . . . . . . . . . . . . . . . . . . . . . . . . . . . 94Table 24: Costs allocated to buying and operating a flotation unit . . . . . . . . . . . . . . . . . . . . . . . . . . . . . . . 94Table 25: Maintenance costs . . . . . . . . . . . . . . . . . . . . . . . . . . . . . . . . . . . . . . . . . . . . . . . . . . . . . . . . . . . . . . 95Table 26: Value of protein and lipid per m3 for secondary herring producers . . . . . . . . . . . . . . . . . . . . . . 96Table 27: Value of protein and lipid per m3 for primary herring producers . . . . . . . . . . . . . . . . . . . . . . . . 96Table 28: Water prices in Denmark, Iceland, Norway and Sweden. . . . . . . . . . . . . . . . . . . . . . . . . . . . . . . 96Table 29: Possible savings because of reuse of water and no taxes for disposal. . . . . . . . . . . . . . . . . . . . . 97Table 30: Taxes for disposal of water in Denmark, Iceland, Norway and Sweden. . . . . . . . . . . . . . . . . . . 97Table 31: Possible savings because of reuse of water and no taxes for disposal. . . . . . . . . . . . . . . . . . . . . 97Table 32: Survey results for the intangible benefits . . . . . . . . . . . . . . . . . . . . . . . . . . . . . . . . . . . . . . . . . . . . 98Table 33: Costs and benefits for secondary producers . . . . . . . . . . . . . . . . . . . . . . . . . . . . . . . . . . . . . . . . . 99Table 34: NPV in 5 years for Secondary producers . . . . . . . . . . . . . . . . . . . . . . . . . . . . . . . . . . . . . . . . . . . . 99Table 35: Other benefits for secondary producers . . . . . . . . . . . . . . . . . . . . . . . . . . . . . . . . . . . . . . . . . . . . 100Table 36: NPV in 5 years for secondary producer, including tax and water reuse benefits . . . . . . . . . . 100Table 37: Costs and benefits for Option 1 primary producers. . . . . . . . . . . . . . . . . . . . . . . . . . . . . . . . . . . 102Table 38: NPV in 5 years for Option 1 for primary producers . . . . . . . . . . . . . . . . . . . . . . . . . . . . . . . . . . 102Table 39: Other benefits for option 1 for primary producers . . . . . . . . . . . . . . . . . . . . . . . . . . . . . . . . . . . 103Table 40: NPV in 5 years for option for primary producers including tax and water reuse benefits . . . 103Table 41: Costs and benefits for option 2 for primary producers . . . . . . . . . . . . . . . . . . . . . . . . . . . . . . . . 104Table 42: NPV in 5 years for option 2 for primary producers . . . . . . . . . . . . . . . . . . . . . . . . . . . . . . . . . . . 104Table 43: Other benefits for option 2 . . . . . . . . . . . . . . . . . . . . . . . . . . . . . . . . . . . . . . . . . . . . . . . . . . . . . . 105Table 44: NPV in 5 years for option 2 including tax and water reuse benefits . . . . . . . . . . . . . . . . . . . . . 105Table 45: Costs and benefits for Option 3 . . . . . . . . . . . . . . . . . . . . . . . . . . . . . . . . . . . . . . . . . . . . . . . . . . . 106Table 46: NPV in 5 years for Option 3 for primary producer . . . . . . . . . . . . . . . . . . . . . . . . . . . . . . . . . . . 107Table 47: Other benefits for Option 3 . . . . . . . . . . . . . . . . . . . . . . . . . . . . . . . . . . . . . . . . . . . . . . . . . . . . . . 107Table 48: NPV in 5 years for Option 3 including tax and water reuse benefits . . . . . . . . . . . . . . . . . . . . 108

16 PIPE
Preface & acknowledgments
PIPE would not have been possible without the commitment, enthusiasm and drive of all the people involved in the project; from the students and young scientist in DTU, Chalmers and University of Iceland to the companies involved with all their skilled people. We therefore thank you all very much for all the work you put into this project and we are extremely grateful. We have achieved a lot together, and this report is a demonstration of it! It should also be noted that this report is a compilation of several contributions and reports from all the work that has been done.
We also would like to thank Nordic Innovation for making this project possible and for showing great patience and understanding in situations when things did not work as planned; at the exciting interface between science and innovation. Lucky, however, there is more to it than just plan B. Special thanks to Elisabeth Smith for being so patient and helpful regarding all the administrative hurdles.
Finally, we hope that this work will inspire others, and that similar projects will follow because there is still a lot of work to do in this area. Beside the innovation and scientific achievement, we believe that PIPE also helped solving one of the biggest challenges our society is facing:
“Water and air, the two essential fluids on which all life depends, have become global garbage cans.”
- Jacques Yves Cousteau

17DISSEMINATIONS
Disseminations
Scientific publicationsOsman, A.; Gringer, N.; Svensson, T.; Yuan, LF.; Hosseini, S.V.; Baron, C.P.; Undeland, I.
Quantification of biomolecules in herring (Clupea harengus) industry process waters and their recovery using electroflocculation and ultrafiltration. Food and Bioproducts Processing. 2015, 96, 198–210.
Gringer, N.; Osman, A.; Nielsen, H.H.; Undeland, I.; Baron, C.P. Chemical characterization, antioxidant and enzymatic activity of brines from Scandinavian marinated Journal of Food Processing and Technology. 2014, 5:346. doi: 10.4172/2157-7110.1000346
Gringer, N.; Hosseini, S.V.; Svendsen, T.; Undeland, I.; Christensen, M.L.; Baron, C.P. Recovery of biomolecules from marinated herring (Clupea harengus) brine using ultrafiltration through ceramic membranes. LWT – Food Science and Technology. 2015, 63, 423-429
Gringer, N.; Safafar, H.; Mesnildot, A.d.; Nielsen, H.H.; Rogowska-Wrzesinska, A.; Undeland, I.; Baron, C.P. Fractionation and characterisation of peptides and phenolics isolated from marinated herring (Clupea harengus) brine. Food Chemistry, 2016, 194, 1164-1171
Muñoz, I.A.; Gringer, N.; Rico, D.; Baron, C.P. Salted herring brine as a coating or additive for herring (Clupea harengus) products – A source of natural antioxidants? J Sci Food Agric. Submitted.
Oral conference presentationsAli Osman, Maria Hedlund, Nina Gringer, Caroline P. Baron and Ingrid Undeland. Effluents
from the Marinated Herring Industry as Novel Sources of Omega-3 Fatty acids “Novel Sources of Omgea-3 for Food, Feed and Pharma” organized by Lipid forum and Eurofed Lipid, November 2012
Gringer N., Nielsen, H.H., Osman, A., Undeland, I., Baron C.P. Marine bioactive compounds in fish industries side streams. BIOPROSP 2013, 6th International Conference on Marine Bioprospecting, Tromsø - Norway, p58.
Gringer N. PIPE-Project, The Nordic Marine Innovation Conference 2013, Reykjavik, IcelandAli Osman, Nina Gringer, Caroline P. Baron and Ingrid Undeland. Effluents from the Marinated
Herring Industry: Characterization and Recovery of Biomolecules. WEFTA 2013, 43rd West European Fish Technologists Association meeting ‘’ Sea Food Innovation Throughout the Value Chain’’, Tromsø - Norway
Ingrid Undeland Adding value to seafood processing side streams –a step towards a circular economy EFFoST 2014 7th International conference on the Food Factory of the future, Uppsala Sweden

18 PIPE
Nina Gringer, Hamed Safafar, Henrik H. Nielsen, Adelina Rogowska-Wrzesinska, Ingrid Undeland, Caroline P. Baron Harvesting of low molecular weight biomolecules in salted herring (Clupea harengus) brine effluents Nutrama Conference 2015, Dublin.
Poster presentations at conferencesHedlund, M., Osman, A., Gringer N., Nielsen, H.H., Baron C.P., Undeland, I. Characterisation
of effluents from the marinated herring industry Part I: From boat to barrel. TAFT 2012, 4th Trans Atlantic Fisheries Technology Conference, Clearwater Beach USA, p68.
Gringer N., Nielsen, H.H., Hedlund, M., Osman, A., Undeland, I., Baron C.P. Characterisation of effluents from the marinated herring industry Part 2: From barrel to glass jar. TAFT 2012, 4th Trans Atlantic Fisheries Technology Conference, Clearwater Beach USA, p69.
Irene Albertos, Nina Gringer, Daniel Rico, Caroline P. Baron. Valorisation of brines from marinated herring industry and their potential use as a source of natural antioxidant in fish mince. WEFTA 2014, 44th meeting West European Fish Technologists Association meeting, Bilbao, Spain “Seafood science for a changing demand”
Seyed Vali Hosseini, Ali Osman , Nina Gringer, Tore Svendsen, , Caroline P. Baron, Ingrid Undeland. Recovery of Marine Proteins and Lipids from Herring (Clupea harengus) Processing Water Using Flotation with Microbubbles, Electroflocculation and Ultrafiltration. WEFTA 2014, 44th meeting West European Fish Technologists Association meeting, Bilbao, Spain “Seafood science for a changing demand”
Students projects, MSc and PhD thesisHedlund, M. Characterization and recovery of valuable compounds in effluents from the
marinated herring industry. MSc thesis, Chalmers University of Technology, June 2012.
Aagaard, S. Phenolic compounds and antioxidant activity in brine from spiced cured herring, BSc thesis, Technical University of Denmark, Denmark, Septemper 2014
du Mesnildot, A. Protein purification by FPLC and determination of phenolic content in herring brines, Individual course, Technical University of Denmark, Denmark, December 2014
Davault J. Functional properties of proteins in waste water of herring industry. Chalmers University of Technology, Göteborg, Sweden. 2013
Mounier, J. Functionalities of proteins contained in the waste water of marinated herring industries. Chalmers University of Technology, Göteborg, Sweden. 2013.
Eva Rós Brink, Carsten Østerberg, Caroline Baron, Gunnar Stefánsson, Guðrún Ólafsdóttir, PIPE: Market and Cost-Benefit Analysis, Faculty of Mechanical Engineering, Industrial Engineering and Computer Science, School of Engineering and Natural Sciences, University of Iceland, Iceland 2015.
Gringer N. Separation and characterisation of biomolecules in effluent from the herring industry. PhD thesis. Division of Industrial Food Research, National Food Institute, Technical University of Denmark, April 2015.

19DISSEMINATIONS
OthersUndeland, I. Att höja värdet på marina biprodukter -processvatten en underutnyttjad resurs!
Presentation at the Swedish Board of Agriculture “Marknadsrådet för Havs- och Sjömat”, Gothenburg, Sweden, Oct 5th, 2015.
Undeland, I. Value-adding of solid and liquid fish by-products -a glimps of projects from the last years. Presentation at the Workshop “Value Adding of Marine Raw Materials” organized within the Maritime Cluster of the Västra Götaland Region, Gothenburg, Sweden, Sept 25th, 2015.
Ali Osman, Maria Hedlund, Nina Gringer, Henrik Hauch Nielsen, Caroline P. Baron and Ingrid Undeland. How to add value to effluents from the marinated herring industry -the PIPE-project. Chalmers Sustainability Day.

20 PIPE
Executive summary
BackgroundVolumes of effluents from herring processing industries are important and their organic loads are high, which means that the cost imparted for their discharge is substantial. However, the original processing waters contain molecules with good market potential which are discarded as effluents. Most technological solutions available today do not fit the herring industries due to their poor flux and their poor chemical tolerance and also because they are not well suited for recovery and further valorisation of organic fractions. The vision with the PIPE project has been to test cutting edge technologies, and characterize as well as valorise the organic material collected from herring industries processing waters -before they become effluents- and thereby increase sustainability.
Target groupThe primary target group is the fish processing industry, but also users of marine proteins and marine lipids such as the food, feed and nutraceutical industries. Further, process equipment suppliers can benefit from our results in the sense that new applications for their techniques are opening up.
Project goalsThe project main goals are to solve the problem of high organic load effluents in the marinated herring industries by investigating environmentally friendly and cost effective technological solutions and to characterize and valorise the molecules obtained from the organic fractions recovered. The intermediate objectives are delineated in 4 work packages (WP)..
Project SummaryTechnological solutionsCeramic membranes and electrochemistry separation technologies, either alone or in combination, were tested on different process water streams generated during the production of marinated herring. Electrochemical flocculation (EF) and ultrafiltration (UF) using ceramic membranes (0.04 µm SiC membranes) in a crossflow setup, were applied on all types of process waters generated during production of marinated herring – refrigerated sea water (RSW), storage water (SW), processing water (PW), different salt brines (SB), and the final ripening brines (TSp, TSa, SC, VC). EF was used in a pre-filtration step and compared to polypropylene filtratation (PF) The tests were conducted batch wise on site at the herring producers on 100-1000L freshly collected process waters. The impact of consecutive EF-UF and PF-UF treatments were analysed, and the latter combination gave retentions of up to 42%

21EXECUTIVE SUMMARY
COD (chemical oxygen demand), more than 95% TSS (total suspended solids), more than 85% iron, up to 44% nitrogen, 100% fatty acids and more than 80% protein using the final ripening brines (TSp, TSa, SC, VC). For EF-UF treatment of SB effluents, retention of 70% COD and 79% protein was obtained, whereas UF alone only retained 67% COD and 36% protein. Thus ceramic UF has potential as a separation technology for the marinated herring process waters, although further investigations of pre-treatment technologies are needed to obtain a better flux
The project provided evidence for: • Applicability of the tested technology alone or in combination for separation and
recovery of organic material from herring industry processing waters
Characterization of Fractions The aim of WP2 was to quantitatively and qualitatively characterize the composition of the crude process waters and the fractions obtained after separation e.g. with UF. Analyses included: protein, fatty acids, free amino acids, dry matter, COD/BOD and trace elements. Waters characterized included refrigerated sea water (RSW), storage water (SW), processing water (PW), salt brines (SB), and in the final ripening brine (TSp, TSa, SC, VC). Results showed that large amounts of biomass are currently lost per tonne of processed herring; in the first steps (the boat step to barrel step) this loss represents approximately 10 kg proteins and 4 kg of fatty acids and in the second marination steps (i.e. from barrel to final glass jar) up to 110 kg protein and 40 kg fatty acids are lost. All in all, 7 m3 of water is consumed throughout the process per tonne of final product. An interesting notification in this project part was that the composition of the waters is highly dynamic, and depending on the time during which herring is incubated in the different waters; more biomolecules leach out. This leaching was also affected by the degree of tissue disintegration and the level of salt in the waters. As stated in the previous section, separation trials using UF resulted in outlet fractions containing low amounts of fat and proteins and could represent an alternative for recovery of biomass from process water, provided that an appropriate pre-treatment is used. The fractions recovered were rich in protein and fat and this technology could thus represent a new way of collecting fish biomass for further valorisation.
Project deliverables The project made it possible to:• Deliver data about process water quantities of lost biomass
• Deliver data on the quality and composition of the process water before/after fractionation.
Valorisation of process watersThis part of the project dealt with the evaluation and the valorisation potential of the crude and fractionated process waters and with propositions of new routes for valorisation. Process waters were tested for their antioxidant capacity in model systems using several in vitro antioxidant assays. Furthermore, a selection of functionality tests including emulsifying, and foaming properties, were also performed on some crude and fractionated waters. Outlets from UF were also considered for biotechnological applications e.g. growth media for microalgae. Foaming capacity, emulsion capacity and stability as well as antioxidant capacity of the

22 PIPE
fractions revealed good potential for valorisation. Separation technologies tested did not provide any changes regarding these properties. However, the brine tested without separation as glazing agent on fish seems feasible for preventing oxidation of both frozen and fresh herring. Preliminary investigation revealed that four microalgae strains were able to thrive in such growth media demonstrating the potential to use process waters within algae cultivation. The results from this WP generally showed that it is possible to find interesting valorisation routes for the herring process waters, sometimes even without the need of any pre-separation techniques.
Project deliverables • Document the added value of selected fractions in term of food/feed ingredients and
growth media for microbial cultivation.
• Provide preliminary routes for valorisation of new biomass recovered in the marinated herring industry
Market and Cost Benefit Analysis The cost of implementing ceramic membranes in fish processing companies was evaluated by performing a cost-benefit analysis. In addition, the market potential in the Nordic countries for both the technology and the fractions obtained was examined. The market analysis of the project was performed in two parts. The first one aimed to examine the market potential of the UF technology in fish processing companies in the Nordic countries while the second one aimed to examine the need for the fractions obtained in one of the leading suppliers of high performance fish feed for salmon and trout. The results of the market analysis showed that there is room for improvements in regards to wastewater treatment in the industry, as today only 3,7% of the participants are using advanced processes for wastewater treatment. The survey also showed that the demand for fractions similar to those expected to be obtained is growing and the commercial interest is real. Technology to use for adding value to process waters however needs to be well-functioning in order for the fractions obtained to have good market potential. The cost-benefit analysis showed that although implementing UF technology would in many cases be highly beneficial, the result might however turn out to be negative in a 5 years period for some smaller fish processing companies. However, for larger companies the implementation seemed favourable. Any technological solution to use for adding value to seafood process waters would however need to be well-functioning, which is however not the case today.
Project deliverables The project provided• A full cost benefit analysis for implementation of ceramic membrane as separation
technology.
• Evidence that a real market exist for fractions from fish processing water with high added values
The project “PIPE - Pelagic Industry Processing Effluents Innovative and Sustainable Solutions” delivers for the first time a comprehensive investigation regarding the implementation of new technology to recover and valorise the lost biomass from fish processing industry water and including a cost benefit analysis and a market survey.

23HERRING PRODUCTION
1. Herring Production
1.1. Herring processingAtlantic herring (Clupea harengus) is a small fatty pelagic fish (length 20 to 40 cm), widely distributed on both sides of the Atlantic Ocean (FAO, 1985). Out of the top 10 species contributing to the world catches, five of them are small pelagic fish species and the Atlantic herring (from now on referred to as herring) was one of these, which in 2004 yielded the fifth highest catch of all species (FAO, 2007). It is rich, for example, in n-3 long chain polyunsaturated fatty acids (LCPUFAs), vitamin D and high value protein, and its consumption is linked with improved health benefits (Lindqvist et al., 2007). Herring form large schools particularly during feeding and spawning periods. In 2009, 256,000 tons of herring were landed in the Northwest Atlantic (FAO Area 21) and 2,254,000 tons were landed in the Northeast Atlantic (FAO Area 27) of which most were fished in the Russian Federation, Norway, Iceland and the Faroe Islands (FAO, 2011).
In Northern Europe there is a long tradition of producing and consuming herring as a marinated product and it is one of the most important species in the fishing industry. In 2011/2012 approx. 1.000,000 tons of herring were landed in the Nordic Countries, when including the Baltic herrings with Norway being the largest catch with 633489 tonnes in 2012. Herring has always been of special interest in the Scandinavian countries and the production of salted herring (a traditional preservation process) has been carried out for centuries (Cutting, 1955), probably originating in the eight century (Voskresensky, 1965). First salting of fish has been developed as a way to preserve the fish whilst now it is engrained in Scandinavian cultures as a fish delicacy. The process has during the years not been changed very much but improved by the various countries that produce salted herring to address different markets. It has been automated to some extent whilst standardised recipes has been developed, giving salted herring with the desired salt content and taste. Today, the preservation of the herring is not the main purpose; instead the process is now carried out to obtain a well-ripened product with a tender consistency and a pleasant taste and odour (Stefánsson et al., 1995). The salting process results in considerable changes in the herring muscle during cold storage in salt and/or acid, and thus it can be considered to consist of two stages; salting and ripening. The salting stage includes an initial soaking of the fish in salt, which initiates the extraction of fluids from the fish and creates a natural brine (Vokresensky, 1965). Hereafter, saturated brine consisting of water and salt is added. When the salt concentration in the tissues equals that of the surrounding brine the ripening stage takes over. The ripening consists of both chemical and biochemical processes that change the characteristics of the fish tissues and thus the sensory properties of the final marinated fish product. In addition to the production of “old matured” marinated herring as described here, “fast maturated” and spice-marinated herring are common products with slightly different processing routes.

24 PIPE
Figure 1: Marinated herring processing steps from boat to jars.
Figure 1 illustrates different processing steps in the marinated herring production. After catch the herrings are stored on board into 1) refrigerated sea water (RSW) in which the herring is stored during transport and until landing. Then the herring is stored in 2) storage water (SW), in which the herring is kept after they have been sorted according to size using an automated process, subsequently the herring is processed into different cuts, e.g. a headed and gutted product, deskinned fillets, and bits of de-skinned fillets and 3) processing water (PW) is generated. Thereafter, the herring is placed into 4) a salt brine (SB) for a short time period until they are packed into barrels and stored for some time before they are further processed (Paul Mattsson, 2014). These steps represent the primary processing steps where Paul Mattsson AB operates. The barrels are subsequently shipped to different secondary processors that repacked the herring according to their own traditional recipes and may include sugar, spices, vinegar etc… The herring is allowed to ripe for several months and a ripening brine is formed (RB) before they are repacked in fresh brine before they are commercialized and found on the supermarket shelves.
From the primary producer the side streams generated in the production of marinated herring include: - RSW - SW - PW- SB which can differ depending on the cuts that are produced; i.e. with the degree of muscle exposure to the brine.
From the secondary producer brines are generated from the production of basic products which are either traditional barrel salted products, or fast processed vinegar cured products. They are:- Traditional barrel-salted herring brine (TSa) and its corresponding desalting brine (D-TSa)- Traditional barrel-salted spice-cured herring brine (TSp) and its corresponding desalting brine (D-TSp)

25HERRING PRODUCTION
- Spice-cured herring brine (SC) - Vinegar-cured herring brine (VC)
Figure 2 illustrates a production flow chart with the different brine generated in the production from primary to secondary producers.
Water in Process Water out
RSW → Landing of herring → RSW
Pri
mar
y pr
oduc
er
↓
Salt water → Sorting according to size and storage → SW
↓
Fresh water → Processing e.g. heading, gutting, filleting → PW
↓
Fresh salt brine → Short storage → SB
↓
Salt/sugar/spices → Ripening in barrels → TSp / TSa / VC / SC
Seco
ndar
y pr
oduc
er
↓↓
↓Fresh water → Desalting → D-TSp / D-TSa
Fresh sugar brine →
↓De-acidification → Sugar brine
↓
Cleaning water → Packaging → Packaging water
↓ ↓ ↓
End-products
Traditional barrel-salted herring (TSp /
TSa)
Vinegar-cured herring
(VC)
Spice-cured herring (SC)
Figure 2: Production flow chart with the different process waters and brines generated during marinated herring production; from primary to secondary producers.
The two traditional barrel-salted products (TSa and TSp) are produced by mixing 100 kg of whole-headed herring with 10 kg of salt in a 100 L plastic barrel. After 24 h, the barrels are filled with saturated salt brine and stored at 0-5ºC for ≥6 months. The herring is then filleted and the fillets placed back in the brine, which was created during the first half year, for additionally 6-18 month during which the barrels are transferred to the end-producer in Denmark. On costumers demand the barrels are emptied and approx. 35 L heavy loaded brine is discarded per 100 kg herring. The herring is then desalted in fresh water for 16-20 h, which creates approx. 70 L desalting brine (D-TSa and D-TSp) per 100 kg herring. The desalted herring fillets are packed with freshly prepared brine containing the desired combination of salt, sugar, spices and preservatives, closed and distributed to the consumers (Lykkeberg, 2014). The spice-cured (SC) and vinegar-cured (VC) herring are produced in a much faster manner, and consequently end up as cheaper products with a different characteristic texture compared to the traditional barrel-salted products. The herring is still caught and landed in Norway, Sweden, Iceland or Germany and pre-processed in these countries before being transported to the end-producer in Denmark. The fillets/bites are covered with brine containing salt, sugar and spices (SC) or salt and acetic acid (VC) and stored for a minimum of 42 and 35 days,

26 PIPE
respectively, however, often for a longer period. During packaging of the final SC product, approx. 40 L of heavy loaded spice brine is discarded and the fillets/bites are covered with fresh spice brine and distributed to the costumers. Before the VC fillets/bites are ready for packaging the herring is covered with sugar brine for 1-14 days to extract the heavy vinegar taste and to sweeten the product. Approx. 80 L of vinegar brine and 100 L of sugar brine are discarded per 100 kg herring (Lykkeberg, 2014).
Ripening is believed to be caused by enzymes, as the enzymes will break down macromolecules in the herring musculature creating e.g. peptides, amino acids and fatty acids, which will eventually change the texture of the fish (Nielsen, 1995a). The result of the ripening is consequently a soft and tender product with the pleasant taste associated with salted herring. During salting of fish, the protein undergoes a degradation process and, as a consequence, the concentration of protein in the brine increases during the marinating process (Andersen et al., 2007; Stefánsson et al., 1995). The degradation products found in the brine are soluble nitrogenous compounds like peptides, free amino acids and intact myofibrillar protein (Nielsen, 1995). Svensson and Andersen (2014) reported an increase in the protein content in herring salt brine to approx. 3 g/100 g after 60 days of storage, and from day 60 to day 277, an increase from 3 g/100 g to 5 g/100 g was observed. Moreover, they reported that the protein content still seemed to increase until the last day of sampling (day 277). Andersen et al. (2007) reported that the protein content in the brine of salted herring increased from around 1% at day 2 to 8% at day 371, with an initial fast increase up to day 100. Simultaneously, the protein content in the herring muscle decreased slowly from 18% to 14% in the same period, which means that protein and potentially bioactive compounds, such as peptides, are leaching from the fish to the brine. If acetic acid is also added to the brine the pH will decrease, and this causes protein denaturation and lower water absorption, and hence a lower product yield. During the normal biological cycle of herring, the content of fat and other components varies (Oterhals, 1995; Aro et al., 2000). The food industry takes advantage of this in the production of marinated, canned, frozen, smoked, and salted fish as the fat content differs in various seasons. The best products are obtained from herring salted during the feeding stage, which normally lasts for only a few months, when the endogenous proteolytic activity is high as well as the fat content. Nielsen et al. (2005a) reported the lipid contents in different catches during the seasons to be in the range from 1.3 to 25.7% and the variation within catches was found to be correspondingly high. They found a strong linear relationship between the lipid (L) and the water (W) content (L = -1.014 x W + 82.274, r2 = 0.928, P<0.001). It is generally recognised that the sum of water and lipids in the herring muscle is constant at 80%, as the amount of protein, minerals and fibres is constant (Vogt et al., 2002). However, the results reported by Nielsen et al. (2005a) showed that the sum increased as the lipid content increased. The water and lipid content have been reported to vary between 640 and 810 g/kg and 20 and 170 g/kg, respectively, and the herring caught in the North Sea in September were reported to have the highest lipid content, while the lipid content was lowest in herring caught in the North Sea during February (Nielsen et al., 2005b). The marinated herring industry is generating large amount of water at every step in their production which are expected to be rich in biomolecules of high market values and in high demand. Further characterisation and separation are needed in order to establish their market potential.

27WASTE WATER TREATMENT
2. Waste water treatment
Large quantities of both liquid and solid wastes are produced annually by the food processing industry. These waste materials contain principally biodegradable organic matter and disposal of them creates a significant potential to pollute both land, air, and water because of its high chemical oxygen demand (COD) (Hang, 2004). The COD is a measure of the amount of oxygen needed to chemically oxidise the wastes in a specific time and temperature, and the level can be as high as 90,000 mg/L or more, which is more than 100 times greater than common domestic sewage. The waste may also contain a moderately high salt or acidity level and might be contaminated with pathogens, but only rarely the food processing waste contains significant amounts of toxic chemicals (Hansen and Cheong, 2007). Thus, for many industries there is a need to treat the waste and wastewater in order to cope with specific guidelines and more stringent standards (provincial or local government). In the fish processing industry the wastewater generated should be treated through a good waste management and treatment technology prior to discharge (Chowdhury et al., 2010). The aim is to obtain a pollutant-free effluent, which could be either disposed of or recycled to the process, and a sludge, which could be turned into a value-added compound/product (Coca et al., 2011).
This chapter describes the technological solutions that were chosen in the PIPE-project in light of available technologies that have been tested in other food segments. However, generally, a lot of process steps are executed during food production, and treatment technologies are often conducted on a combined water stream collected at the “end of the pipe”. However, if the purpose of the treatment also is to recover valuable biomolecules, the applied technologies should be conducted on the process water generated from a single unit operation; before the point where it starts being treated as waste. In the PIPE project, the aim was to recover potential high value biomolecules, and as the different process waters were believed to have significantly different profiles, the tested methods were conducted on each collected type of water. Most of the process waters generated in marinated herring production are food-grade (e.g.. the brine generated during the ripening period), but some cannot be considered directly for consumption (e.g. the RSW). Food-grade quality refers to the minimum standard for substances to qualify as fit for human consumption, (FDA, 2014), and thus different treatment steps will be necessary to recover the biomolecules from the waters, and prepare them for use in food or nutraceuticals.
2.1. Treatment of food processing wastewaterThe treatment of waste water is usually described in terms of primary, secondary and tertiary treatment (Coca et al., 2011). As shown in Figure 3, a pre-treatment step is often included, before the primary treatment, in which the coarse particles are removed with a grid or a screening step. The primary treatment consists of physical separation steps, e.g. sedimentation, by which the suspended solids are allowed to settle. For oily wastewaters this first step is used to remove

28 PIPE
free oils from the emulsion or suspension and it is common to use techniques such as gravity and centrifugal separations. The secondary treatment is intended to reduce the organic load that remains after the primary treatment, by combining a biological treatment (anaerobic or aerobic) with a subsequent secondary sedimentation. In oily waste water, the aim is to break oil-in-water emulsions and to remove the dispersed oil, and chemical treatment, flotation, and membrane filtration (microfiltration, MF, and ultrafiltration, UF) are common techniques for this step. The tertiary treatment is a physicochemical process that reduces the levels of dissolved organic and inorganic compounds. The main treatments used are membranes (MF, UF, or reverse osmosis, RO), activated carbon adsorption and evaporation. For oily waste water these processes are used to remove finely dispersed, emulsified and soluble oil fractions (Coca et al., 2011; Bolzonella et al., 2007; Klemeš and Perry, 2007).
In the present work a sieve was used as a pre-treatment step to remove pieces of herring and scales left in the process waters before testing the selected technologies. We then applied one technology that can be regarded as a primary treatment technology; electro-flocculation, and one other; membrane filtration, which is categorised as a secondary treatment.
Although this work did not test any chemical or biological treatment methods, it should be noted that anaerobic treatment is a very often used and well suited technique for fish processing waste water, as a high degree of BOD5 (biological oxygen demand by microorganisms during the first 5 days of biodegradation at 20ºC (Coca et al., 2011)) removal can be achieved at a significantly lower cost than in comparable aerobic systems. In addition, smaller quantities of highly stabilised, and more easily dewatered, sludge will be generated and the methane-rich gas, which is produced, can be captured for use as a fuel (Chowdhury et al., 2010; Johns, 1995). Fish processing industries require large amounts of salt (NaCl) for fish conservation and the waste water generated is thus rich in salts together with protein-based nitrogen and organic matter. The presence of high sodium or chloride concentrations will in general inhibit the anaerobic treatment of waste water as well as methanogenesis (formation of methane by microbes) (Lefebvre and Moletta, 2006). However, the treatment of saline waste waters (1.5 to 15% w/v NaCl) in several industries has been demonstrated using anaerobic treatment, at least at the pilot scale (Xiao and Roberts, 2010).
Figure 3: Typical treatment process for wastewater from the food industry, with indication of the main purpose and main techniques used in the pre-, primary-, secondary- and tertiary treatments.

29WASTE WATER TREATMENT
2.2. Separation technologies Many of the techniques presented in Figure 3 are classified as separation techniques, in which the constituents of a mixture are separated according to differences in chemical or physical properties such as size, shape, mass, density, or chemical affinity between the constituents. Often one or more of the physical, thermal, chemical or electrical processes available are used alone or in combination (El-Mashad and Zhang, 2007). The following treatment of the waste water includes physical, chemical, and biological processes to remove contaminants. The overall aim of the separation and following treatment is to produce an environmentally safe fluid waste stream (treated effluent) and a solid waste (treated sludge) suitable for disposal or reuse, the latter usually as farm fertilizer (Chowhury et al., 2010).
Typical pollutant parameters, of importance to the food industry, are;Chemical oxygen demand (COD),Biological oxygen demand (BOD),Total suspended solids (TSS),Fats, oils and greases (FOG), as well as Nutrients, mainly nitrogen (N) and phosphorous (P).
Along with these parameters the levels of salt and chlorine, for example in the seafood industry, or protein produced as an example by the meat and dairy industries might also be important (Bolzonella et al., 2007). For the fish industry, indeed also the amount of recovered LC n-3 PUFA-rich fat is of great interest.
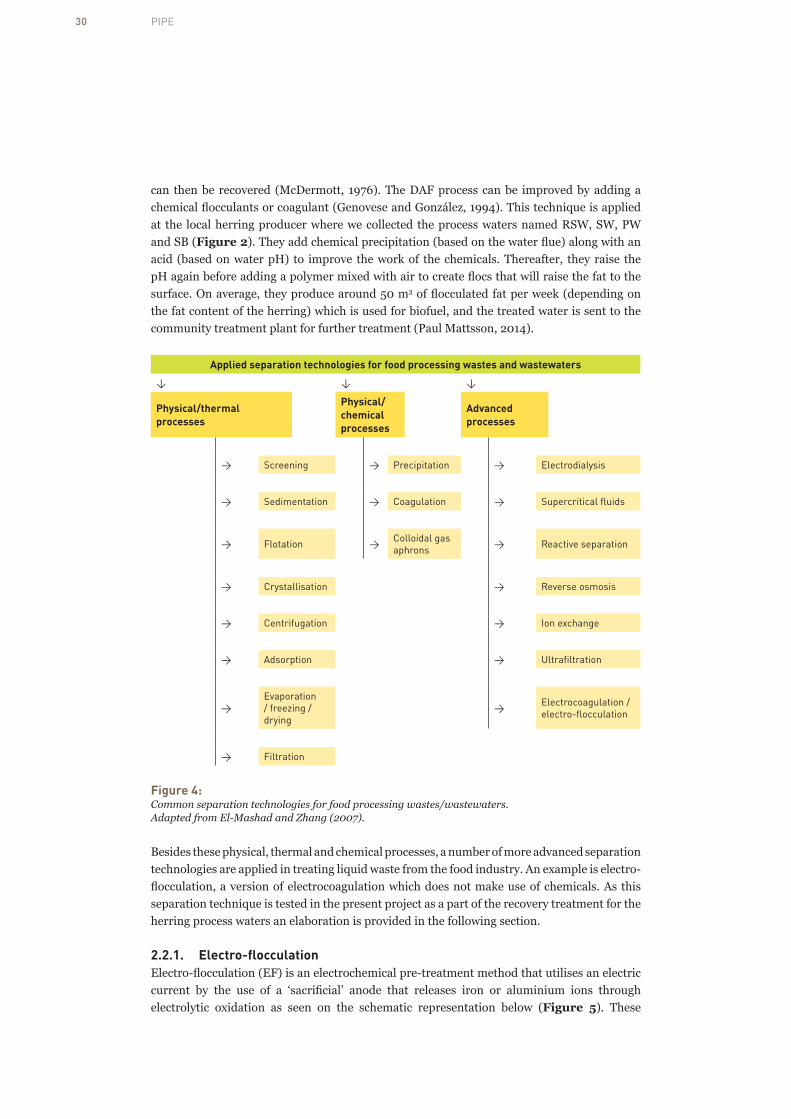
There are several opportunities of separation techniques for the waste water generated from the food industry. Figure 4 shows the selection of applied technologies (El-Mashad and Zhang, 2007) of which the major focus in the following sections will be on membrane separation processes (MSPs, such as ultrafiltration) and electro-flocculation as these are the tested methods in the work related to this project.
In general, the physical and thermal separation processes presented in Figure 4 are effective in reducing the organic load in the waste waters to levels suitable to discharge into public sewer systems. Some recovery of nutrients, either for recycling or as by-products, may be obtained, however, the selectivity necessary for producing pure products is usually not provided by these methods (El-Mashad and Zhang, 2007). These physical and thermal processes can either: (1) separate solids or suspended matter from a liquid by means of gravity or by the differences in gravitational forces; (2) promote the formation of solid particles or the adsorption of molecules from an aqueous solution or a gaseous phase onto a solid surface by means of intermolecular attractive forces; or (3) by thermally changing the stage of the molecules in the waste water, and hereby e.g. concentrate a particular molecule by evaporating the water. However, no chemicals are added to the water during these processes.
In contrast, the chemical separation processes uses chemicals to change the surface characteristics of suspended matter and hereby change the compounds from soluble to insoluble forms which enhances the separation. For instance, by adding a surfactant while applying intense stirring to the waste water, microbubbles are created which will be easy to separate from the bulk liquid phase because of its buoyancy (Sebba, 1987). An example of a well-known and well-used separation method is air flotation, especially dissolved air flotation (DAF) which is a liquid–solid separation process for liquid suspended colloidal mixtures. DAF involves the dissolution of air at a high pressure in the waste mixture to achieve saturation. By bringing the pressure of the mixture back to atmospheric, the air – in the form of very small bubbles – will rise to the product’s surface carrying with it the colloidal particles which
30 PIPE
can then be recovered (McDermott, 1976). The DAF process can be improved by adding a chemical flocculants or coagulant (Genovese and González, 1994). This technique is applied at the local herring producer where we collected the process waters named RSW, SW, PW and SB (Figure 2). They add chemical precipitation (based on the water flue) along with an acid (based on water pH) to improve the work of the chemicals. Thereafter, they raise the pH again before adding a polymer mixed with air to create flocs that will raise the fat to the surface. On average, they produce around 50 m3 of flocculated fat per week (depending on the fat content of the herring) which is used for biofuel, and the treated water is sent to the community treatment plant for further treatment (Paul Mattsson, 2014).
Applied separation technologies for food processing wastes and wastewaters
↓ ↓ ↓
Physical/thermal processes
Physical/chemical processes
Advanced processes
→ Screening → Precipitation → Electrodialysis
→ Sedimentation → Coagulation → Supercritical fluids
→ Flotation → Colloidal gas aphrons → Reactive separation
→ Crystallisation → Reverse osmosis
→ Centrifugation → Ion exchange
→ Adsorption → Ultrafiltration
→Evaporation / freezing / drying
→ Electrocoagulation / electro-flocculation
→ Filtration
Figure 4: Common separation technologies for food processing wastes/wastewaters. Adapted from El-Mashad and Zhang (2007).
Besides these physical, thermal and chemical processes, a number of more advanced separation technologies are applied in treating liquid waste from the food industry. An example is electro-flocculation, a version of electrocoagulation which does not make use of chemicals. As this separation technique is tested in the present project as a part of the recovery treatment for the herring process waters an elaboration is provided in the following section.
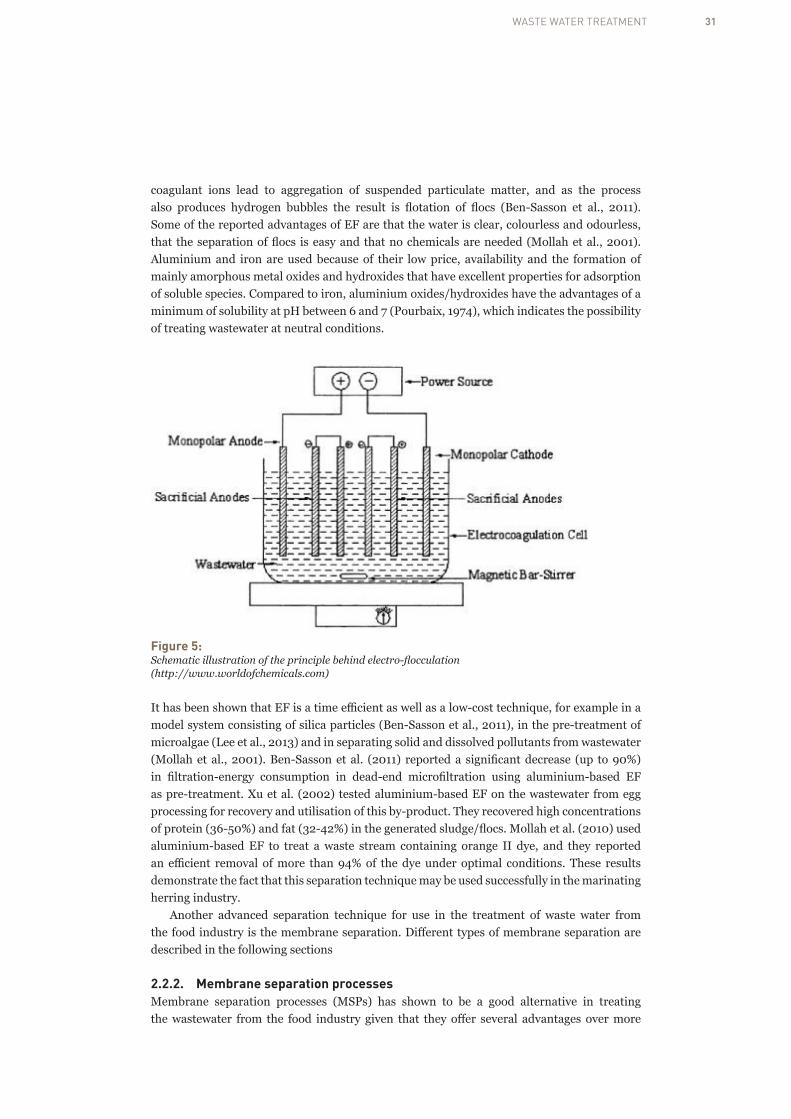
2.2.1. Electro-flocculation Electro-flocculation (EF) is an electrochemical pre-treatment method that utilises an electric current by the use of a ‘sacrificial’ anode that releases iron or aluminium ions through electrolytic oxidation as seen on the schematic representation below (Figure 5). These
31WASTE WATER TREATMENT
coagulant ions lead to aggregation of suspended particulate matter, and as the process also produces hydrogen bubbles the result is flotation of flocs (Ben-Sasson et al., 2011). Some of the reported advantages of EF are that the water is clear, colourless and odourless, that the separation of flocs is easy and that no chemicals are needed (Mollah et al., 2001). Aluminium and iron are used because of their low price, availability and the formation of mainly amorphous metal oxides and hydroxides that have excellent properties for adsorption of soluble species. Compared to iron, aluminium oxides/hydroxides have the advantages of a minimum of solubility at pH between 6 and 7 (Pourbaix, 1974), which indicates the possibility of treating wastewater at neutral conditions.
Figure 5: Schematic illustration of the principle behind electro-flocculation (http://www.worldofchemicals.com)
It has been shown that EF is a time efficient as well as a low-cost technique, for example in a model system consisting of silica particles (Ben-Sasson et al., 2011), in the pre-treatment of microalgae (Lee et al., 2013) and in separating solid and dissolved pollutants from wastewater (Mollah et al., 2001). Ben-Sasson et al. (2011) reported a significant decrease (up to 90%) in filtration-energy consumption in dead-end microfiltration using aluminium-based EF as pre-treatment. Xu et al. (2002) tested aluminium-based EF on the wastewater from egg processing for recovery and utilisation of this by-product. They recovered high concentrations of protein (36-50%) and fat (32-42%) in the generated sludge/flocs. Mollah et al. (2010) used aluminium-based EF to treat a waste stream containing orange II dye, and they reported an efficient removal of more than 94% of the dye under optimal conditions. These results demonstrate the fact that this separation technique may be used successfully in the marinating herring industry.
Another advanced separation technique for use in the treatment of waste water from the food industry is the membrane separation. Different types of membrane separation are described in the following sections
2.2.2. Membrane separation processes Membrane separation processes (MSPs) has shown to be a good alternative in treating the wastewater from the food industry given that they offer several advantages over more

32 PIPE
traditional separation processes, such as distillation, crystallization, solvent extraction, etc. Membranes are special devices typically made up of synthetic polymers or inorganic material that creates a barrier which can separate a liquid from a solid stream. They are characterised by their different composition and pore sizes. Generally, they are divided in four sizes; microfiltration (MF), ultrafiltration (UF), nanofiltration (NF) and reverse osmosis (RO). As illustrated in Figure 6 there is no defined transition between the pore sizes, however, it is generally recognised that MF have pore sizes of 0.1-10 µm, UF have pore sizes of 0.01-0.1 µm, NF have pore sizes of 0.001-0.01 µm, and RO have pore sizes less than 0.001 µm (Bolzonella et al., 2007; Coca, 2011). Wastewater treatment in the food industry is commonly carried out by MF and UF, however, if salinity is excessive RO may be of interest (Ditgens, 2007).
Figure 6: Approx. molecular weight (MW in Da) cut-off values (in microns, µm) of membranes used in separation processes with examples of relative size of common materials.
There are several types of membranes that can be used. The tubular membranes have been around for a long time and they have a simple design. The main advantages with these membranes are that they can tolerate suspended solids and most notoriously fibres to a very high extent. On the other hand, the disadvantages are that they require a lot of space and energy and changing the membrane may both be difficult and time consuming (Wagner, 2001). Additionally, the trans-membrane pressure (TMP) is the driving force for permeation, and the flux will increase with pressure up to a limiting value depending on the physical properties of the feed to be filtered and the cross-flow velocity. Hence one of the main problems with the membranes is the flux decrease. This decrease is caused by concentration polarisation (CP) and fouling, which are characterised by the unwanted accumulation of material on membrane surfaces and encompass adsorption, gel layer formation, pore blocking, and other processes. The CP results in a rapid drop in flux while the fouling causes a gradual, long-term decay and thus it is common to state the initial flux after a few minutes of filtration (Figure 7). An important role in the fouling of membranes is the surface chemical phenomena and this can either be reversible or irreversible. Reversible fouling is mainly caused by solid deposition on

33WASTE WATER TREATMENT
the membrane surface and can typically be removed by intermittent hydraulic back flush. The irreversible fouling, however, requires a chemical cleaning which limits the practicability of e.g. UF as a wastewater treatment process (Jönsson and Trägårdh, 1990; Cassini et al., 2011).
Figure 7: Flux (L/m2h) decline is caused by concentration polarisation (CP) and fouling. The pure water flux is indicated by (•).Adapted from Jönsson and Trägårdh (1990).
It is common to express the efficiency of a membrane by determining the percentagewise rejection, R, of a given compound. This is done by measuring the concentration of the component in the permeate and the inlet water and calculate the ratio between these (Afonso and Bórquez, 2002):
2. WASTE WATER TREATMENT
26
and thus it is common to state the initial flux after a few minutes of filtration (Figure 7). An important role in the fouling of membranes is the surface chemical phenomena and this can either be reversible or irreversible. Reversible fouling is mainly caused by solid deposition on the membrane surface and can typically be removed by intermittent hydraulic back flush. The irreversible fouling, however, requires a chemical cleaning which limits the practicability of e.g. UF as a wastewater treatment process (Jönsson and Trägårdh, 1990; Cassini et al., 2011).
Figure 7: Flux (L/m2h) decline is caused by concentration polarisation (CP) and fouling. The pure water flux is indicated by (•).
Adapted from Jönsson and Trägårdh (1990).
It is common to express the efficiency of a membrane by determining the percentagewise rejection, R, of a given compound. This is done by measuring the concentration of the component in the permeate and the inlet water and calculate the ratio between these (Afonso and Bórquez, 2002):
R = 1 − C'()*(+,(C-((.∙ 100%
Retention of 100% thus means that the generated permeate is completely free from the compound of interest. Depending on the size of the molecules that is of interest the size of pores in the membrane (MF, UF, NF or RO) is chosen, (Figure 8). The four filtration types, MF, UF, NF and RO, are each briefly described in the following sections.
Retention of 100% thus means that the generated permeate is completely free from the compound of interest. Depending on the size of the molecules that is of interest the size of pores in the membrane (MF, UF, NF or RO) is chosen, (Figure 8). The four filtration types, MF, UF, NF and RO, are each briefly described in the following sections.
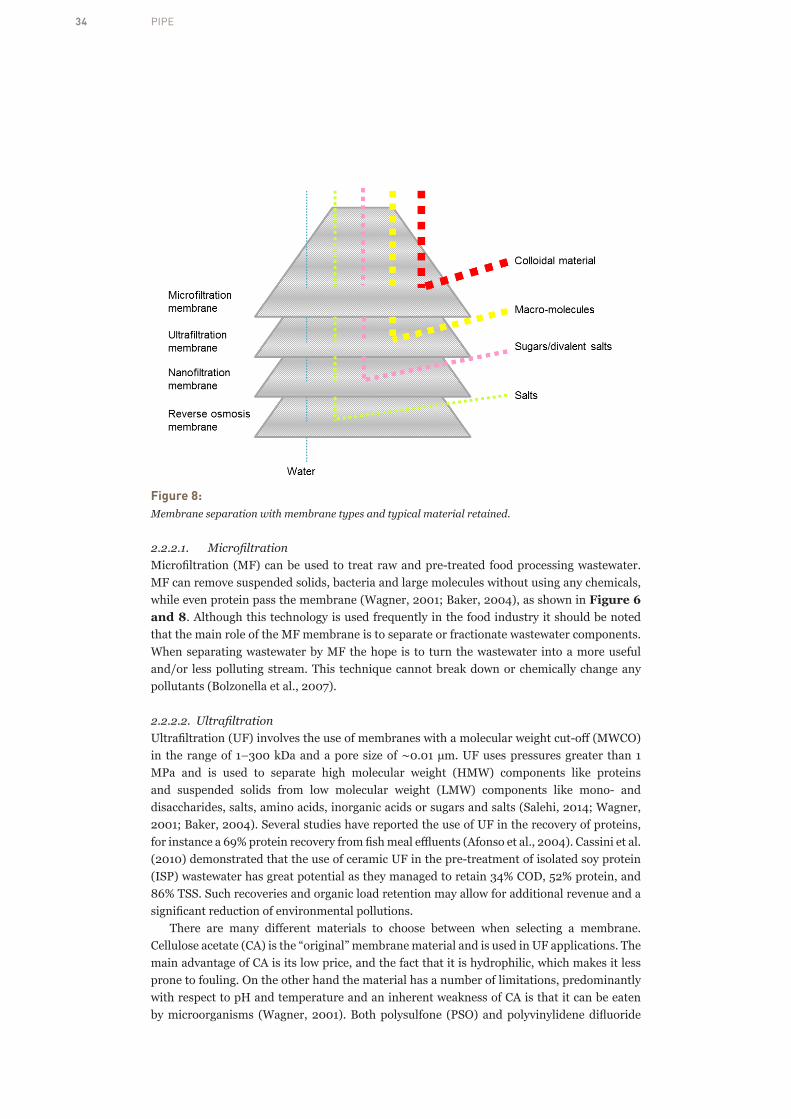
34 PIPE
2. WASTE WATER TREATMENT
27
Figure 8: Membrane separation with membrane types and typical material retained.
.
2.2.2.1 Microfiltration Microfiltration (MF) can be used to treat raw and pre-treated food processing wastewater. MF can remove suspended solids, bacteria and large molecules without using any chemicals, while even protein pass the membrane (Wagner, 2001; Baker, 2004), as shown in Figure 6 and 8. Although this technology is used frequently in the food industry it should be noted that the main role of the MF membrane is to separate or fractionate wastewater components. When separating wastewater by MF the hope is to turn the wastewater into a more useful and/or less polluting stream. This technique cannot break down or chemically change any pollutants (Bolzonella et al., 2007).
2.2.2.2 Ultrafiltration Ultrafiltration (UF) involves the use of membranes with a molecular weight cut-off (MWCO) in the range of 1–300 kDa and a pore size of ∼0.01 µm. UF uses pressures greater than 1 MPa and is used to separate high molecular weight (HMW) components like proteins and suspended solids from low molecular weight (LMW) components like mono- and disaccharides, salts, amino acids, inorganic acids or sugars and salts (Salehi, 2014; Wagner, 2001; Baker, 2004). Several studies have reported the use of UF in the recovery of proteins, for instance a 69% protein recovery from fish meal effluents (Afonso et al., 2004). Cassini et al. (2010) demonstrated that the use of ceramic UF in the pre-treatment of isolated soy protein (ISP) wastewater has great potential as they managed to retain 34% COD, 52% protein, and 86% TSS. Such recoveries and organic load retention may allow for additional revenue and a significant reduction of environmental pollutions. There are many different materials to choose between when selecting a membrane. Cellulose acetate (CA) is the “original” membrane material and is used in UF applications. The main advantage of CA is its low price, and the fact that it is hydrophilic, which makes it less prone to fouling. On the other hand the material has a number of limitations, predominantly with respect to pH and temperature and an inherent weakness of CA is that it can be eaten by microorganisms (Wagner, 2001). Both polysulfone (PSO) and polyvinylidene difluoride (PVDF) are
Figure 8: Membrane separation with membrane types and typical material retained.
2.2.2.1. Microfiltration Microfiltration (MF) can be used to treat raw and pre-treated food processing wastewater. MF can remove suspended solids, bacteria and large molecules without using any chemicals, while even protein pass the membrane (Wagner, 2001; Baker, 2004), as shown in Figure 6 and 8. Although this technology is used frequently in the food industry it should be noted that the main role of the MF membrane is to separate or fractionate wastewater components. When separating wastewater by MF the hope is to turn the wastewater into a more useful and/or less polluting stream. This technique cannot break down or chemically change any pollutants (Bolzonella et al., 2007).
2.2.2.2. Ultrafiltration Ultrafiltration (UF) involves the use of membranes with a molecular weight cut-off (MWCO) in the range of 1–300 kDa and a pore size of ∼0.01 µm. UF uses pressures greater than 1 MPa and is used to separate high molecular weight (HMW) components like proteins and suspended solids from low molecular weight (LMW) components like mono- and disaccharides, salts, amino acids, inorganic acids or sugars and salts (Salehi, 2014; Wagner, 2001; Baker, 2004). Several studies have reported the use of UF in the recovery of proteins, for instance a 69% protein recovery from fish meal effluents (Afonso et al., 2004). Cassini et al. (2010) demonstrated that the use of ceramic UF in the pre-treatment of isolated soy protein (ISP) wastewater has great potential as they managed to retain 34% COD, 52% protein, and 86% TSS. Such recoveries and organic load retention may allow for additional revenue and a significant reduction of environmental pollutions.
There are many different materials to choose between when selecting a membrane. Cellulose acetate (CA) is the “original” membrane material and is used in UF applications. The main advantage of CA is its low price, and the fact that it is hydrophilic, which makes it less prone to fouling. On the other hand the material has a number of limitations, predominantly with respect to pH and temperature and an inherent weakness of CA is that it can be eaten by microorganisms (Wagner, 2001). Both polysulfone (PSO) and polyvinylidene difluoride

35WASTE WATER TREATMENT
(PVDF) are used in UF and MF applications. PSO is practically the only membrane material used in high quantity for a number of food and dairy applications, and this might be due to its exceptional temperature and pH resistance.
As a rule, PSO membranes do not tolerate fat, oil, grease and polar solvents, and it has a tendency to become brittle. PVDF is an excellent but rather expensive material. PSO membranes have good heat stability and are almost as chemically resistant as PP which is used in MF applications. PP is chemically a very resistant polymer; however, the temperature stability is limited, and it has a tendency to creep (Wagner, 2001).
Inorganic membranes show a high chemical resistance, which is an extremely important parameter during the washing cycles, considering the likelihood of chemical and biological fouling that can take place. Interactions between protein molecules and the membrane surface and inner pores may occur, resulting in pore blocking, surface deposits and/or gel layer formation on the top layer, and this will in turn increase the filtration resistance. Still, these interactions are expected to be weaker in inorganic membranes than in organic ones (Afonso and Bórquez, 2002). Also, it is widely acknowledged that hydrophobic membranes have a higher tendency to foul than hydrophilic membranes (Salehi, 2014). The very hydrophilic ceramic membranes can, theoretically, be very effective for MSPs, yet they are extremely expensive.
Although an expensive material, the ceramic membranes made from SiC were pre-selected to be tested in the present project, Figure 9. These membranes have recently been certified for use in the food industry, and according to the manufacturer they are extremely hydrophilic, thus very efficient in oil/water separation. Besides this, they are chemically inert and tolerate high salt content and temperature (LiqTech, 2014). Compared with polymeric membranes, ceramic membranes have higher thermal, mechanical and chemical resistance, and when made out of SiC they are extremely stable in harsh conditions for which reason they can withstand repeated aggressive cleaning, steam sterilisation and autoclaving (Zhou et al., 2011; Ciora et al., 2004). As a result, SiC would be well suited for use in food processing such as the herring industry. In a resend study, Hofs et al. (2011) compared the permeability and fouling of four ceramic membranes (Al2O3, ZrO2, TiO2, SiC) with a polymeric one (polyethersulfone (PES) and polyvinyl-pyrollidone (PVP) blend), and found that the TMP increased due to fouling; the reversible fouling decreased in the order of polymeric ≈ Al2O3 ≈ ZrO2 > TiO2 > SiC, and for irreversible fouling polymeric > ZrO2 > Al2O3 > TiO2 > SiC. Thus the SiC membrane was less prone to fouling than the other materials tested. However, it should be noted that the authors also measured the pore size and found that in general the fouling decreased as the pore size increased, which in the case of TiO2 and SiC were 5 and 24 times larger than stated by the suppliers, respectively.
a b
Retentate
Figure 9: a) Silicon carbide membranes used in the present work and b) the principle of cross flow filtration.

36 PIPE
The membranes are also used in a cross flow set up (also called tangential flow filtration) allowing better performance. The feed is passed across the surface of the filter membrane and the permeate passing through the filter membrane is collected. The remaining feed is known as the retentive. The advantage of cross flow filtration compared to traditional dead end filtration is that is allows a recirculation of the feed in a close loop and the retentate can be directly collected. The feed is pumped and the velocity at which it is moving across the membrane can be optimised in order to prevent membrane fouling. As presented, a variety of separation and treatment methods are available for the waste water generated from the food processing industry. In the next section some of the applied techniques are presented, with focus on separation methods mainly intended for recovery.
2.3. Applied separation and recovery techniques in the food industry
Depending on the main purpose; treatment according solely to environmental considerations or recovery of specific components to create an added value, some techniques are more convenient than others. In Table 1 a selection of the currently applied techniques for recovery of (mainly) protein from process water in the food industry are presented.
Many of the techniques shown in Table 1 are membrane technologies, which have a great potential for the separation (e.g. concentration, fractionation, and purification) of several types of process waters. For example, Cassano et al. (2013) studied the combination of two UF processes followed by a NF treatment on olive mill waste water in order to fractionate and thereby separate organic substances of different molecular weights within this waste water. They obtained three different fractions; (1) a concentrated solution containing organic substances at high molecular weight (retentate of both UF processes), which could be submitted to an anaerobic digestion for the production of biogas; (2) a concentrated solution (NF retentate) enriched in polyphenolic compounds suitable for cosmetic, food and pharmaceutical industries as liquid, frozen, dried or lyophilized formulations; and (3) a water stream (NF permeate) suitable for reuse in e.g. the olive oil extraction process as process water or in the integrated membrane system as membrane cleaning solution.
In another study, Cassini et al. (2010) demonstrated that the use of UF membranes, in the pre-treatment of ISP process water, was very promising for organic load reduction and protein content removal. By use of a ceramic monotubular membrane they were able to recover the very small molecules (8–50 kDa) that were not removed during the production process. This was believed by the authors to possibly result in a large productive and financial advantage for the respective industry. Of the three pore sizes tested, the smallest, a 5 kDa membrane, gave the best results and showed the least reduction in permeate flux over time (indicating a lower occurrence of CP and fouling phenomena) and the highest retention percentages: 34% COD, 52% protein, and 86% TSS.
Magueijo et al. (2005) have used NF membranes for the recovery of cheese whey organic nutrients, resulting from “Serpa” cheese and curd production. A rich lactose fraction was recovered from the cheese whey through NF and the permeate fraction was mainly process water and salt. The water recovery was approximately 80% thus concentrating the cheese whey nutrients five times. NF has also been used to meet the growing demand for low-alcohol and alcohol-free beer, and 8-10 times reduction in the alcohol concentration, while retaining the beer flavour, have been reported (Salehi, 2014).

37WASTE WATER TREATMENT
Table 1: Applied separation and treatment techniques for process water in the food industry.
Method Product Main purpose Reference
MF +UF Fish meal Recovery and concentration of protein
Afonso et al., 2004
UF Fish brineFish mealSoy proteinSurimiFish
Recovery and fractionation
Recovery and concentration of protein
Concentration of protein and lipids
Paulson et al., 1984Afonso and Bórquez, 2002Cassini et al., 2011; Cassini et al., 2010 Miyata, 1984; Dumay et al., 2008Mameri et al.,1996
UF + NF Olive mill Purification of bioactive compounds and reuse of water
Cassano et al., 2013
NF Low-alcohol beerCheese whey
Reduction of alcohol % Recovery of lactose
Salehi, 2014, Magueijo et al., 2005
RO-NF Fruit juice Improve the concentration step Nabetani, 1996
RO Fish meal Pre-concentration of solids Matthiasson and Sivik, 1978
Electro-osmosis Apple pomace, and vegetable
Dewatering the waste to increase the solid content
Orsat, 1996
Foam separation Soy whey Recovery of protein Wang et al., 2013
Two-stage foam separation Whey Recovery of protein Jiang et al., 2011
Microscreen unit + sequencing batch reactor
Swine manure and fish cannery
Cleaning of the wastewater Fernandes et al., 1991
Solid phase extraction Beer Purification of bioactive compounds Barbosa-Pereira et al. 2013
Decanter + anaerobic & aerobic treatment
Tuna Treatment of wastewater Afonso et al., 2000
Microalgae-containing microbiota
Rainbow trout Treatment of wastewater Riaño et al., 2011
Deammonification and anaerobic carbon removal
Fish Energy-efficient treatment of wastewater
Trautmann et al., 2011
Evaporation + biological treatment
Olive oil Separation and concentration Vitolo et al., 1999
In the concentration of whey a coupling of UF and RO have been extensively used and have allowed for the development of a broad array of whey protein concentrates (WPC). Among the promising applications for MSPs in whey processing are those aimed at increasing the protein content of WPC, fractionating whey protein, and improving the specific functional properties of whey protein (Rosenberg, 1995). As well as in the whey protein industry the MSPs in the fish industry are often applied both for adding value of by- and co-products, and for the treatment of process water. By applying the MSPs, potential added value is recovered along with an effluent clean-up, which could help solving the environmental problems by complying with the increasingly strict legislation worldwide concerning industrial pollution (Afonso & Bórquez, 2002).
In this project the tested separation techniques were applied on process water generated from the herring industry. The potential in separating fish process water to recover both protein and lipids are not entirely new. However, to our knowledge the work regarding waters generated during the marinated herring processing are far from extensively investigated. As an example of a related study, Afonso et al. (2004) studied an integrated process of MF pre-treatment followed by UF and concluded that this is a promising technique for the recovery and concentration of protein from fish meal effluents as they were able to recover 69% of the

38 PIPE
protein. Such recoveries allows for a revenue rise and a significant reduction of environmental pollutions. Matthiasson and Sivik (1978) have shown the use of a RO membrane in the application of treating the water from fish filleting machines, and the concentrate generated could then be applied in e.g. soups, while the permeate could be reused in the process. UF has also been used for the separation and concentration of water-soluble protein from waste water from fish processing plants. For instance, Miyata (1984) showed that about 90% of the protein from the feed could be concentrated with a tubular cellulose acetate membrane. However, in contrast to these promising results Afonso and Bórquez (2002) concluded that the protein rejection (3-39%) they obtained with a mono-tubular mineral UF membrane of 15 kDa MWCO was insufficient compared to their goal; environmental pollution abatement and recycling of water and protein from the fish meal industry.
In a study by Dumay et al. (2008), four membrane materials (PSO, PVDF, polyacrylonitrile (PAN), and regenerated cellulose) at five different MWCOs (ranging from 3 to 100 kDa) were tested in the treatment of washing waters from surimi manufacturing. The results showed that UF, especially with a 10 kDa regenerated cellulose membrane, seemed to be an appropriate technology for the recovery of protein and lipids from sardine surimi wash water with a reduction of COD by a factor of four. These results confirmed those obtained by Mameri et al. (1996) where UF reduced the level of BOD5 by about 80% for fishery washing water. In general, the amounts of fish processing water ending up as waste are high in biomolecules which mainly consist of protein and lipids (Palenzuela-Rollon et al., 2002), and thus testing different combinations of separation techniques for these waters to recover the protein, lipids and other potential bioactive compounds are of high interest for the fish industry. By proper treatment, the fish industry could create revenue on the recovered molecules along with lowering the expenses for discarding the polluted waste water.
Several methods are available for separation of biomolecules present in fish processing water, however the challenge is to have a method that allow not only separation but also recovery of the biomolecules present without compromising their quality. Furthermore, valorisation of the fraction may be possible and the collected fraction may generate revenues.

39VALORISATION OF MARINE BIOMASS
3. Valorisation of marine biomass
3.1. Bioactives compoundsBioactive compounds cover a variety of molecules; proteins, peptides, several amino acids, fatty acids as well as a large number of phenolic-based compounds (Karel et al., 1966). During the processing of food, vast amounts of both solid and liquid waste are generated and whenever these wastes contain bioactive compounds, strategies for recovery and utilisation should be considered. This chapter present the bioactive compounds that can be present in liquid waste from the fish industry, and thus the bioactive compounds which could be expected to be present in the brines generated during the production of marinated herring products.
Today, considerable amounts of protein-rich by- and co-products from the seafood industry are discarded, or processed into fish oil, fish meal, fertilizer, pet food and fish silage (Penven et al., 2013). These generated by-products in some cases create a cost burden for the seafood industry in terms of waste disposal and only minor incomes are generated, as these recycled products possess low economic value. The still growing demand for a sustainable use of fish protein co-products (FPCP) has led to the development of processes for the recovery and hydrolysis of fish protein, the assessment of their functionalities, and application into different products (He et al., 2013). Studies from the past 10 years have identified a number of bioactive compounds from residual fish muscle protein, fish oil, fish bone, internal organs and shellfish and crustacean shells (Je et al., 2005a; Kim et al., 2001), and generally, a far better profitability is obtained by producing human consumables. The highest profitability is expected from bioactive compounds such as functional foods or nutraceuticals (Kim and Mendis, 2006).
Functional foods might be defined as “those foods or ingredients that when consumed regularly produce a specific beneficial health effect beyond their basic nutritional properties” (Gil-Chávez et al., 2013). Normally, these foods contain different amounts and types of bioactive compounds (Roberfroid 2002; Nobili et al., 2009; Bernal et al., 2011) and before the product can be called a functional food, the claimed health benefit for the human organism has to be demonstrated. Examples of beneficial effects of bioactive compounds are: decrease in cholesterol levels, alleviation of lactose intolerance, maintaining remission of Crohn’s disease, faster relief from diarrhea, and inhibition of cancer cell proliferation in vivo and in vitro (Hekmat et al., 2009; Nobili et al., 2009; Marette et al., 2010).
Nutraceuticals, on the other hand, might be defined as “dietary supplements that deliver a concentrated form of bioactive compounds from food, present in a non-food matrix, and used with the purpose of enhancing health in dosages that exceed those that could be obtained from normal foods” (Shahidi, 2009). They are normally consumed in pharmaceutical presentations such as pills, capsules, tablets, powders or vials (Espín et al., 2007). They are usually isolated or synthesised from pure chemicals from natural sources and their efficiency have to be clinically proved to prevent or cure the target disease.

40 PIPE
No matter if the bioactive compound is intended for use as a functional food ingredient, a new food product or as a nutraceutical, the activity must be described/defined and tested. Today, the primary used sources of bioactive peptides originate from dairy products. However, the marine environment represents a number of protein resources including algae by-products and FPCP, and the environment in which they are found makes these resources a new and relatively untapped source for bioactive compounds (Rustad and Hayes, 2012). Furthermore, the fat content in fish which in general vary from 2– 30%, depending on the type of species, dietary, geographic, environmental, reproductive and seasonal variations, is mainly composed of two types of fatty acids; eicosapentaenoic acid (EPA) and docosahexaenoic acid (DHA). Both EPA and DHA are LC n-3 PUFAs (Kim and Mendis, 2006), which are known for their prevention from atherosclerosis (von Schacky, 2000), reduction of blood pressure (Appel et al., 1993), benefit for diabetic patients (Sheehan et al., 1997), among many suggested nutraceutical potentials. Apart from proteins/peptides and the high-quality fat, fish contains minerals, vitamins and antioxidants that are also believed to impact human health (Simopoulos, 1997; Elvevoll and Österud, 2003), and several of these molecules share the common property of interfering with the lipid oxidation in some way.
3.2. Fish protein hydrolysates Currently, fish protein hydrolysates (FPH) are considered the most important source of protein and bioactive peptides. Some studies have reported the use and application of protein hydrolysates in human nutrition (Clemente, 2000; Neklyudov et al., 2000) while others have reported the biological activity of various FPH in vivo and in vitro by means of their bioactive peptides (Duarte et al., 2006; Je et al., 2004; Liaset et al., 2009). FPH are usually produced by adding commercial available enzymes which degrade the fish protein.
During the production of marinated herring, it has been shown that proteases from the herring intestine and muscle tissue participate in the proteolytic degradation of the muscle protein (Nielsen, 1995; Stefánsson et al., 2000). This enzyme activity leads to an increase in soluble nitrogenous compounds, such as peptides and amino acids (Nielsen, 1995; Nielsen and Børresen, 1997), and thus it is the herring’s own enzymes from the viscera that cause an increase in LMW compounds in the fillet, which is believed to influence the final sensory characteristics of the product (Nielsen, 1995). Furthermore, the brines generated during the long ripening period might possess an important source of protein and bioactive peptides as the FPH. Moreover, there is a possibility that the enzymatic activity is still present in the brine after the marinating process is completed, thus these enzymes could as well be regarded as a valuable product.
The functional properties of FPH may be improved by the use of specific enzymes and by choosing a defined set of hydrolysis conditions, such as time, pH, and temperature (Hall and Ahmad, 1992). Liceaga-Gesualdo and Li-Chan (1999) found that by using a commercial endopeptidase preparation, Alcalase, they were able to easily transform underutilised herring into FPH. The functionality tests conducted on the FPH indicated that the emulsion stability was improved in the hydrolysate as compared to the unhydrolysed herring. As for the foamability, the hydrolysate provided a higher foam expansion; however, it was unable to maintain foam stability over time.
In a study by Sathivel et al. (2003), the functional, nutritional, and antioxidative properties of hydrolysed whole herring and herring by-products (body, head and gonad) were evaluated. They concluded that the antioxidative activity of whole herring FPH was highest (about half of the activity of butylated hydroyanisole (BHA) and butylated hydroxytoluene (BHT)), followed by that of body, gonad, and head. Furthermore, the whole herring FPH contained 84.4% protein and all of the herring protein hydrolysates were reported to meet or exceed

41VALORISATION OF MARINE BIOMASS
the essential amino acid requirements for adult humans, hence this study demonstrated that FPH derived from herring or its by-products may serve as a good source of desirable quality peptides and amino acids. Besides the antioxidative activity and the high protein content, the herring FPHs also had desirable colour, solubility, fat absorption, and emulsification stability.
Antioxidant activity has been reported for FPH from various fish protein sources such as tuna cooking juice (Hsu et al., 2009), yellowfin sole frame (Jun et al., 2004), Alaska pollack frame (Je et al., 2005b), and pacific hake muscle (Samaranayaka and Li-Chan, 2008). In Table 2 some antioxidant active sequences are presented. One example is Bougatef et al. (2010) who have studied the antioxidant potential in sardinelle by-products protein hydrolysates obtained using various proteases. They reported that the sardinelle FPHs were found to possess good antioxidant activity, and the highest antioxidant activity was found in the hydrolysate obtained with a crude extract from sardine viscera. Moreover, they found that the tri-peptide Leu-His-Tyr displayed the highest radical-scavenging activity. Kim et al. (2001) have hydrolysed gelatine extracted from Alaska pollack skin, and they obtained a FPH which consisted of peptides ranging from 1.5 to 4.5 kDa and showed high antioxidative activity. Two peptides were isolated, which were composed of 13 and 16 amino acid residues, (Table 2). Both peptides contained a Gly residue at the C-terminus and the repeating motif Gly-Pro-Hyp. The 16 amino acids peptide was reported to be a natural antioxidant which had potent antioxidative activity. Dong et al. (2008) used two commercial available enzymes, Alcalase and Flavourzyme, to hydrolyse Silver carp, and they two found that the LMW peptides were responsible for the observed antioxidant activity in the hydrolysates. In another study, Je et al. (2005b) identified an antioxidative peptide, Leu-Pro-His-Ser-Gly-Tyr (672 Da), from Alaska pollack frame protein hydrolysate that was prepared with mackerel intestine crude enzyme and reported that the isolated peptide showed high scavenging activity on hydroxyl radicals.
It is important to keep in mind, that FPHs are the results of hydrolysing solid by-products or whole unused fish, and thus the activities found in herring FPH cannot be expected to be present to the same extend in the waters generated during the production of marinated herring. However, the herring processing waters are still thought to display some of the same qualities as herring FPH. Additionally, there is a notable difference between herring FPH and the waters generated during the production of marinated herring; in the former, commercial enzymes are used to obtain the hydrolysis whereas in the waters endogenous enzymes from the herring may be effectively cleaving the protein into smaller peptides and amino acids.
Herring FPH have been studied and reported to be a valuable source of peptides with antioxidant activity as well as a source of amino acids. Furthermore, the herring viscera is a source of proteolytic enzyme, which during the ripening process of marinated herring are involved in the degradation of the muscle protein into smaller peptides that potentially are a source of natural antioxidants. Currently, the richest sources of natural antioxidants come from higher plants and their constituents. Shahidi and Zhong (2010) reported fruits, vegetables, spices, herbs, cereals, grains, oilseeds, leguminous seeds, teas, coffee and cocoa as the major sources of plant-derived antioxidants. In the spice-cured versions of the marinated herring products (SC and TSp), the initial brines consist of salt, sugar and spices. A broad variety of spices and herbs has been evaluated for their antioxidant capacity (Madsen and Bertelsen, 1995; Yanishlieva et al., 2006). For instance, rosemary, sage, oregano, thyme and black pepper have been reported to contain bioactive phenolic compounds working as antioxidants and chances are that some of these spices are a part of the spice mix used in the production of the spice-cured herring. Therefore, the antioxidant activity of phenolic compounds which are expected to be present in the wastewaters from the marinated herring industry may also be interesting and their recovery from the in the water may lead to antioxidant activity.
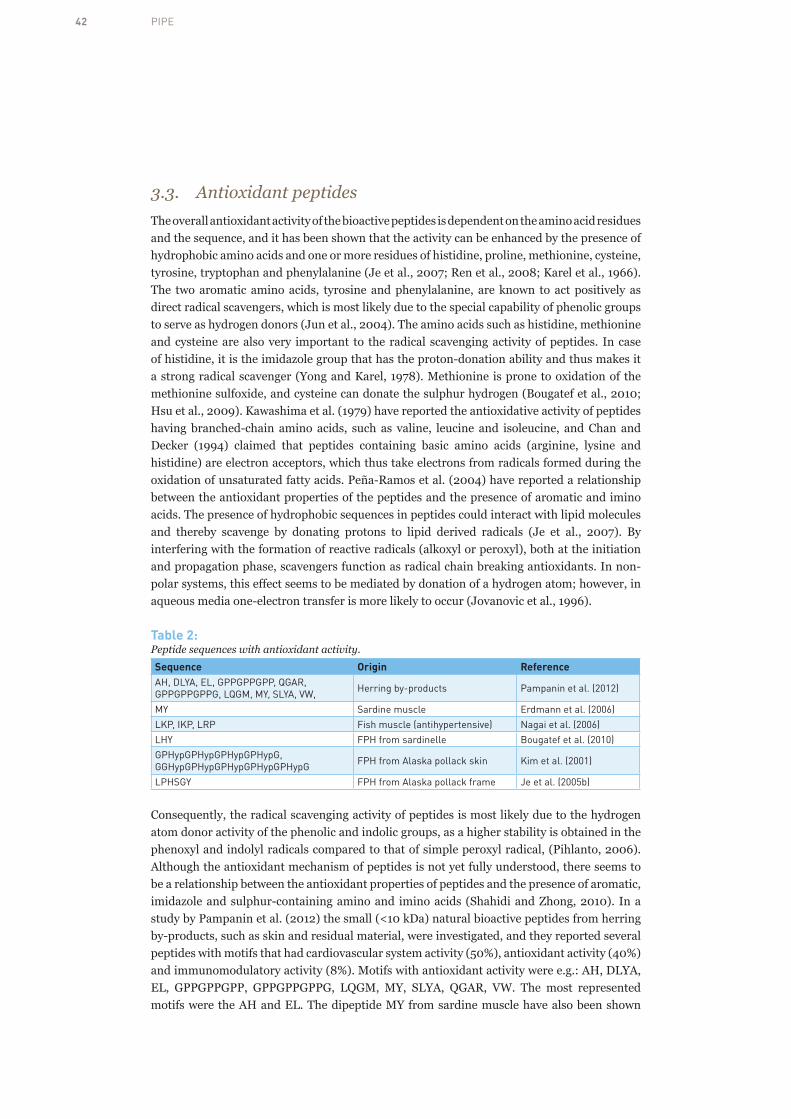
42 PIPE
3.3. Antioxidant peptidesThe overall antioxidant activity of the bioactive peptides is dependent on the amino acid residues and the sequence, and it has been shown that the activity can be enhanced by the presence of hydrophobic amino acids and one or more residues of histidine, proline, methionine, cysteine, tyrosine, tryptophan and phenylalanine (Je et al., 2007; Ren et al., 2008; Karel et al., 1966). The two aromatic amino acids, tyrosine and phenylalanine, are known to act positively as direct radical scavengers, which is most likely due to the special capability of phenolic groups to serve as hydrogen donors (Jun et al., 2004). The amino acids such as histidine, methionine and cysteine are also very important to the radical scavenging activity of peptides. In case of histidine, it is the imidazole group that has the proton-donation ability and thus makes it a strong radical scavenger (Yong and Karel, 1978). Methionine is prone to oxidation of the methionine sulfoxide, and cysteine can donate the sulphur hydrogen (Bougatef et al., 2010; Hsu et al., 2009). Kawashima et al. (1979) have reported the antioxidative activity of peptides having branched-chain amino acids, such as valine, leucine and isoleucine, and Chan and Decker (1994) claimed that peptides containing basic amino acids (arginine, lysine and histidine) are electron acceptors, which thus take electrons from radicals formed during the oxidation of unsaturated fatty acids. Peña-Ramos et al. (2004) have reported a relationship between the antioxidant properties of the peptides and the presence of aromatic and imino acids. The presence of hydrophobic sequences in peptides could interact with lipid molecules and thereby scavenge by donating protons to lipid derived radicals (Je et al., 2007). By interfering with the formation of reactive radicals (alkoxyl or peroxyl), both at the initiation and propagation phase, scavengers function as radical chain breaking antioxidants. In non-polar systems, this effect seems to be mediated by donation of a hydrogen atom; however, in aqueous media one-electron transfer is more likely to occur (Jovanovic et al., 1996).
Table 2: Peptide sequences with antioxidant activity.Sequence Origin ReferenceAH, DLYA, EL, GPPGPPGPP, QGAR, GPPGPPGPPG, LQGM, MY, SLYA, VW, Herring by-products Pampanin et al. (2012)
MY Sardine muscle Erdmann et al. (2006)
LKP, IKP, LRP Fish muscle (antihypertensive) Nagai et al. (2006)
LHY FPH from sardinelle Bougatef et al. (2010)
GPHypGPHypGPHypGPHypG, GGHypGPHypGPHypGPHypGPHypG FPH from Alaska pollack skin Kim et al. (2001)
LPHSGY FPH from Alaska pollack frame Je et al. (2005b)
Consequently, the radical scavenging activity of peptides is most likely due to the hydrogen atom donor activity of the phenolic and indolic groups, as a higher stability is obtained in the phenoxyl and indolyl radicals compared to that of simple peroxyl radical, (Pihlanto, 2006). Although the antioxidant mechanism of peptides is not yet fully understood, there seems to be a relationship between the antioxidant properties of peptides and the presence of aromatic, imidazole and sulphur-containing amino and imino acids (Shahidi and Zhong, 2010). In a study by Pampanin et al. (2012) the small (<10 kDa) natural bioactive peptides from herring by-products, such as skin and residual material, were investigated, and they reported several peptides with motifs that had cardiovascular system activity (50%), antioxidant activity (40%) and immunomodulatory activity (8%). Motifs with antioxidant activity were e.g.: AH, DLYA, EL, GPPGPPGPP, GPPGPPGPPG, LQGM, MY, SLYA, QGAR, VW. The most represented motifs were the AH and EL. The dipeptide MY from sardine muscle have also been shown

43VALORISATION OF MARINE BIOMASS
to be antioxidative (Erdmann et al., 2006) and the tripeptides LKP, IKP and LRP from fish muscle have been shown to have antihypertensive effect (Nagai et al., 2006). Table 2 shows a list of some known peptide derived from fish and the sequence that have been identified as responsible for the antioxidant activity.
So far, a lot of the research on value adding to seafood side streams has concentrated on the solid waste like frames and heads, whilst the liquid waste has been largely overlooked. However, some scattered studies have shown that also fish processing waters can be good sources of protein, peptides and antioxidants. Further characterisation of such waters is needed though before any bioactive products can be extracted and marketable.

44 PIPE
4. Characterisation of process waters
This chapter addresses the sampling, experimental and analytical methods used to characterize the herring process waters/brines. The most important results are presented and discussed in light with the objective of the project. The herring process waters were obtained from the primary producer Paul Mattsson AB and the secondary producer Lykkeberg A/S.
4.1. Sampling 4.1.1. Sampling at Primary ProducerHerring was caught in March 2012 in Kattegat for a set of pre-trials, and then “sharp samples” were collected in September 2012 (samples denoted as -S) in Kattegat, and in February 2013 (samples denoted as -F) in Skagerrak. Sampling of the four different types of process waters; RSW, SW, PW and SB (see Figure 2), arising during the processing of these two herring catches, was performed on-site at the local herring producer Paul Mattsson AB (Ellös, Sweden). For RSW-S and RSW-F, the samples were taken upon the arrival of the boat to the processing site, which was 5 and 20 h after catch, respectively. For SW-S and SW-F, samples were taken after 0, 12, 24, 36, 48, 72 and 96 h of herring storage. PW-samples were only taken once, at the end of the cutting line, which was completed in few minutes. The types of herring cuts produced are named A, B, C and D; with the area of direct muscle exposure (i.e. without the skin or other tissues acting as barriers) towards waters and brines increasing in the order A to D. For PW-S and PW-F, samples were taken during the production of cuts B and D, respectively. SB samples were taken after 0, 5, 10, 15, 20 and 25 h of incubating specific herring cuts in the different salt solutions. The SB samples taken in this project represented several combinations of herring cuts and salt concentrations (3, 5 or 8 %) depending on the company production schedule. The SB samples collected in September 2012 included cut A (SB1-S), cut B (SB2-S) and cut C (SB3-S). The SB samples collected in February 2012 included cut D (SB4-F), and cut A (SB5-F). All collected samples were stored for up to 2 days at -20 °C in the processing site, transported to the laboratory in cooler bags with ice packages and finally stored at -80 °C until analysis. All samples were analysed, in triplicate, for pH, dry matter, protein content and total fatty acid content. Some of the samples (RSW-S/-F, SW-S/-F (48h incubation), PW-S/-F and SB1-SB5 (15h incubation) were also selected for the analysis of total amino acids, polypeptide profile and trace elements; these were RSW, SW incubated for 48 h, PW and SB´s (1-5) incubated for 15 h.
4.1.2. Sampling at Secondary ProducerBrines from the marination steps in the production of marinated herring were supplied
45CHARACTERISATION OF PROCESS WATERS
from Lykkeberg A/S (Hørve, Denmark), and were all prepared according to Lykkeberg A/S production protocols from herring caught in the North Atlantic. Six brines were obtained from the production of four different types of marinated products, as shown in Figure 2. Four brines were original brines; i.e. the brines from vinegar cured fillets (VC), spice-cured fillets (SC), traditional salted whole herring (TSa) and traditional salted spice cured whole herring (TSp). The two remaining brines were desalting brines from TSa and TSp (D-TSa, D-TSp). TSa and TSp results from salting whole herring, filleting and then placing the fillets back in the brine for additional ripening, whereas SC and VC are produced as fillets or bites. Brine samples were divided into appropriate aliquots, transported on ice to the laboratory, stored at -80°C and thawed on ice water prior to experiments.
4.2. Methods4.2.1. Dry matter, pH and ionic strength Five ml of each sample were weighed in dry and pre-weighed glass tubes and put in an Electrolux 939 oven (Electrolux, Stockholm, Sweden) at 60°C for 24 h and then at 105°C until a constant weight was obtained. Dried samples were then cooled in a desiccator and the dry matter was determined as follows:
% Dry matter = [(W3-W2) / W1] × 100
where W3 is the weight of the sample and the tube after drying, W2 is the weight of the empty tube following a pre-drying step and W1 is the weight of the sample before drying. The pH of the samples was determined at 20°C using pH M210 standard pH meter (Radiometer analytical, Lyon, France) and a calibrated Hamilton double pore electrode (Bonaduz, Switzerland). To standardize the protein functionality testing, the ionic strength (IS) was analysed using a standard conductivity meter (Radiometer analytical, Lyon, France) and was converted to % NaCl using a standard curve.
4.2.2. Total proteins and polypeptide profile The protein content of all samples was analysed by the Bicinchoninic Acid Assay (BCA assay) (Thermo scientific, Göteborg, Sweden) using bovine serum albumin (BSA) as a standard. For selected samples, the polypeptide profile was evaluated by SDS-PAGE; all gels and reagents were from Bio-Rad (Solna, Sweden). Electrophoresis was conducted using Mini-protean TGX 4-20 % pre-cast gels. Approximately 10 µg of protein, were mixed with 5 µL Lammeli sample buffer and 1 µL 2-mercaptoethanol, heated at 95°C for 5 min, cooled and then loaded into the wells. Tris/Glycine gels were run at 200 V for 40 min. The protein marker was a broad range standard (6.5-200 KDa) and staining was done with Comassie blue. The gels were scanned using a GS-800 calibrated densitometer. Qualitative analysis of the bands was done using Quantity one 4.5.1 software (Bio-Rad, Solna, Sweden).
4.2.3. Total and free amino acids Total and free amino acids analysis was performed on selected samples as described by Farvin et al. (2010). Briefly, 500 µL of each sample were subjected to microwave-assisted acid hydrolysis in sealed ampoules. Following filtration through 0.2 µm filters, derivatization was carried out using the EZ: Fast kit from Phenomenex A/S (Allerød, Denmark). Analysis of amino acid derivatives was then conducted by liquid chromatography-mass spectroscopy (LC-MS); the full details of the method can be found in Farvin et al. (2010). It should be stated that this procedure did not allow the detection of methionine, tryptophan and cysteine.

46 PIPE
4.2.4. Total fatty acids Fatty acid analysis was performed after extraction according to Lee et al. (1996) and subsequent methylation according to Lepage and Roy (1986) with some modifications. Identification and quantification of the fatty acids was carried out by gas chromatography-mass spectroscopy (GC-MS). Margaric acid C:17 was used as an internal standard and the ratio between chloroform and methanol used in the extractions was 1:2. Following phase separation, the chloroform was collected, transferred into a new tube and then evaporated until dryness under nitrogen at 30°C using a TurboVap LV evaporator (Zymark Corporation (Hopkinton, USA). The dried residual was dissolved in 2 ml toluene. Then, 2 ml of 10 % (v/v) acetyl chloride in methanol were added and the mixture was incubated for 2 h at 70°C. One ml of Milli-Q water and 2 ml of petroleum ether were added to the tubes, which were vortexed for 20 sec and then centrifuged at 1000 × g for 5 min. The upper organic phase was collected and evaporated under nitrogen at 40 °C. Evaporated samples were then dissolved in 1 ml isooctane, from which 200 µL were used for GC-MS analysis of methylated fatty acids. The analyses were run on an Agilent Technologies 7890A GC system connected to Agilent Technologies 5975C inert MSD (Kista, Sweden) as described elsewhere (Cavonius, et al. 2014). Total fatty acids were calculated as the sum of all measured fatty acids with the internal standard removed. The ratio between total fatty acids, measured by GC-MS, and total fat, measured gravimetrically following chloroform/methanol extraction, has earlier been set to around 0.8:1 (Undeland, et al. 1997).
4.2.5. Trace elements For analysis of copper, iron, zinc, nickel, cobalt and manganese, the method by Fredrikson et al. (2002) was used. In short, samples were subjected to acid microwave-aided digestion where after ion chromatography (IC) analyses were conducted. Calcium and magnesium analysis was performed on digested samples using Atomic Absorption Spectroscopy (AAS). The system consisted of an Ultra AA boosted 8 62 lamp supply, a 240 FS AA lamp chamber, a high intensity Ultra AA coded Multi-element lamp Al/Ca/Mg, an SPS 3 auto-sampler and a flame ionization system consisting of Mark 7 spray chamber and mark 7 air/acetylene burner; all parts were from Agilent Technologies (Kista, Sweden). The time measurement was 2 sec, and the read delay was set at 20 sec. The lamp current was 10 mA and the final concentration of cesium chloride/lantham chloride in the sample, prior to analysis, was 10 % (v/v). Quantification of calcium and magnesium was conducted using calcium and magnesium atomic absorption standards from Ultra Scientific (Rhode Island, USA).
4.2.6. Total Volatile Basic Nitrogen (TVB-N) & Thiobarbituric reactive substances (TBARS)
Total volatile basic nitrogen TVB-N which is an indicator e.g. of bacterial spoilage in fish, was determined using the Conway micro-diffusion assay as described by Ng (1987). A sample (2 ml) was added to 8 ml of 4% trichloroacetic acid (TCA) and homogenized at a speed of 11 000 rpm for 2 min. The homogenate was centrifuged at 3000 g for 15 min at room temperature. The supernatant obtained was placed in the outer ring of the Conway apparatus. The inner ring solution (1% boric acid with bromocresol green and methyl red indicator) was then pipetted into the inner ring. To initiate the reaction, K2CO3 was mixed with the sample extract. The Conway unit was closed and incubated at 37 °C for 60 min. The inner ring solution was then titrated with 0,02 N HCl until the green color turned to pink. TVB-N values were expressed in mg 100-1 ml sample.
47CHARACTERISATION OF PROCESS WATERS
The degree of oxidation was assessed by measuring the thiobarbituric acid reactive substances (TBARS), as described by Salih et al. (1987) with slight modification. Briefly, 2 ml of sample were mixed with 4 ml perchloric acid 3.86% and kept in a dark place for 30 min. Afterwards, samples were filtered through a Whatman No. 2 filter paper. Five ml of the filtrate were reacted in a screw-capped test tube with 5 ml of 0,02 M TBA solution in a water bath (95°C) for 30 min. After cooling in room temperature, the absorbance was read at 532 nm using a spectrophotometer. Quantification was done using a standard curve based on malondialdehyde (MDA). Results are expressed as mM TBARS.
4.2.7. Enzymatic activity The brines were analyzed for two types of enzymatic activity; peroxidase and protease activity. Both methods were tested for stability with high salt solution (16%). The peroxidase activity was not affected by this high salt concentration but the protease activity was. Thus this analysis was completed on brines that had been desalted, with PD-10 desalting columns, according to instructions from the kit manufacturer (GE Healthcare Bio-Sciences AB, Uppsala, Sweden) using dH2O as an equilibration medium, prior to the assay. Both analyses were conducted in triplicate. The peroxidase activity was measured by a semi-quantitative analysis.. In short, 50 µL brine (centrifuged at 13 684 g for 3 minutes) and 850 µL phosphate buffer (0.5 mM, pH 6.6) were mixed and used as blank. Fifty µL quercetin (1 mM in dimethylformamide (DMF)) and 50 µL H2 O2 (20 mM) were added and the absorbance at 370 nm was measured immediately (Shimadzu UV-1800 Spectrophotometer, Holm&Halby, Denmark). Results were expressed as ΔAbs/min/ml. The protease (caseinolytic) activity was measured on the desalted brines using green fluorescence EnzChek Protease kit (Life Technologies, Denmark). In short, 100 µL brine (centrifuged at 13 684 g, 3 minutes) were mixed with 100 µL working solution (10 mM TrisHCL, pH 7,75, 25°C) and the absorbance was measured at excitation/ emission of 485/530 nm at one minute interval during an hour at 25°C (Spectra Max Gemini, Molecular Devices, UK). Results were expressed as ΔRFU/min/ml (RFU being Relative Fluorescence Units).
4.2.8. Statistical analysis All analysis was performed in triplicate unless otherwise stated. The results are given as mean values ± absolute standard deviations for independent aliquots. Regression analysis was performed and ANOVA was performed in order to analyse if there was significant difference between samples. All calculations were done using Excel 2010TM or GraphPad Prism® software Ver. 4.03. Results were compared using one-way ANOVA test with Turkey’s posttest or two-way ANOVA test with Bonferroni posttest.
4.3. Results & Discussion4.3.1. Primary producer process waters
Results from pre-trial March 2012On the sampling date 2012-03-14, SW and SB were made available for a systematic pre-sampling in the time spans 0-95h and 0-25h, respectively. Results are shown in Table 3 and Figure 10 and 11.
Table 3 shows how the total protein and fatty acid concentrations in the process waters changed as a function of time i.e. it shows how much of these components that leaked out from the herring over time. Total protein concentrations were established for all samples,

48 PIPE
while specific samples at time points in the beginning, middle and the end of the series were chosen for fatty acid analysis.
A visualization from the pre-trial regarding the leakage of proteins and fatty acids into SW over time is shown in Figure 10;one can see a linear increase of proteins and fatty acids over time resulting in a protein content of almost 2% and a fatty acid content of 0,04% in SW after approximately four days.
Table 3: Protein and fatty acids in SW (March 2012) over time expressed as mg/mlProcess water (herring cut)
Retention time in water (h)
Total protein (mg/ml)a Total fatty acids (mg/ml)b
SW 0 0,1 ± 0,01 N.D
12 0,5 ± 0,01 0,02 ± 9*10-4
24 1,4 ± 0,03 -
28 3,3 ± 0,03 -
44 5,3 ± 0,36 0,21 ± 0,01
53 6,7 ± 0,14 -
68 10,9 ± 0,21 -
80 14,2 ± 0,26 -
95 17,4 ± 0,61 0,36
SB (Cut c) 0 4,4 ± 0,23 0,94 ± 0,10
2 5,8 ± 0,13 -
5 9,1 ± 0,20 0,97 ± 0,02
9 11,7 ± 0,27 0,60 ± 0,03
25 13,4 ± 0,82 1,33 ± 0,69
SB (Cut A) 0 1,5 ± 0,05 0,17 ± 0,06
2 2,4 ± 0,08 -
5 3,7 ± 0,06 -
9 4,6 ± 0,06 0,35 ± 0,004
25 5,7 ± 0,11 0,39 ± 0,01
4. CHARACTERISATION OF PROCESS WATERS
41
02468
101214161820
0 20 40 60 80 100
Con
cent
ratio
n (m
g/m
l)
Time (h)
Protein Fatty acid*10
Table 3: Protein and fatty acids in SW (March 2012) over time expressed as mg/ml
Process water (herring cut)
Retention time in water (h)
Total protein (mg/ml)a
Total fatty acids (mg/ml)b
SW 0 0,1 ± 0,01 N.D 12 0,5 ± 0,01 0,02 ± 9*10-4 24 1,4 ± 0,03 - 28 3,3 ± 0,03 - 44 5,3 ± 0,36 0,21 ± 0,01 53 6,7 ± 0,14 - 68 10,9 ± 0,21 - 80 14,2 ± 0,26 - 95 17,4 ± 0,61 0,36 SB (Cut c) 0 4,4 ± 0,23 0,94 ± 0,10 2 5,8 ± 0,13 - 5 9,1 ± 0,20 0,97 ± 0,02 9 11,7 ± 0,27 0,60 ± 0,03 25 13,4 ± 0,82 1,33 ± 0,69 SB (Cut A) 0 1,5 ± 0,05 0,17 ± 0,06 2 2,4 ± 0,08 - 5 3,7 ± 0,06 - 9 4,6 ± 0,06 0,35 ± 0,004 25 5,7 ± 0,11 0,39 ± 0,01
Figure 10: Protein and fatty acids in SW (March 2012) over time expressed as mg/ml. Figure 10:
Protein and fatty acids in SW (March 2012) over time expressed as mg/ml.

49CHARACTERISATION OF PROCESS WATERS
Figure 11: Protein and fatty acids in SB (March 2012) incubated with a) Cut C or b) cut A for up to 25h expressed as mg/ml.
Figure 11 shows the leakage of total proteins and fatty acids over time in SB incubated with herring cut C (Figure 11a) or A (Figure 11b) (March 2012). For cuts C (Figure 11 a), the total protein concentration increased during the whole incubation time and reached 0,6% after around 25h. Total fatty acid concentration followed the same trend and reached a final concentration of 0,04%. Figure 12 b) shows the leakage of total proteins and fatty acids over time in SB incubated with cuts A. The protein concentration increased linearly up to 10h where after the leakage seemed to slow down and end up at final content of 1,3%. The total fatty acid concentration did not seem to change during the first 5h in the SB. Samples taken after almost 10h of incubation had concentrations that dropped below the initial 0h time sample concentrations, possibly a result of difficulties to sample evenly; fat tend to float to the surface, despite intense stirring. After around 25h the total fatty concentration was 0,13%. It can be seen that the highest amount of proteins were found in the final samplings of SW; however the retention time of the herring was here almost four times longer compared to in the SB. The opposite can be seen for total fatty acids where the concentrations in SB after 25h were higher than in SW after 95h. In general, cut with more flesh exposure (cut C) incubated with SB showed a higher degree of leakage of all components. The difference between cut A and C was more than two fold after the same retention time in the process water.
Dry matter was analyzed in a set of samples that could represent the process flow from catch to marinated herring fillets. Each sample chosen for this analysis was assumed typical for the different process steps involved in the production by primary processors. The result from the dry matter analysis is shown in Table 4.
Table 4: Dry matter in the different processing brine RSW, SW, and SB (March, 2012).
Date of sampling Water Type Incubation time h Dry matter %
Mar 2012 RSW 15 1,49 ± 0,09Feb 2012 SW 39-40 3,69 ± 0,01Mar 2012 PW (Cut C) - 0,23 ± 0,01Mar 2012 SB (Cut C) 5 4,03 ± 0,02Feb 2012 SB (Cut C) 17-19 6,82 ± 0,21

50 PIPE
The dry matter content increased in the different waters generated throughout processing, with the exception for the PW, and reached up to almost 7% in SB.
Results from main trial (September 2012 and February 2013)The lowest protein content was found in RSW-S and RSW-F; 0,33 ± 0,01 and 1,06 ± 0,02 mg ml-1, respectively. Corresponding values for PW-S and PW-F were 1,3 ± 0,05 and 3,4 ± 0,1 mg ml-1, respectively, while those obtained for SW-S and SW-F after 96 h incubation were 5,2 ± 0,2 and 5,9 ± 0,2 mg ml-1, respectively (Figure 13a and b). Compared to the above samples, higher protein contents were obtained in SB samples at the end of incubation; for instance, 12 ± 0,1 mg ml-1 in SB2-S. The protein content increased significantly (P < 0,05) as a function of incubation time for all SW-samples and for the SB1-S, SB2-S and SB4-F samples (Figure 13a and b).
When it came to fatty acids, the lowest content was obtained in RSW-S and RSW-F, i.e. 0,017 ± 0.001 and 0,15 ± 0,007 mg ml-1, respectively, while the corresponding values in PW-S and PW-F were 1,93 ± 0,14 and 0,93 ± 0,07 mg ml-1, respectively. For both SW-S and SW-F, the total fatty acid content reached 0,35 ± 0,01 mg ml-1 after 96 h incubation (Figures 14a and b) and incubation time had a significant effect (P < 0,05) of fatty acid levels in these samples. In SB samples, on the other hand, the content of total fatty acids was, in most cases, not obtained at the end of incubation (Figures 14a and b). Consequently, incubation time here had no significant effect on the total fatty acid content.
4. CHARACTERISATION OF PROCESS WATERS
44
Figure 12: Proteins as a function of incubation time in SW and SB obtained a) in September 2012 (-S) and b) in February 2013(-F)
0
2
4
6
8
10
12
14
0 20 40 60 80 100
Prot
ein
cont
ent (
m.m
l)
Time (h)
SW-F
SB4-F
SB5-F
0
2
4
6
8
10
12
14
0 20 40 60 80 100
Prot
ein
cont
ent (
mg/
ml)
Time (h)
SW-S
SB1-S
SB2-S
SB3-S
b)
a)
Figure 12: Proteins as a function of incubation time in SW and SB obtained a) in September 2012 (-S) and b) in February 2013(-F)

51CHARACTERISATION OF PROCESS WATERS
4. CHARACTERISATION OF PROCESS WATERS
45
Figure 13: Content (mg/ml) of fatty acids as a function of time a) in September 2012 (-S) and b) in February 2013(-F)
Saturated (SFA), monounsaturated (MUFA) and polyunsaturated fatty acids (PUFA) were observed in the tested process waters (data not shown). In general, the dominant fatty acids were myristic acid C14:0, palmitic acid C16:0, palmitoleic acid C16:1 (n-7), oleic acid C18:1 (n-9), gadoleic acid C20:1 (n-9), eicosapentaenoic acid EPA C20:5 (n-3), cetoleic acid C22:1 (n-11) and docosahexaenoic acid DHA C22:6 (n-3) (data not shown). Other fatty acids, such as stearic acid C18:0, vaccenic acid C18:1 (n-7), linoleic acid C18:2 (n-6), α-linolenic acid C18:3 (n-3), stearidonic acid C18:4 (n-3), eicosatetraenoic acid C20:4 (n-3) and arachidonic acid C20:4 (n-6) were also observed in minor quantities.
0
1
2
3
4
0 20 40 60 80 100
Tota
l fat
ty a
cids
(mg/
ml)
Time (h)
SW-S
SB1-S
SB2-S
SB3-S
0
1
2
3
4
0 20 40 60 80 100
Tota
l fat
ty a
cids
(mg/
ml)
Time (h)
SW-FSB4-FSB5-F
B
A
Figure 13: Content (mg/ml) of fatty acids as a function of time a) in September 2012 (-S) and b) in February 2013(-F)
Saturated (SFA), monounsaturated (MUFA) and polyunsaturated fatty acids (PUFA) were observed in the tested process waters (data not shown). In general, the dominant fatty acids were myristic acid C14:0, palmitic acid C16:0, palmitoleic acid C16:1 (n-7), oleic acid C18:1 (n-9), gadoleic acid C20:1 (n-9), eicosapentaenoic acid EPA C20:5 (n-3), cetoleic acid C22:1 (n-11) and docosahexaenoic acid DHA C22:6 (n-3) (data not shown). Other fatty acids, such as stearic acid C18:0, vaccenic acid C18:1 (n-7), linoleic acid C18:2 (n-6), α-linolenic acid C18:3 (n-3), stearidonic acid C18:4 (n-3), eicosatetraenoic acid C20:4 (n-3) and arachidonic acid C20:4 (n-6) were also observed in minor quantities.
The profile of fatty acids varied significantly (P < 0,05) depending on the type of process water tested. As described above, the total fatty acid content was very low in RSW, and mainly MUFAs and SFAs were found PUFA was only found in RSW-F. The major class of fatty acids observed in SW samples, at ≥24 h incubation, was PUFAs, followed by both SFAs and MUFAs. In contrast to SW, the major class of fatty acids observed in SB samples was MUFAs, followed by both SFAs and PUFAs. PW had a fatty acid profile similar to that obtained for SB´s in that MUFAs were the major class of fatty acids; this was first followed by SFAs and then by PUFAs.

52 PIPE
The LC n-3 PUFAs (EPA and DHA) were the main PUFAs found in all tested process waters. Together, EPA and DHA reached up to 93,2, 93,8 and 87,8 % of the measured PUFAs, and thereby up to 44,5, 26,7 and 17,1% of total fatty acids in SW, SB and PW, respectively, when merging the two catching occasions and the different incubation times. It should be also stated that the incubation time and the catching occasions did not significantly affect the profile of fatty acids in all tested process waters.
The main trial allowed us to investigate the impact of season on the organic matter; particularly the fatty acid content. It is known that herring in extreme cases can vary from a few percentages up to 30% in fat (Ekstrand, et.al 1993), with minimum levels being found in the end of the spawning season. Although five months passed between the two samplings –S and -F, no clear seasonal effects on total fatty acid contents were obtained, beside perhaps a small tendency for higher levels in SB-S than SB-F samples (Figure 13). This was in line with the surprisingly small differences in the fat content of the two catches, which was estimated by the producers to be around 12% for both catches. It is however important to be aware that herring process waters might vary quite extensively in fat, but the exact degree of such variations could not be revealed and should be the subject for a separate study.
Going through the processing waters generated from start until end there was an increase in molecular weight of the proteins leaking out (Figures 14-15). In RSW there was mainly smaller proteins ≤42kDa where one possibly could be actin at ~42kDa (Nielsen 1995). In the remaining three types of effluents also larger proteins, up to 200kDa could be seen. In SW, PW and SB brine there were for example bands at ~95kDa and ~200kDa that could be muscle proteins such as actinin and myosin, respectively (Nielsen 1995).
There seemed to be no qualitative difference between same types of process waters even if e.g. herring size, cut and salt concentration differed. For example SW incubated for the same retention time but with different sizes of herring showed the same polypeptide pattern, and the same could be seen for SB with different salt concentrations. Some small differences were noted between SB from cuts A compared cut B and resulted in that slightly less higher molecular weight proteins were seen (Figure 14).
4. CHARACTERISATION OF PROCESS WATERS
47
Figure 14: SDS PAGE of different process waters from different cuts.
SDS-PAGE analysis was done on some selected samples from the SW and SB followed over time (Figure 15).
Figure 15: SDS PAGE of different process water and impact of incubation time
Std SW SW PW(B) PW(A) Std SB(A) SB (B) RSW
Std SW-24h SW-53h SW-95h SB(C)-5h SB(C)-25h SB(A)-5h Std SB(A)-25h
Figure 14: SDS PAGE of different process waters from different cuts.

53CHARACTERISATION OF PROCESS WATERS
SDS-PAGE analysis was done on some selected samples from the SW and SB followed over time (Figure 15).
4. CHARACTERISATION OF PROCESS WATERS
47
Figure 14: SDS PAGE of different process waters from different cuts.
SDS-PAGE analysis was done on some selected samples from the SW and SB followed over time (Figure 15).
Figure 15: SDS PAGE of different process water and impact of incubation time
Std SW SW PW(B) PW(A) Std SB(A) SB (B) RSW
Std SW-24h SW-53h SW-95h SB(C)-5h SB(C)-25h SB(A)-5h Std SB(A)-25h
Figure 15: SDS PAGE of different process water and impact of incubation time
There were no qualitative changes in the polypeptide patterns over time in SW and SB meaning that the same type of proteins leaked out in the beginning and the end of the incubation time (Figure 15). The fact that some high molecular weight bands appeared in SB from herring cut A after 25h could be connected to a higher protein amount loaded by mistake.
The lowest values of dry matter content were obtained in PW samples, i.e. 1,15 ± 0,05 and 0,44 ± 0,04 % (w/w) for PW-S and PW-F, respectively (data not shown). For RSW-S and RSW-F, the dry matter content was 1.45 ± 0,02 and 2,54 ± 0.02 % (w/w), respectively. In SW-S and SW-F, it ranged between 2,8 and 3,8 % (w/w), taking into account the different incubation times (≤ 96h). Compared to these process waters, the dry matter of SB samples was higher; 2,9-3,7; 3,2-5,6; 6,5-8,3; 3,5-5 and 2,9-4,2 % (w/w) for SB1-S, SB2-S, SB3-S, SB4-F and SB5-F, respectively, over the 25h sampling period. Incubation time had no significant effects on the dry matter of SW samples (P > 0.05). For SB samples, the dry matter tended to increase as a function of time, but this tendency was only significant (P < 0,05) for SB4-F.
Table 5: Trace elements in selected effluent expressed as μg/ml with incubation time in bracket
Samples Nickel Zinc Iron Calcium Magnesium
RSW-S 0,42 ± 0,04 0,28 ± 0,04 0,50 ± 0,04 10,9 ± 0,62 42,4 ± 2,5
SW-S (48 h) 1,16 ± 0,10 1,02 ± 0,02 1,36 ± 0,10 10,7 ± 1,21 36,2 ± 4,4
PW-S 0,16 ± 0,02 0,46 ± 0,05 1,70 ± 0,20 23,1 ± 2,20 1,95 ± 0,4
SB1-S (15 h) 0,32 ± 0,04 1,11 ± 0,10 1,18 ± 0,06 39,6 ± 4,91 14,4 ± 0,1
SB2-S (15 h) 0,44 ± 0,04 1,66 ± 0,11 0,32 ± 0,02 22,1 ± 1,40 20,2 ± 2,3

54 PIPE
SB3-S (15 h) 0,38 ± 0,05 0,60 ± 0,11 0,58 ± 0,04 10,9 ± 0,51 24,4 ± 4,8
RSW-F 0,32 ± 0,03 0,46 ± 0,06 0,58 ± 0,05 24,5 ± 1,10 24,4 ± 2,2
SW-F (48 h) 0,92 ± 0,04 0,90 ± 0,10 1,14 ± 0,08 13,8 ± 1,42 10,5 ± 0,8
PW-F 0,12 ± 0,02 0,46 ± 0,03 1,70 ± 0,11 23,1 ± 0,52 2,7 0± 0,5
SB5-F (15 h) 0,26 ± 0,01 1,04 ± 0,10 1,04 ± 0,10 34,3 ± 0,73 12,7 ± 1,8
SB4-F (15 h) 0,46 ± 0,03 1,28 ± 0,14 0,68 ± 0,10 95,7 ± 5,41 18,1 ± 2,1
Among the trace elements measured only iron, zinc, nickel, calcium and magnesium were detected in herring process waters (Table 5). The content of nickel, zinc and iron was low in all tested samples. The highest content of nickel was found in SW samples with the lowest content found in PW samples. The highest content of zinc was found in SB samples, particularly in SB2-S and SB4-F, while the lowest content was found in RSW and PW samples. For iron, the highest content was found in PW samples, while the lowest levels were found in most SB and RSW samples. In all tested samples, calcium and magnesium were found in significantly (P < 0,05) higher levels than the other trace elements. The highest calcium content was found in SB4-F, followed by SB1-S and SB5-F, respectively. For magnesium, the highest content was found in RSW samples, while the lowest content was found in PW samples.
Table 6: Stability of different process waters from September 2012 (-S) and February 2013 (-F) as a function of incubation time expressed as TVB-N in mg/100 ml and TBARS in mM.
Samples Incubation time hTVB-Nmg/100 ml
TBARSmM
RSW-S 5 2,86 ± 0.99 1,62 ±0,03
SW-S 30 10,86 ±1,98 2,43 ±0,03
SW-S 96 35,16 ±3,43 3,91 ±0,04
SB-S Cut A 0 4,0 ±0,99 3,88 ±0,17
SB-S Cut A 22 12,58 ±2,62 4,76 ±0,05
SB-S Cut B 0 4,57 ±0,99 3,88 ±0,17
SB-S Cut B 22 22,3 ±3,43 4,62 ±0,27
RSW-F 11 10,86± 1,98 2,39 ±0,02
SW-F 0 3,43 ± 1,72 1,80 ±0,02
SW-F 96 89,75 ±8,63 2,24 ±0,06
PW-F - 8,58 ± 1,71 3,48 ±0,12
SB-F Cut D 0 9.72 ±0.99 3,23 ±0,02
SB-F Cut D 10 10.86 ±1.98 3,34 ±0,05
SB-F Cut D 24 27.44 ±1.72 3,39 ±0,02
Table 6 shows how TVB-N increased during the generation of the different process waters from the autumn of 2012 and the spring of 2013. The highest values were observed in SW

55CHARACTERISATION OF PROCESS WATERS
taken out after 95h storage of spring herring in these waters (89,75±8,63). From the different salt brines studied, it appeared like higher TVB-N was produced the more muscle that was exposed on the different herring cuts. Table 6 also shows how there were small increases in secondary lipid oxidation products (so called carbonyls) as measured by TBARS during the generation of the different process waters. Changes were somewhat larger in samples from the autumn of 2012 than from the spring of 2013. Highest values were recorded in salt brines (3% and 5% generated during the incubation of cuts A and B) (4,76 and 4,62 mM).
4.3.2. Secondary producer brines4.3.2.1. Proximate compositionThe six different brines collected from the secondary producers VC, SC, TSa, D-TSa, TSp and D-TSp; obtained from the production of four different end-products (Figure 2), were characterized for their basic biochemical composition. Table 7 reports the content of salt, soluble protein, fatty acids, dry matter (DM), as well the enzymatic activity for both peroxidase and proteases in the different brines.
The DM and ash content (data not show) of the six brines were very different. TSa contained the highest, and TSp the second highest DM. SC DM was similar to that of TSp, even though the curing time was shorter for SC; approximately 200 days vs. 450 days for the TSp. The generally high DM content found in the brines was expected as it has earlier been shown that up to 30% of the raw herring weight is lost during marinating whole carcasses and fillets, and that biomolecules leak into the brine during marination. The volume and concentration of biomolecules in the brines depend mainly on the raw fish composition, additives used, processing water quality and process operations but also exposure time of the fish to the water and type of cuts (fillets, bits or intact fish carcasses). In contrast to the three brines not containing acetic acid (TSa, TSp and SC), VC had a significant DM content.
The salt and the protein content was the highest in SC, TSa and TSp in agreement with the high dry matter ion these brines. The desalting brines, D-TSp and D-TSa, had significant lower protein content than the TSp and TSa respectively. The high content of proteins in TSa and TSp is in accordance with a former study from our group (Taheri et al., 2014). VC had the lowest protein content and this was probably due to the fact that acid denatures the proteins and thus reduces the protein solubility.
Table 7: Proximate composition of processing brines including salt, dry matter, soluble protein, total fatty acids as well as enzymatic activity.
BrineSalt wt%
Soluble protein mg/ml
Fatty acidsmg/ml
Dry matter wt %
Peroxidase Activity Abs/min/ml
Protease activityRFU/min/ml
VC 5,5±0,09
9,3±0,01 20,1 ±2,51 13,16
±1,9 n.d 6,81±1,86
SC 14,21±0,16
41,66±0,01 4,01 ±0,28 23,22
±0,59 n.d 4,23±0,67
TSa 15,71±0,06
48,37±0,02 8,92 ±0,38 37,88
±0,342,20±0,19
11,51±2,04
TSp 15,53±0.11
56,74±0,02 5,36 ±0,28 26,62
±0,060,96±0,04
3,75±1,55
D-TSa 4,94±0,03
13,16±0,01 8,13 ±0,54 8,27
±0,07 n.d 11,24±1,22
D-TSp 0,99±0,01
4.39±0,01 4,45 ±0,13 1,91
±0,04 n.d 4,4±1,55
The brines were analyzed for their total fatty acid content which ranged from approx. 4 to 9

56 PIPE
mg/ml. VC contained a significantly higher amount of fatty acids compared to any of the other brines (Table 7). Fatty acids are better solubilized under acidic conditions compared to pure water which could explain this difference. The two desalting brines contained the same level of fatty acids as the corresponding blood brines (TSa and TSp) and this might be that fatty acids are transferred via the fish to the fresh water during the desalting step. It should be noted that the comparison between the four types of brines is not straightforward, as the fat content in herring can vary from 1 to 30% depending on the season, and the fat content of the initial herring raw material used was not measured.
4.3.2.2. Enzymatic activityAs seen from Table 7 TSa and TSp showed a clear peroxidase activity, and in contrast D-TSa, D-TSp, VC and SC did not reveal any peroxidase activity. It was expected to find peroxidases in TSa and TSp as these two brines are rich in blood and consequently Hemoglobin (Hb), which is known to have pseudo-peroxidase activity (Andersen et al., 2007). However, the presence of other peroxidases is not ruled out, but requires further characterization. The general protease activities measured here show marked differences between brines which may be explained by differences in final pH during assaying which ranged from 7,15 – 7,71. Protease activity was highest in TSa and D-TSa and D-TSa contained the same level of protease activity as TSa. It is noteworthy that desalting for one day in fresh water will provide the same level of protease activity as nearly two years in the blood brine. This indicate that only a part of the proteases has been extracted during ripening and that a considerable amount of enzymes is still present in the tissues and can be extracted during desalting. The higher activity in TSa compared to SC and VC was expected due to presence of viscera in the herring during ripening and thereby the contribution from intestinal proteases. The main difference between TSa and TSp are the spices and it cannot be excluded that spices contain compounds that can have protease inhibiting properties, and that some of the added spices are influencing the activity of the proteases in the brine. However, it is also possible that the difference is mainly caused by batch variation. The protease activity in VC was the second highest. This moderately high activity may be explained by the low pH in the VC brine (4,03) which might activate some muscle proteases to a greater extent than the higher pH in the other brines, especially SC where the activity also originates from muscle proteases.
4.3.2.3. Polypeptides profileThe polypeptide profile of the six brines is shown in Figure 16 and all brines, except VC, showed polypeptides with molecular weight between 200 and 14 kDa and heavy bands in the 50 to 35 kDa region. TSp and TSa showed similar profiles, which were comparable to their respective desalting brines (D-TSp and D-TSa).

57CHARACTERISATION OF PROCESS WATERS
Figure 16: SDS PAGE of different effluents
SC showed a different polypeptide profile when compared to the other brines, with an intense fragment at approximately 45 kDa. VC showed no single bands on the gel which might be due to a combination of small peptides in this brine (smaller than 14 kDa) and that the acid have precipitated the proteins in the fish, thus resulting in less proteins leaking into the brine. A rather heavy actin band was found in all brines (except in VC) indicating solubilisation of the myofibrillar proteins. Others have reported degradation of myofibrillar protein during ripening of herring with fragment at 155; 146; 138; 123; 105; 65 and 56 kDa (Nielsen, 1995; Andersen et al. 2007)
4.3.3. Estimation of loss of biomass in the marinated herring industry Based on the analysis performed on the collected waters and based on the producers yearly production it was possible to estimate the yearly amount of water, protein and fatty acids that are lost by both the primary and the secondary producers. This is a pure estimation as i) variation in herring fat content will largely influence the amount of lipid present in the water, ii) the protein leaching out in the water might also be influenced by the season and related to the fish physiology at the time of catch due to e.g. spawning. During sampling at the primary producers, seasonal variations were to some extent taken into account as process water samples were taken in September and February. It should also be noted that the lipid content is reported as total fatty acids and not as total lipid; fatty acids roughly contribute to 80% of the total lipids. Regarding the amount of protein reported; the analysis used responds primarily to soluble proteins in the waters. However, an attempt was made to recover all proteins in the analysis by solubilizing undissolved proteins with sodium hydroxide. Thus, the numbers below in Table 8 & 9 are subject to some variation and should be taken with care.
Nevertheless, Table 8 shows that the primary producer release approx. 35.000 m3 of water per year just of processing waters. The amount of protein was estimated to be nearly 100 tonnes whilst the fatty acids released estimated to reach 34 tonnes.

58 PIPE
Table 8: Amount of protein and lipid in the processing waters for primary producers
RSW SW PW SB TotalAmount per year [m3] 10.000 2.150 20.000 2.500 34.650
Protein content [mg/ml] 0,3 – 1,1 5,2-5,9 1,3 – 3,4 12,7
Amount protein [kg] 7.000 11.933 48.000 31.750 98.683
Fatty acids content [mg/ml] 0,017-0,15 0,35 0,9 – 1,9 0,24 – 3,25
Amount Fatty acids [kg] 835 753 28.000 4.363 33.951
From Table 9 it can be seen that the secondary producer is releasing far less water and approx. 150 times less than the primary producers, which was expected (approx. 235 m3 versus 35.000 m3. However the waters from the secondary producers were richer in protein and fatty acids when compared to data obtained from the primary producers. It could be estimate that 6 tonnes of protein and 3 tonnes of fatty acids were lost yearly
Table 9: Amount of protein and lipid in the processing waters for secondary producers
TSa D-TSa SC VC TotalAmount per year [m3] 52 135 40 80 235
Protein content [mg/ml] 48,4 13,6 41 9,3
Amount protein [kg] 2.516 1.836 1.652 744 6.748
Fatty acids content [mg/ml] 8,9 8,1 4,0 20,0
Amount Fatty acids [kg] 467 1.093 160 1.600 3.320
It was also estimated that in average for 1t of herring the primary producer loses 10 kg of protein and 4 kg of fatty acids. In contrast the secondary producer releases 110 kg of protein and 40 kg of fatty acids. The water from the secondary producers is 10 times richer in protein and fatty acids but it volumes of effluents are 150 times less. The trade-off is that we have either high volume of water with less biomass versus low volume and high in biomass.

59SEPARATION & RECOVERY
5. Separation & recovery
5.1. Sampling & Treatments 5.1.1. Primary producers The process waters used for the concentration trials were SB produced from cut D incubated for 15 h in 3 % salt (trial 1), SB produced from cut B incubated for 20 h in 5 % salt (trial 2) and PW produced during the preparation of cut C (trial 3). All three concentration trials were conducted on a pilot scale unit (Figure 17) provided by LiqTech International on-site using silicon carbide (SiC) membrane technology as the main concentration step and, in trial 1, with EF as a pre-treatment step. In trial 1, a thin fat layer was also observed on top of the SB which was manually removed by a sieve with a pore size of 1 mm, prior to the EF pre-treatment step. For EF in trial 1, a custom-made pilot unit which was provided by A-Factory (Hørsholm, Denmark), see Figure 18. The flow rate of the process water into the EF unit was 1000 ml min-1 and the voltage applied to the electrodes was 200 V. The foam/floc produced as a result of EF was manually collected (full recovery was however prevented since particles were stuck to the equipment), while the outlet of EF was first filtered through a 50 µm polypropylene filter and then treated by UF using the high flux CoMem asymmetric SiC membrane (25 × 305 mm) with channel dimensions of 3 mm, a pore size of 0,04 µm and a membrane area of 0.09 m2, provided by LiqTech International (Ballerup, Denmark). In trials 2 and 3, EF was not used and the process waters were directly filtered through a 50 µm polypropylene filter and then treated by UF using the same membrane as above. In all the above trials, the trans-membrane pressure (TMP) was 1,4 bars, and the temperature of the different process waters, used at the beginning of the UF process, was 10 – 12 °C. Concentration factors in each trial were calculated by dividing inlet volume by concentrate volume. The samples collected during the above trials included the initial process water, the floating fat layer (trial 1), the inlet to EF (trial 1), the foam produced by EF (trial 1), the outlet of EF/inlet to UF (trial 1), the UF permeate (trials 1-3) and the UF concentrate (trials 1-3). All samples were stored at – 20 °C in the processing site for up to 2 days, transported to the laboratory in cooler bags with ice packages and kept at – 80 °C until analysis of dry matter, proteins, fatty acids, COD, foaming capacity and emulsification activity.
5.1.2. Secondary producers 5.1.2.1. Pre-treatment; Electroflocculation (EF) or polypropylene filter (PF) For EF, a pilot scale unit (Figure 19), point (3)) was provided by Application Factory A/S (Hørsholm, Denmark), consisting of a polypropylene (PP) housing with inlet at one bottom corner and outlet at the opposite top. Inside the housing a number of aluminium plates were placed and the process water was flowing between the plates. The flow rate was 1000 ml/min and the applied ampere was 180 A, thus volts changes dynamically (3-6 V) to keep 180 A. As a result of EF, foam/floc was produced which were manually collected from the top of the unit.

60 PIPE
The outlet of EF (EF-OUTLET) was drained 5 cm from the bottom of the unit (to avoid the sediment particles) into the collecting tank (4), and used as inlet for the UF unit. For membrane filtration, a dead-end 50 µm polypropylene filter (PF) (6) was used (Heco Filtration A/S, Hedensted, Denmark). The filtration was carried on until complete clogging of the filter, approximately 2 h. The outlet of the PF unit was a retentate (PF-RET) and a permeate (PF-PER), of which the latter was inlet to the UF.
5.1.2.2. Ultrafiltration (UF)UF tubular ceramic membranes made of silicon carbide (SiC) supplied by LiqTech International A/S (Ballerup, Denmark) were used. The membrane was Ø 25 mm x 305 mm and had 31 x 3 mm round channels. The filtration area was 0.09 m2, and the nominal pore size was 0.040 µm. This UF system (Figure 17), which is shown in Figure 19, consisted of a collecting tank (100 L) (4), a recirculating pump (7), and the UF membrane inside a stainless steel housing (9). The feed solution (EF-OUTLET or PF-PER) flowed along the length of the membrane and was divided into either permeate, to the permeate tank (13), or retentate which returned to the collecting tank (4). The system was operated in cross flow mode (2 m/s) and had three pressure transmitters (0-6 bar), placed at the module entrance (8), at the concentrate outlet (10) and at the permeate outlet (12). The transmembrane pressure was controlled by the retentate valve (11) and the recirculating pump (7) and was kept in the range of 2-2,6 bar. The process time was kept at exactly 1 h. During UF the temperature increased from 5/7°C to 24/26°C for the different brines. The pH was in the range 5,8-6,1 throughout the experiment for both brines. The efficiency of the membrane is described by the retention (%), R:
Figure 17: Figure 18: Pilot unit used for UF Pilot unit for EF with the cathode

61SEPARATION & RECOVERY
5. SEPARATION & RECOVERY
56
Figure 19: Flow chart of the pilot scale units.
EF = electroflocculation, PF = polypropylene filter, UF = ultrafiltration. (1) Feed tank containing either TSp or SC, (2) feed pump, (3) EF unit, (4) collecting tank for either EF-BRINE, PF-PER or UF-RET, (5) valve, (6) PF unit, (7) recirculation pump, (8) pressure transmitter, (9) UF unit, (10) pressure transmitter, (11) valve, (12) pressure transmitter, (13) permeate tank for UF-PER.
5.2 Methods
5.2.1 Proximate composition The composition of the process water in terms of protein, amino acids, fatty acids, ash, dry matter, and trace elements content before and after filtration (i.e. the feed, permeate and retentive) were performed according to the methods already described in Chapter 4.
5.2.2 Oxidation during filtration Thiobarbituric acid reactive substance (TBARS) was measured in inlet, retentate and permeate and adjusted for sugar containing samples according to Du and Bramlage (1992). In short, 5 ml of centrifuged samples (3 min at 13 684 g) were homogenized with 30 ml of a 7,5% TCA solution containing 0,1% propylgallate (PG) and 0,1% ethylenediaminetetraacetic acid, disodium salt (EDTA) for 30 s in an Ultra Turrax blender (9500 rpm, IKA® T25, Staufen, Germany) and filtered through a Whatman filter no. 42. Five ml of the filtrate was mixed with 5 ml 0,02 M thiobarbituric acid (TBA) solution and incubated at 100°C for 40 min. Subsequently, the absorbance was read at; 440, 532 and 600 nm, using ε at 532 nm of 1.57 x 10⁵ for malondialdehyde (MDA), and the molar absorbance (MA) of sucrose at 440 and 532 nm of 147 and 8,4 respectively (Du and Bramlage, 1992). Nonspecific turbidity was extracted at 600 nm. TBARS values are given as MDA equivalents (MDAE) in nmol MDAE/ml brine:
Figure 19: Flow chart of the pilot scale units.EF = electroflocculation, PF = polypropylene filter, UF = ultrafiltration. (1) Feed tank containing either TSp or SC, (2) feed pump, (3) EF unit, (4) collecting tank for either EF-BRINE, PF-PER or UF-RET, (5) valve, (6) PF unit, (7) recirculation pump, (8) pressure transmitter, (9) UF unit, (10) pressure trans-mitter, (11) valve, (12) pressure transmitter, (13) permeate tank for UF-PER.
5.2. Methods 5.2.1. Proximate composition The composition of the process water in terms of protein, amino acids, fatty acids, ash, dry matter, and trace elements content before and after filtration (i.e. the feed, permeate and retentive) were performed according to the methods already described in Chapter 4. 5.2.2. Oxidation during filtrationThiobarbituric acid reactive substance (TBARS) was measured in inlet, retentate and permeate and adjusted for sugar containing samples according to Du and Bramlage (1992). In short, 5 ml of centrifuged samples (3 min at 13 684 g) were homogenized with 30 ml of a 7,5% TCA solution containing 0,1% propylgallate (PG) and 0,1% ethylenediaminetetraacetic acid, disodium salt (EDTA) for 30 s in an Ultra Turrax blender (9500 rpm, IKA® T25, Staufen, Germany) and filtered through a Whatman filter no. 42. Five ml of the filtrate was mixed with 5 ml 0,02 M thiobarbituric acid (TBA) solution and incubated at 100°C for 40 min. Subsequently, the absorbance was read at; 440, 532 and 600 nm, using ε at 532 nm of 1.57 x 10⁵ for malondialdehyde (MDA), and the molar absorbance (MA) of sucrose at 440 and 532 nm of 147 and 8,4 respectively (Du and Bramlage, 1992). Nonspecific turbidity was extracted at 600 nm. TBARS values are given as MDA equivalents (MDAE) in nmol MDAE/ml brine:
5.2.3. Water quality indicators For the primary producers the following COD method was used according to Himebaugh and Smith (1979) with slight modifications. Briefly, 2,5 ml of each sample, after appropriate dilution, were added to a screw capped glass tube (20 x 15 mm). Then, 2,5 ml of the digestion solution (4,9 g of potassium dichromate, 16,7 g of mercuric sulfate and 83,5 ml of concentrated sulfuric acid prepared in 500 ml deionised water) and 3,5 ml of sulfuric acid-silver sulfate

62 PIPE
solution (5 g of silver sulfate prepared in 500 ml sulfuric acid) were added to the sample. The glass tubes were gently inverted 3 times and then placed in a heating block set at 150 °C for 2 h. Following this, the glass tubes were cooled under cold running water and the absorbance of the produced chromic ions was measured at 605 nm. Aliquots of potassium hydrogen phthalate solution, corresponding to 100 – 1500 mg L-1 COD, were used to create a standard curve. For the secondary producers effluents COD and BOD5 (biological oxygen demand in 5 days at 20°C) were determined by photometric cuvette tests from Hach Lange (LCK014 and LCK555, respectively, Brønshøj, Denmark) and measured on a high-performance VIS spectrophotometer at 605 and 620 nm, respectively (DR3900, Hach Lange, Denmark) and reported in g/L. TSS were determined according to Danish Standard (1985). In short, 150 ml appropriately diluted sample were vacuum-filtered through a pre-weighed glass microfiber filter (WhatmanTM, GE Healthcare, UK). After washing, with 40 ml water, the filter was dried at 105°C and then weighed again. The difference in weight is TSS, reported in g/L.
5.2.4. Statistical analysisMeasurements were carried out in triplicates unless otherwise stated. Results are given as mean values ± absolute standard deviations. For all statistical analysis, the GraphPad Prism® software Ver. 4.03 was used with P<0,05. Results were compared using one-way ANOVA test with Tukey’s post-test.
5.3. Results and Discussion5.3.1. Primary producer trialsThe applied concentration process for proteins and lipids was based on using EF as a pre-treatment step and UF using SiC membrane as the main concentration technique. EF has already been described for separating organic molecules without the addition of any chemicals (Barrera-Díaz, et al., 2011). Three trials were conducted and results are shown in Table 10. In trial 1, run on SB from 15h incubation of cut D in 3% NaCl, the manual removal of the floating fat layer, observed on the surface of SB, resulted in a slight (non-significant, P > 0,05) decrease in the protein content and the COD value, and a significant (P < 0.05) decrease in the total fatty acid content. The floating fat layer contained 0,9 and 15,3 % of the proteins and fatty acids found in the initial feed, respectively. The foam collected following EF treatment contained 16.6 and 29.6 % of the proteins and fatty acids found, respectively, in the EF-inlet. However, following theoretical calculations, which are supported by the visual loss of foam inside the EF-equipment, corresponding numbers were 31 and 62%, respectively. After EF-treatment, the COD value thus decreased significantly (P < 0,05), by 30 %. The subsequent use of UF resulted in a UF permeate with a significantly (P < 0,05) lower concentration of proteins and fatty acids compared to the UF inlet, while the UF concentrate contained significantly (P < 0,05) higher amount of proteins and fatty acids compared to the UF inlet. As a result, the UF process decreased the COD value significantly (P < 0,05) by 53 %, and recovered 85,9 and 89,9 % of the proteins and fatty acids found, respectively, in the UF inlet. The concentration factor in this trial was 1,6.
In trial 2, run on SB from 20h incubation of cut B in 5% NaCl, the application of UF without prior EF treatment resulted in a UF permeate with a significantly (P < 0,05) lower concentration of proteins and fatty acids, compared to the initial UF inlet (Table 10). This was concomitant with a significant (P < 0,05) increase in the protein and fatty acid concentration in the UF concentrate. The UF process decreased the COD value significantly (P < 0,05) by 66,7 %, and recovered 81,6 and 95,3 % of the proteins and fatty acids found, respectively, in the UF inlet. The concentration factor in this trial was 1,9.

63SEPARATION & RECOVERY
In trial 3, run on PW produced during the preparation of cut C, the application of UF without prior EF treatment resulted in a UF permeate with a significantly (P < 0,05) lower concentration of proteins and fatty acids, compared to the initial UF inlet (Table 10). This was also simultaneous with a significant (P < 0,05) increase in the protein and fatty acid concentration in the UF concentrate. The UF process recovered 36,4 and 77,1 % of the proteins and fatty acids found, respectively, in the UF inlet and decreased the COD value significantly (P < 0,05) by 41,7 %. The concentration factor in this trial was 4.
The mass balance for total proteins and fatty acids was followed for all the concentration trials and was considered satisfactory. In trial 1: 82,8 and 70,8 % of the initial proteins and fatty acids, respectively, were found in the different recovered fractions and in trial 2: 107,6 and 96,7 % respectively, were found. Likewise in trial 3: 95,6 and 88,5 % of the initial proteins and fatty acids, respectively, were recovered. There was a marginal loss of protein and fatty acid mass in the tubing of the UF system, while it is evident, from Table 10, that there was a more observable loss in protein and, especially, in fatty acid mass after the use of EF. In fact, a thick and sticky layer of fat was observed on the inner walls of the EF cell. This layer was not included in the data shown in Table 10, but may contributed to the observed loss in the proteins and fatty acid mass in trial 1.
Table 10: Content of proteins, fatty acids, dry matter and chemical oxygen demand (COD) during the different steps of the concentration trials applied on selected process waters.
Trial # Stage of trialProtein
content (mg ml-1)
Total Proteins
(g)
Fatty acid content
(mg ml-1)
Total fatty acids
(g)
Dry matter(g 100 g-1)
Total dry matter
(g)
COD (mg l-1)
Trial 1
Initial feed 12,6 ± 1,2 1260 3,3 ± 0,20 330 4,7 ± 0,05 4690 25,5 ± 1,8
Floated fatty layer 10,6 ± 1,1 11,6 92,8 ± 4,4 50.6 51,3 ± 1,80 300 n.a1
Feed after floatation 12,3 ± 1,4 1244,8 2,7 ± 0,30 271.1 4,67 ± 0,04 4614 23,1 ± 1,9
Foam recovered by electroflocculation 19,1 ± 0,3 207,1 7,5 ± 0,30 80.2 8,25 ± 0,40 741 n.a
UF inlet 9,9 ± 0,1 866,8 0,9 ± 0,10 102.7 4,13 ± 0,03 3613 16,2 ± 0,5
UF permeate 2,7 ± 0,3 79,5 0,01 ± 0,001 0.27 3,22 ± 0,02 947 7,6 ± 0,09
UF concentrate 14,3 ± 0,1 744,6 1,8 ± 0,01 92.4 4,63 ± 0,02 2412 n.a
Trial 2
Initial feed 5,9 ± 0,3 590 0,17 ± 0,02 17 4,42 ± 0,01 4420 11,4 ± 0,6
UF permeate 3,8 ± 0,1 153,4 0,006 ± 0,001 0.24 4,78 ± 0,02 1926 3,8 ± 0,08
UF concentrate 8,1 ± 0,1 481,3 0,27 ± 0,01 16.2 2,82 ± 0,03 1676 n.a
Trial 3
Initial feed 0,81 ± 0,02 81 0,047 ± 0,02 4.7 0,89 ± 0,02 890 1,8 ± 0,06
UF permeate 0,64 ± 0,02 48 0,007 ± 0,001 0.53 0,97 ± 0,01 728 1,05 ± 0,06
UF concentrate 1,18 ± 0,06 29, 5 0,145 ± 0,01 3.63 0,55 ± 0,02 138 n.a
Data on protein/fatty acid concentrations and COD are shown as average values ± SD (n=3). Process waters used in the three trials were; SB produced from cut D incubated for 15 h in 3 % salt (trial 1), SB produced from cut B incubated for 20 h in 5 % salt (trial 2) and PW produced during the preparation of cut C (trial 3). 1 Not analysed
The use of EF in trial 1 was promising due to the significant recovery of proteins and fatty acids in the tested SB, and the relatively short time in which the pre-treatment was accomplished, ~1 h for 100 L. Nevertheless, the use of EF has earlier proved to remove significantly more organic matter from other types of process water, compared to what was reported in this study.

64 PIPE
For instance, Valero et al. (2011) reported the removal of 75 – 80 % of total organic carbon, 75 % of total nitrogen and 99 % of total suspended solids from the wastewater of almond industry. Also, Tsai et al. (2002) demonstrated that EF removed 82 % of total suspended solids and 14 % of soluble organic matter found in poultry processing wastewater. However, it should be kept in mind that the pilot EF unit used in this work was custom made, with limited control over the process. Therefore, it is very likely that more proteins and fatty acids can be recovered from herring process waters once all operational parameters are optimized. For the UF experiments conducted in this work, more than 80 % of both proteins and fatty acids were recovered when a 5% SB from cut B was used (trial 2). In trial 3, however, much lower amounts of proteins and fatty acids were recovered; 36 and 77%, respectively. One main reason can be that this trial was carried out on PW, which according to the SDS-PAGE analyses contained lower molecular weight proteins than those found in SB; possibly permeating more easily through the membrane. This indicated that membranes with a pore size smaller than 0,04 µm might be required to efficiently recover proteins from PW. The relatively high recovery of fatty acids in all the trials is expected to be the outcome of the very hydrophilic nature of SiC, which hindered the permeation of lipids through the membrane. One drawback of the applied process, however, was the lack of temperature control, which was due to the design of the pilot unit. Another drawback was the long operation times required to obtain a good concentration factor. This was mainly due to the decrease in the flux and permeability of the membrane, as the tested process waters contained high amounts of proteins and lipids, especially in trial 1 and 2. The fat most likely formed a layer on the surface of the membrane, due to the applied pressure, which slowed down the recovery process.
In the present study, the recovery of proteins and lipids was very satisfactory (>80 %), but further improvement in the process can be achieved if optimization trials are conducted to improve the process robustness in terms of recovery, flux and operation time. The latter would also allow for fair estimations of the cost-effectiveness of EF/UF for protein and fatty acid recovery from herring process waters. It should be stressed though that this work aimed to test the concept of recovering the biomolecules from herring industry process waters, rather than optimizing the recovery processes.
5.3.2. Secondary producer trials 5.3.2.1. Pre-treatmentElectroflocculation (EF) with aluminium ions or membrane filtration with a dead-end 50 µm polypropylene filter (PF), were evaluated as methods of pre-treatment of TSp and SC prior to ceramic UF in order to analyse the partitioning of the high value biomolecules in HMW retentate and LMW permeate.
For EF-tests with TSp, 73 kg TSp was used as inlet of which 20,3 kg was DM, 10,4 kg was ash, 5,1 kg was protein and 0,7 kg was fatty acids. The retention of molecules provided by EF showed that DM, ash, protein and fatty acids were retained to the same degree; 47, 46 and 49%, respectively. The fatty acids were, however, retained to 79%. Running SC through the same pre-treatment gave very similar results.
When TSp and SC were tested with PF, the starting amounts were 37,6 kg and 37 kg as inlet, respectively, and the compositions were the same as in the EF-trials. In both cases, the retention of dry matter, ash and protein were between 34-37%. The retention of fatty acids was 51% and 79% for TSp and SC, respectively. EF resulted in less inlet for the subsequent UF treatment compared to PF but on the other hand EF was more time efficient than PF. Xu et al., (2002) tested aluminium-based EF on the wastewater from egg processing for recovery and utilization of this by-product. They recovered high concentrations of protein (36-50%) and

65SEPARATION & RECOVERY
fat (32-42%) in the generated sludge/floc, which is comparable with the values found in our work, although the fatty acid retention was even higher for our brines (78-79%).
EF makes use of a ‘sacrificial’ anode that releases aluminium ions of which some end up as part of the flocs, whilst others will sediment at the bottom of the equipment or even solubilize in the EF-outlet. The aluminium content reported in Table 11 clearly shows that aluminium did not ended up solely in the floc or sediment during EF, but some was also solubilized in the EF-permeate and aluminium was therefore present in both UF-permeate and retentate. The amount of aluminium present in the permeates represent approximately 12 to 14% of the amount present in the retentate and was respectively 5 and 25 times higher when compared to the PF permeate for TSp and SC. On the basis of these results, demonstrating high aluminium levels, EF using an aluminium electrode is not appropriate as a pre-treatment for recovery of high value biomolecules from marinated herring spice brines, thus only PF was further considered.
Table 11: Aluminum content (mg/L) in UF-permeate and UF-retentate after EF and PF pre-treatments.
Pre-treatment
TSp SC
UF-permeate UF-retentate UF-permeate UF-retentateAl (mg/L) EF 175 ± 18a 1371 ± 18a 243 ± 40a 1688 ± 15a
PF 38 ± 10b 93 ± 5b 10 ± 7b 33 ± 10b
Values are given as mean (n = 3) ± standard deviation (absolute value). By columns, letters indicate homogeneous values (P<0,05).
5.3.2.2. Consecutive PF and UFAs a second step after PF, UF was conducted with ceramic membranes. A mass balance was carried out to evaluate the consecutive treatment of PF and UF (Table 12). It shows that the UF-permeate (generated from 25,2 and 24,9 kg TSp and SC PF-permeate) only amounted to 1,2 and 1,6 kg, respectively, i.e. 4,8% and 6,4%, respectively, which is probably due to membrane clogging which also impacted the flux (~20 L/m2/h). Still the fatty acids were retained by 100% by the ceramic membrane, which was due to the hydrophilicity of the membrane. The retention of dry matter and ash was 95.5% and 94.3% for TSp and 94.7% and 94.3% for SC, respectively. Proteins were retained by 98,8% and 98,2% for TSp and SC, respectively.
Table 12: Mass balances based on consecutive PF and UF treatment of TSp and SC.
TSp SCPF-Permeate UF-Permeate UF-Retentate PF-Permeate UF-Permeate UF-Retentate
Brine (kg) 25,2 1,2 19,3 24,9 1,6 18,2
DM kg) 6,7 0,3 5,1 1,3 5,7 0,3
Ash (kg) 3,5 0,2 2,6 0,7 3,5 0,2
Protein (kg) 1,6 0,02 1,2 0,4 1,1 0,02
FA (kg) 0,1 0,0 0,1 0,0 0,04 0,0

66 PIPE
Table 13: COD (g/L), BOD5 (g/L), TSS (g/L) and salt content (wt%) in inlets, PF-Permeate, UF-Permeate and UF-Retentate after consecutive PF and UF treatment of TSp and SC.
TSp SCInlet PF-
PermeateUF-
PermeateUF-
RetentateInlet PF-
PermeateUF-
PermeateUF-
Retentate
COD (g/L) 124±2,5bc
128 ±2,4bc
109 ±2,5c
121 ±2,5ab
151 ±2,6a
109 ±0,4c
87 ±1,2d
109 ±0,4c
BOD5 (g/L) 23 ±0,3a
23 ±0,9a
23 ±0,3a
23 ±0,3a
23 ±0,2a
24 ±0,1a
24 ±0,0a
23 ±0,1a
TSS (g/L) 16 ±1,8ab
8 ±2,1c
0,3 ±0,1d
7 ±1,3c
20 ±3,5a
16 ±1,3ab
1 ±0,3d
14 ±3,8bc
Salt (wt%) 13,4 ±0,1b
13,2 ±0,1bc
13,5 ±0,2ab
13,1 ±0,1bcd
13,8 ±0,2a
13,3 ±0,2b
12,8 ±0,2cd
12,8 ±0,1d
Values are given as mean (n = 2 for COD and BOD5, n = 3 for TSS and salt) ± standard deviation (ab-solute value). By rows, letters indicate homogeneous values (P<0,05).
Investigation of the organic load in the fractions before and after PF and UF, using the water quality indicators COD, BOD5, TSS and salt (Table 13), shows that the retention of COD was about 12% and 42% for TSp and SC, respectively. In respect to TSp, the COD level was almost unaltered after PF, whereas the PF retained almost 28% of the COD in the case of SC. There was no significant (P<0.05) change in the BOD5 level in any of the outlets for either TSp or SC, indicating that PF and UF are not affecting the biological matter in these brines. The TSS level was, on the other hand, reduced with more than 95% in both of the UF-PERs. A large part of the TSS was already retained by PF (approx. 51% and 22% for TSp and SC, respectively). These results demonstrate that PF and UF are effective in retaining the suspended solids and also, that the biomolecules giving rise to COD and BOD5 are not linked to TSS. Cassini et al. (2010) studied ceramic UF of wastewater from isolated soy protein production and reported retention of 26% and 85% of COD and TSS, respectively, which are data comparable to our results. In contrast to our results, retention of about 80% BOD5 was achieved by Mameri et al. (1996) who studied fishery washing water. Overall, the values found for COD, BOD5 and TSS in TSp and SC were all higher than the general levels reported for all types of herring processing waters reviewed by Chowdhury etal. (2010).
5. SEPARATION & RECOVERY
63
Figure 20: TBARS in the different water before and after UF treatment. To determine if oxidation was exacerbated under UF conditions,TBARS of permeates and concentrate were determined for TSp and SC. From Figure 20 a notable difference between the two brines is seen. TSp inlet had 45 nmol MDAE/ml, which decreased to 29 nmol MDAE/ml in the UF-permeate and increased to almost 70 nmol MDAE/ml in the UF-concentrate. In contrast, SC inlet had only 5,4 nmol MDAE/ml which was unchanged in the UF-permeate and UF-concentrate. These results indicate that, regarding oxidation, SC was stable during the PF and UF, whereas significant (P<0,05) oxidation took place in the case of TSp, which was significantly (P<0,05) more oxidized than the SC. The brines have different initial compositions but both contained spices and retention of phenolics from the spices was different for the different brines which may explain the observed results. Beside the poor flux observed the ceramic membrane were able to retain the protein and lipid efficiently in both primary and secondary producers processing water. However, optimisation of the pre-treatment might result in better performance of the ceramic membrane and better flux. Further optimisation is needed before ceramic membrane can be applied to marinated herring processing waters. However valorisation of the processing water and of the fractions obtained after filtration can be explored.
0
10
20
30
40
50
60
70
80
TSp RAW
BRINE
TSp UF-PER
TSp UF-RET
SC RAW
BRINE
SC UF-PER
SC UF-RET
nmol
MDA
E/m
l brin
e
a
dd
c
d
b
Brine UF- UF- Brine UF- UF- Permeate Retentate Permeate Retentate
Figure 20: TBARS in the different water before and after UF treatment.

67SEPARATION & RECOVERY
To determine if oxidation was exacerbated under UF conditions,TBARS of permeates and concentrate were determined for TSp and SC. From Figure 20 a notable difference between the two brines is seen. TSp inlet had 45 nmol MDAE/ml, which decreased to 29 nmol MDAE/ml in the UF-permeate and increased to almost 70 nmol MDAE/ml in the UF-concentrate. In contrast, SC inlet had only 5,4 nmol MDAE/ml which was unchanged in the UF-permeate and UF-concentrate. These results indicate that, regarding oxidation, SC was stable during the PF and UF, whereas significant (P<0,05) oxidation took place in the case of TSp, which was significantly (P<0,05) more oxidized than the SC. The brines have different initial compositions but both contained spices and retention of phenolics from the spices was different for the different brines which may explain the observed results.
Beside the poor flux observed the ceramic membrane were able to retain the protein and lipid efficiently in both primary and secondary producers processing water. However, optimisation of the pre-treatment might result in better performance of the ceramic membrane and better flux. Further optimisation is needed before ceramic membrane can be applied to marinated herring processing waters. However valorisation of the processing water and of the fractions obtained after filtration can be explored.
68 PIPE
6. Valorisation
6.1. Sampling & Treatment6.1.1. Antioxidant and functionality testing in model systemsThe inlet and outlet from the primary producers obtained in separation trial 1 and 2 were tested for functional properties, and process waters/brines from both primary and secondary producers were tested for their functional properties and their antioxidant activity using different assays as described below.
6.1.2. Antioxidant testing in food systemsInitial brine from secondary producers from traditional barrel-salted spice-cured herring (TSp) and brine from traditional barrel-salted herring (TSa) were obtained from the secondary producers and were filtrated through cotton and the collected permeates were freeze-dried (Heto DryWinner 8, Thermo Fisher Scientific, Loughborough, UK) or refrigerated at 4 ºC until further analysis. The mass balance is expressed as volume yield (final volume of permeate/sample volume after adjusting pH) in percentage (%)
6.1.2.1. Frozen herring coating Ten kilograms of fresh herring (Clupea harengus) were obtained from local fishmongers, filleted with skin on and subsequently vacuum packed and stored at -80 °C until further experiment. Coating was performed at 4 °C and frozen herring fillets were randomly allocated into three batches: initial brine SC, TSp and TSa adjusted to protein concentration of 1 mg/ml. Brief dipping the fish fillet in the fish protein solution for 10 seconds three consecutive times with 15 second intervals resulted in a thin coating layer onto the fillet surface. Controls consisted of non-coated fillets, vacuum packed fillets and fillets coated with water. For each treatment a minimum of 6 randomised fillets were used. The fish were placed in aluminium foil and stored for 4 and 10 weeks at -10 °C before they were stored at -80 °C until further analysis.
6.1.2.2. Additions to minceFor fresh herring mince, ten kilograms of fresh herring (Clupea harengus) were obtained from the local fishmongers, filleted, and skinned and minced using a kitchen blender (Robot Coupe Ra A7S, France). The mince was stored in plastic bags under vacuum at -80 ºC until further experiment. Samples of mince (250 g) were randomly allocated into the following batches containing 1 g per kg of SC; TSp; TSa powder re-solubilised in water. Added water represented 10% (w:w) of the initial herring mince. Control samples containing salt, BSA, or salt + BSA or no salt were also used. The content of salt and BSA were 125 and 600 mg per Kg of herring mince respectively, which are equivalent to the highest amounts of salt and protein in the initial brines. All batches were kept in trays at 5 ºC and samples analysed on days 1, 4 and 7 of

69VALORISATION
storage. At each sampling point, the samples were packaged in vacuum plastic bags and stored at -80 ºC until further analysis.
6.2. Methods6.2.1. Functionality testing of primary producers brines and separation trial
outletsFoaming capacity (FC) and stability (FS%) of starting brines and concentrates from trials 1-2 were analyzed using the shaking method (Hammershøj et al. 1999). Emulsifying activity and stability index (EAI and ESI, respectively) were determined according to Pearce and Kinsella (1978). Sunflower oil and protein solution at a ratio 1:3 were homogenized by a Polytron homogenizer (Luzern, Switzerland) at 18000 rpm for 1 min. Immediately and after 10 min, emulsion aliquots were mixed with 0.1% sodium dodecyl sulphate (SDS) and the absorbance at 500 nm was measured. Protein concentrations of samples in the FC, FS%, EAI and ESI tests were matched against the most diluted sample (5.9 mg protein ml-1). In order not to change the native IS (here converted to % NaCl) of the samples, dilutions were done in NaCl solutions of the same concentration as the respective sample (in trial 1: 1,31-2.03%, in trial 2: 3,24%). BSA at 5,9 mg protein ml-1, and at an IS/pH average to each trial (in trial 2: 1,79%/6,58 and in trial 2: 3,24%/6,52 respectively), was used as a reference. Lack of sample prevented functionality testing of trial 3.
6.2.2. Antioxidant testing of primary producers process waters
Table 14 shows the SB samples that were selected for antioxidant testing. In addition SW and PW-samples were also used.
Table 14: Primary production samples subjected to antioxidant testingHerring cut % NaCl of the brine Time of incubationCut B 5% 24h
Cut A 3% 24h
Cut C 5% 20h
Cut D / 15h
6.2.2.1. Cupric reducing antioxidant capacity (CUPRAC) assay The CUPRAC assay involves the couple Copper(II) - Neocuproine (Cu(II)-Nc) as the chromogenic oxidizing agent. When Copper(II) is put into contact with Neocuproine, there is formation of Copper(II) - Neocuproine (Cu(II)-Nc) reagent, which has a pronounced yellow color and has a maximum absorbance at 450 nm (Apark et al. 2008). When an antioxidant is added to the reaction medium, the Cu(II) is reduced into Cu(I), which involves a change of the solution’s color. It is this change of color which is measured by absorbance. One milliliter of 1.0x10⁻² M CuCl2 (in distilled water) was added to 1ml of 7,5x 10⁻³ M Neocuproine (in Ethanol) and 2ml of buffer. Two different buffers were tested. These will were Tris buffer (50mM, pH 6,8) containing 2% SDS and 8 M urea and Tris-glycine buffer (0,086 M Tris, 0,09 M glycine, tested at pH 7) containing 4 mM tri-sodium citrate. To this standard solution and standard buffer pH8, were added. Moreover, a suitable blank was prepared using only buffer solution (standard or urea as appropriate), while also a control sample was used and was identical to the test sample.

70 PIPE
The test tubes were then incubated at 25 ° C for 30, 45 and 60 minutes to assess if time has an influence on the response of the standards. After this incubation period, the absorbance was measured using a spectrophotometer at 450 nm. The relationship between the absorbance and the concentration of the used standards was linear with R ² values very close to 1. Using Beer-Lambert law, i.e. , The molar absorptivity (ε) was calculated for each standard. Furthermore, the antioxidant capacity of each standard was also calculated as trolox equivalents (TEAC values) using the following equation.
For analyses of samples, 400µL of 1,0x10⁻² M CuCl2, 400 µL of 7,5x 10⁻³ M Neocuproine and 800 µL of buffer solution (urea or standard buffer) plus samples (0 and 400 µL) were mixed where after the rest of the protocol was done according to above.
6.2.2.2. ORAC-assay (peroxyl radical scavenging activity)In ORAC assay only Trolox, a water soluble antioxidant analog of the fat soluble vitamin E, iss used as a reference and antioxidant activity is determined as Trolox equivalent for the different samples analyzed. The different samples analyzed with ORAC were the same as those analysed with CUPRAC.
The reagents used in the ORAC assays were sodium phosphate buffer (75 mM, pH 7), fluorescein (1.17 mM) prepared in phosphate buffer and trolox (0,5 mM) prepared in methanol.
The method was carried out in a 96-well micro-plate, where in each of the wells 20 µL of sample, blank (phosphate buffer) or control were added. After adding the samples to the wells, 120 µL of fluorescein (1.17 x 10⁻⁵ M) were added using multipipet. Following this, the microplate was incubated at 37°C for 15 minutes. Meanwhile, a solution of AAPH (40 mM) (2,2 ‘-azobis (2-methylpropionamidine) dihydrochloride) was prepared, from which 60 µL were added to each well at the start of data acquisition. Data recording was performed for 2 h to ensure that the reactions were come to an end. Then the data were saved in Excel format to be transferred. Phosphate buffer was used as a blank and Trolox was used as a standard.
6.2.3. Microalgae growh media from primary producers brines A total of 3 types of process water permeates generated from marinated herring production were tested as working media for microalgal growth. These were: • Permeate from UF trial February 2013 (SBs, cut D, 3% salt, 15 incubation)
• Permeate from UF trial March 2013 experiment 1 (SB, cut D, 3% salt, 15h incubation)
• Permeate from UF trial March 2013 experiment 2 (SB, cut D, 3% salt, 15h incubation)
A standard F/2 media which was prepared according to Guillard & Ryther (1962) consisted of 1 ml of nitrate and phosphate and 1 ml of trace elements as well as vitamin solutions which were mixed with 1 L of artificial sea water and then the whole solution was filter-sterilised through 0,2 µM filter under vacuum.
All these four media, i.e. the standard medium and the three working media (i.e herring process water permeates), were filter-sterilised through 0,2 µm filters using a Buchner funnel- like filtration system (under vacuum). Following filtration, the different media were inoculated with 11 different microalgal strains which included marine green algae, marine Haptophycae, marine Eustigmatophyceae, marine Cryptophyceae and marine diatom... The inoculation of the above strains into the different media was performed by adding 2 ml of the stock solution into 20 ml of each medium (total volume of the culture = 22 ml). The tubes containing the inoculated media were incubated at room temperature (close to the window) with 16 h light (7 am – 11 pm) and 8 h darkness (11 pm – 7 am). Shaking was performed once a day.

71VALORISATION
In all the three working media (permeates from marinated herring), bacterial contamination occurred and was observed due to the increasing turbidity throughout the cultivation period (4 weeks). Optical density values (OD) were measured at 600 and 750 nm, but due to contamination did not reflect the growth of microalgal strains in the working media.
6.2.4. Antioxidant testing of secondary producers brines 6.2.4.1. Antioxidant assaysAll the brines from secondary herring processing steps were analysed using three assays for antioxidant activities; metal chelation, reducing power and their ability to scavenge free radical was tested using ABTS (2,2’-azino-bis(3-ethylbenzthiazoline-6-sulfonic acid). To test the concentration dependency of the antioxidant activities, all the brines were analyzed in the crude, undiluted version and following sequential threefold dilutions, until a steady level was observed. They were measured on a spectrophotometer (Synergy 2 Multi-Mode Microplate Reader, BioTek® Instruments, Inc., Vermont, USA), and tested with high salt solution (16%) prior to analysis and none of them were affected by this salt concentration.
Iron (II) chelating activity of the different brines was assayed by the method described by Farvin et al. 2010 adjusted to microplate detection. Brines subjected to the different dilutions were centrifuged (13 684 g, 3 min, Biofuge® Pico, Kendro, UK) and 100 µL of the supernatant was mixed with 135 µL dH2O in the microplate. The reaction was initiated by 5 µL of 2 mM ferrous chloride, and inhibited by 10 µL of 5 mM ferrozine after 3 min reaction time. After 10 minutes, the absorbance was measured at 562 nm. An assay control (dH2O instead of the sample) and a sample control (dH2O instead of reagents) were included. EDTA (200 µM) was used as a positive control and was subjected to the same dilutions as the samples. The iron chelating activity (%) was calculated as: Fe2+ Chelating activity(%) = (blank – (sample – sample control)x 100)/blank.
The reducing power was measured according to the protocol described by Oyaizu (1986). After centrifugation, as described above, 200 µL of supernatant was mixed with 200 µL of 0.2 M phosphate buffer (pH 6,6) and 200 µL of 1% potassium ferricyanide. The mixture was incubated for 20 minutes at 50°C. Subsequently, 200 µL of 10% TCA was added and an aliquot of 100 µL was mixed with 100 µL dH2O and 20 µL of 0,1% ferric chloride in the microplate, and incubated 10 min at room temperature. The absorbance was measured at 700 nm.
6.2.5. Antioxidant activity in food systems Total lipid extract were obtained from 10 g herring mince or fillet with methanol/chloroform (1:1 v/v), according to the method of Bligh and Dyer.21 PV was measured directly on the lipid extract (LEX) according to the method described by the International IDF Standards 22 and expressed as milli equivalent (meq) of O2 per kg oil.
Fish and mince samples were analysed for TBARS using the methodology described by Vyncke (1975). Results were expressed as µmol malondialdehyde equivalents (MDA) per kg of muscle.
The volatile secondary oxidation products were analysed at day 4 for the herring mince and after 4 and 10 weeks for the glazed herring fillet using dynamic headspace according to Eymard et al.24 An aqueous suspension of 10 g of fish powder was purged at 37 ºC in a water bath for 30 minutes with a nitrogen flow of 340 ml/min. The volatile compounds in the samples were collected on Tenax GR traps (Chromapack, Bergen op Zoom, The Netherlands). A Perkin–Elmer (Norwalk, CT) ATD-400 automatic thermal desorber system was used for thermally desorbing the collected volatiles from the Tenax traps using helium as a carrier gas (with a flow of 1,3 ml of helium/min). Thereafter volatiles were separated and quantified

72 PIPE
by gas chromatography- mass spectrometry (GC-MS), a DB 1701 column (30x 0,25 mm, 1.0 µm; J&W Scientific, Folsom CA, USA) and the following programmes of temperatures were used: 35 ºC for 5 minutes, 35-90 ºC at 3 ºC min-1, 90-240 ºC at 10 ºC min-1, and finally hold at 240 ºC for 4 minutes. The GC–MS transfer line temperature was kept at 280 ºC. The mass-selective detector used ionisation at 70 eV in EI mode and 50 µA emission. The scans were performed in the mass range of 30–350 atomic mass unit with a repetition rate of 2.2 scans/s. The compounds were identified by MS library searches and by comparing retention time and spectra with MS runs of external standards. For quantification purpose, calibration curves were prepared by adding a mixture of ten selected standard in ethanol (concentrations 0.01-0.05 mg/g) directly on Tenax tubes (1 µl) and performing thermal desorption and GC-MS analysis under the conditions described above for the samples.
6.2.6. StatisitcsData from coated herring storage and minced herring experiments, with the exception of volatiles in minced herring, were analysed by multifactor ANOVA of each variable, taking into account treatment and time. Fisher LSD (Least Significant Difference) test was applied for determining group differences at 95% of significant level. Statgraphics Centurium XVII was used for carrying out the statistical analysis.
6.3. Result and Discussion6.3.1. Primary producers6.3.1.1. Functionality of inlet and recovered fractions during separation trials Foaming properties were followed using foaming capacity (FC in %) and foam stability (FS%) and emulsifying properties using emulsifying activity index (EAI in m2 g-1) and emulsion stability index (ESI in %) of initial feeds and concentrates recovered in trials 1 and 2 are shown in Table 15. Processing is known to change protein structure and to affect protein emulsifying and foaming properties. Therefore, FC, FS and ESI and EAI were tested on the fractions as new texturing agents are seeked to replace synthetic ones. High emulsifying and foaming properties are valuable in texturizing. Generally, FC was significantly lower (P < 0,05) for samples from trial 1 than trial 2, which was not the case for FS%. In trial 1, FC was only 13,7-16,7% of that for the reference protein BSA, while in trial 2, it was 64,4-86,0%. Within trial 1, the application of EF and UF did not significantly alter FC as compared to the initial feed; however, the manually floated fat-rich layer did not foam at all. Further, FS% was significantly higher (P < 0,05) for the EC foam than UF concentrate; the former even exceeding the FS% for the reference protein. In trial 2; both FC and FS% were higher after UF concentration with FS% for the UF concentrate exceeding that for the reference protein.
Regarding emulsification, EAI and ESI were in the same range for samples from trials 1 and 2; also when comparing to the respective analyses of the reference protein. Within trial 1, EAI and ESI were significantly higher (P < 0,05) for the manually floated layer than for the other samples. EF and UF per se did not significantly affect EAI, while a significant reduction (P < 0,05) in ESI was seen after UF concentration. In trial 2, EAI and ESI significantly decreased and increased (P < 0,05), respectively, after UF concentration. Looking at the data for the reference protein, it seemed that the conditions of trial 1, e.g. with a somewhat lower IS than in trial 2 (1,79 vs. 3,24% NaCl), were slightly more favourable for retaining foaming and emulsification properties of the biomolecules.

73VALORISATION
Table 15: Foaming capacity (FC %), foaming stability (FS %) after 60 min and emulsifying activity index EAI m2 g-1, and emulsion stability index ( ESI %) of initial feeds and concentrates from trials 1-2.
Foaming properties Emulsifying properties
Trial 1 FC FS EAI ESI
Salt brine 12,9±1,43 80,79±3,21 19,6±0,15 24,0±0,0
Floated fatty layer n.m1 - 25,2±1,25 27,2±3,2
Foam recovered by electroflocculation 15,0±2,0 90,07±2,43 20,7±1,14 24,3±2,1
UF concentrate 12,35±0,7 70,50±21,44 18,5±0,62 17,3±0,5
BSA2 89.69±4.69 86,06±0,35 32,1±0,72 52,5±3,7
Trial 2
Initial feed 49.41±4.97 45.41±2.89 28.17±1.30 25.19±1.71
UF concentrate 65.96±10.96 93.34±0.94 23.82±0.01 39.78±1.73
BSA 76.71±5.84 81.07±1.83 31.44±0.59 48.16±3.17
Process waters used in these trials were: salt brine (SB) produced from cut D incubated from 15 h in 3% salt (trial 1) and SB produces from cut B incubated for 20 h in 5% salt (trial 2). 1Not measurable. 2
Bovine serum albumin was used as standard protein.
Thus, the brief testing applied here revealed that both EF and UF in most cases either did not affect, or improved, foaming and emulsification properties of biomolecules recovered in concentrates. For example, large improvements were seen in FC, FS% and ESI when subjecting SB from 20h incubation of cut B in 5% NaCl to UF (trial 2). A major compositional change during UF is the removal of low molecular weight (LMW) compounds as peptides and free amino acids. It is known that LMW-peptides cannot form a cohesive interfacial film (Damodaran, 2008). Further, the temperature raise during trial 2 (from 10-12°C to ~20°C) most likely induced partial protein denaturation; which is known to improve foaming and emulsifying properties (Damodaran, 2008). The significantly better ability of samples from trial 2 to create foams as compared to samples from trial 1 could be due to the lower fatty acid content in samples from trial 2 (Table 3); lipids are more surface active than proteins so they inhibit the absorption of proteins at the air-water interface (Damodaran, 2008). This shows that endogenous features of herring process waters can have larger effects on functionality than EF or UF per se.
6.3.1.2. Antioxidant activity testing of primary producers waters Figure 21 shows the results from the CUPRAC assay expressed as Trolox equivalents antioxidant capacity (TEAC) per ml of selected process water. The test reflects the capacity of an antioxidant to reduce Cu2+ to Cu+. Clearly the highest values were achieved by SBs, which were the richest waters in terms of proteins, The activities varied depending on the cut, but there was no specific link to the degree of muscle exposure. Two different buffers were used for diluting the samples; one urea buffer and one Tris-glycine buffer at pH 7. It can be noted that

74 PIPE
the reducing power of the samples measured in urea buffer was significantly higher compared to that measured in the standard buffer. Urea weakens the hydrogen bonds of the molecule and opens the protein, which makes its interior groups that were buried in the structure of the proteins accessible; allowing them to react as an antioxidant.
6. VALORISATION
70
0
0,05
0,1
0,15
0,2
0,25
0,3
0,35
0,4
Tub water Filleting water
Salt brine flaps
Salt brine krons
Salt brine bits
Salt brine fillets
TEAC
(mg
TE /
ml s
ampl
e)
Samples
TEAC in urea buffer
TEAC in standard buffer pH7
SW PW SB-Cut B SB-Cut A SB cut D SB cut C
which makes its interior groups that were buried in the structure of the proteins accessible; allowing them to react as an antioxidant.
Figure 21: Results from the CUPRAC assay (reducing capacity) expressed per ml process water. In Figure 22, the CUPRAC results are divided by the protein content of the tested waters, and thus, show the activity per mg protein. It is clear that the proteins of the SW (tub water in this figure) are more active reducing agents than the proteins of the SB; although more diluted. It can also indicate that there are other, non-protein compounds that are efficient reducing agents. A feature that stands out in the SW are their abundance of blood, which is known to contain antioxidants e.g. to protect the erythrocyte membranes from oxidation. In both figures, it can clearly be seen how the PW (filleting water of the figures) had the lowest reducing capacity.
Figure 22: Results from the CUPRAC assay (reducing capacity) expressed per mg protein of the different process waters.
0
0,005
0,01
0,015
0,02
0,025
0,03
0,035
0,04
0,045
0,05
Tub water
Filleting water
Salt brine flaps
Salt brine krons
Salt brine bits
Salt brine fillets
TEAC
(mg
TE /
mg
prot
ein)
Samples
TEAC in urea buffer
TEAC in standard buffer pH 7
SW PW SB-Cut B SB-Cut A SB cut D SB cut C
Figure 21: Results from the CUPRAC assay (reducing capacity) expressed per ml process water.
In Figure 22, the CUPRAC results are divided by the protein content of the tested waters, and thus, show the activity per mg protein. It is clear that the proteins of the SW (tub water in this figure) are more active reducing agents than the proteins of the SB; although more diluted. It can also indicate that there are other, non-protein compounds that are efficient reducing agents. A feature that stands out in the SW are their abundance of blood, which is known to contain antioxidants e.g. to protect the erythrocyte membranes from oxidation. In both figures, it can clearly be seen how the PW (filleting water of the figures) had the lowest reducing capacity.
6. VALORISATION
70
0
0,05
0,1
0,15
0,2
0,25
0,3
0,35
0,4
Tub water Filleting water
Salt brine flaps
Salt brine krons
Salt brine bits
Salt brine fillets
TEAC
(mg
TE /
ml s
ampl
e)
Samples
TEAC in urea buffer
TEAC in standard buffer pH7
SW PW SB-Cut B SB-Cut A SB cut D SB cut C
which makes its interior groups that were buried in the structure of the proteins accessible; allowing them to react as an antioxidant.
Figure 21: Results from the CUPRAC assay (reducing capacity) expressed per ml process water. In Figure 22, the CUPRAC results are divided by the protein content of the tested waters, and thus, show the activity per mg protein. It is clear that the proteins of the SW (tub water in this figure) are more active reducing agents than the proteins of the SB; although more diluted. It can also indicate that there are other, non-protein compounds that are efficient reducing agents. A feature that stands out in the SW are their abundance of blood, which is known to contain antioxidants e.g. to protect the erythrocyte membranes from oxidation. In both figures, it can clearly be seen how the PW (filleting water of the figures) had the lowest reducing capacity.
Figure 22: Results from the CUPRAC assay (reducing capacity) expressed per mg protein of the different process waters.
0
0,005
0,01
0,015
0,02
0,025
0,03
0,035
0,04
0,045
0,05
Tub water
Filleting water
Salt brine flaps
Salt brine krons
Salt brine bits
Salt brine fillets
TEAC
(mg
TE /
mg
prot
ein)
Samples
TEAC in urea buffer
TEAC in standard buffer pH 7
SW PW SB-Cut B SB-Cut A SB cut D SB cut C
Figure 22: Results from the CUPRAC assay (reducing capacity) expressed per mg protein of the different process waters.
After dialysis of the process waters to remove low molecular weight substances, the activities generally decreased (data not shown). This indicates that the low molecular weight molecules
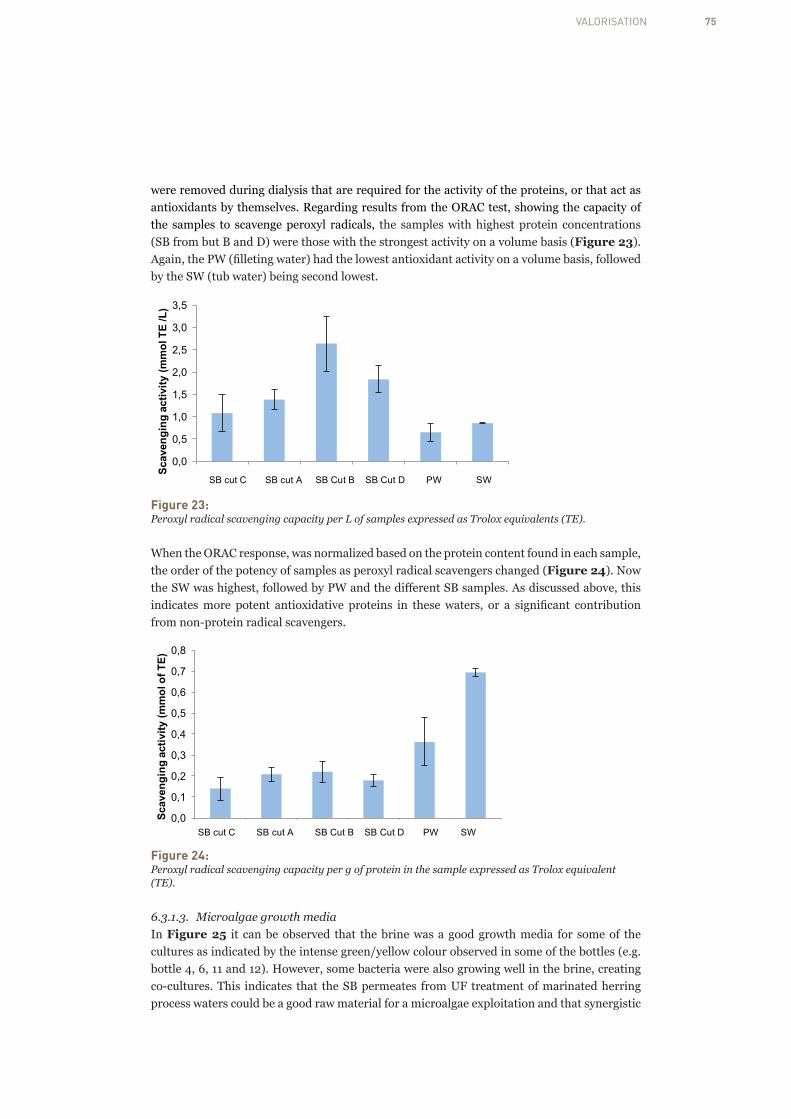
75VALORISATION
were removed during dialysis that are required for the activity of the proteins, or that act as antioxidants by themselves. Regarding results from the ORAC test, showing the capacity of the samples to scavenge peroxyl radicals, the samples with highest protein concentrations (SB from but B and D) were those with the strongest activity on a volume basis (Figure 23). Again, the PW (filleting water) had the lowest antioxidant activity on a volume basis, followed by the SW (tub water) being second lowest.
6. VALORISATION
71
After dialysis of the process waters to remove low molecular weight substances, the activities generally decreased (data not shown). This indicates that the low molecular weight molecules were removed during dialysis that are required for the activity of the proteins, or that act as antioxidants by themselves. Regarding results from the ORAC test, showing the capacity of the samples to scavenge peroxyl radicals, the samples with highest protein concentrations (SB from but B and D) were those with the strongest activity on a volume basis (Figure 23). Again, the PW (filleting water) had the lowest antioxidant activity on a volume basis, followed by the SW (tub water) being second lowest.
Figure 23: Peroxyl radical scavenging capacity per L of samples expressed as Trolox equivalents (TE). When the ORAC response, was normalized based on the protein content found in each sample, the order of the potency of samples as peroxyl radical scavengers changed (Figure 24). Now the SW was highest, followed by PW and the different SB samples. As discussed above, this indicates more potent antioxidative proteins in these waters, or a significant contribution from non-protein radical scavengers.
0,0
0,5
1,0
1,5
2,0
2,5
3,0
3,5
Salt brine fillets
Salt brine krons
Salt brine flaps
Salt brine bits
Filleting water
Tub waterScav
engi
ng a
ctiv
ity (m
mol
TE
/L)
Sample
SB cut C SB cut A SB Cut B SB Cut D PW SW
Figure 23: Peroxyl radical scavenging capacity per L of samples expressed as Trolox equivalents (TE).
When the ORAC response, was normalized based on the protein content found in each sample, the order of the potency of samples as peroxyl radical scavengers changed (Figure 24). Now the SW was highest, followed by PW and the different SB samples. As discussed above, this indicates more potent antioxidative proteins in these waters, or a significant contribution from non-protein radical scavengers.
6. VALORISATION
72
Figure 24: Peroxyl radical scavenging capacity per g of protein in the sample expressed as Trolox equivalent (TE).
6.3.1.3 Microalgae growth media In Figure 25 it can be observed that the brine was a good growth media for some of the cultures as indicated by the intense green/yellow colour observed in some of the bottles (e.g. bottle 4, 6, 11 and 12). However, some bacteria were also growing well in the brine, creating co-cultures. This indicates that the SB permeates from UF treatment of marinated herring process waters could be a good raw material for a microalgae exploitation and that synergistic activities were a waste from one production is converted into value for another company when companies are clustering could represent an opportunity.
Figure 25: Example of incubating experiment of brine from primary producers with different strain of microalgae.
6.3.2 Secondary producer
6.3.2.1 Antioxidant assays In an attempt to further characterize the brines and estimate its potential value, three in vitro tests were used to determine their antioxidant activity. As seen in Figure 26, all the brines exhibited good iron chelating activity and therefore are good antioxidants capable of chelating pro-oxidative trace metals. VC had the lowest activity (~55%), TSp reached ~70% activity, whereas the other four brines had activity between 80% and 90%.
0,0
0,1
0,2
0,3
0,4
0,5
0,6
0,7
0,8
Salt brine fillets
Salt brine krons
Salt brine flaps
Salt brine bits
Filleting water
Tub water
Scav
engi
ng a
ctiv
ity (m
mol
of T
E)
Sample
SB cut C SB cut A SB Cut B SB Cut D PW SW
March permeate experiment 1 1 2 3 4 5 6 7 8 9 10 11 12
Figure 24: Peroxyl radical scavenging capacity per g of protein in the sample expressed as Trolox equivalent (TE).
6.3.1.3. Microalgae growth mediaIn Figure 25 it can be observed that the brine was a good growth media for some of the cultures as indicated by the intense green/yellow colour observed in some of the bottles (e.g. bottle 4, 6, 11 and 12). However, some bacteria were also growing well in the brine, creating co-cultures. This indicates that the SB permeates from UF treatment of marinated herring process waters could be a good raw material for a microalgae exploitation and that synergistic

76 PIPE
activities were a waste from one production is converted into value for another company when companies are clustering could represent an opportunity.
6. VALORISATION
72
Figure 24: Peroxyl radical scavenging capacity per g of protein in the sample expressed as Trolox equivalent (TE).
6.3.1.3 Microalgae growth media In Figure 25 it can be observed that the brine was a good growth media for some of the cultures as indicated by the intense green/yellow colour observed in some of the bottles (e.g. bottle 4, 6, 11 and 12). However, some bacteria were also growing well in the brine, creating co-cultures. This indicates that the SB permeates from UF treatment of marinated herring process waters could be a good raw material for a microalgae exploitation and that synergistic activities were a waste from one production is converted into value for another company when companies are clustering could represent an opportunity.
Figure 25: Example of incubating experiment of brine from primary producers with different strain of microalgae.
6.3.2 Secondary producer
6.3.2.1 Antioxidant assays In an attempt to further characterize the brines and estimate its potential value, three in vitro tests were used to determine their antioxidant activity. As seen in Figure 26, all the brines exhibited good iron chelating activity and therefore are good antioxidants capable of chelating pro-oxidative trace metals. VC had the lowest activity (~55%), TSp reached ~70% activity, whereas the other four brines had activity between 80% and 90%.
0,0
0,1
0,2
0,3
0,4
0,5
0,6
0,7
0,8
Salt brine fillets
Salt brine krons
Salt brine flaps
Salt brine bits
Filleting water
Tub water
Scav
engi
ng a
ctiv
ity (m
mol
of T
E)
Sample
SB cut C SB cut A SB Cut B SB Cut D PW SW
March permeate experiment 1 1 2 3 4 5 6 7 8 9 10 11 12
Figure 25: Example of incubating experiment of brine from primary producers with different strain of microalgae.
6.3.2. Secondary producer6.3.2.1. Antioxidant assaysIn an attempt to further characterize the brines and estimate its potential value, three in vitro tests were used to determine their antioxidant activity. As seen in Figure 26, all the brines exhibited good iron chelating activity and therefore are good antioxidants capable of chelating pro-oxidative trace metals. VC had the lowest activity (~55%), TSp reached ~70% activity, whereas the other four brines had activity between 80% and 90%. Interestingly, the desalting brines had very good iron chelating properties indicating that low concentration of low molecular weight compound present in the desalting brines might be acting as good chelators. Sannaveerappa et al. 2007 reported that organic acids may play a major role in the antioxidant activity of herring press juice. Taheri et al. 2014 previously fractionated the brine from traditional barrel-salted herring and analysed the different fractions with the same assay, but found only negligible activity compared to EDTA. The higher iron chelating activity found in our study might be explained by the much higher protein and salt contents in our unfractionated brines.
Figure 26: Iron chelating activity (%) in the six brines. The activity of the samples is plotted against the dilution factor.
The reducing power of the six brines is presented in Figure 27. SC, TSa, TSp, VC and D-TSa showed similar or higher reducing power compared to the positive control, and D-TSp showed a poorer reducing power. Dilution of the brines decreased the reducing power thus showing a clear concentration dependency.

77VALORISATION
The antioxidant effect of a hydrolysate is mostly associated with short peptides (5-16 amino acids) that contain hydrophobic amino acids, valine and leucine, at the N-terminus, and proline, histidine or tyrosine in their amino acid sequence. In a previously published review by Freitas et al. (2013) these same amino acids were, together with the sulphur containing amino acids, reported to provide antioxidant activity. All of the brines tested here contained these amino acids (Not showed). In some case the desalting brine also had very good antioxidant activity indicating that low concentration of low molecular weight compound, which are easily diffusing from the muscle to the brine, are potent antioxidants. Further investigation of TSa and TSp, together with SC and may reveal whether the activity is solely in the protein-free fraction or if protein/peptides contribute to their antioxidant activity. Nevertheless the brine originating from the secondary producers are rich in antioxidants and deserve further investigation regarding their valorisation.
Figure 27: Reducing power (OD700) in the brines. The activity of the samples is plotted against the dilution factor.
6.3.2.2. Antioxidant testing in food systemRancidity during storage for frozen herring fillets coated with brine (SC, TSa, TSp) was measured by primary and secondary oxidation products: peroxide values (PV) and volatiles, respectively (Figure 28, Table 16). Herring average oil content used in this experiment was 20% (wet weight).
PV showed early lipid oxidation (Figure 28) and, after 4 weeks of storage, a protective effect of brine glazing was observed when comparing PV to non-coated samples. Brine seemed more potent to act as an antioxidant compared to water coating. These differences between PV of coated and un-coated samples were more evident after 10 weeks of storage. PV of TSp and TSa brine-glazed samples were significantly (P<0.05) lower than those of SC samples, and protein and peptide content (higher in TSp and TSa brines than in SC brine) may have contributed to this effect. TSa and TSp demonstrated higher iron chelating and radical scavenging activities than SC, which could contribute to their ability to be better coating agent than SC and water. Other authors (Kakatkar et al., 2004; Rodríguez-Turienzo, 2011) also showed that the protein glazing limited the lipid oxidation in fishery products during frozen storage and were a better protection than water glazing. However, more investigations are needed to reveal the exact mechanisms. Coatings of salmon with whey protein isolate

78 PIPE
and acetylated monoglyceride also reduced lipid oxidation during frozen storage (Stuchell and Krochta, 1995). It was further suggested that protein coating reduced the diffusion of oxygen and the availability of oxygen to the fish surface. It is possible that in herring brine, the combination of salt and protein changes the structure of the frozen water on the surface of the fish allowing less oxygen to penetrate the muscle tissues, thereby preventing oxidation. Protein solutions and protein isolation processes have been the subject of patents (Kelleher 2006, 2011), which have applications as acidic solutions of muscle protein or dry powders into foods to retain moisture during cooking, prevent fat absorption during frying and prevent dehydration among other effects.
6. VALORISATION
75
Figure 28: Peroxide value (PV) (meq of O2 per kilogram of oil) during storage of brine coated frozen fillets at -10°C for 4 and 10 weeks from SC, TSa, TSp, Herring brine has an acidic character, with pH values around 6, and contains large amounts of protein and peptide and therefore can also be considered for such applications, but more research is needed to demonstrate its potential. The concentration of volatile secondary products such as 1-penten-3-ol, hexanal, heptanal and 2,4-heptadienal after 4 and 10 weeks of storage are shown in Table 16. These results are in agreement with those for primary oxidation products (PV). After 4 weeks, although not significantly (P<0,05), the level of 2,4-heptadienal was lower in brine glazed fillets compared to water glazed, whilst no difference was observed for the other analysed volatiles. However after 10 weeks, TSa and TSp seemed to protect better against oxidation than water glazing. In general, these results suggest that the use of herring brines can represent an alternative to the traditional water glazing, allowing the product to be stable for a longer period of time.
0
5
10
15
20
25
30
Week4 Week10
Peroxidevalues(meqO2per
kilogram
ofoil)
Storagetime
SCTSpTSaNocoatingWater
Figure 28: Peroxide value (PV) (meq of O2 per kilogram of oil) during storage of brine coated frozen fillets at -10°C for 4 and 10 weeks from SC, TSa, TSp,
Herring brine has an acidic character, with pH values around 6, and contains large amounts of protein and peptide and therefore can also be considered for such applications, but more research is needed to demonstrate its potential.
The concentration of volatile secondary products such as 1-penten-3-ol, hexanal, heptanal and 2,4-heptadienal after 4 and 10 weeks of storage are shown in Table 16. These results are in agreement with those for primary oxidation products (PV). After 4 weeks, although not significantly (P<0,05), the level of 2,4-heptadienal was lower in brine glazed fillets compared to water glazed, whilst no difference was observed for the other analysed volatiles. However after 10 weeks, TSa and TSp seemed to protect better against oxidation than water glazing. In general, these results suggest that the use of herring brines can represent an alternative to the traditional water glazing, allowing the product to be stable for a longer period of time.

79VALORISATION
Table 16: Development of volatiles (ng per g minced) during storage of brine coated frozen fillets at -10°C for 4 and 10 weeks.
Hexanal4 Weeks 10 Weeks
1-penten-3-ol4 Weeks 10 Weeks
2.4 heptadienal4 Weeks 10 Weeks
Heptanal4 Weeks 10 Weeks
SC A119.0ab A181,6ab
(±8,6) (±59,9)A72,9ab
A92,7a
(±20,5) (±29,5)A99,6a B240,8b
(±21,4) (±58,1)A2,2ab
A7,6ab
(±0,6) (±5,8)
TSp A104,2ab A132,1a
(±29,7) (±49,8)A75,60ab A69,6a
(±6,1) (±12,7)A109,8a
A161,8ab
(±40,5) (±18,0)A1,4a
A3,5a
(±0,5) (±1,3)
TSa A76,5a A165,9ab
(±23,7) (±69,6)A50,03a
A70,3a
(±17,0) (±15,7)A81,5a A127,2a
(±9,5) (±36,1)A1,2a A3,2a
(±0,5) (±1,6)
No Coating A156,8b A278,2b
(±49,6) (±102,6)A83,3b A177,2b
(±8,2) (±82,3)A232,7b A320,0c
(±23,9) (±63,7)A3,6 b A15,6b
(±1,0) (±10,0)
Water A73,1a A149,8ab
(±41,7) (±64,1)A56,3a
B112,7ab
(±18,3) (±8,8)A112,3a A124,3a
(±59,3) (±28,7)A1,8a
A4,8a
(±2,3) (±3,7)
Vacuum Packed* 22,8 (±1,6)
26,6 (±5,5)
32,5 (±6,0)
0,3 (±0,1)
*Control sample, fillets vacuum packed at -80 °C upon arrival to the laboratory.Values (mean ± standard deviation. n=3) followed by the same uppercase letter in same row are not significantly different (P<0.05). Values (mean ± standard deviation. n=3) followed by the same lowercase letter in same column are not significantly different (P<0.05).
The mixture of compounds present in the brines such as organic acids, natural antioxidants from the fish or inherent to the spices added (SC and TSp) during processing of marinated herrings, protein and peptide with antioxidant activity, makes it difficult to access the exact nature of the active compounds. Elias et al. (2008) reviewed the antioxidant activity of protein and peptides and indicated that hydrolysis with the formation of peptides lead to higher antioxidant properties, which could explain differences between TSa and TSp compared to SC. Nevertheless, more research is needed, including purification, structure identification and investigation of the mechanisms responsible for the antioxidative activity in herring brines.
The impact of addition of brine during storage of herring mince and the results for lipid (PV and TBARS) are presented in Table 3. PV indicated higher levels of lipid oxidation in all alkaline-solubilised brine compared to initial brine, a trend which was also confirmed with another lipid oxidation parameter (TBARS). Among samples, SC showed lower PV compared to TSp and TSa. Compared to the control without any additive, SC, TSa and TSp had lower PV and TBARS from day 1, indicating that as an additive, brine is able to prevent lipid oxidation. However, there were no significant differences between samples and controls with salt and/or protein. Significant difference was observed after 4 days of storage, however in PV for TSp only when compared to no additive. In contrast, TBARS results suggest that all brines showed some antioxidant potential. After 4 days, the oxidative stability order was SC > TSp > TSa. However, the brine samples were comparable to salt and/or protein added samples. Both protein and salt played a protective role against oxidation, but a non-synergistic effect was found when salt and protein were added together at the concentration used. Several research papers have showed the protective effect of protein toward lipid oxidation and it is well-known that proteins and peptides can have antioxidant activities (Elias at al, 2008). At day 7, SC, TSa and TSp appeared to be preventing oxidation. Peptides obtained from alkaline isolate hydrolysates from tilapia muscle proteins have been shown to possess some antioxidant activity with increasing degree of hydrolysis, but extensive hydrolysis is also known to reduce the antioxidant potential (Raghavan and Kristinsson. 2008). This could explain the loss of
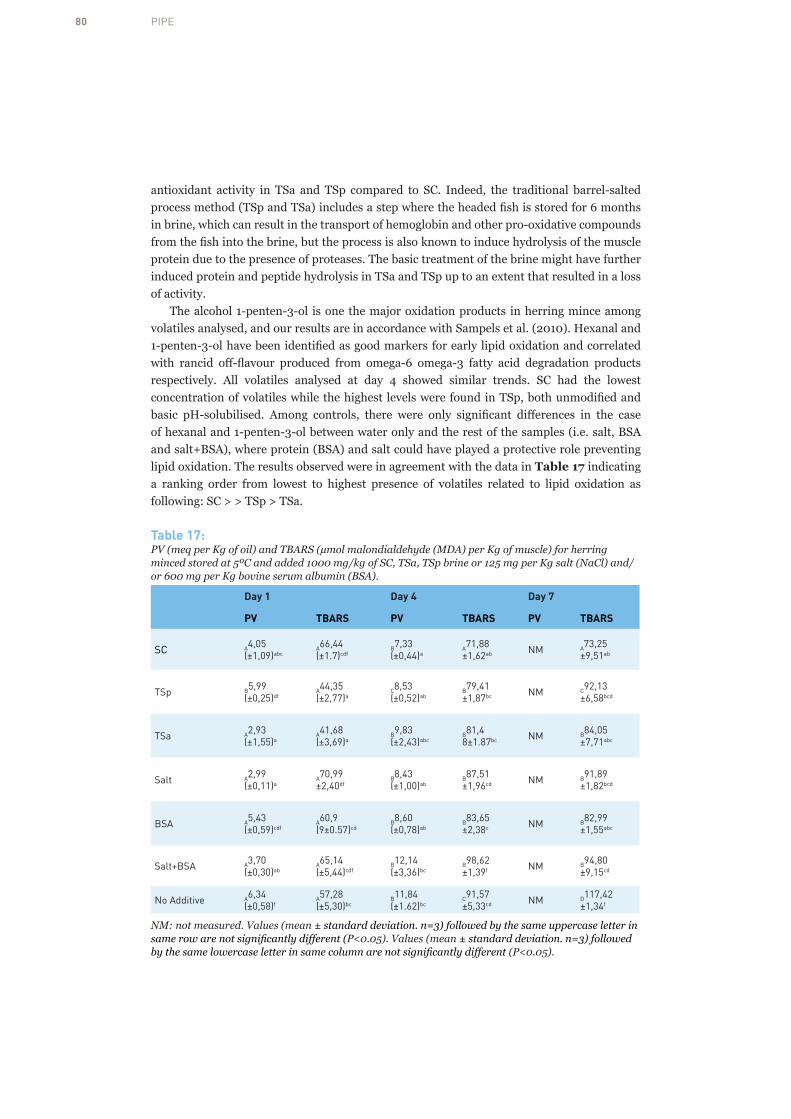
80 PIPE
antioxidant activity in TSa and TSp compared to SC. Indeed, the traditional barrel-salted process method (TSp and TSa) includes a step where the headed fish is stored for 6 months in brine, which can result in the transport of hemoglobin and other pro-oxidative compounds from the fish into the brine, but the process is also known to induce hydrolysis of the muscle protein due to the presence of proteases. The basic treatment of the brine might have further induced protein and peptide hydrolysis in TSa and TSp up to an extent that resulted in a loss of activity.
The alcohol 1-penten-3-ol is one the major oxidation products in herring mince among volatiles analysed, and our results are in accordance with Sampels et al. (2010). Hexanal and 1-penten-3-ol have been identified as good markers for early lipid oxidation and correlated with rancid off-flavour produced from omega-6 omega-3 fatty acid degradation products respectively. All volatiles analysed at day 4 showed similar trends. SC had the lowest concentration of volatiles while the highest levels were found in TSp, both unmodified and basic pH-solubilised. Among controls, there were only significant differences in the case of hexanal and 1-penten-3-ol between water only and the rest of the samples (i.e. salt, BSA and salt+BSA), where protein (BSA) and salt could have played a protective role preventing lipid oxidation. The results observed were in agreement with the data in Table 17 indicating a ranking order from lowest to highest presence of volatiles related to lipid oxidation as following: SC > > TSp > TSa.
Table 17: PV (meq per Kg of oil) and TBARS (µmol malondialdehyde (MDA) per Kg of muscle) for herring minced stored at 5ºC and added 1000 mg/kg of SC, TSa, TSp brine or 125 mg per Kg salt (NaCl) and/or 600 mg per Kg bovine serum albumin (BSA).
Day 1 Day 4 Day 7
PV TBARS PV TBARS PV TBARS
SC A4,05 (±1,09)abc
A66,44(±1.7)cdf
B7,33(±0,44)a
A71,88±1,62ab NM A73,25
±9,51ab
TSp B5,99(±0,25)df
A44,35(±2,77)a
C8,53(±0,52)ab
B79,41±1,87bc NM C92,13
±6,58bcd
TSa A2,93(±1,55)a
A41,68(±3,69)a
B9,83(±2,43)abc
B81,48±1.87bc NM B84,05
±7,71abc
Salt A2,99(±0,11)a
A70,99±2,40df
B8,43(±1,00)ab
B87,51±1,96cd NM B91,89
±1,82bcd
BSA A5,43(±0,59)cdf
A60,9(9±0.57)cd
B8,60(±0,78)ab
B83,65±2,38c NM B82,99
±1,55abc
Salt+BSA A3,70(±0,30)ab
A65,14(±5,44)cdf
B12,14(±3,36)bc
B98,62±1,39f NM B94,80
±9,15cd
No Additive A6,34(±0,58)f
A57,28(±5,30)bc
B11,84(±1.62)bc
C91,57±5,33cd NM D117,42
±1,34f
NM: not measured. Values (mean ± standard deviation. n=3) followed by the same uppercase letter in same row are not significantly different (P<0.05). Values (mean ± standard deviation. n=3) followed by the same lowercase letter in same column are not significantly different (P<0.05).

81VALORISATION
The valorisation of the processing water effluents from the marinated herring industry is possible with or without pre-treatment provided that the waters are food grade. Several valorisation routes were explored with success; including antioxidant activity, technofunctional properties and media for growing algae biomass. The fish processing water possesses antioxidant properties and are a good source of functional molecules and these could be further exploited as sources of natural additives. Furthermore, the marinated herring industry processing waters are a good source of nutrients favorable to biomass conversion. Therefore, if the market is ready these processing waters may represent new solutions for the food/feed and biotech industry with added values.

82 PIPE
7. Cost Benefit Analysis
7.1. Theory & concepts7.1.1. Cost-benefit analysisIn the cost-benefit analysis (CBA) guidelines, given by the International Records Management Trust, CBA is defined as a systematic approach to estimating the strengths and weaknesses of technology alternatives that satisfy agency business requirements. In other words, it includes a systematic cataloging of impacts as benefits and costs, valuing in a given currency and determining the net benefits of the proposal. CBA not only considers the costs and benefits that accrue to an investment but also considers the social costs and benefits and for this reason, CBA is often referred to as social cost-benefit analysis (Boardman, 2011).
The purpose of CBA is to have more efficient allocation of society’s resources. Where markets work well, individual self-interest leads to an efficient allocation of resources (Boardman, 2011).
There are two major types of Cost-benefit analysis; Ex ante CBA, which is often referred to as a standard CBA, and Ex post CBA. Ex ante CBA is conducted while a project or policy is under consideration, before it is started or implemented and therefore assists in the decision about whether some resources should be allocated by government to a specific project or policy or not. Ex post CBA is on the other hand conducted at the end of a project when all costs have already been used up to do the project. Other types of CBA are In medias res CBA, which is performed during the lifetime of a project, and a CBA that compares ex ante and ex post (or in medias res) CBA.
According to Boardman (2011), the major steps of CBA are the following.1. Specify the set of alternative projects.
2. Decide whose benefits and costs count (standing).
3. Identify the impact categories, catalogue them, and select measurement indicators.
4. Predict the impacts quantitatively over the life of the project.
5. Monetize (attach values in a given currency to) all impacts.
6. Discount benefits and costs to obtain present values.
7. Compute the net present value of each alternative.
8. Perform sensitivity analysis.
9. Make a recommendation.

83COST BENEFIT ANALYSIS
7.1.2. Net Present ValueLike stated in the steps of CBA above, computing the net present value (NPV) of each alternative is one of the many steps of CBA. The NPV of a given project is defined as the sum of the present values of the individual cash flows over the project time period (Sayadi et al. 2014). It is a known method to prove the effectiveness of project evaluations (Brigham & Houston, 2009). Present value is given with Equation 1, where future benefits and costs are discounted in order to obtain their present values (Boardman, 2011).
(1)PV = nFVn(1+r)
PV stands for the present value, FV stands for the future value, r stands for the discount rate and n stand for the amount of periods.
The need to discount benefits and costs arises mainly because of two reasons. One reason is that there is an opportunity cost to the resources used in the vproject. The other reason is that most people prefer to consume now rather than later. Monetary values that we get today are therefore more valuable to us than the monetary values we receive in the future. The choice of the appropriate discount rate can be complex. It is therefore common to perform a sensitivity analysis using different discount rates to see how they affect the result of the analysis (Boardman, 2011). The relationship between present value, the discount rate and time can be seen on Figure 29.
7. COST BENEFIT ANALYSIS
79
evaluations (Brigham & Houston, 2009). Present value is given with Equation 1, where future benefits and costs are discounted in order to obtain their present values (Boardman, 2011).
(1)
PV stands for the present value, FV stands for the future value, r stands for the discount rate and n stand for the amount of periods. The need to discount benefits and costs arises mainly because of two reasons. One reason is that there is an opportunity cost to the resources used in the project. The other reason is that most people prefer to consume now rather than later. Monetary values that we get today are therefore more valuable to us than the monetary values we receive in the future. The choice of the appropriate discount rate can be complex. It is therefore common to perform a sensitivity analysis using different discount rates to see how they affect the result of the analysis (Boardman, 2011). The relationship between present value, the discount rate and time can be seen on Figure 29.
Figure 29: Relationship between present value, discount rate and time. According to Brigham & Houston (2009) the steps of the NPV method are the following.
1. Find the present value of each cash flow, including both inflows and outflows, discounted at the project-s cost of capital.
2. Sum these discounted cash flows; this sum is defined as the project’s NPV. If the NPV is positive, the project should be accepted, while if the NPV is negative, it should be rejected. If two projects with positive NPV‘s are mutually exclusive, the one with the higher NPV should be chosen.
PV = nFVn(1+r)
0
20
40
60
80
100
0 2 4 6 8 10
PRESEN
TVAL
UEOF1
00USD
PERIODS
i=0% i=5% i=10% i=15%
Figure 29: Relationship between present value, discount rate and time.
According to Brigham & Houston (2009) the steps of the NPV method are the following. 1. Find the present value of each cash flow, including both inflows and outflows, discounted
at the project-s cost of capital.
2. Sum these discounted cash flows; this sum is defined as the project’s NPV.
If the NPV is positive, the project should be accepted, while if the NPV is negative, it should

84 PIPE
be rejected. If two projects with positive NPV‘s are mutually exclusive, the one with the higher NPV should be chosen.
7.1.3. InflationIf a financial analysis measures revenues, expenditures, net income, assets, liabilities and cash flows in terms of historical monetary units, the units are referred to as nominal dollars. The decline in the purchasing power of a dollar due to price inflation can be accounted for by converting nominal dollars to real dollars. This is done by deflating nominal dollars (Boardman, 2011).
Numbers of possible deflators exist. The most common one is based on the market price of a basket of goods and services purchased by consumers, that is, consumer prices. For this, the Consumer Price Index (CPI) deflator is most commonly used in the U.S. Another deflator is the Gross Domestic Product (GDP). This deflator is broader than the CPI and reflects the price of all goods and services in the economy, including the public sector. Whether to use the CPI or the GDP depends on whether the impacts of the project are concentrated on only consumers or are much broader. Just like analysts can work with either nominal or real dollars, they can use either a nominal or a real discount rate. A general rule is that if benefits and costs are measured in nominal dollars, the discount rate used should also be nominal. The same goes if benefits and costs are measured in real dollars, then the discount rate used should be real. Both methods result in the same numerical answer.
In the private sector, it is more natural to express all benefits and costs in nominal dollars and therefore use a nominal discount rate. In the public sector, it is however more appealing to use real dollars and a real discount rate.
7.2. MethodsThis analysis is conducted for the primary and the secondary producer. All relevant information was gathered from those companies. Information was also gathered through a survey that was sent to numerous fish processing companies in the Nordic countries as well as through an interview with one of the leading suppliers of high performance fish feed for salmon and trout. More detailed information about how both the market and cost-benefit analyses will be performed can be found below.
7.2.1. Market AnalysisTwo different kinds of market analyses were conducted; one for the fish processing industry and one for the fish feed industry.
1. Fish processing industry A survey was constructed and sent to a large number of fish processing companies in the Nordic countries. In this survey, a series of questions were asked, most with the objective to look into the participants’ current processes regarding wastewater treatment and to explore whether there is interest of implementing more advanced processes. Google Docs was used as a platform for the survey.
2. Fish feed industry An interview was taken with one of the leading suppliers of high performance fish feed to the aquaculture industry. The interview was taken through phone. The questions of the interview aimed to look into the company’s requirements regarding feed ingredients and explore whether there is demand for specific proteins and lipids from marine sources in fish feed industry companies.

85COST BENEFIT ANALYSIS
The main focus of the market analysis was put on the potential customers of the technology in question in this project. The analysis also gave valuable input about how well the technology will have to function to yield feed ingredients that have good market potential.
7.2.2. Cost-Benefit AnalysisThe cost benefit analysis was conducted irrespective of the applicability of the technology. This is an illustration of the cost benefit for a new technology such as ceramic membranes if they had to be implemented on site, and is an Ex ante CBA. Nominal dollars were used to explain costs and benefits and a nominal discount rate was used. The result of the analysis showed if the implementation of the new technology was feasible or not before tax. (profitability before tax). The time frame of the project is considered to be 5 years, as that is the estimated life time of the technology. The analysis was performed by using Equations 2 – 5 for both primary and secondary producers.
7. COST BENEFIT ANALYSIS
81
an Ex ante CBA. Nominal dollars were used to explain costs and benefits and a nominal discount rate was used. The result of the analysis showed if the implementation of the new technology was feasible or not before tax. (profitability before tax). The time frame of the project is considered to be 5 years, as that is the estimated life time of the technology. The analysis was performed by using Equations 2 – 5 for both primary and secondary producers.
(2)
(3)
NPV = PV(B) – PV(C) (3)
Equation 2 describes the present value of the benefits in the life time of the equipment needed (5 years) while Equation 3 described the present value of the costs in the same period. Equation 3 then describes how the net present value of the project is computed out of the present values of the benefits and costs. The analysis was built on information about the types of process waters/brines and their yearly amount in the two companies. The average protein and lipid content in these brines was used to calculate expected yearly revenue, depending on protein and lipid value. The equipment needed was listed up along with costs allocated to its purchase and operation. Other benefits and possible costs are discussed as well. Three different discount rates were used to compute the net present values. A sensitivity analysis was performed by making a graph that shows how the result of the project changes when the discount rates are altered. In addition to the three different discount rates, two more extreme discount rates were included in this graph to show the sensitivity of the result even better.
PV (B) = tB(1+ r)tt=0
5
∑
PV (C) = tC(1+ r)tt=0
5
∑
Equation 2 describes the present value of the benefits in the life time of the equipment needed (5 years) while Equation 3 described the present value of the costs in the same period. Equation 3 then describes how the net present value of the project is computed out of the present values of the benefits and costs. The analysis was built on information about the types of process waters/brines and their yearly amount in the two companies. The average protein and lipid content in these brines was used to calculate expected yearly revenue, depending on protein and lipid value. The equipment needed was listed up along with costs allocated to its purchase and operation. Other benefits and possible costs are discussed as well. Three different discount rates were used to compute the net present values. A sensitivity analysis was performed by making a graph that shows how the result of the project changes when the discount rates are altered. In addition to the three different discount rates, two more extreme discount rates were included in this graph to show the sensitivity of the result even better.
7.3. Results & Discussion7.3.1. Market Analysis7.3.1.1. Fish processing industryA survey was conducted in January and February 2015 to research the market for the new technology. An online questionnaire was sent out to approximately 500 fish processing companies from Denmark, Iceland, Norway and Sweden with the help of Google Docs. Total answers received were 27. The objective of the survey was to look into current processes regarding wastewater treatment in the Nordic countries. Furthermore, the objective was to explore if there is interest for a technology that would lower COD/BOD more efficiently than the technology the companies have in place today and potentially allow reuse of water. The questions of the survey can be found in Appendix A.
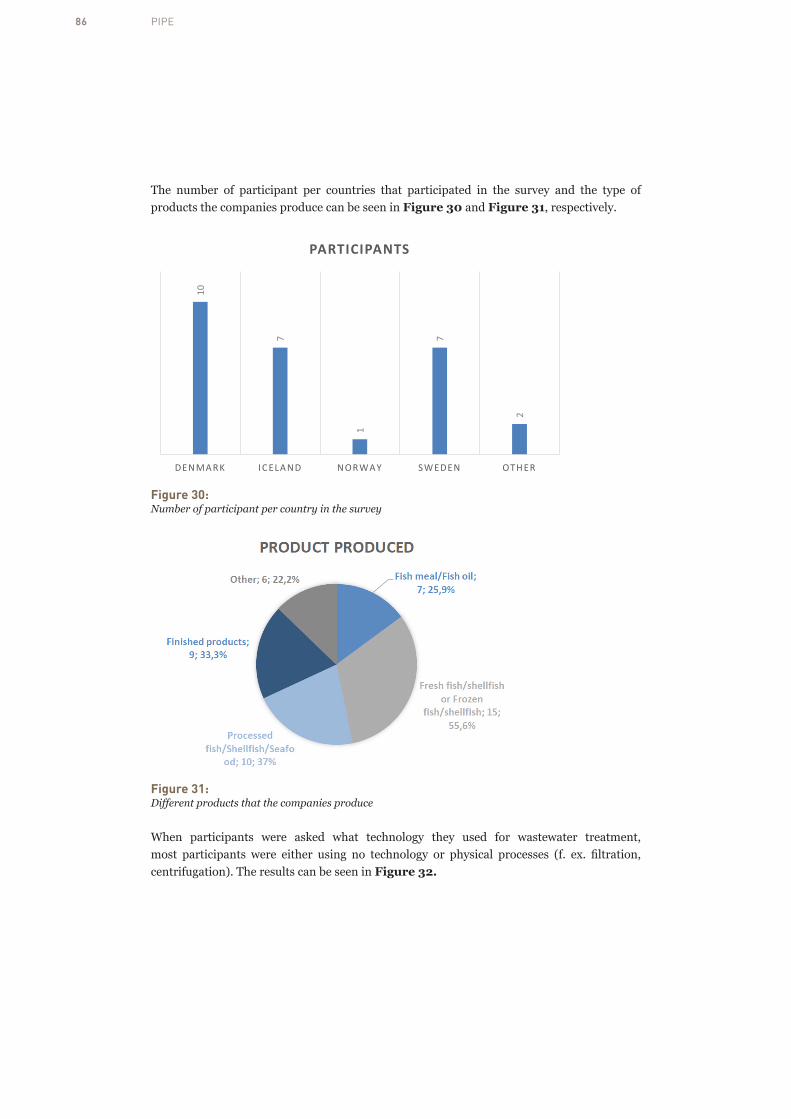
86 PIPE
The number of participant per countries that participated in the survey and the type of products the companies produce can be seen in Figure 30 and Figure 31, respectively.
7. COST BENEFIT ANALYSIS
82
7.3 Results & Discussion
7.3.1 Market Analysis
7.3.1.1 Fish processing industry A survey was conducted in January and February 2015 to research the market for the new technology. An online questionnaire was sent out to approximately 500 fish processing companies from Denmark, Iceland, Norway and Sweden with the help of Google Docs. Total answers received were 27. The objective of the survey was to look into current processes regarding wastewater treatment in the Nordic countries. Furthermore, the objective was to explore if there is interest for a technology that would lower COD/BOD more efficiently than the technology the companies have in place today and potentially allow reuse of water. The questions of the survey can be found in Appendix A. The number of participant per countries that participated in the survey and the type of products the companies produce can be seen in Figure 30 and Figure 31, respectively.
Figure 30: Number of participant per country in the survey
10
7
1
7
2
DENMARK ICELAND NORWAY SWEDEN OTHER
PARTICIPANTS
Figure 30: Number of participant per country in the survey
Figure 31: Different products that the companies produce
When participants were asked what technology they used for wastewater treatment, most participants were either using no technology or physical processes (f. ex. filtration, centrifugation). The results can be seen in Figure 32.

87COST BENEFIT ANALYSIS
Figure 32: Technologies used by participants for wastewater treatment
As can be seen, 88,8% of the participants are either using no technology or physical processes (f. ex. filtration, centrifugation). Only 3,7% of participants said that they were using advanced processes (f. ex. electrochemistry, membrane filtration). This clearly shows that there is room for improvement.
Answers were a little bit diversified when participants were asked if they would be interested in a technology for wastewater treatment that would lower COD/BOD more efficiently than the solution they already have in place today. The results can be seen in Figure 33.
Figure 33: Interest in a technology that lowers COD/BOD levels
As can be seen in the figure, 44,4% said they were either interested or very interested in the technology but 33,3% were either not interested or not interested at all. The result is still

88 PIPE
rather positive for the new technology, given that it has not been introduced or promoted yet. Similar results were obtained when participants were asked if they would be interested in a technology for wastewater treatment that would allow reuse of water. The results can be seen in Figure 34.
Figure 34: Interest in a technology that allows reuse of water
7. COST BENEFIT ANALYSIS
86
Figure 35: Interest depending on country of origin The survey revealed that 48,1% were either interested or very interested in the technology while 29,6% were either not interested or not interested at all. The results of the two questions depending on the country of origin of the participants can be seen in Figure 35.
As can be seen in the figure, very good results were obtained from Norway, displayed in light grey. As there is only one participant from Norway, this can however not be considered significant. Participants from Sweden, displayed in dark blue, were shown to be a little bit more interested in the technologies than participants from other countries, but only two participants say they are not interested in a technology that would lower COD/BOD levels more efficiently and no participant says he/she is not interested in a technology that would allow reuse of water. The results from Denmark and Iceland are well distributed. Table 18 shows what elements the participants think are likely to change in the near future regarding requirements for cleaning wastewater/effluents.
31
42
32
32
3
11
2
1
2
1
1
11
2
2
2
5
2
VER
YIN
TERE
STED
INTE
RES
TED
NEI
THER
IN
TERE
STED
NO
RN
OT
INTE
RES
TED
NO
TIN
TERE
STED
NO
TIN
TERE
STED
AT
ALL
VER
YIN
TERE
STED
INTE
RES
TED
NEI
THER
IN
TERE
STED
NO
RN
OT
INTE
RES
TED
NO
TIN
TERE
STED
NO
TIN
TERE
STED
AT
ALL
L OWER COD/BODMORE E FF I C I ENT LY ALLOWREUSE OF WATER
Denmark Iceland Norway Sweden
Figure 35: Interest depending on country of origin
The survey revealed that 48,1% were either interested or very interested in the technology while 29,6% were either not interested or not interested at all. The results of the two questions depending on the country of origin of the participants can be seen in Figure 35.
As can be seen in the figure, very good results were obtained from Norway, displayed in

89COST BENEFIT ANALYSIS
light grey. As there is only one participant from Norway, this can however not be considered significant. Participants from Sweden, displayed in dark blue, were shown to be a little bit more interested in the technologies than participants from other countries, but only two participants say they are not interested in a technology that would lower COD/BOD levels more efficiently and no participant says he/she is not interested in a technology that would allow reuse of water. The results from Denmark and Iceland are well distributed.
Table 18 shows what elements the participants think are likely to change in the near future regarding requirements for cleaning wastewater/effluents.
Table 18: Elements likely to change in the near future
Not likely at all
Not likely
Neither likely nor not likely
LikelyVery likely
No answer
Environmental pressure from NGO’s 18,5% (5) 25,9% (7) 25,9% (7) 22,2% (6) 3,7% (1) 3,7% (1)
Governmental pressure 22,2% (6) 18,5% (5) 18,5% (5) 37% (10) 0% (2) 3,7% (1)
Development of new markets 22,2% (6) 18,5% (5) 40,7% (11) 11,1% (3) 7,4% (2) 3,7% (1)
Economic values 18,5% (5) 14,8% (4) 22,2% (6) 33,3% (9) 7,4% (2) 3,7% (1)
Consumer views 22,2% (6) 14,8% (4) 11,1% (3) 48,1% (13) 0% (0) 3,7% (1)
Image of the company 14,8% (4) 11,1% (3) 25,9% (7) 40,7% (11) 3,7% (1) 3,7% (1)
Retailer requirements 18,5% (5) 14,8% (4) 25,9% (7) 29,6% (8) 7,4% (2) 3,7% (1)
The following elements scored the highest for either likely or very likely and are therefore, according to the participants, are most likely to change in the near future regarding requirements for cleaning wastewater/effluents. • 48,1% said it would be likely that consumer views would change the requirements
• 44,4% said that it would be either likely or very likely that the image of the company would change the requirements
• 40,7% said that it was either likely or very likely that economic value would change the requirements
• 37% said that it would be likely or very likely that retailer requirements would change the requirements
• 37% said that it was likely that government pressure would change the requirements for cleaning wastewater/effluents
When participants were asked if they were willing to invest to keep a low environmental impact, 51,8% said that they were either willing or very willing to. In regards to what would be the maximum investment they were ready to make to save 1 million NOK a year, 48,1% said that they were ready to spend 1 to 3 million NOK. The results can be seen in Figure 36 and Figure 37.

90 PIPE
Figure 36: The participants’ willingness to invest to keep a low environmental profile
Figure 37: Maximum investment the participants are willing to make to save 1 million NOK a year
Participants were finally asked if they were to implement a new technology for wastewater treatment, would a few given elements be a challenge. The results can be seen in Table 19.
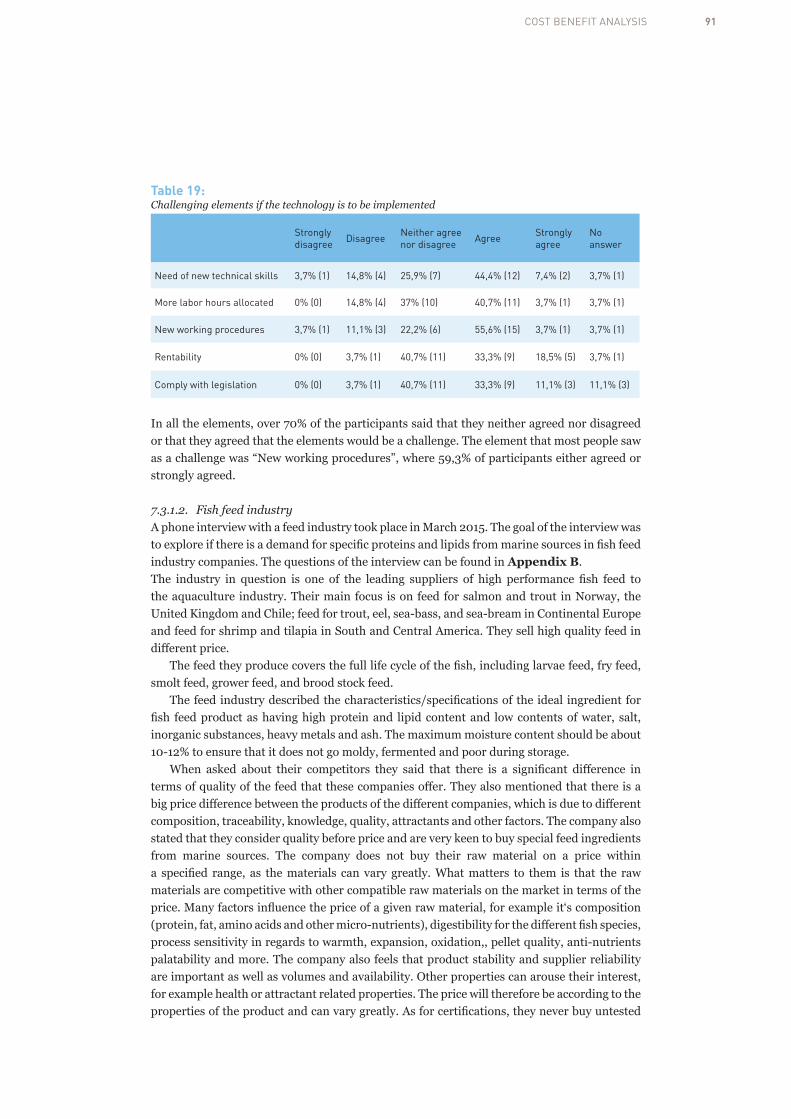
91COST BENEFIT ANALYSIS
Table 19: Challenging elements if the technology is to be implemented
Strongly disagree Disagree Neither agree
nor disagree Agree Strongly agree
No answer
Need of new technical skills 3,7% (1) 14,8% (4) 25,9% (7) 44,4% (12) 7,4% (2) 3,7% (1)
More labor hours allocated 0% (0) 14,8% (4) 37% (10) 40,7% (11) 3,7% (1) 3,7% (1)
New working procedures 3,7% (1) 11,1% (3) 22,2% (6) 55,6% (15) 3,7% (1) 3,7% (1)
Rentability 0% (0) 3,7% (1) 40,7% (11) 33,3% (9) 18,5% (5) 3,7% (1)
Comply with legislation 0% (0) 3,7% (1) 40,7% (11) 33,3% (9) 11,1% (3) 11,1% (3)
In all the elements, over 70% of the participants said that they neither agreed nor disagreed or that they agreed that the elements would be a challenge. The element that most people saw as a challenge was “New working procedures”, where 59,3% of participants either agreed or strongly agreed.
7.3.1.2. Fish feed industryA phone interview with a feed industry took place in March 2015. The goal of the interview was to explore if there is a demand for specific proteins and lipids from marine sources in fish feed industry companies. The questions of the interview can be found in AppendixB.The industry in question is one of the leading suppliers of high performance fish feed to the aquaculture industry. Their main focus is on feed for salmon and trout in Norway, the United Kingdom and Chile; feed for trout, eel, sea-bass, and sea-bream in Continental Europe and feed for shrimp and tilapia in South and Central America. They sell high quality feed in different price.
The feed they produce covers the full life cycle of the fish, including larvae feed, fry feed, smolt feed, grower feed, and brood stock feed.
The feed industry described the characteristics/specifications of the ideal ingredient for fish feed product as having high protein and lipid content and low contents of water, salt, inorganic substances, heavy metals and ash. The maximum moisture content should be about 10-12% to ensure that it does not go moldy, fermented and poor during storage.
When asked about their competitors they said that there is a significant difference in terms of quality of the feed that these companies offer. They also mentioned that there is a big price difference between the products of the different companies, which is due to different composition, traceability, knowledge, quality, attractants and other factors. The company also stated that they consider quality before price and are very keen to buy special feed ingredients from marine sources. The company does not buy their raw material on a price within a specified range, as the materials can vary greatly. What matters to them is that the raw materials are competitive with other compatible raw materials on the market in terms of the price. Many factors influence the price of a given raw material, for example it‘s composition (protein, fat, amino acids and other micro-nutrients), digestibility for the different fish species, process sensitivity in regards to warmth, expansion, oxidation,, pellet quality, anti-nutrients palatability and more. The company also feels that product stability and supplier reliability are important as well as volumes and availability. Other properties can arouse their interest, for example health or attractant related properties. The price will therefore be according to the properties of the product and can vary greatly. As for certifications, they never buy untested

92 PIPE
materials and more documentation with the materials, the better.They describe the whole market for proteins, lipids and special feed ingredients as a
growing market. The demand for these ingredients is increasing due to the fact that people are eating more fish, especially farmed fish. Finally, the company was asked if they would consider buying proteins, lipids and special ingredients from a new supplier (if there are some hurdles, switching costs, long-term contracts, friendship or other factors that could affect the decision). They replied positively, if the price and quality was right
7.3.2. Cost-Benefit Analysis7.3.2.1. Cost & benefitThe costs and benefits that were considered in this analysis can be seen in Table 20.
Table 20: Costs and benefits of the technologyCosts (USD) Benefits (USD)Fixed capital costs Market and revenue growth
- Buffer tank - Selling lipids
- Flotation unit - Selling proteins
- Filtering unit* Reuse of water
Working capital Tax savings
- Maintenance
- Energy cost
- Chemicals (NaOH, HNO3)
- Labor cost
*Includes 2 membranes
To implement the technology, purchase of a buffer tank, flotation unit and filtering unit is needed. The filtering unit includes two membranes. Costs because of renovation of membranes will not be considered as the two membranes last throughout the life time of the unit, which is 5 years. Yearly costs are maintenance of the equipment, energy cost, chemicals needed and labor cost.
The primary benefit of implementing the solution is the market and revenue growth due to sale of the lipids and proteins obtained. Other benefits that can be mentioned but can vary a lot between companies are benefits because of reuse of water and tax savings.
In addition to the benefits mentioned above, the following intangible benefits need to be considered:• Enhanced customer confidence/trust
• Company reputation – environmental impacts
• Company reputation – social impacts
• Company reputation – economic impacts
The costs and benefits of implementing the new technology will be explained in more detail below.
AssumptionsThe calculations were based on the following assumptions:• A discount rate of 3% was used for the base-case option as that was the average discount
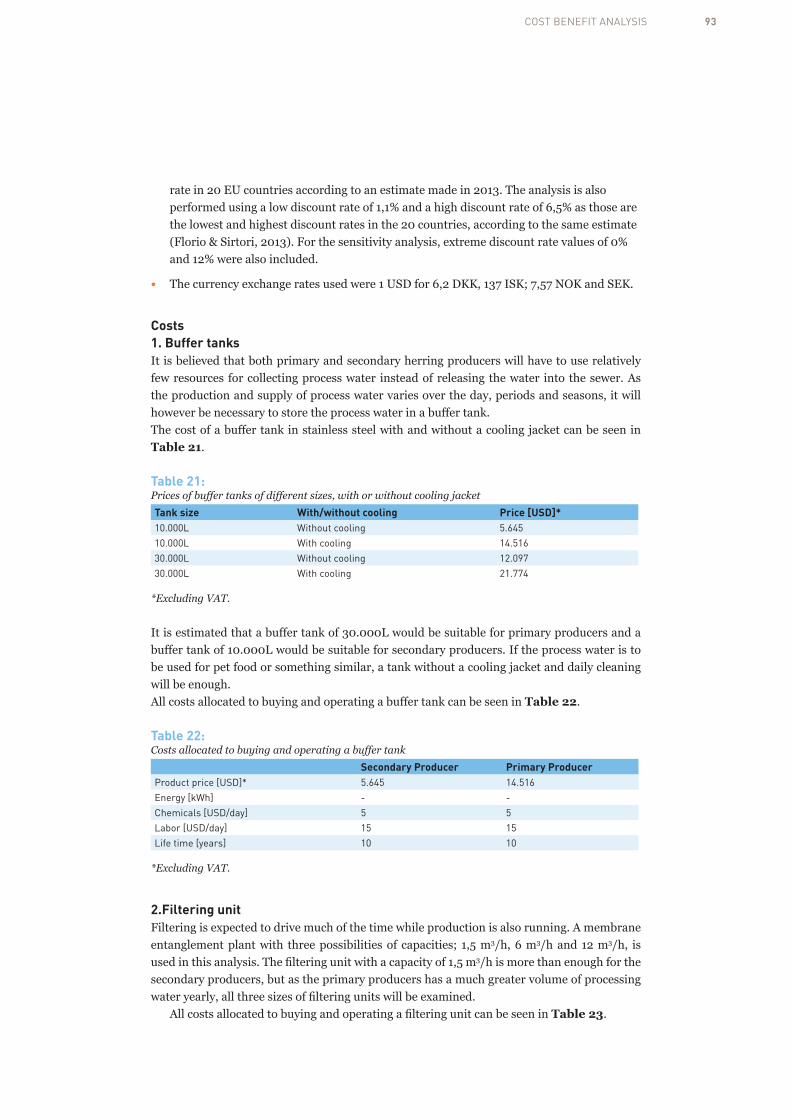
93COST BENEFIT ANALYSIS
rate in 20 EU countries according to an estimate made in 2013. The analysis is also performed using a low discount rate of 1,1% and a high discount rate of 6,5% as those are the lowest and highest discount rates in the 20 countries, according to the same estimate (Florio & Sirtori, 2013). For the sensitivity analysis, extreme discount rate values of 0% and 12% were also included.
• The currency exchange rates used were 1 USD for 6,2 DKK, 137 ISK; 7,57 NOK and SEK.
Costs1. Buffer tanksIt is believed that both primary and secondary herring producers will have to use relatively few resources for collecting process water instead of releasing the water into the sewer. As the production and supply of process water varies over the day, periods and seasons, it will however be necessary to store the process water in a buffer tank.The cost of a buffer tank in stainless steel with and without a cooling jacket can be seen in Table 21.
Table 21: Prices of buffer tanks of different sizes, with or without cooling jacketTank size With/without cooling Price [USD]*10.000L Without cooling 5.645
10.000L With cooling 14.516
30.000L Without cooling 12.097
30.000L With cooling 21.774
*Excluding VAT.
It is estimated that a buffer tank of 30.000L would be suitable for primary producers and a buffer tank of 10.000L would be suitable for secondary producers. If the process water is to be used for pet food or something similar, a tank without a cooling jacket and daily cleaning will be enough. All costs allocated to buying and operating a buffer tank can be seen in Table 22.
Table 22: Costs allocated to buying and operating a buffer tank
Secondary Producer Primary ProducerProduct price [USD]* 5.645 14.516
Energy [kWh] - -
Chemicals [USD/day] 5 5
Labor [USD/day] 15 15
Life time [years] 10 10
*Excluding VAT.
2.Filtering unitFiltering is expected to drive much of the time while production is also running. A membrane entanglement plant with three possibilities of capacities; 1,5 m3/h, 6 m3/h and 12 m3/h, is used in this analysis. The filtering unit with a capacity of 1,5 m3/h is more than enough for the secondary producers, but as the primary producers has a much greater volume of processing water yearly, all three sizes of filtering units will be examined.
All costs allocated to buying and operating a filtering unit can be seen in Table 23.

94 PIPE
Table 23: Costs allocated to buying and operating a filtering unit
Primary/Secondary Producers Option 1
Primary Producers Option2
Primary Producers Option 3
Product price [USD]* 83.871 201.613 403.226
Energy [kWh] 0,62 20 40
Chemicals [USD/day] 3 12 24
Labor [USD/day] 30 30 30
Life time 5 years 5 years 5 years
*Excluding VAT.
3. Flotation unitIn order to obtain useful filtering, it would be necessary to have a flotation unit with microbubbles. This unit would also help to avoid clogged filters later on in the process. The flotation unit will, just like the filtering unit, have three possibilities of capacities; 1,5 m3/h, 6 m3/h and 12 m3/h.
The system is based on the physical removal of fat, protein, etc. from liquids. The unit is a standard flotation unit which removes especially suspended solids, oil/grease. The microbubbles stick to the particles and bring them to the surface, from which they are skimmed off. There is a scraper at the top which skims the surface of the water for the “sludge” and moves it in a thickened state into a hopper. The chain drive is self-lubricating and maintenance free. The microbubbles are formed with help from a special dispersant water pump and a self-cleaning nozzle.
All costs allocated to buying and operating a flotation unit can be seen in Table 24. Prices were obtained for flotation units with the capacities of 1,5 m3/h and 6 m3/h. The increase in price between flotation units with the capacities of 6 m3/h and 12 m3/h is assumed to be in accordance to the increase in price between the smaller two. Energy consumption and chemical use are expected to increase in accordance to the increase of the same elements in the filtering unit.
Table 24: Costs allocated to buying and operating a flotation unit
Primary/Secondary Producers Option 1
Primary Producers Option2
Primary Producers Option 3
Product price [USD]* 20.806 25.607 32.008
Energy [kWh] 0,44 14 28
Chemicals [USD/day] 3 12 24
Labor [USD/day] 15 15 15
Life time 5 years 5 years 5 years
*Excluding VAT.
4. MaintenanceAnother cost that needs to be considered is the maintenance cost of the equipment. The maintenance cost was estimated as 5% of the fixed capital investment. The yearly maintenance for the producers can be seen in Table 25.

95COST BENEFIT ANALYSIS
Table 25: Maintenance costs
Secondary Producer
Primary Producer Option 1
Primary Producer Option 2
Primary Producer Option 3
Maintenance [USD/year] 5.516 5.960 13.307 25.889
5. Costs not considered in the projectA cost that needs to be mentioned is the implementation cost of the new technology. The implementation cost includes installation of the new equipment, staff training and learning of new practices. This cost can differentiate a lot between companies, depending on their current processes, and is also very small in comparison with other costs. It will therefore not be included in the analysis.
Depreciation will not be considered in this project. The objective of the project is to see the profitability of the implementation of technology in a 5 year period, which is the lifetime of the machines. If a company is to continue using the technology, the fact that all equipment needs to be renewed after the 5 years needs to be considered. Other costs that may incur are costs because of pumps, rotary filters and other accessories. These costs are not considered as they are very uncertain and vary between the current equipment of the company and where the companies will place their equipment.
Benefits1. Revenue growthLike stated before, food manufacturers with the correct purification technologies along with good hygiene and storage facilities have the opportunity to sell their filtrate to all industries. It can be energy consuming for the buyer to remove water from a given raw material and it is therefore of great importance that the purification technologies produce a product with low water content. Protein and lipid content should be high and the water content should be minimal (Østerberg, 2014).
Protein prices in the right quality can achieve rates of up to 16 USD/kg. In order to achieve such high rates, it is important that the amino acid profile and the content of leucine, lysine, valine, alanine, aspartic acid and aspargine, glutamic acid and glutamine and glycine is right. Lipid prices can reach to rates of up to 6-7 USD/kg of fish oil (Østerberg, 2014). For fish oil, it is important that the content of EPA and DHA are in large quantities and good conditions. According to Triple 999 producer of fishmeal and oil, it will be too costly and therefore not profitable to concentrate a final product like the one in question in this project due to high water content. An employee from a fish meal factory stated that they drain their fish stored in RSW and get rid of the water. He further states that the company would not use liquids with such a low content of protein and lipid like in the end product in question in this project. According this fish meal factory, the use of raw fish is the best way to achieve a product that has high content of amino acid, fatty acid and protein and does not cost much in processing.
It can be said with almost full certainty that equipment will be available in the future that will allow better concentration of proteins and lipids from herring brine. Only then will it be possible to obtain a final product that will be of interest to the market. In this analysis however, an assumption has been made that this equipment exists today and all calculations are based on that assumption.
According to both Triple 999 and the Globe Fish Organization (Østerberg, 2014), the value of protein and lipid is about 1.800 USD/ton for fish meal and 1800-2000 USD/ton for fish

96 PIPE
oil. Triple 999 fish meal with 76% protein has a retail price of 1,8 USD/kg. This gives a protein price of approximately 2,2 USD/kg for the crude protein and a price around 1,8 USD/kg for the lipid.
Based on the values given above, the value of protein and lipid in the herring processing water for the primary and the secondary producers were calculated. The resulting values can be seen in Table 26 and Table 27, respectively.
Table 26: Value of protein and lipid per m3 for secondary herring producers
Tsa DTsa SC VCAmount per. year [m3] 52,5 135 40 80
Total value [USD] 922,1 8.205,3 3.922,4 323,2
Value per. m3 [USD/m3] 17,6 60,8 98,1 4,0
Table 27: Value of protein and lipid per m3 for primary herring producers
RSW SW PW SBAmount per. year [m3] 10.000 2.150 20.000 2.500
Total value [USD] 18.100 42.979,4 156.000 132.850
Value per. m3 [USD/m3] 1,81 20,0 7,8 53,1
2. Water reuseAdditional income can be earned by reusing some of the water used in production, for example for manufacturing or cleaning purposes. However, this requires really good filtering and export of mass balances. If reusing water for other purposes than manufacturing or cleaning, it is important to pay attention to food safety and possible taste changes that can occur when recycling brines. The water prices in Denmark, Iceland, Norway and Sweden can be seen in Table 28 (Orkuveita Reykjavíkur, 2015).
Table 28: Water prices in Denmark, Iceland, Norway and Sweden.Country Water price [USD/m3]Denmark 1,6
Iceland 0,22
Norway 1,38
Sweden 1,13
For the secondary producers the best suited water type for reuse is the desalting brine e.i. DTsa. For the primary producers the Process water (PW) is likely to be filtered well enough to be reusable. Better filtering would however be required so that the Storage water (SW) and Salt brine (SB) would be reusable.
Based on the water prices provided above, the possible yearly savings due to water reuse in for the producers in the four different countries can be seen in Table 29.

97COST BENEFIT ANALYSIS
Table 29: Possible savings because of reuse of water and no taxes for disposal.
Company/ (Water type)
Country Amount water [m3]
Water price [USD/m3]
Water price savings [USD]
Secondary Producers (DTSa) Denmark 135 1,6 216
Iceland 0,22 29,7
Norway 1,38 186,3
Sweden 1,12 151,2
Primary Producers(PW)
Denmark 20.000 1,6 32.000
Iceland 0,22 4.400
Norway 1,38 27.600
Sweden 1,13 22.600
3. Tax benefitsIn many countries, taxes need to be paid for disposing of water with high organic levels. High monetary values can therefore be saved by filtrating wastewater before disposing of it. The discharging duties in Denmark, Iceland, Norway and Sweden can be seen in Table 30 (Østerberg, 2014).
Table 30: Taxes for disposal of water in Denmark, Iceland, Norway and Sweden.
Country Tax [USD/m3]
Denmark 7,5
Iceland 0
Norway 1,84
Sweden 7,4
Based on the discharging duties provided above, the possible yearly savings for the producers in one of the four different countries can be seen in Table 31.
Table 31: Possible savings because of reuse of water and no taxes for disposal.
Company Country Amount water [m3]
Tax [USD/m3] Tax savings [USD]
Secondary Producers Denmark 235,5 7,5 1.766,25
Iceland 0 0
Norway 1,84 433,32
Sweden 7,4 1.742,7
Primary Producers Denmark 34.650 7,5 259.875
Iceland 0 0
Norway 1,84 63.756
Sweden 7,4 256.410

98 PIPE
4. Intangible benefits Even though it is hard to convert the intangible benefits into monetary values, they can bring great benefits to the companies and therefore need to be considered. Like mentioned before, the intangible benefits that are considered likely to arise in this project are the following:• Enhanced customer confidence/trust
• Company reputation – environmental impacts
• Company reputation – social impacts
• Company reputation – economic impacts
In the survey sent to fish industries in the Nordic countries, one question had the objective to find out which intangible benefits the participants thought implementing a new technology for wastewater treatment would result in.
Table 32: Survey results for the intangible benefitsIntangible benefit Strongly
disagreeDisagree Neither agree
nor disagreeAgree Strongly
agreeNo answer
Enhanced customer confidence/trust
3,7% (1) 3,7% (1) 40,7% (11) 40,7% (11) 7,4% (2) 3,7% (1)
Improved reputation of your company because of lower environmental impacts
3,7% (1) 7,4% (2) 29,6% (0) 44,4% (12) 7,4% (2) 7,4% (2)
Improved reputation of your company because of better social impacts
3,7% (1) 11,1% (3) 48,1% (13) 25,9% (7) 7,4% (2) 3,7% (1)
Improved reputation of your company because of enhanced revenue
0% (0) 11,1% (3) 44,4% (12) 33,3% (9) 7,4% (2) 3,7% (1)
Table 32 shows that 33,3 – 51,8% of the participants either agree or strongly agree that the different intangible benefits would arise in their company if a new technology for wastewater treatment would be implemented. Improved reputation because of lower environmental impacts is considered the most likely benefit, where 51,8% of the participants either agreed or strongly agreed.
Another fact that draws attention is that only 7,4 – 14,8% of the participants actually disagree or strongly disagree that any of the different intangible benefits would arise in their company if a new technology for wastewater treatment would be implemented. This means that most of the participants that did not agree either had no opinion or did not answer the question.
7.3.2.2. AnalysisIn the analysis, two net present values were computed. Both included all costs but the former one only included the benefits from the revenue of sold proteins and lipids. The benefits of both tax savings and reuse of water were not included here because of great variation of the benefits between companies. Like stated before, around 55,6% of the companies that responded to the survey have already implemented some kind of technology for wastewater treatment. This treatment may be lowering the COD/BOD levels in their wastewater and the company may
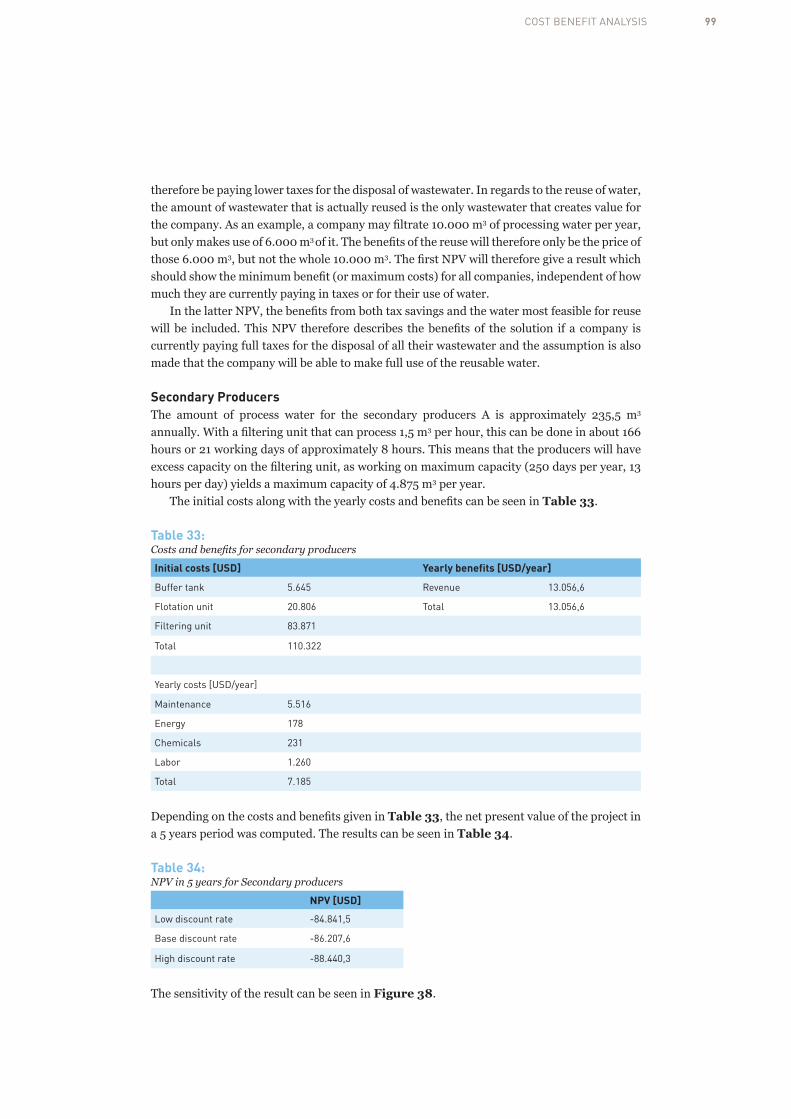
99COST BENEFIT ANALYSIS
therefore be paying lower taxes for the disposal of wastewater. In regards to the reuse of water, the amount of wastewater that is actually reused is the only wastewater that creates value for the company. As an example, a company may filtrate 10.000 m3 of processing water per year, but only makes use of 6.000 m3 of it. The benefits of the reuse will therefore only be the price of those 6.000 m3, but not the whole 10.000 m3. The first NPV will therefore give a result which should show the minimum benefit (or maximum costs) for all companies, independent of how much they are currently paying in taxes or for their use of water.
In the latter NPV, the benefits from both tax savings and the water most feasible for reuse will be included. This NPV therefore describes the benefits of the solution if a company is currently paying full taxes for the disposal of all their wastewater and the assumption is also made that the company will be able to make full use of the reusable water.
Secondary ProducersThe amount of process water for the secondary producers A is approximately 235,5 m3 annually. With a filtering unit that can process 1,5 m3 per hour, this can be done in about 166 hours or 21 working days of approximately 8 hours. This means that the producers will have excess capacity on the filtering unit, as working on maximum capacity (250 days per year, 13 hours per day) yields a maximum capacity of 4.875 m3 per year.
The initial costs along with the yearly costs and benefits can be seen in Table 33.
Table 33: Costs and benefits for secondary producers
Initial costs [USD] Yearly benefits [USD/year]
Buffer tank 5.645 Revenue 13.056,6
Flotation unit 20.806 Total 13.056,6
Filtering unit 83.871
Total 110.322
Yearly costs [USD/year]
Maintenance 5.516
Energy 178
Chemicals 231
Labor 1.260
Total 7.185
Depending on the costs and benefits given in Table 33, the net present value of the project in a 5 years period was computed. The results can be seen in Table 34.
Table 34: NPV in 5 years for Secondary producers
NPV [USD]
Low discount rate -84.841,5
Base discount rate -86.207,6
High discount rate -88.440,3
The sensitivity of the result can be seen in Figure 38.

100 PIPE
7. COST BENEFIT ANALYSIS
98
The sensitivity of the result can be seen in Figure 38.
Figure 38: Sensitivity of the NPV for secondary producers Benefits because of tax savings and reuse of water can be seen in Table 35. For the secondary producer, the best suited water type for reuse is the desalting brine (DTSa) and it is therefore assumed that only the desalting brine will be reused.
Table 35: Other benefits for secondary producers Other benefits [USD/year] Denmark Iceland Norway Sweden Water reuse 216 29,6 186,3 152,6 Tax savings 1.766,3 0 433,3 1.742,7 Total 1.982,3 29,6 619,6 1.895,3
The second NPV, now including the benefits because of water reuse and tax savings, can be seen in Table 36.
Table 36: NPV in 5 years for secondary producer, including tax and water reuse benefits
NPV [USD] Denmark Iceland Norway Sweden Low discount rate -75.249,1 -84.698,4 -81.843,1 -75.670,1 Base discount rate -77.129,4 -86.072,2 -83.369,9 -77.527,9 High discount rate -80.202,7 -88.317,4 -85.865,3 -80.564,2
The sensitivity of the result can be seen in Figure 39.
-83 994,50
-84 841,49
-86 207,55
-88 440,27
-91 341,05-92 000,00
-91 000,00
-90 000,00
-89 000,00
-88 000,00
-87 000,00
-86 000,00
-85 000,00
-84 000,00
-83 000,000% 2% 4% 6% 8% 10% 12%
NET
PRES
ENT
VALU
E
DISCOUNTRATE
SECONDARYPRODUCER- ONLYREVENUE
Figure 38: Sensitivity of the NPV for secondary producers
Benefits because of tax savings and reuse of water can be seen in Table 35. For the secondary producer, the best suited water type for reuse is the desalting brine (DTSa) and it is therefore assumed that only the desalting brine will be reused.
Table 35: Other benefits for secondary producersOther benefits [USD/year] Denmark Iceland Norway SwedenWater reuse 216 29,6 186,3 152,6
Tax savings 1.766,3 0 433,3 1.742,7
Total 1.982,3 29,6 619,6 1.895,3
The second NPV, now including the benefits because of water reuse and tax savings, can be seen in Table 36.
Table 36: NPV in 5 years for secondary producer, including tax and water reuse benefitsNPV [USD] Denmark Iceland Norway SwedenLow discount rate -75.249,1 -84.698,4 -81.843,1 -75.670,1
Base discount rate -77.129,4 -86.072,2 -83.369,9 -77.527,9
High discount rate -80.202,7 -88.317,4 -85.865,3 -80.564,2
The sensitivity of the result can be seen in Figure 39.

101COST BENEFIT ANALYSIS
7. COST BENEFIT ANALYSIS
99
Figure 39: Sensitivity of the NPV for secondary producer, including tax and water reuse benefits Judging by the two net present values computed for the secondary producers, it can be seen that implementing the new technology would not be beneficial, even when the possible tax benefits and benefits because of reuse of water are considered. The equipment needed has a yearly capacity of a lot greater volume than that of the secondary producers. If more water would be processed yearly, the company would be more likely to be able to pay up the equipment needed and thus benefit from the technology.
Primary Producers
It is expected that around 34.650 m3 can be filtered for the primary producers on a yearly basis. Three different options were therefore investigated.
1. A filtering unit that filtrates 1,5 m3/h will be used with a maximum capacity of 4.875 m3/year (if filtrated 250 days of the year for 13 hours per day).
2. A filtering unit that filtrates 6 m3/h will be used with a maximum capacity of 19.500 m3/year (if filtrated 250 days of the year for 13 hours per day).
3. A filtering unit that filtrates 12 m3/h will be used with a maximum capacity of 39.000 m3/year (if filtrated 250 days of the year for 13 hours per day).
Option 1: 1,5 m3/h As seen in Table 27 SB gave the highest value per m3, or around 53 USD/m3, and thereafter SW, or around 20 USD/m3. Selecting these waters/brines, the total amount to be filtered will be 4.650 m3 per year, which is under the maximum capacity of 4.875 m3 per year. This can be done in 250 days if filtered for 13 hours a day.
-95 000,00
-90 000,00
-85 000,00
-80 000,00
-75 000,00
-70 000,000% 2% 4% 6% 8% 10% 12%
NET
PR
ESEN
T VA
LUE
DISCOUNT RATE
SECONDARY PRODUCERDenmark Iceland Norway Sweden
Figure 39: Sensitivity of the NPV for secondary producer, including tax and water reuse benefits
Judging by the two net present values computed for the secondary producers, it can be seen that implementing the new technology would not be beneficial, even when the possible tax benefits and benefits because of reuse of water are considered. The equipment needed has a yearly capacity of a lot greater volume than that of the secondary producers. If more water would be processed yearly, the company would be more likely to be able to pay up the equipment needed and thus benefit from the technology.
Primary ProducersIt is expected that around 34.650 m3 can be filtered for the primary producers on a yearly basis. Three different options were therefore investigated.1. A filtering unit that filtrates 1,5 m3/h will be used with a maximum capacity of 4.875 m3/
year (if filtrated 250 days of the year for 13 hours per day).
2. A filtering unit that filtrates 6 m3/h will be used with a maximum capacity of 19.500 m3/year (if filtrated 250 days of the year for 13 hours per day).
3. A filtering unit that filtrates 12 m3/h will be used with a maximum capacity of 39.000 m3/year (if filtrated 250 days of the year for 13 hours per day).
Option 1: 1,5 m3/hAs seen in Table 27 SB gave the highest value per m3, or around 53 USD/m3, and thereafter SW, or around 20 USD/m3. Selecting these waters/brines, the total amount to be filtered will be 4.650 m3 per year, which is under the maximum capacity of 4.875 m3 per year. This can be done in 250 days if filtered for 13 hours a day.
The initial costs along with the yearly costs and benefits can be seen in Table 37.

102 PIPE
Table 37: Costs and benefits for Option 1 primary producersInitial costs [USD] Yearly benefits [USD/year]
Buffer tank 14.516 Revenue 175.829,4
Flotation unit 20.806 Total 175.829,4
Filtering unit 83.871
Total 110.322
Yearly costs [USD/year]
Maintenance 5.960
Energy 3.445
Chemicals 2.750
Labor 15.000
Total 27.155
Depending on the costs and benefits given in Table 37, the net present value of the project in a 5 years period was computed. The results can be seen in Table 38.
Table 38: NPV in 5 years for Option 1 for primary producers
NPV [USD]Low discount rate 513.923,1
Base discount rate 479.980,4
High discount rate 424.503,9
The sensitivity of the result can be seen in Figure 40.
7. COST BENEFIT ANALYSIS
101
Figure 40: Sensitivity of the NPV for Option 1 for the primary producers
Benefits because of tax savings and reuse of water can be seen in Table 39. For the primary producers, the best suited water type for reuse is PW. Better filtering would however be required so that the SW and SB would be reusable. Therefore, there are no benefits because of reuse of water in this option. Like before, the tax benefits differentiate between countries because of different tax levels.
Table 39: Other benefits for option 1 for primary producers
Other benefits [USD/year] Denmark Iceland Norway Sweden Water reuse 0 0 0 0 Tax savings 34.875 0 8.556 34.410 Total 34.875 0 8.556 34.410
The second NPV, now including the benefits because of water reuse and tax savings, can be seen in Table 40.
Table 40: NPV in 5 years for option for primary producers including tax and water reuse benefits
NPV [USD] Denmark Iceland Norway Sweden Low discount rate 682.688,2 513.923,1 555.326,8 680.438,0 Base discount rate 639.697,7 479.980,4 519.164,4 637.568,1 High discount rate 569.433,2 424.503,9 460.059,9 567.500,8
The sensitivity of the result can be seen in Figure 41.
534 968,25
513 923,05479 980,40
424 503,89
352 427,98
300 000,00
350 000,00
400 000,00
450 000,00
500 000,00
550 000,00
0% 2% 4% 6% 8% 10% 12%
NET
PRES
ENT
VALU
E
DISCOUNTRATE
PRIMARYPRODUCERSOPTION1- (REVENUE)
Figure 40: Sensitivity of the NPV for Option 1 for the primary producers
Benefits because of tax savings and reuse of water can be seen in Table 39. For the primary producers, the best suited water type for reuse is PW. Better filtering would however be

103COST BENEFIT ANALYSIS
required so that the SW and SB would be reusable. Therefore, there are no benefits because of reuse of water in this option. Like before, the tax benefits differentiate between countries because of different tax levels.
Table 39: Other benefits for option 1 for primary producersOther benefits [USD/year] Denmark Iceland Norway SwedenWater reuse 0 0 0 0
Tax savings 34.875 0 8.556 34.410
Total 34.875 0 8.556 34.410
The second NPV, now including the benefits because of water reuse and tax savings, can be seen in Table 40.
Table 40: NPV in 5 years for option for primary producers including tax and water reuse benefitsNPV [USD] Denmark Iceland Norway SwedenLow discount rate 682.688,2 513.923,1 555.326,8 680.438,0
Base discount rate 639.697,7 479.980,4 519.164,4 637.568,1
High discount rate 569.433,2 424.503,9 460.059,9 567.500,8
The sensitivity of the result can be seen in Figure 41.
7. COST BENEFIT ANALYSIS
102
Figure 41: Sensitivity of the NPV for option 1 for the primary producers including tax and water reuse benefits Both net present values (NPV) computed for the first option for the primary producer are positive in all countries. In this option, no benefits are received because of reuse of water as the processed water is not suitable for reuse. Benefits because of tax savings are however considered, but the fact that the result is positive without them is very positive for the company.
300 000,00350 000,00400 000,00450 000,00500 000,00550 000,00600 000,00650 000,00700 000,00750 000,00
0% 2% 4% 6% 8% 10% 12%
NET
PR
ESEN
T VA
LUE
DISCOUNT RATE
PRIMARY PRODUCER OPTION 1Denmark Iceland Norway Sweden
Figure 41: Sensitivity of the NPV for option 1 for the primary producers including tax and water reuse benefits
Both net present values (NPV) computed for the first option for the primary producer are positive in all countries. In this option, no benefits are received because of reuse of water as the processed water is not suitable for reuse. Benefits because of tax savings are however considered, but the fact that the result is positive without them is very positive for the company.

104 PIPE
Option 2: 6 m3/hAs can be seen in Table 27, the most valuable brine after the SB and SW is the filleting water PW. With a filtering unit that filtrates 6 m3/h, the maximum capacity is 19.500 m3/year. This will therefore allow for filtrating of the SB, SW and 14.850 m3 of PW. The initial costs along with the yearly costs and benefits for option 2 in for the primary producer can be seen in Table 41.
Table 41: Costs and benefits for option 2 for primary producers
Initial costs [USD] Yearly benefits [USD/year]
Buffer tank 14.516 Revenue 291.659,4
Flotation unit 25.607 Total 291.659,4
Filtering unit 201.613
Total 241.736
Yearly costs [USD/year]
Maintenance 13.307
Energy 110.584
Chemicals 7.250
Labor 15.000
Total 144.921
Depending on the costs and benefits given in Table 41, the net present value of the project in a 5 years period was computed. The results can be seen in Table 42.
Table 42: NPV in 5 years for option 2 for primary producers
NPV [USD]
Low discount rate 468.351,2
Base discount rate 430.281,9
High discount rate 368.060,9
The sensitivity of the result can be seen in Figure 42.

105COST BENEFIT ANALYSIS
7. COST BENEFIT ANALYSIS
104
Figure 42: Sensitivity of the NPV for option 2 for primary producer
Benefits because of tax savings and reuse of water can be seen in Table 43. Like stated before, PW is the best suited water type for reuse. We will therefore benefit from the 14.850 m3 of PW filtrated. The tax benefit is different depending on the country due to different taxations levels.
Table 43: Other benefits for option 2
Other benefits [USD/year] Denmark Iceland Norway Sweden Water reuse 23.760 3.252 20.493 16.781 Tax savings 146.250 0 35.880 144.300 Total 170.010 3.252 56.373 161.081
The second NPV, now including the benefits of water reuse and tax savings, can be seen in Table 44.
Table 44: NPV in 5 years for option 2 including tax and water reuse benefits
NPV [USD] Denmark Iceland Norway Sweden Low discount rate 1.291.054,0 484.087,2 741.148,2 1.247.842,8 Base discount rate 1.208.877,9 445.174,3 688.453,8 1.167.983,4 High discount rate 1.074.567,9 381.574,4 602.329,0 1.037.459,8
The sensitivity of the result can be seen in Figure 44.
491 954,92
468 351,15430 281,92
368 060,86
287 222,32
200 000,00
250 000,00
300 000,00
350 000,00
400 000,00
450 000,00
500 000,00
550 000,00
0% 2% 4% 6% 8% 10% 12%
NET
PRES
ENT
VALU
E
DISCOUNTRATE
PRIMARYPRODUCEROPTION2(REVENUE)
Figure 42: Sensitivity of the NPV for option 2 for primary producer
Benefits because of tax savings and reuse of water can be seen in Table 43. Like stated before, PW is the best suited water type for reuse. We will therefore benefit from the 14.850 m3 of PW filtrated. The tax benefit is different depending on the country due to different taxations levels.
Table 43: Other benefits for option 2 Other benefits [USD/year] Denmark Iceland Norway SwedenWater reuse 23.760 3.252 20.493 16.781
Tax savings 146.250 0 35.880 144.300
Total 170.010 3.252 56.373 161.081
The second NPV, now including the benefits of water reuse and tax savings, can be seen in Table 44.
Table 44: NPV in 5 years for option 2 including tax and water reuse benefitsNPV [USD] Denmark Iceland Norway SwedenLow discount rate 1.291.054,0 484.087,2 741.148,2 1.247.842,8
Base discount rate 1.208.877,9 445.174,3 688.453,8 1.167.983,4
High discount rate 1.074.567,9 381.574,4 602.329,0 1.037.459,8
The sensitivity of the result can be seen in Figure 44.
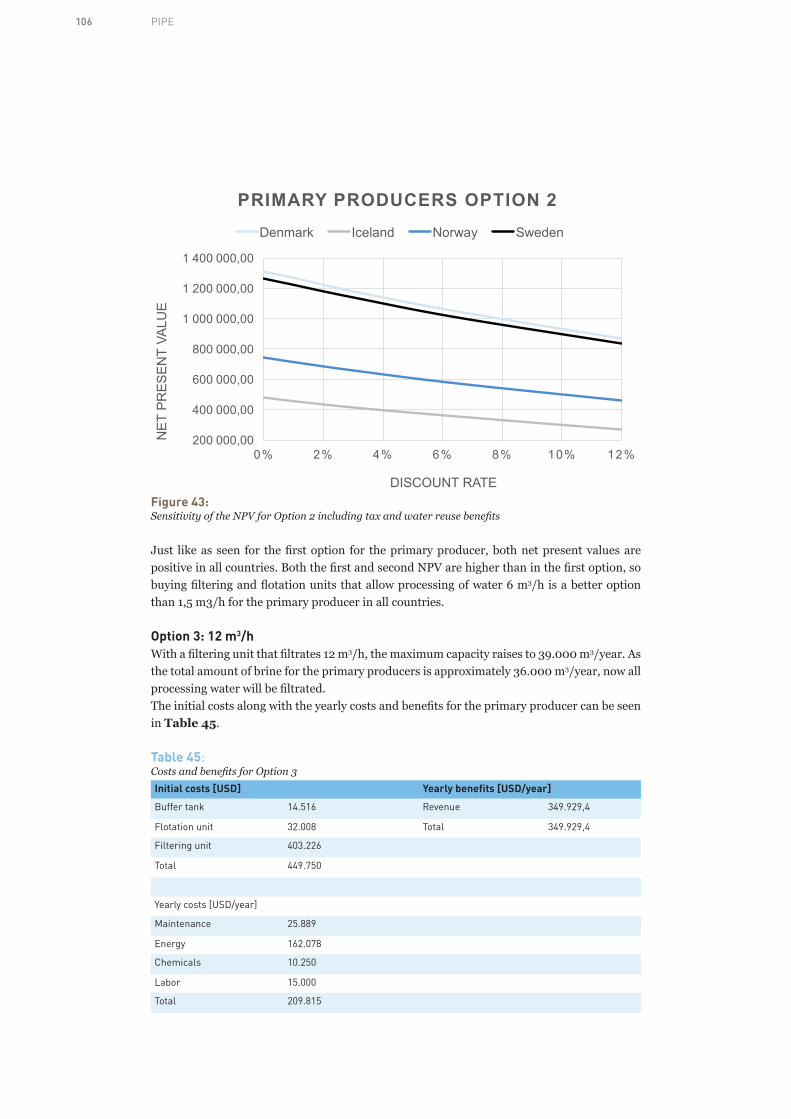
106 PIPE
7. COST BENEFIT ANALYSIS
105
Figure 43: Sensitivity of the NPV for Option 2 including tax and water reuse benefits Just like as seen for the first option for the primary producer, both net present values are positive in all countries. Both the first and second NPV are higher than in the first option, so buying filtering and flotation units that allow processing of water 6 m3/h is a better option than 1,5 m3/h for the primary producer in all countries.
200 000,00
400 000,00
600 000,00
800 000,00
1 000 000,00
1 200 000,00
1 400 000,00
0% 2% 4% 6% 8% 10% 12%
NET
PR
ESEN
T VA
LUE
DISCOUNT RATE
PRIMARY PRODUCERS OPTION 2Denmark Iceland Norway Sweden
Figure 43: Sensitivity of the NPV for Option 2 including tax and water reuse benefits
Just like as seen for the first option for the primary producer, both net present values are positive in all countries. Both the first and second NPV are higher than in the first option, so buying filtering and flotation units that allow processing of water 6 m3/h is a better option than 1,5 m3/h for the primary producer in all countries.
Option 3: 12 m3/hWith a filtering unit that filtrates 12 m3/h, the maximum capacity raises to 39.000 m3/year. As the total amount of brine for the primary producers is approximately 36.000 m3/year, now all processing water will be filtrated. The initial costs along with the yearly costs and benefits for the primary producer can be seen in Table 45.
Table 45: Costs and benefits for Option 3Initial costs [USD] Yearly benefits [USD/year]
Buffer tank 14.516 Revenue 349.929,4
Flotation unit 32.008 Total 349.929,4
Filtering unit 403.226
Total 449.750
Yearly costs [USD/year]
Maintenance 25.889
Energy 162.078
Chemicals 10.250
Labor 15.000
Total 209.815

107COST BENEFIT ANALYSIS
Depending on the costs and benefits given in Table 45, the net present value of the project in a 5 years period was computed. The results can be seen in Table 46.
Table 46: NPV in 5 years for Option 3 for primary producer
NPV [USD]Low discount rate 228.281,7
Base discount rate 191.931,0
High discount rate 132.518,8
The sensitivity of the result can be seen in Figure 45.
7. COST BENEFIT ANALYSIS
107
Figure 44: Sensitivity of the NPV for Option 3 for primary producers Benefits because of tax savings and reuse of water can be seen in Table 47. PW is the best suited water type for reuse. It is therefore assumed that only PW will be reused. The tax saving is different between countries.
Table 47: Other benefits for Option 3
Other benefits [USD/year] Denmark Iceland Norway Sweden Water reuse 32.000 4.380 27.600 22.600 Tax savings 259.875 0 63.756 256.410 Total 291.875 4.380 91.356 279.010
The second NPV, now including the benefits because of water reuse and tax savings, can be seen in Table 48.
Table 48: NPV in 5 years for Option 3 including tax and water reuse benefits
NPV [USD] Denmark Iceland Norway Sweden Low discount rate 1.640.706,7 249.475,0 670.366,5 1.578.451,1 Base discount rate 1.528.633,0 211.988,1 610.314,7 1.469.715,1 High discount rate 1.345.457,7 150.718,8 512.165,0 1.291.994,9
The sensitivity of the result can be seen in Figure 45.
250 819,89
228 281,67191 930,99
132 518,78
55 329,53
0,00
50 000,00
100 000,00
150 000,00
200 000,00
250 000,00
300 000,00
0% 2% 4% 6% 8% 10% 12%
NET
PRES
ENT
VALU
E
DISCOUNTRATE
PRIMARYPRODUCERSOPTION3(REVENUE)
Figure 44: Sensitivity of the NPV for Option 3 for primary producers
Benefits because of tax savings and reuse of water can be seen in Table 47. PW is the best suited water type for reuse. It is therefore assumed that only PW will be reused. The tax saving is different between countries.
Table 47: Other benefits for Option 3Other benefits [USD/year] Denmark Iceland Norway SwedenWater reuse 32.000 4.380 27.600 22.600
Tax savings 259.875 0 63.756 256.410
Total 291.875 4.380 91.356 279.010
The second NPV, now including the benefits because of water reuse and tax savings, can be seen in Table 48.
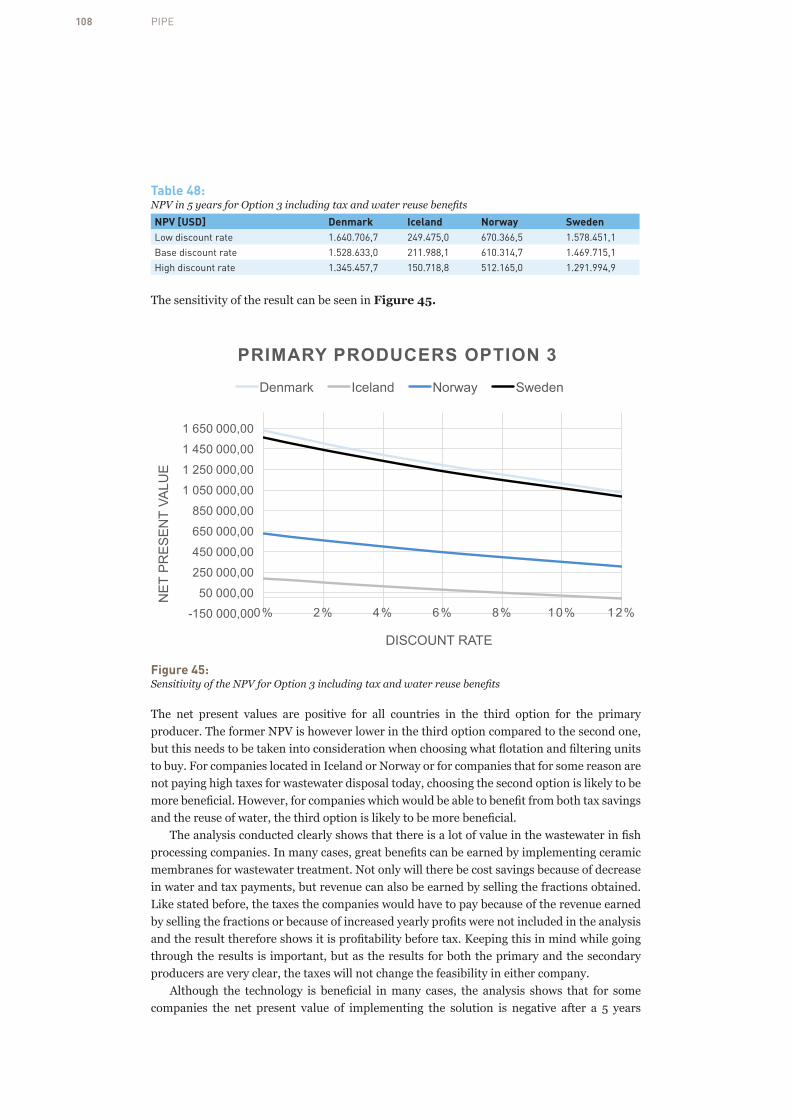
108 PIPE
Table 48: NPV in 5 years for Option 3 including tax and water reuse benefitsNPV [USD] Denmark Iceland Norway SwedenLow discount rate 1.640.706,7 249.475,0 670.366,5 1.578.451,1
Base discount rate 1.528.633,0 211.988,1 610.314,7 1.469.715,1
High discount rate 1.345.457,7 150.718,8 512.165,0 1.291.994,9
The sensitivity of the result can be seen in Figure 45.7. COST BENEFIT ANALYSIS
108
Figure 45: Sensitivity of the NPV for Option 3 including tax and water reuse benefits The net present values are positive for all countries in the third option for the primary producer. The former NPV is however lower in the third option compared to the second one, but this needs to be taken into consideration when choosing what flotation and filtering units to buy. For companies located in Iceland or Norway or for companies that for some reason are not paying high taxes for wastewater disposal today, choosing the second option is likely to be more beneficial. However, for companies which would be able to benefit from both tax savings and the reuse of water, the third option is likely to be more beneficial. The analysis conducted clearly shows that there is a lot of value in the wastewater in fish processing companies. In many cases, great benefits can be earned by implementing ceramic membranes for wastewater treatment. Not only will there be cost savings because of decrease in water and tax payments, but revenue can also be earned by selling the fractions obtained. Like stated before, the taxes the companies would have to pay because of the revenue earned by selling the fractions or because of increased yearly profits were not included in the analysis and the result therefore shows it is profitability before tax. Keeping this in mind while going through the results is important, but as the results for both the primary and the secondary producers are very clear, the taxes will not change the feasibility in either company. Although the technology is beneficial in many cases, the analysis shows that for some companies the net present value of implementing the solution is negative after a 5 years period. Using a 3% discount rate for the secondary producers, the resulting net present value was between -77.000 and -86.000 USD, depending on the country of implementation. For the solution to be beneficial in secondary producers the amount of processing water in the company would need to be 2 to 3 times the amount they have today. It however needs to be taken into account that the intangible benefits, such as improved reputation and enhanced customer confidence and trust, have not been taken into account.
-150 000,0050 000,00
250 000,00450 000,00650 000,00850 000,00
1 050 000,001 250 000,001 450 000,001 650 000,00
0% 2% 4% 6% 8% 10% 12%
NET
PR
ESEN
T VA
LUE
DISCOUNT RATE
PRIMARY PRODUCERS OPTION 3Denmark Iceland Norway Sweden
Figure 45: Sensitivity of the NPV for Option 3 including tax and water reuse benefits
The net present values are positive for all countries in the third option for the primary producer. The former NPV is however lower in the third option compared to the second one, but this needs to be taken into consideration when choosing what flotation and filtering units to buy. For companies located in Iceland or Norway or for companies that for some reason are not paying high taxes for wastewater disposal today, choosing the second option is likely to be more beneficial. However, for companies which would be able to benefit from both tax savings and the reuse of water, the third option is likely to be more beneficial.
The analysis conducted clearly shows that there is a lot of value in the wastewater in fish processing companies. In many cases, great benefits can be earned by implementing ceramic membranes for wastewater treatment. Not only will there be cost savings because of decrease in water and tax payments, but revenue can also be earned by selling the fractions obtained. Like stated before, the taxes the companies would have to pay because of the revenue earned by selling the fractions or because of increased yearly profits were not included in the analysis and the result therefore shows it is profitability before tax. Keeping this in mind while going through the results is important, but as the results for both the primary and the secondary producers are very clear, the taxes will not change the feasibility in either company.
Although the technology is beneficial in many cases, the analysis shows that for some companies the net present value of implementing the solution is negative after a 5 years

109COST BENEFIT ANALYSIS
period. Using a 3% discount rate for the secondary producers, the resulting net present value was between -77.000 and -86.000 USD, depending on the country of implementation. For the solution to be beneficial in secondary producers the amount of processing water in the company would need to be 2 to 3 times the amount they have today. It however needs to be taken into account that the intangible benefits, such as improved reputation and enhanced customer confidence and trust, have not been taken into account.
The results were quite different for the primary producers where the net present value resulted to be strictly positive in a 5 years period in all countries included. Comparing the three options for the primary producers, the last two options resulted in the highest profit in all cases. Which one of the two is better depends on the country of implementation and the degree of which the company is already paying taxes for its wastewater disposal. For companies located in Iceland or Norway or companies that for some reason are not paying high taxes for wastewater disposal today, choosing the second option is likely to be more beneficial. However, for companies which would be able to benefit from both tax savings and the reuse of water, the third option is likely to be more beneficial. Like before, the fact that the intangible benefits have not been taken into account needs to be considered, but this makes the result even more positive for the primary producers.
The survey sent to fish processing companies in the Nordic countries showed that there clearly is room for improvements in regards to wastewater treatment, as only one of the 27 participants is using advanced processes for wastewater treatment today. The total benefits of the technology in question in this project were not made clear for the participants, but they still showed interest in the solution. 48,1% of the participants were interested in a technology that would allow reuse of water and 44,4% in a technology for wastewater treatment that would lower COD/BOD more efficiently than the solution they already have in place today. Furthermore, over 50% of the participants said they were willing to invest to keep a low environmental profile. The interest of the participants may partly be because of increasing awareness of possible changes in the near future regarding requirements for cleaning wastewater/effluents, but they seemed to be rather aware of them. The overall results are good, but by introducing and promoting the technology when it comes to the market, better results can be expected.
The interview conducted with a feed producer showed that the demand for fractions similar to those expected to be obtained using the technology in question is continuously increasing. The fractions do however need to have high protein or lipid contents, but the moisture content in feed ingredients should not be higher than 10 to 12%. This shows that the technology in question needs to be very well-functioning before being implemented in order for the fractions obtained to have good market potential.
As can be seen, the results show great potential in regards to implementing ceramic membranes for wastewater treatment. The technology that exists today does however not function as expected, so the assumption made about the technology functioning perfectly does not hold in current state. With continuous technology improvement, a well-functioning solution is however likely to arrive in the near future. When the day comes, implementing ceramic membranes for wastewater treatment should therefore be seriously considered by fish processing companies around the world.

110 PIPE
8. Conclusions & Perspectives
The PIPE project demonstrated that there is a huge amount of biomolecules that are leaching out in the processing waters of marinated herring producers during production; a biomass currently ending up as effluents.
For the primary producers the amount of dry matter can reach up to 8% in salt brines (SW). It was also found that the trace elements that are dominating in the waters are calcium and magnesium, coming from the bones. The protein and fatty acid content reached up to 12,7 g/L and 2,5 g/L, respectively. The long chain n-3 polyunsaturated fatty acids (LC n-3 PUFA) represented up to 44,5 % of the total fatty acids. It was demonstrated that increased herring incubation time, muscle exposure, and salt resulted in an increase in the protein and fatty acid content in the processing waters. Small polypeptides were observed in the first processing waters, e.g. RSW and SW, whilst larger proteins (myofibrillar protein) were observed in processing water from late processing steps, such as SB. In general the stability of biomolecules should be considered if their recovery is considered as TVB-N and TBARS increased over time during cold storage of process waters. A proper balance between longest possible incubation time of the waters and quality of the fractions collected should be investigated.
For the secondary producers the volumes of water are not as important as for the primary producers, but the waters are richer in biomass, this was especially true for Tsa, TSp and SC where up to 56 g protein/L and approx.- 9 g/L fatty acids were found. High lipid content was also obtained in VC with 20 g/L. Desalting water was also very high in protein and lipid (13 and 8 g/L, respectively). In total for the 2 producers considered in this project, yearly 35 ooo m3 of water is used and 100 tonnes of protein and 36 tonnes of fatty acids are lost. Considering the marine protein and fatty acid shortage, and the increasing demand for these ingredients globally, this loss should not be ignored.
In the Nordic countries the herring industry is important, and if collection of biomass is performed also from processing waters emerging from the global fish industry, more food and food ingredient could reach the market. The survey performed in PIPE revealed that approx. 66% of the fish processing industries interviewed used some water treatment technology. However, the technology in place did usually not allow recovery of biomolecules for food, feed or added values ingredients. In general the industries interviewed were interested in re-utilisation of the waters and in lowering of the BOD/COD values. Sweden was the country that showed most interest. Consumers view and willingness to keep a low environmental impact were driving forces for changes and implementation of a new technology that allowed biomolecule recovery. The cost benefit analysis indicated that the investment was only worthwhile to do for producers with large amount of water.
The technology tested, and especially ceramic membranes, were promising. It was efficient at filtrating the water and allowing recovery of the biomass. However, the flux was not optimal and better pre-treatment and better membrane performances are needed before this technique can be implemented. Other inexpensive technologies should be tested for

111ONCLUSIONS & PERSPECTIVES
enhancing the recovery of biomolecules from brine, with for example floatation technologies (microbubbles or food grade coagulants) or tricanter centrifugation. As for electrochemistry, an iron electrode could be tested in the EF unit instead of an aluminium electrode providing that the iron is not damaging the recovered fractions.
The fractions recovered showed promising properties that could be interesting in relation to feed and food application. The macronutrients could be recovered and used as feed for nutritional purposes. The interview with feed producers showed that fish protein and lipids are a growing market and that there is great interest in such fractions provided that they are of good quality. In relation to stabilizing properties and potential bioactivity, the antioxidant properties were good in most fractions and this may represent an opportunity for further characterisation and purification. Especially small peptides and small phenolic compounds leaching out into the water from the herring and spices, respectively, were present in the brine and may be recovered. The low molecular weight fractions of selected herring process waters have also demonstrated promising results as media for cultivation of algal and other microbial biomasses. This could represent an opportunity for industry clustering, especially considering the increasing interest in bioconversion. Nevertheless, the brine may also be used as it is as coating agent or additive to extend the storage stability of food and feed, or could be further processed and fermented to generate high added value products e.g. fish sauce. The sensory properties such as flavouring and odorants of the waters or recovered fractions have not been investigated extensively and this should also be taken into consideration in relation to their future applications.
PIPE present a “snap shot” of what molecules that are leaching out from herring; qualitative and quantitative analysis, and technology that may be applied to recover them, as well as potential utilisation of the recovered biomass. More systematic investigations of other technologies alone or in combination should be performed. More detailed investigations regarding seasonal variations and batch to batch variation will be needed before the industry processing water can be fully exploited. The cost benefit analysis should then be re-evaluated. However, in PIPE we clearly demonstrated that when the technology is ready, there is a great potential to valorise recovered herring biomass, release cleaner water into the environment and gain revenues. In the future it is expected that taxation and regulation regarding water release will increase and the fish industry, which is using large amounts of water, should implement new technologies as soon as possible. There is much to gain not only in terms of more sustainable use of a valuable resource, but also in terms of economic returns.

112 PIPE
9. References
Afonso, M.D.; Bórquez R. (2002). Review of the treatment of seafood processing wastewater and recovery of proteins therein by membrane separation processes - prospects of the ultrafiltration of wastewaters from the fish meal industry. Desalination, 142:29-45.
Afonso, M.D.; Ferrer, J.; Bórquez R. (2004). An economic assessment of proteins recovery from fish meal effluents by ultrafiltration. Food Science and Technology, 15:506-512.
Andersen, E.; Andersen, M.L.; Baron, C.P. (2007). Characterization of oxidative changes in salted herring (Clupea harengus) during ripening. Journal Agriculture of Food Chemistry, 55:9545-9553.
Apak R., Güçlü K., Özyürek M., Çelik E. S. (2008) Mechanism of antioxidant capacity assays and the CUPRAC (cupric ion reducing antioxidant capacity) assay. Microchimica Acta, 160:413-419.
Appel, L.J.; Miller, E.R.; Seidler, A.J.; Whelton, P.K. (1993). Does supplementation of diet with “fish oil” reduce blood pressure? A metaanalysis of controlled clinical trials. Archives of Internal Medicine, 153:1429-1438.
Aro, T.; Tahvonen, R.; Mattila, T.; Nurmi, J.; Sivonen, T.; Kallio, H. (2000). Effects of season and processing on oil content and fatty acids of Baltic herring (Clupea harengus membras). Journal Agriculture of Food Chemistry, 48:6085-6093.
Baker, R.W. (2004). Membrane technology and applications. 2. Edition, Baker, R.W. (Ed.), John Wiley & Sons, Ltd.
Barbosa-Pereira, L.; Pocheville, A.; Angulo, I; Paseiro-Losada, P.; Cruz, J.M. (2013). Fractionation and purification of bioactive compounds obtained from a brewery waste stream. BioMed Research International, 408491:1-11.
Barrera-Díaz, C., Bilyeu, B., Roa, G., Bernal-Martinez, L. (2011) Physicochemical aspects of electrocoagulation. Sep. Purif. Rev. 40:1–24.
Ben-Sasson, M.; Lin, Y.M.; Adin, A. (2011). Electrocoagulation-membrane filtration hybrid system for colloidal fouling mitigation of secondary-effluent. Separation and Purification Technology 82:63-70.
Bernal-Martinez, J.; Mendiola, J.A.; Ibáñez, E.; Cifuentes, A. (2011). Advanced analysis of nutraceuticals. Journal of Pharmaceutical and Biomedical Analysis, 55:758-774.
Boardman, A. E. (2011). Cost-benefit analysis : concepts and practice (4th ed.). Boston: Prentice Hall.
Bolzonella, D.; Cecchi, F.; Pavan, P. (2007). Treatment of food processing wastewater. In Handbook of waste management and co-product recovery in food processing. Waldron, K. (Ed.), p. 282-304. Woodhead Publishing Limited, Cambridge, England.
Bougatef, A.; Nedjar-Arroume, N.; Manni, L.; Ravallec, R.; Barkia, A.; Guillochon, D.; Nasri, M. (2010). Purification and identification of novel antioxidant peptides from enzymatic hydrolysates of sardinelle (Sardinelle aurita) by-products proteins. Food Chemistry, 118:559-565.

113REFERENCES
Brigham, E. F., & Houston, J. F. (2009). Fundamentals of financial management (12th ed.). Mason, OH: South-Western Cengage Learning.
Cassano, A.; Conidi, C.; Giorno, L.; Drioli, E. (2013). Fractionation of olive mill wastewater by membrane separation techniques. Journal of Harzardous Materials, 248-249:185-193.
Cassini, A.S.; Tessaro I.C.; Marczak L.D.F. (2011). Ultrafiltration of wastewater from isolated soy protein production: fouling tendencies and mechanisms. Separation Science and Technology, 46: 1077-1086.
Cassini, A.S.; Tessaro I.C.; Marczak L.D.F.; Pertile, C. (2010). Ultrafiltration of wastewater from isolated soy protein production: a comparison of three UF membranes. Journal of Cleaner Production, 18:260-265.
Cavonius, L.R., Carlsson, N-G., Undeland, I. (2014) Quantification of total fatty acids in microalgae: comparison of extraction and transesterification methods. Analytical Bioanalytical Chemistry, 406:7313-7322.
Chan, K.M.; Decker, E.A. (1994). Endogenous skeletal muscle antioxidants. Critical Reviews in Food Science and Nutrition, 34:403-426.
Chowdhury, P.; Viraraghavan, T.; Srinivasan, A. (2010). Biological treatment processes for fish processing wastewater – a review. Bioresource Technology, 101:439-449.
Ciora, R.J.; Fayyaz, B.; Liu, P.K.T.; Suwanmethanond, V.; Mallada, R.; Sahimi, M.; Tsotsis, T.T. (2004). Preparation and reactive applications of nanoporous. silicon carbide membranes. Chemical Engineering Science 59:4957-4965.
Clemente, A. (2000). Enzymatic protein hydrolysates in human nutrition. Trends in Food Science and Technology, 11:254-262.
Coca, J.; Gutiérrez, G.; Benito, J.M. (2011). Treatment of oily wastewater. Water Purification and Management, 101:1-55.
Cutting, C. L. (1955). Fish saving. London: Leonard Hill Limited.Damodaran, S. Amino acids, peptides and proteins. (2008). in: S. Damodaran, K.L. Parkin,
O.R. Fennema (Eds.) Fennema’s Food Chemistry. 4th ed. CRC Press, Taylor and Francis Group, London; pp217–330.
Ditgens, B. (2007). Membrane and filtration technologies and the separation and recovery of food processing waste. Ch. 11 In Handbook of waste management and co-product recovery in food processing. Waldron, K. (Ed.), p. 282-304. Woodhead Publishing Limited, Cambridge, England
Dong, S.; Zeng, M.; Wang, D.; Liu, Z.; Zhao, Y.; Yang, H. (2008). Antioxidant and biochemical properties of protein hydrolysates prepared from Silver carp (Hypophthalmichthys molitrix). Food Chemistry, 107:1485-1493.
Du Z., Bramlage, W.J. (1992) Modified thiobarbituric acid assay for measuring lipid oxidation in sugar-rich plant tissue extracts. J. Agric. Food Chem., 40:1566–1570
Duarte, J.; Vinderola, G.; Ritz, B.; Perdigon, G.; Matar, C. (2006). Immunomodulating capacity of commercial fish protein hydrolysate for diet supplementation. Immunobiology, 211:341-350.
Dumay, J.; Radier, S.; Barnathan, G.; Berge, J.P.; Jaquen, P. (2008). Recovery of valuable soluble compounds from washing waters generated during small fatty pelagic surimi proccesing by membrane processes. Environmental Technology, 29:451-461.
Ekstrand, B., Gangby, I., Janson, R.M., Pettersson, A., Åkesson, G. (1993). Lipid stability related to development of herring mince products. in: Proceedings from the 23rd West European Fish Technologists Association (WEFTA) meeting.
Elias RJ, Kellerby SS and Decker EA, (2008). Antioxidant activity of proteins and peptides. CRC critical Reviews in Food Science and Nutrition, 48:430-441.

114 PIPE
Elvevoll, E.O.; Österud, B. (2003). Impact of processing on nutritional quality of marine food items. Forum Nutrition, 56:337-340.
El-Mashad, H.M.; Zhang, R. (2007). Separation technologies for food wastewater treatment and product recovery. Ch. 12 In Handbook of waste management and co-product recovery in food processing. Waldron, K. (Ed.), pp. 282-304. Woodhead Publishing Limited, Cambridge, England
Erdmann, K.; Grosser, N.; Schipporeit, K.; Schröder, H. (2006). The ACE inhibitory dipeptide Met-Tyr diminishes free radical formation in human endothelial cells via induction of heme oxygenase-1 and ferritin. The Journal of Nutrition, 136:2148-2152.
Espín, J.C.; García-Conesa, M.T.; Tomás-Barberán, F.A. (2007). Nutraceuticals: facts and fiction. Phytochemistry, 68:2986-3008.
FAO, (1985). Species catalogue Vol. 7. Clupeoid fishes of the world. (Suborder CLUPEOIDEI). An annotated and illustrated catalogue of the herrings, sardines, pilchards, sprats, anchovies and wolf-herrings. Part 1. Whitehead, P.J.P., FAO Fish. Synop., 7.
FAO, (2007). Review of the state of world fisheries and aquaculture, FAO, Rome, Italy.FAO, (2011). Review of the state of world fisheries and aquaculture, FAO, Rome, Italy . Farvin KHS, Baron CP, Nielsen NS, Otte J, Jacobsen C (2010). Antioxidant activity of yoghurt
peptides: Part 2 – Characterisation of peptide fractions. Food Chemistry, 123:1090-1097.
Fernandes, L.; Warith, M.A.; Droste, R. (1991). An integrated treatment system for waste from food production industries. Environmental Pollution, 1:671-679.
Florio, M. & Sirtori, E. (2013). The social cost of capital: Recent estimates for the EU countries. Working papers, 201303. Centre for Industrial Studies (CSIL).
Freitas AC, Andrade JC, Silva FM, Rocha-Santos TAP, Duarte AC, et al. (2013). Antioxidative peptides: Trends and perspectives for future research. Current medicinal Chemistry 20:4575-4594.
Fredrikson, M., Carlsson, N.G., Almgren, A., Sandberg, A.S. (2002). Simultaneous and sensitive analysis of Cu, Ni, Zn, Co, Mn, and Fe in food and biological samples by ion chromatography. J. Agric. Food Chemistry, 50:59–65.
Genovese, C.V.; González, J.F. (1994). Evaluation of dissolved air flotation applied to fish filleting wastewater. Bioresource Technology, 50:175-179.
Gil-Chávez, G.J.; Villa, J.A.; Ayala-Zavala, J.F.; Heredia, J.B.; Sepulveda, D.; Yahia, E.M.; González-Aguilar, G.A. (2013). Technologies for extraction and purification of bioactive compounds to be used as neutraceuticals and food ingredients: An overview. Comprehensive Reviews in Food Science and Food Safety, 12:5-23.
Guillard R R, Ryther J.H. (1962) Studies of marine planktonic diatoms. I. Cyclotella nana Hustedt, and Detonula confervacea (cleve) Gran. Can J Microbiol. 8:229-239.
Hall, G.M.; Ahmad, N.H. (1992). Functional properties of fish protein hydrolysates. In Fish Processing Technology. Hall, G.M. (Ed.), pp. 249-265. Blackie Academic and Professional, N.Y., U.S.A.
Hang, Y.D. (2004). Management and utilization of food processing wastes. Journal of Food Science, 69:104-107.
Hammershøj, Prin, Qvist (1999). Influence of pH on surface properties of aqueous egg albumen solutions in relation to foaming behaviour. Journal of the Science of Food and Agriculture. 79:859-868.
Hansen, C.L.; Cheong, D.Y. (2007). Fermentation, biogas and biohydrogen production from solid food processing. Ch. 23 In Handbook of waste management and co-product recovery in food processing. Waldron, K. (Ed.), pp. 282-304. Woodhead Publishing

115REFERENCES
Limited, Cambridge, EnglandHekmat, S.; Soltani, H.; Reid, G. (2009). Growth and survival of Lactobacillus reuteri RC-14
and Lactobacillus rhamnosus GR-1 in yogurt for use as a functional food. Innovative Food Science and Emerging Technologies, 10:293-296.
Himebaugh, R.R., Smith, M. (1979). Semi-micro tube method for chemical oxygen demand. Analytical Chemistry 51:1085–1087.
Hofs, B.; Ogier, J.; Vries, D.; Beerendonk, E.F.; Cornelissen, E.R. (2011). Comparison of ceramic and polymeric membrane permeability and fouling using surface water. Separation and Purification Technology, 79:365-374.
Hsu, K-C.; Lu, G-H.; Jao, C-L. (2009). Antioxidative properties of peptides prepared from tuna cooking juice hydrolysates with orientase (Bacillus subtilis). Food Research International, 42:647-652.
Je, J-Y.; Park, J-Y.; Jung, W-K.; Park, P-J.; Kim, S-K. (2005a). Isolation of angiotensin I converting enzyme (ACE) inhibitor from fermented oyster sauce, Crassostrea gigas. Food Chemistry, 90:809-814.
Je, J-Y.; Park, P-J.; Kim, S-K. (2005b). Antioxidant activity of a peptide isolated from Alaska pollack (Theragra chalcogramma) frame protein hydrolysate. Food Research International, 38:45-50.
Je, J-Y.; Park, P-J.; Kwon, J.Y.; Kim, S-K. (2004). A novel angiotensin I converting enzyme inhibitory peptide from Alaska pollack (Theragra chalcogramma) frame protein hydrolysate. Journal of Agricultural and Food Chemistry, 52:7842-7845.
Je, J-Y.; Qian, Z-J.; Byun, H-G.; Kim, S-K. (2007). Purification and characterization of an antioxidant peptide obtained from tuna backbone protein by enzymatic hydrolysis. Process Biochemistry, 42: 840-846.
Jiang, C.; Wu. Z.; Li, R.; Liu, Q. (2011). Technology of protein separation from whey wastewater by two-stage foam separation. Biochemical Engineering Journal, 55:43-48.
Johns, M.R. (1995). Developments in wastewater treatment in the meat processing industry: A review. Bioresource Technology, 54:203-216.
Jönsson, A-S.; Trägårdh, G. (1990). Ultrafiltration Applications. Desalination, 77 :135-179.Jovanovic, S.V.; Steenken, S.; Hara, Y.; Simic, M.G. (1996). Reduction potentials of flavonoid
and model phenoxyl radicals. Which ring in flavonoids is responsible for antioxidant activity? Journal of the Chemical Society, Perkin Transactions 2, 2497-2504
Jun, S-Y.; Park, P-J.; Jung, W-K.; Kim, S-W. (2004). Purification and characterization of an antioxidative peptide
from enzymatic hydrolysate of yellowfin sole (Limanda aspera) frame protein. European Food Research and Technology, 219:20-26.
Kakatkar AS, Sherekar SV and Venugopal V, (2004). Fish protein dispersion as a coating to prevent quality loss in processed fishery products. Fishery Technology, 41:29-36.
Karel, M.; Tannenbaum, S.R.; Wallace, D.H.; Maloney, H. (1966). Antioxidation of methyl linoleate in freeze-dried model systems. III. Effects of added amino acids. Journal of Food Science, 31:892-896.
Kawashima, K.; Itoh, H.; Miyoshi, M.; Chibata, I. (1979). Antioxidant properties of branched-chain amino acid derivatives. Chemical and Pharmaceutical Bulletin, 27:1912-1916.
Kelleher SD, (2006). Low cholesterol, functional, animal muscle protein composition and process. US Patent 7033636.
Kelleher SD, (2011). Protein product and process for making injectable protein product. US Patent 0244092.
Kim, S-K.; Kim, Y-T.; Byun, H-G.; Nam, K-S.; Joo, D-S.; Shahidi, F. (2001). Isolation and

116 PIPE
characterization of antioxidative peptides from gelatin hydrolysate of Alaska Pollack skin. Journal of Agricultural and Food Chemistry, 49:1984-1989.
Kim, S-K.; Mendis, E. (2006). Bioactive compounds from marine processing byproducts – A review. Food Research International, 39:383-393.
Klemeš, J.; Perry, S.J. (2007). Process optimisation to minimise water use in food processing. In Handbook of waste management and co-product recovery in food processing. Waldron, K. (Ed.), pp. 282-304. Woodhead Publishing Limited, Cambridge, England.
Kołakowski, E.; Bednarczyk, B. (2002). Physical and sensory changes in headed and gutted Baltic herring during immersed salting in brine with the addition of acetic acid. Part 1. Weight losses, color of flesh and its sensory properties. Electronic Journal of Polish Agricultural Universities, 5:#09.
Kołakowska, A., Olley, J., Dunsten, G.A. (2002). Fish lipids. in: Z.E. Sikorski, A. Kołakowska (Eds.) Chemical and Functional Properties of Food Lipids. CRC Press, Boca Raton; pp221–264.
Lee, A.K.; Lewis, D.M.; Ashman, P.J. (2013). Harvesting of marine microalgae by electroflocculation: The energetics, plant design, and economics. Applied Energy, 108:45-53.
Lee, C.M., Trevino, B., Chaiyawat, M. (1996). A simple and rapid solvent extraction method for determining total lipids in fish tissue. J. AOAC Int. 79:487–492.
Lefebvre, O.; Moletta, R. (2006). Treatment of organic pollution in industrial saline wastewater: a literature review. Water Research, 40:3671-3682.
Lepage, G., Roy, C.C. (1986). Direct transesterification of all classes of lipids in a one-step reaction. J. Lipid Res. 27:114–120.
Liaset, B.; Madsen, L.; Hao, Q.; Criales, G.; Mellgren, G.; Marschall, H-U.; Hallenborg, P.; Espe, M.; Frøyland, L.; Kristiansen, K. (2009). Fish protein hydrolysate elevates plasma bile acids and reduces visceral adipose tissue mass in rats. Biochimica et Biophysica Acta, 1791:254-262.
Liceaga-Gesualdo, A.M.; Li-Chan, E.C.Y. (1999). Functional properties of fish protein hydrolysate from herring (Clupea harengus). Food Chemistry and Toxicology, 64:1000-1004.
Lindqvist, H.; Langkilde, A.M.; Undeland, I.; Rådendal, T.; Sandberg, A.S. (2007). Herring (Clupea harengus) supplemented diet influence risk factors for CVD in overweight subjects. European Journal of Clinical Nutrition, 61:1106-1113.
LiqTech International (2014). Personal communication.Lykkeberg A/S, (2014). Personal communication. Madsen, H.L.; Bertelsen, G. (1995). Spices as antioxidants. Trends in Food Science and
Technology, 6: 271-277.Magueijo, V.; Minhalma, M.; Queiroz, D.; Geraldes, V.; Macedo, A.; de Pinho, M.N. (2005).
Reduction of wastewaters and valorisation of by-products from “Serpa” cheese manufacture using nanofiltration. Water Science and Technology, 52:393-399.
Mameri, N.; Abdessemed, D.; Belhocine, D.; Lounici, H.; Gavach, C.; Sandeaux, J.; Sandeaux, R. (1996). Treatment of fishery washing water by ultrafiltration. Journal of Chemical Technology and Biotechnology, 67:169-175.
Marette, S.; Roosen, J.; Blanchemanche, S.; Feinblatt-Mélèze, E. (2010). Functional food, uncertainty and consumers’ choices: A lab experiment with enriched yoghurts for lowering cholesterol. Food Policy, 35:419-428.
Matthiasson, E.; Sivik, B. (1978). New possibilities for handling fish industry ‘water’. Livsmedelsteknik, 20:241-244.

117REFERENCES
McDermott, G.N. (1976). Liquid waste treatment in the vegetable oil processing industry – U.S. practices. Journal of the American Oil Chemists’ Society, 53:449-458.
Miyata, Y. (1984). Concentration of protein from the wash water of red meat fish by ultrafiltration membrane. Bulletin of Japanese Society of Scientific Fisheries, 50:659-664.
Mollah, M.Y.A.; Gomes, J.A.G.; Das, K.K.; Cocke, D.L (2010). Electrochemical treatment of Orange II dye solution—Use of aluminum sacrificial electrodes and floc characterization. Journal of Hazardous Materials, 174:851-858.
Mollah, M.Y.A.; Schennach, R.; Parga, J.R.; Cocke, D.L. (2001). Electrocoagulation (EC) – science and applications. Journal of Hazardous Materials, B84:29-41.
Nabetani, H. (1996). Development of a membrane system for highly concentrated fruit juice. Membrane, 21:102-108.
Nagai, T.; Suzuki, N.; Nagashima, T. (2006). Antioxidative activities and angiotensin i-converting enzyme inhibitory activities of enzymatic hydrolysates from commercial kamaboko type samples. Food Science and Technology International, 12:335-346.
Neklyudov, A.D.; Ivankin, A.N.; Berdutina, A.V. (2000). Properties and uses of protein hydrolysates. Applied Biochemistry and Microbiology. 36:452-459.
Ng, C.S. (1987). Determination of trimethylamine oxide (TMAO-N), trimethylamine (TMA-N), total volatile basic nitrogen (TVB-N) by Conway’s method. In: Laboratory Manual on Analytical Methods and Procedure for Fish and Fish Products (edited by H. Hasegawa). Pp. B3.1–B3.8. Singapore: Southeast Asian Fisheries Development Center.
Nielsen, H.H. (1995). Proteolytic enzyme activities in salted herring during cold storage. PhD thesis, Department of Biotechnology, The Technical University of Denmark.
Nielsen, H.H.; Børresen, T. (1997). The influence of intestinal proteinases on ripening of salted herring. In Seafood from producer to consumer, integrated approach to quality. Luten, J.B.; Børresen, T.; Oehlenschlager, J (Ed.), pp. 193-304. Elsevier Science, B.V., Amsterdam
Nielsen, D.; Hyldig, G.; Nielsen, J.; Nielsen, H.H. (2005a). Lipid content in herring (Clupea harengus L.) – influence of biological factors and comparison of different methods of analyses: solvent extraction, Fatmeter, NIR and NMR. LWT - Food Science and Technology, 38:537-548.
Nielsen, D.; Hyldig, G.; Nielsen, J.; Nielsen, H.H. (2005b). Sensory properties of marinated herring (Clupea harengus) processed from raw material from commercial landings. Journal of the Science of Food and Agriculture, 85:127-134.
Nobili, S.; Lippi, D.; Witort, E.; Donnini, M.; Bausi, L.; Mini, E.; Capaccioli, S. (2009). Natural compounds for cancer treatment and prevention. Pharmacological Research, 59:365-378.
Orkuveita Reykjavíkur. (2013, February 25). Kalt vatn - Verð. Retrieved April 1, 2015, from http://www.or.is/vorur-thjonusta/verdskra-og-skilmalar/kalt-vatn
Orsat, V.; Raghavan, G.S.V.; Norris, E.R. (1996). Food processing waste dewatering by electro-osmosis. Canadian Agricultural Engineering, 38:63-67.
Oterhals, A. (1995). Seasonal variation in fatty acids composition of capelin oil. Lipid Forum – Scandinavian Forum for Lipid, Research Technology, 171-175
Oyaizu M. (1986) Studies on products of browning reaction. Japanese Journal of Nutrition 44:307-315.
Palenzuela-Rollon, A.; Zeeman, G.; Lubberding, H.J.; Lettinga, G.; Alaerts, G.J. (2002). Treatment of fish processing wastewater in a one- or two-step up flow anaerobic sludge blanket (UASB) reactor. Water Science and Technology, 45:207-212.

118 PIPE
Pampanin, D.M.; Larssen, E.; Provan, F.; Sivertsvik, M.; Ruoff, P.; Sydnes, M.O. (2012). Detection of small bioactive peptides from Atlantic herring (Clupea harengus L.). Peptides, 34:423-426.
Paul Mattsson AB, (2014). Personal communication.Paulson, D.J.; Wilson, R.L.; Dean Spatz, D. (1984). Crossflow membrane technology and its
applications. Food Technology, 38:77-87.Pearse K. N. and Kinsella, J. E. (1978). Emulsifying properties of proteins: evaluation of a
turbidimetric technique. Journal of Agricultural and Food Chemistry. 26:716-723.Peña-Ramos, E.A.; Xiong, Y.L.; Arteaga, G.E. (2004). Fractionation and characterization for
antioxidant activity of hydrolyzed whey protein. Journal of the Science of Food and Agriculture, 84: 1908-1918.
Penven, A.; Gátvez, P.R.; Bergé, J-P. (2013). By-products from fisk processing: focus on French industry. Ch. 1 In Utilization of fish waste, Gátvez, P.R.; Bergé, J-P. (Ed.), pp. 1-26. CPC Press LLC, USA
Pihlanto, A. (2006). Antioxidative peptides derived from milk proteins. International Dairy Journal, 16, 1306-1314
Pourbaix, M. (1974). Atlas of electrochemical equilibria in aqueous solutions, 2nd ed. Pergamon Press, Houston.
Riaño, B.; Molinuevo, B.; Garcia-González, M.C. (2011). Treatment of fish processing wastewater with microalgae-containing microbiota. Bioresource Technology, 102:10829-10833.
Raghavan S and Kristinsson HG (2008) Antioxidative efficacy of alkali - treated tilapia protein hydrolysates: A comparative study of five enzymes. Journal of Agricultural and Food Chemistry 56:1434-1441.
Ren, J.; Zhao, M.; Shi, J.; Wang, J.; Jiang, Y.; Cui, C.; Kakuda, Y.; Xue, S.J. (2008). Purification and identification of antioxidant peptides from grass carp muscle hydrolysates by consecutive chromatography and electrospray ionization-mass spectrometry. Food Chemistry, 108, 727-736
Roberfroid, M. (2002). Functional food concept and its application to prebiotics. Digestive and Liver Disease, 34:105-110
Rodríguez-Turienzo L, Cobos A, Moreno V, Caride A, Vieites JM and Diaz O, (2011). Whey protein-based coatings on frozen Atlantic salmon (Salmo salar): Influence of the plasticiser and themoment of coating on quality preservation. Food Chemistry 128:187-194.
Rosenberg, M. (1995). Current and future applications for membrane processes in the dairy industry. Trends in Food Science and Technology, 6:12-19.
Rustad, T.; Hayes, M. (2012). Marine bioactive peptides and protein hydrolysates: Generation, isolation procedures, and biological and chemical characterizations. In Marine Bioactive Compounds: Sources, Characterization and Application. Hayes, M (Ed.), pp. 99-113. Springer Science+Business Media
Salehi, F. (2014). Current and future applications for nanofiltration technology in the food processing. Food and Bioproducts Processing 92:161-177.
Salih, A.M., Smith, D. M., Price, J. F., and Dawson, L. E. (1987). Modified extraction 2-thiobarbituric acid method for measuring lipid oxidation in poultry. Poultry Science 66:1483–1488.
Sayadi, A. R., Tavassoli, S. M. M., Monjezi, M., & Rezaei, M. (2014). Application of neural networks to predict net present value in mining projects. Arabian Journal of Geosciences, 7:1067-1072.

119REFERENCES
Samaranayaka, A.G.P.; Li-Chan, E.C.Y. (2008). Autolysis-assisted production of fish protein hydrolysates with antioxidant properties from Pacific hake (Merluccius productus). Food Chemistry, 107:768-776.
Sampels S, Åsli M, Vogt G. and Mørkøre T. (2010).Berry marinades enhance oxidative stability of herring fillets. Journal of Agricultural Food Chemistry 58:12230-12237.
Sannaveerappa, T.; Carlsson, N-G.; Sandberg, A-S.; Undeland, I. (2007). Antioxidative properties of press juice from herring (Clupea harengus) against hemoglobin (Hb) mediated oxidation of washed cod mince. Journal of Agricultural Food Chemistry, 55:9581-9591.
Sathivel, S.; Bechtel, P.J.; Babbitt, J.; Smiley, S.; Crapo, C.; Reppond, K.D.; Prinyawiwatkul, W. (2003). Biochemical and functional properties of herring (Clupea harengus) byproduct hydrolysates. Journal of Food Science, 68:2196-2200.
Sebba, F. (1987). Foams and biliquid foams-aphrons. Wiley, ChichesterShahidi, F.; Zhong, Y. (2010). Novel antioxidants in food quality preservation and health
promotion. European Journal of Lipid Science and Technology, 112:930-940. Sheehan, J.P.; Wei, I.W.; Ulchaker, M.; Tserng, K-Y. (1997). Effect of high fiber intake in fish
oil-treated patients with non-insulin-dependent diabetes mellitus. American Journal of Clinical Nutrition, 66:183-1187.
Simopoulos, A.P. (1997). Nutritional aspects of fish. In Seafood from producer to consumer. Luten, J.B.; Børresen, T.; Oehlenschlager, J. (Ed.), p. 589-607, Elsevier Science, B.V., Amsterdam.
Stefánsson, G.; Nielsen, H.H.; Guðmundsdóttir, G. (1995). Ripening of spice-salted herring, Report No. 613 (pp. 1-45). Danish Institute of Fisheries Research, Department of Seafood Research, Nordic Council of Ministers.
Stefánsson, G.; Nielsen, H.H.; Skåra, T.; Schubring, R.; Oehlenschläger, J.; Luten, J.; Derrick, S.; Gudmundsdóttir, G. (2000). Frozen herring as raw material for spice-salting. Journal of the Science of Food and Agriculture, 80:1319-1324.
Stuchell YM and Krochta JM, (1995). Edible Coatings on Frozen King Salmon: Effect of Whey Protein Isolate and Acetylated Monoglycerides on Moisture Loss and Lipid Oxidation. Journal of Food Science 60:28-31.
Svensson, V.T.; Andersen, C.M. (2014). EEM fluorescence spectroscopy as a fast method to assess the brine composition of salted herring. LWT - Food Science and Technology 57:775-781.
Taheri A, Farvin KHS, Jacobsen C and Baron CP, (2014). Antioxidant activities and functional properties of protein and peptide fractions isolated from salted herring brine. Food Chemistry 142:318-326.
Trautmann, N.; Beier, M.; Phan, L.-C.; Rosenwinkel, K.-H. (2011). A new approach to energy-efficient treatment of wastewater produced by the fish industry in Vietnam. Water Science and Technology, 64:279-285.
Tsai, L.S., Hernlem, B., Huxsoll, C.C. (2002). Disinfection and solids removal of poultry chiller water by electroflotation. Journal of Food Science 67:2160–2164.
Undeland, I., Ekstrand, B., Lingnert, H. Lipid oxidation in herring (Clupea harengus) light muscle, dark muscle and skin, stored separately or as intact fillets. (1997). J. American Oil Chemists’ Society 75:581–590.
Valero, D., Ortiz, J.M., García, V., Expósito, E., Montiel, V., Aldaz, A. (2011). Electrocoagulation of wastewater from almond industry. Chemosphere. 84:1290–1295.
Vitolo, S.; Patarca, L.; Bresci, B. (1999). Treatment of olive oil industry wastes. Bioresource Technology, 67:129-137.

120 PIPE
Vogt, A.; Gormley, T.R.; Downey, G.; Somers, J. (2002). A comparison of selected rapid methods for fat measurement in fresh herring (Clupea harengus). Journal of Food Composition and Analysis, 15: 205-215.
Von Schacky, C. (2000). n-3 fatty acids and the prevention of coronary atherosclerosis. American Journal of Clinical Nutrition, 71:224-227.
Voskresensky, N.A. (1965). Salted herring. In Fish as food, processing: part 1. Borgstrom, G. (Ed.), Vol. 3, pp. 107-131. Academic press, N.Y. and London.
Vyncke W, (1975). Evaluation of the direct thiobarbituric acid extraction method for determining oxidative rancidity in mackerel (Scomber scombrus L.). Fett. Wiss. Technology 77:239-240.
Wagner, J. (2001). Membrane filtration handbook - Practical tips and hints. 2nd Edition. Osmonics, Inc.
Wang, L.; Wu, Z.; Zhao, B.; Liu, W.; Gao, Y. (2013). Enhancing the adsorption of the proteins in the soy whey wastewater using foam separation column fitted with internal baffles. Journal of Food Engineering, 119:377-384.
Xiao, Y.; Roberts, D.J. (2010). A review of anaerobic treatment of saline wastewater. Environmental Technology, 31:1025-1043.
Xu, L.J.; Sheldon, B.W.; Larick, D.K.; Carawan, R.E. (2002). Recovery and utilization od useful by-products from egg processing wastewater by electrocoagulation. Poultry Science, 81:758-792.
Yanishlieva, N.V.; Marinova, E.; Pokorný, J. (2006). Natural antioxidants from herbs and spices. European Journal of Lipid Science and Technology, 108:776-793.
Young, S.H.; Karel, M. (1978). Reaction of histidine with methyl linoleate: Characterization of the histidine degradation products. Journal of the Amarican Oil Chemists’ Society, 55:352-356.
Zhou, Y.; Fukushima, M.; Miyazaki, H.; Yoshizawa, Y-i.; Hiraoa, K.; Iwamoto, Y.; Sato, K. (2011). Preparation and characterization of tubular porous silicon carbide membrane supports. Journal of Membrane Science, 369:112-118.
Østerberg C. 2014 Personal communication.

121APPENDIXES
10. Appendixes
Appendix A1. In what country is your company located? *❑ Denmark❑ Iceland❑ Norway❑ Sweden❑ Other: ………………………………………….......…
2. What is your company’s name?If you don’t want to answer, please continue to the next question.
3. How many employess work in your company? *❑ < 10❑ 10 - 50❑ 50 - 250❑ > 250
4. What kind of product does your company produce? *❑ Fish meal/Fish oil❑ Fresh Fish/Shellfish or Frozen Fish/Shellfish❑ Processed Fish/Shellfish/Seafood❑ Finished products❑ Other: ..........................................................
5. What is the approximate annual gross revenue for your organization?Please state which currency (DKK, ISK, NOK, SEK) is used. If you do not know the amount or do not want to answer, please continue to the next question.
6. What technologies do you use for wastewater treatment? *❑ None❑ Physical processes (f. ex. filtration, centrifugation)❑ Thermal processes (f.ex. evaporation)❑ Chemical processes (f.ex. coagulation)❑ Advanced processes (f.ex. electrochemistry, membrane filtration)❑ Other: ..........................................................

122 PIPE
7. If applicable to the technology you use, what is done with the sludge generated from the wastewater?If you don’t know, please continue to the next question.
8. Approximately howmuchwastewater (inm3) does your company disposeyearly?If you don’t know, please continue to the next question.
9.Approximatelyhowmuchdoyoupayforthedisposalofeachm3ofwastewater?Please state which currency (DKK, ISK, NOK, SEK) is used. If you do not know the amount or do not want to answer, please continue to the next question.
10. If there was a technology for wastewater treatment that was lowering COD/BODmoreefficiently than thesolutionyouhave inplace today,wouldyoubeinterested?If you don’t know, please continue to the next question.❑ Very interested❑ Interested❑ Neither interested nor not interested❑ Not interested❑ Not interested at all
11. If there was a technology for wastewater treatment that would allow reuse of water, would you be interested?❑ Very interested❑ Interested❑ Neither interested nor not interested❑ Not interested❑ Not interested at all
12. Will the following elements change in the near future, regarding requirements forcleaningwastewater/effluents?If you don’t know, please continue to the next question.
Not likely at all
Not likely Neiter likely nor not likely
Likely Very likely
Environmental pressure from NGOs
❑ ❑ ❑ ❑ ❑
Governmental pressure ❑ ❑ ❑ ❑ ❑Development of new markets ❑ ❑ ❑ ❑ ❑Economic values ❑ ❑ ❑ ❑ ❑

123APPENDIXES
Not likely at all
Not likely Neiter likely nor not likely
Likely Very likely
Consumer views ❑ ❑ ❑ ❑ ❑Image of the company ❑ ❑ ❑ ❑ ❑Retailer requirements ❑ ❑ ❑ ❑ ❑
13.Areyouwillingtoinvesttokeepalowenvironmentalimpact?*❑ Very willing❑ Willing❑ Neither willing nor not willing❑ Not willing❑ Not willing at all
14. What would be the maximum investment you would be ready to make to save 1 million NOK a year in this area? *❑ None❑ 1 to 3❑ 3 to 5❑ 5 - 10❑ More
15. For each of the following statements regarding impacts of implementing a new technology for wastewater treatment, please mark with a cross to show whether you agree or disagree.If you don’t know, please continue to the next question.
Strongly disagree
Disgree Neither agree nor disagree
Agree Strongly agree
Improved reputation of your company because of lower environmental impacts
❑ ❑ ❑ ❑ ❑
Improved reputation of your company because of better social impacts
❑ ❑ ❑ ❑ ❑
Improved reputation of your company because of enhanced revenue
❑ ❑ ❑ ❑ ❑

124 PIPE
Strongly disagree
Disgree Neither agree nor disagree
Agree Strongly agree
Enhanced customer confidence/trust
❑ ❑ ❑ ❑ ❑Lower environmental impact because of reuse of water
❑ ❑ ❑ ❑ ❑
Cost lowering because of reuse of water
❑ ❑ ❑ ❑ ❑
16. Please write below if you can think of other impacts of implementing a new technology.If you can’t think of any, please continue to the next question.
17. If you were to implement a new technology for wastewater treatment, would the following elements be a challenge?If you don’t know, please continue to the next question.
Strongly disagree
DisagreeNeither
agree nor disagree
AgreeStrongly
agree
Need of new technical skills ❑ ❑ ❑ ❑ ❑More labor hours allocated
❑ ❑ ❑ ❑ ❑New working procedures ❑ ❑ ❑ ❑ ❑Rentability ❑ ❑ ❑ ❑ ❑Comply with legislation ❑ ❑ ❑ ❑ ❑
18. Please write below if you can think of any other challenges regarding implementation of a new technology.If you can’t think of any, please proceed to submit the survey.

125APPENDIXES
Appendix B1. What kind of product do you sell? Any bulk and special products? High end and low end
market price range? Customisation of products?
2. To which markets do you sell your products?
3. What is your approximate market share?
4. What characteristics/specifications describe the ideal ingredient for fish feed product regarding the following ?a. Protein / peptide or amino acid compositionb. Lipid / type of fatty acids c. The origin of the protein or lipids (marine, type of fish, crops type?)d. The moisture content of the ingredient - dry/wet (% moisture)?
5. What are the deciding criteria when you purchase a special feed ingredient? (what don’t you want i.e salt)
6. How much do you use on a yearly basis of basic ingredient (protein and lipid) and of any other special feed ingredients (in kg.) to enhance? (-Would be nice to know ratio)a. Protein b. Lipid c. Other
7. Are there many companies already offering to sell any special feed ingredients? Do you know approximately how many companies (what range)?a. Proteinb. Lipidc. Special feed ingredient
8. Is there a big difference between the qualities of feed ingredients that these companies offer?a. Proteinb. Lipidc. Special feed ingredient
9. Is there a big price difference? What is the price range?a. Proteinb. Lipidc. Special feed ingredient
10. When it comes to buying these products, do you consider quality before price?a. Proteinb. Lipidc. Special feed ingredient

126 PIPE
11. How much are you willing to pay for a product consisting of the characteristics that you want (per kg.)?a. Proteinb. Lipidc. Special feed ingredient
12. Compared to other sources available, how keen are you to buy proteins, lipids and special feed ingredients from marine sources?
13. How would you describe the need for proteins and lipids and special feed ingredient in the years to come (for the whole market)? Is the demand increasing or decreasing? And why?a. Proteinb. Lipidc. Special feed ingredient
14. Would you consider buying proteins, lipids and special ingredient from a new supplier (are there some hurdles, switching costs, long-term contracts, friendship or other factors that could affect the decision)?

127TABLE OF ABSTRACT
Series title, number and report code of publication:Nordic Innovation Publication 2015:09
TABLE OF ABSTRACT
Author(s): Caroline P. Baron1,Carsten Østerberg2, Christian Kemp3, Eva Rós Brink4, Gudrun Olafsdottir4, Susanne Folmer5, Nina Gringer1, Catharina Eriksson6, Tore Svendsen7, Ingrid Undeland8
Organisation(s):1Technical University of Denmark (DTU), 2Fisk og Fødevare Support, 3A-Factory, 4University of Iceland, 5Lykkeberg A/S, 6 Paul Mattson AB, 7LiqTech, 8Chalmers University of Technology
Title (full title of the report):
PIPE Pelagic Industry Processing Effluents Innovative and Sustainable Solutions
Abstract:Process waters generated during production of acid marinated and old fashion marinated herring at the primary and the secondary producers were subjected to compositional analyses and fractionation. Samples were taken whilst storing, filleting, brining and marinating herring. The strategies followed a targeted approach for specific process water streams. Ceramic membrane technology (Utrafiltration, UF) as well as electrochemistry (Electrofloculation, EF) were tested separately and in combination to recover biomolecules from the richest process waters. The performance of the two technologies UF & EF were compared and the most promising technology (UF) was scaled up and investigated further at the pilot scale on site for selected process waters.
Compounds such as fatty acids, protein, peptides amino acids, vitamins, trace elements, salt and pH were quantified in the process waters before and after the EF and UF separation treatments. In two studies, fractions recovered during UF-treatment were separated further and characterized for peptides, polyphenols and antioxidant capacity in vitro (test tubes) and in food systems as herring glazing agents or as additives in herring mince. The quality of the fractions was also estimated by performing a selection of functionality tests including emulsifying, and foaming properties. Permeates from UF-separation were considered for biotechnological applications since they are highly dense in nutrients. Experiments were performed to evaluate the fractions as growth media for microalgae. The cost for implementing UF using ceramic membranes was investigated. A full cost benefit analysis was performed aligned with the cost of technology installation and the cost of effluent discharge and treatment. In addition the market potential for recovered biomolecules in the Nordic countries was evaluated for herring producers and for other fish feed or food processing companies.
ISBN978-82-8277-082-8 (print)978-82-8277-081-1 (URL: http://www.nordicinnovation.org/publications/)
Language: EN
Name of Nordic Innovation programme (if relevant):
Commissioned by (if relevant):
Name of project: Project acronym (if relevant):
Nordic Innovation project number:1079
Pages:128
Date:
Keywords: Fish processing, herring, membrane, filtration, biomass, valorisation.
Publisher:Nordic InnovationStensberggata 25, NO-0170 Oslo, NorwayPhone: +47 – 47 61 44 [email protected] www.nordicinnovation.org
Main contact person:Name: Caroline P. BaronOrganisation: DTU, National Food InstituteAddress: Søltoft Plads,Phone: +45 45254919Email: [email protected]

PIPEPelagic Industry Processing Effluents Innovative and Sustainable Solutions
Volumes of effluents from herring processing industries are important and their organic loads are high, which means that the cost imparted for their discharge is substantial. However, the original processing waters contain molecules with good market potential which are discarded as effluents. Most technological solutions available today do not fit the herring industries due to their poor flux and their poor chemical tolerance and also because they are not well suited for recovery and further valorisation of organic fractions. The vision with the PIPE project has been to test cutting edge technologies, and characterize as well as valorise the organic material collected from herring industries processing waters -before they become effluents and thereby increase sustainability.
Nordic Innovation is an institution under Nordic Council of Ministers that facilitates sustainable growth in the Nordic region. Our mission is to orchestrate increased value creation through international cooperation.
We stimulate innovation, remove barriers and build relations through Nordic cooperation
NORDIC INNOVATION, Stensberggata 25, NO-0170 Oslo // Phone (+47) 47 61 44 00 // Fax (+47) 22 56 55 65 // [email protected]