peel development commission - parliament.wa.gov.au · peel development commission mission statement...
TRANSCRIPT
Peel Development CommissionANNUAL REPORT 2007-2008
BUILDING A STRONGER FUTURE
Peel Development Commission
Mission Statement Lead and encourage economic growth and strong communities within a healthy environment.
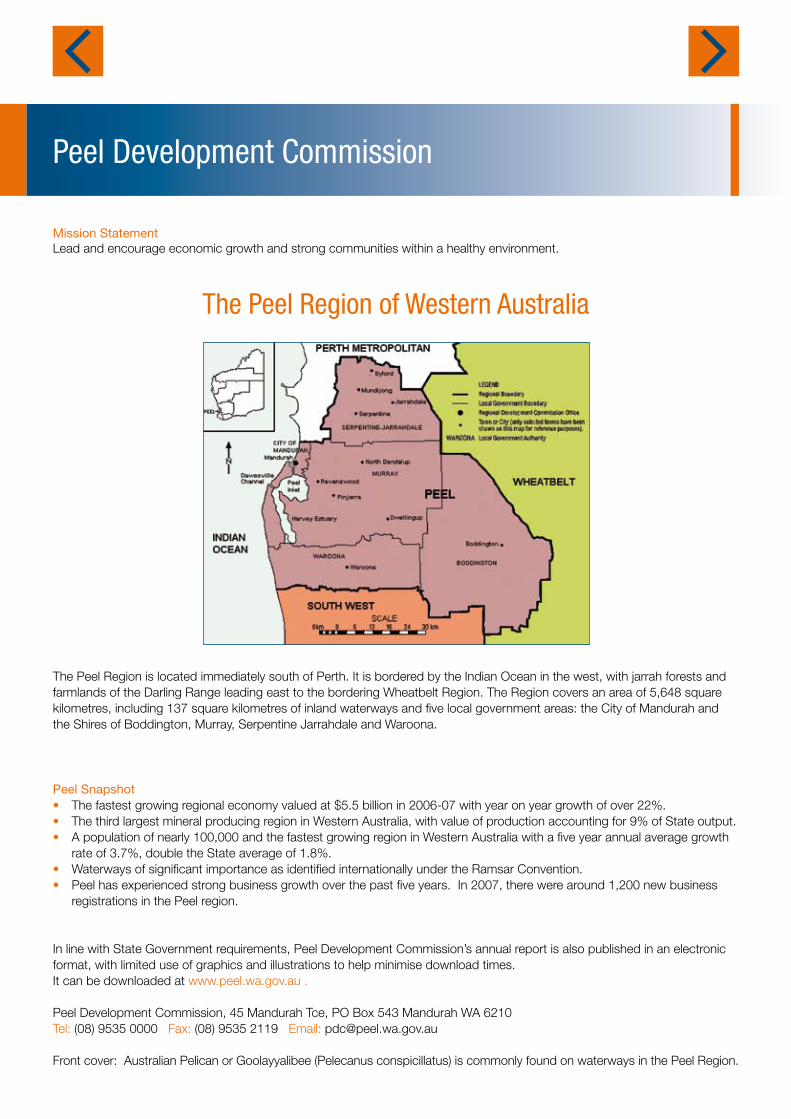
The Peel Region is located immediately south of Perth. It is bordered by the Indian Ocean in the west, with jarrah forests and farmlands of the Darling Range leading east to the bordering Wheatbelt Region. The Region covers an area of 5,648 square kilometres, including 137 square kilometres of inland waterways and five local government areas: the City of Mandurah and the Shires of Boddington, Murray, Serpentine Jarrahdale and Waroona.
Peel Snapshot• The fastest growing regional economy valued at $5.5 billion in 2006-07 with year on year growth of over 22%.• The third largest mineral producing region in Western Australia, with value of production accounting for 9% of State output.• A population of nearly 100,000 and the fastest growing region in Western Australia with a five year annual average growth rate of 3.7%, double the State average of 1.8%.• Waterways of significant importance as identified internationally under the Ramsar Convention.• Peel has experienced strong business growth over the past five years. In 2007, there were around 1,200 new business registrations in the Peel region.
In line with State Government requirements, Peel Development Commission’s annual report is also published in an electronic format, with limited use of graphics and illustrations to help minimise download times. It can be downloaded at www.peel.wa.gov.au .
Peel Development Commission, 45 Mandurah Tce, PO Box 543 Mandurah WA 6210Tel: (08) 9535 0000 Fax: (08) 9535 2119 Email: [email protected]
Front cover: Australian Pelican or Goolayyalibee (Pelecanus conspicillatus) is commonly found on waterways in the Peel Region.
The Peel Region of Western Australia
Statement of Compliance 2
Executive Summary 3Chairman’s Report 4How We Operate 6Our Board 7Our Staff 10Other Key Legislation 11Performance Management Framework 12Our Outcomes 13
Significant Issues and Trends 14
Agency Performance - Report on Operations 16Summary of Key Performance Indicators 17Major Projects and Achievements 2007-08 18Outcome 1 – Planning in Partnership for a Sustainable Future 19Case Study: Pinjarra Brunswick Sustainability Strategy 19Outcome 2 – Improved Regional Infrastructure 21Case Study: Boddington Social Infrastructure Project 21Outcome 3 – Increased Diversification in the Regional Economy, and Enhanced Regional Investment 23Outcome 4 – A Skilled Region 24Case Study: 2007 Southern Region Community Leadership Forum 24Outcome 5 – Enhanced Quality of Life 25Outcome 6 – Conservation and Restoration of the Region’s Natural and Built Heritage 26Case Study: Ecological Character Description for the Ramsar Listed Peel-Yalgorup System 26Outcome 7 – Government Decision-Making is Based on a Thorough Understanding of Peel Region’s Issues 27
Disclosures and Legal Compliance 29Financial Statements 31Detailed Key Performance Indicator Information 57Ministerial Directives 59Other Financial Disclosures 59Governance Disclosures 60Other Legal Requirements 61Government Policy Requirements 63
Publications 65
Peel Development Commission Annual Report 2007-20081
Contents
2Peel Development Commission Annual Report 2007-2008
Statement of Compliance
Hon David Templeman MLAMinister for the Environment; Climate Change; Peel
Sir,
In accordance with Section 61(1) of the Financial Management Act 2006, we hereby submit for your information and presentation to Parliament, the Annual Report of the Peel Development Commission for the financial year ended 30 June 2008.
The Annual Report has been prepared in accordance with the provisions of the Financial Management Act 2006.
To fulfil the responsibilities required under Section 61 (1) of the Financial Management Act 2006, the Peel Development Commission has complied with the following relevant written law:
• Regional Development Commissions Act (1993)• Financial Management Act (2006)• Public Sector Management Act (1994)
At the date of signing we are not aware of any circumstances which would render the particulars of this statement misleading or inaccurate.
Hon John CowdellChairmanPeel Development Commission1 September 2008
Maree De LaceyChief Executive OfficerPeel Development Commission1 September 2008
Peel Development Commission Annual Report 2007-20083
Executive Summary
The Peel Region (for detail, refer to Significant Issues and Trends, page 14):• Peel is the fourth largest regional economy in WA and the fastest growing.• Peel is the third largest mineral producing region in WA.• In 2007, the Shires of Waroona, Boddington and Murray provided feedstock for WA’s total output of alumina, valued at $4.7billion.• Infrastructure provision remains a priority, with this financial year seeing outcomes including the marketing of Stage 1 of Pinjarra Industrial Estate, the commencement of services on the Southern Suburbs Rail, commitment of funds to the Mandurah Entrance Road and work on the Pinjarra-Williams Road including planning works on the Pinjarra Southern Bypass.• Peel includes 137 square kilometres of inland waterways, incorporating wetlands of international significance and world- renowned bird habitats. Climate change is a significant issue for the region and the Commission is researching initiatives to address this environmental challenge.
The Peel Development Commission:• Development Commissions are the regionally-based link between government policy and planning and regional aspirations and needs. • Peel Development Commission operates under the Regional Development Commissions Act 1993 and reports to the Minister for Peel, Hon David Templeman MLA. • The Commission’s Strategic Plan 2005-2008 provides the strategic direction for all of the Commission’s activities. The outcome headings identified in the strategic plan were taken directly from the Framework for the Strategic Management of the WA Public Sector. • The Commission’s major projects and achievements, outlined from page 18, reflect how our activities are directed by the Strategic Plan and Significant Issues and Trends.
Agency Performance (for detail, refer to Detailed Key Performance Indicator Information from page 57):• The Commission’s stakeholder survey showed an increase in stakeholder satisfaction in outcome areas of “facilitation and coordination” and “contribution to the economic base” and a decrease in satisfaction in the outcome area of “advice and information”.• Efficiency Indicators, based on cost per service hour and listed on page 17, showed the Commission service areas, Facilitation and Coordination at $82.05, and Information and Advice at $46.58. Due to a change in the calculation methodology, the efficiency indicators are not directly comparable with previous years.• The Commission’s performance compared to budget targets showed the net cost of the Commission’s services totalled $5.25 million against a target of $3.669 million. The variation reflects expenditure from previous years carried forward, and additional funds received for specific projects. Equity and cash at hand was also higher than the target, for the same reason.• Peel Development Commission has complied with the requirements of the Financial Management Act 2006, the Public Sector Management Act 1994 and all other relevant law and standards.
4Peel Development Commission Annual Report 2007-2008
Chairman’s Report
Western Australia’s smallest region is playing a very big part in the future of this State.
The Peel is WA’s fastest growing regional economy with yearly growth at over 21%. It is the third largest mineral producing region in WA. Peel has the largest bauxite mine in the world at Pinjarra and is developing one of the biggest open cut gold mines in the southern hemisphere at Boddington. The region has over $5 billion of major projects underway or planned.
Peel Development Commission is proud to be part of this success story.
In 2007-08 Peel Development Commission directly funded regional projects with a value of over $30 million including work on climate change adaptation, industrial land, improvements to town centres, initiatives to address skills shortages and projects that will result in better health for the region’s waterways. The Commission was pleased to play a leadership role in the release of Stage 1 of Pinjarra Industrial Estate this year, representing a $20 million commitment by the State Government to address identified demand. The leadership of LandCorp, with the Department of Planning and Infrastructure, Department of Water and the Shire of Murray is particularly appreciated.
Among our major projects this year, the Commission coordinated the expansion of community infrastructure to meet the needs of Boddington and surrounds, supported by $9 million from the State Government. A total of 25 projects were progressed or completed during the year across the local governments of Boddington, Wandering and Murray which will provide a firm foundation for the growth of the area associated with the operation of the Boddington Gold Mine. State agencies have allocated over $10 million in additional funds to infrastructure priorities in the Boddington area including health, road works and electricity transmission lines. I appreciate the partnership of the Shire of Boddington, Department of Infrastructure and Resources, the Shires of Murray and Wandering, Boddington Gold Mine and Worsley Alumina in this important project.
2007-08 saw further progress on the implementation of the Pinjarra Brunswick Sustainability Strategy, with the State’s $2.6 million investment resulting in the development of five tourism packages, the start-up of a Peel Farmers’ Market, the delivery of training to work sites across the Region, strengthening of the capacity for local businesses to access industry contracts, and significant progress on Waroona’s town centre redevelopment. Next year sees the completion of this comprehensive project which is playing a major role in strengthening the diversity of our economy and supporting local jobs for local people.
Peel Development Commission’s main focus is on positioning the region to take best advantage from today’s growth for a strong future for our community and, by extension, the State. This includes our active involvement in strategies that protect the long-term health of our environment and iconic waterways. This year we have supported the development of benchmark data on the health of our waterways and the employment of an officer to work across the region’s local government authorities on the priority issue of climate change. The Commission was also pleased to support Murdoch University in its groundbreaking regional study of 2000 children in Peel. This longitudinal study, the first of its kind, will result in better information for families in Peel and across the world about how we can have stronger, healthier families.
The Commission was active in all parts of the Region throughout the year, with activities including support for planning for industrial land and transport needs in Serpentine Jarrahdale; strategic planning in Murray and land use planning at Dwellingup; Mandurah’s East-West Road link between the transit station and CBD; Boddington’s Old School; and infrastructure for Quambie Park at Waroona.
33 projects valued at over $8.8 million were funded through the 2007-08 round of the Regional Development Scheme.
The Commission’s advocacy of Peel Regional Priorities with the Australian Government resulted in over $166 million being allocated to priorities including the new Perth Bunbury Highway, Mandurah Entrance Road, Mandurah CBD Redevelopment, Waroona Town Centre Redevelopment, water management and climate change initiatives.
I congratulate the Board, Chief Executive Officer and staff for their efforts during the 2007-08 year. We look forward to many more achievements for this dynamic region into the future.
Hon John Cowdell, Chairman
Chairman’s Report continued
Peel Development Commission Annual Report 2007-20085
How We Operate
6Peel Development Commission Annual Report 2007-2008
Enabling LegislationThe Peel Development Commission was established by the State Government on 1 January 1993 under the Regional Development Commissions Act 1993. The Commission is one of nine regional development commissions each governed by the same legislation.
Objects and PowersUnder the Regional Development Commissions Act 1993, the objects of the Commission are to:• Maximise job creation and improve career opportunities in the region;• Develop and broaden the economic base of the region;• Identify infrastructure services to promote economic and social development within the region;• Provide information and advice to promote business development within the region;• Seek to ensure that the general standard of government services and access to those services in the region is comparable to that which applies in the metropolitan area; and• Generally take steps to encourage, promote, facilitate and monitor the economic development of the region.
For the purposes of achieving those objects, the Commission is to:• Promote the region;• Facilitate coordination between relevant statutory bodies and State government agencies;• Cooperate with representatives of industry and commerce, employer and employee organisations, education and training institutions and other sections of the community within the region;• Identify the opportunities for investment in the region and encourage that investment;• Identify the infrastructure needs of the region, and encourage the provision of that infrastructure in the region; and• Cooperate with – departments of the Public Service of the State and the Commonwealth, and other agencies, instrumentalities and statutory bodies of the State and the Commonwealth; and local government authorities, in order to promote equitable delivery of services throughout the region.
In addition to complying with the Regional Development Commissions Act, the Commission’s direction is influenced by the State Government’s Strategic Framework and by the regional priorities identified annually through extensive stakeholder consultation.
Responsible MinisterThe Hon David Templeman MLA is Minister for Peel. The Minister responsible for the Commission has the power to direct the Commission, either generally or with respect to a particular matter, on the exercise and performance of its powers, functions and duties under the Regional Development Commissions Act 1993.
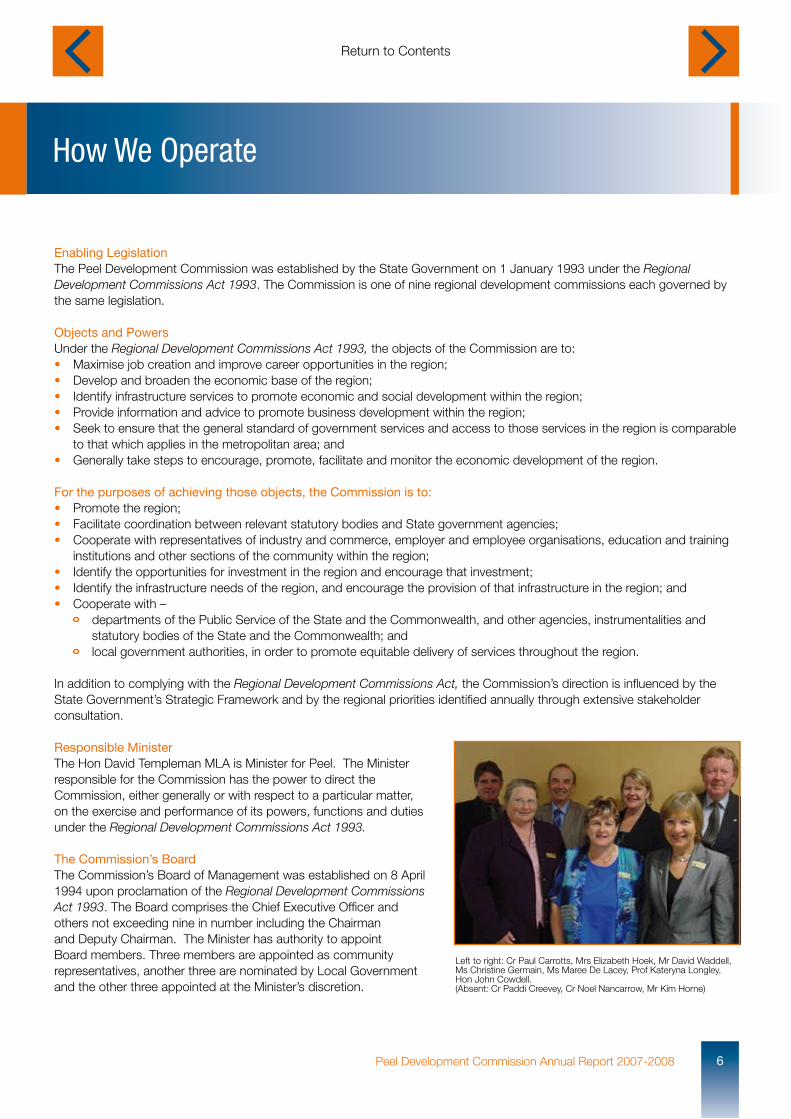
The Commission’s BoardThe Commission’s Board of Management was established on 8 April 1994 upon proclamation of the Regional Development Commissions Act 1993. The Board comprises the Chief Executive Officer and others not exceeding nine in number including the Chairman and Deputy Chairman. The Minister has authority to appoint Board members. Three members are appointed as community representatives, another three are nominated by Local Government and the other three appointed at the Minister’s discretion.
Left to right: Cr Paul Carrotts, Mrs Elizabeth Hoek, Mr David Waddell, Ms Christine Germain, Ms Maree De Lacey, Prof Kateryna Longley, Hon John Cowdell. (Absent: Cr Paddi Creevey, Cr Noel Nancarrow, Mr Kim Horne)
Our Board
Peel Development Commission Annual Report 2007-20087
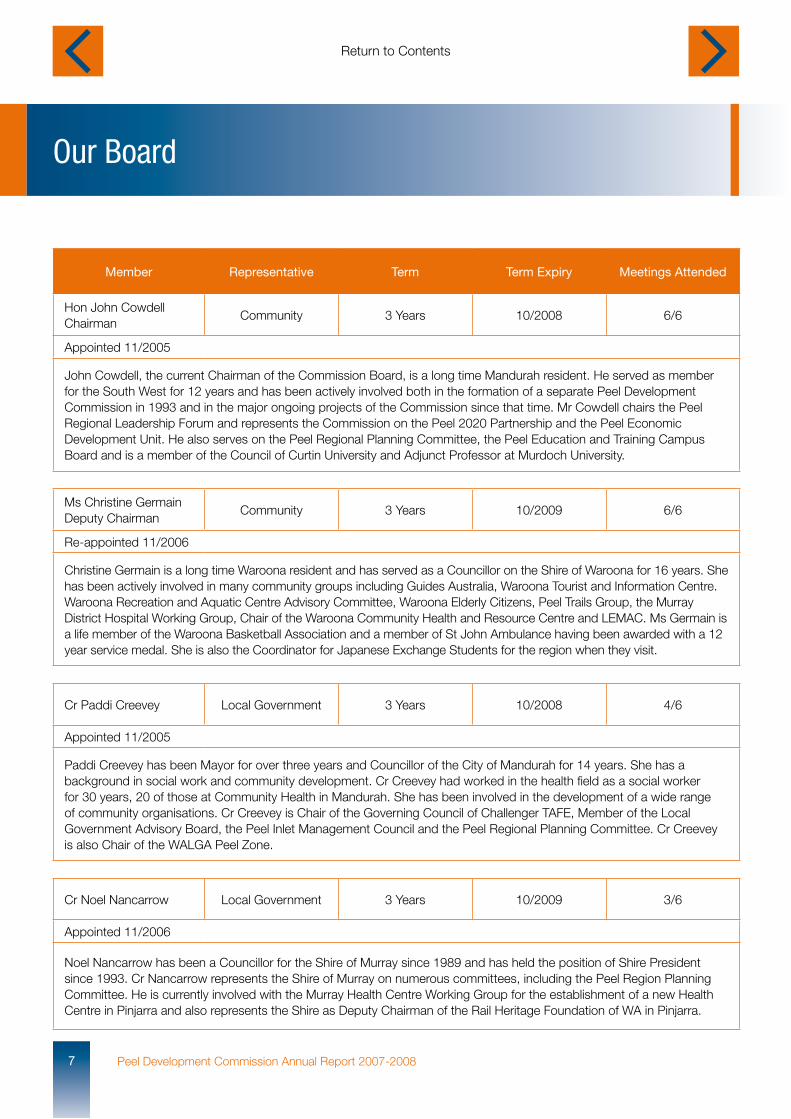
Member Representative Term Term Expiry Meetings Attended
Hon John CowdellChairman
Community 3 Years 10/2008 6/6
Appointed 11/2005
John Cowdell, the current Chairman of the Commission Board, is a long time Mandurah resident. He served as member for the South West for 12 years and has been actively involved both in the formation of a separate Peel Development Commission in 1993 and in the major ongoing projects of the Commission since that time. Mr Cowdell chairs the Peel Regional Leadership Forum and represents the Commission on the Peel 2020 Partnership and the Peel Economic Development Unit. He also serves on the Peel Regional Planning Committee, the Peel Education and Training Campus Board and is a member of the Council of Curtin University and Adjunct Professor at Murdoch University.
Ms Christine GermainDeputy Chairman
Community 3 Years 10/2009 6/6
Re-appointed 11/2006
Christine Germain is a long time Waroona resident and has served as a Councillor on the Shire of Waroona for 16 years. She has been actively involved in many community groups including Guides Australia, Waroona Tourist and Information Centre. Waroona Recreation and Aquatic Centre Advisory Committee, Waroona Elderly Citizens, Peel Trails Group, the Murray District Hospital Working Group, Chair of the Waroona Community Health and Resource Centre and LEMAC. Ms Germain is a life member of the Waroona Basketball Association and a member of St John Ambulance having been awarded with a 12 year service medal. She is also the Coordinator for Japanese Exchange Students for the region when they visit.
Cr Paddi Creevey Local Government 3 Years 10/2008 4/6
Appointed 11/2005
Paddi Creevey has been Mayor for over three years and Councillor of the City of Mandurah for 14 years. She has a background in social work and community development. Cr Creevey had worked in the health field as a social worker for 30 years, 20 of those at Community Health in Mandurah. She has been involved in the development of a wide range of community organisations. Cr Creevey is Chair of the Governing Council of Challenger TAFE, Member of the Local Government Advisory Board, the Peel Inlet Management Council and the Peel Regional Planning Committee. Cr Creevey is also Chair of the WALGA Peel Zone.
Cr Noel Nancarrow Local Government 3 Years 10/2009 3/6
Appointed 11/2006
Noel Nancarrow has been a Councillor for the Shire of Murray since 1989 and has held the position of Shire President since 1993. Cr Nancarrow represents the Shire of Murray on numerous committees, including the Peel Region Planning Committee. He is currently involved with the Murray Health Centre Working Group for the establishment of a new Health Centre in Pinjarra and also represents the Shire as Deputy Chairman of the Rail Heritage Foundation of WA in Pinjarra.
Our Board continued
8Peel Development Commission Annual Report 2007-2008
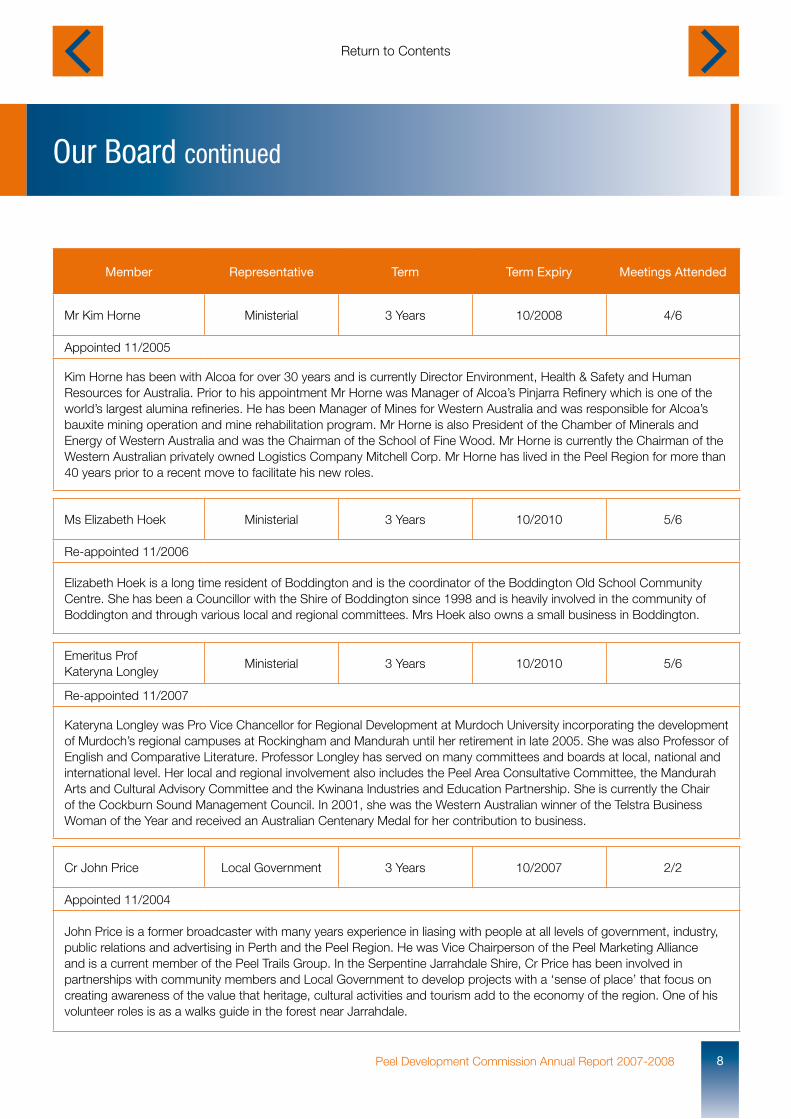
Member Representative Term Term Expiry Meetings Attended
Mr Kim Horne Ministerial 3 Years 10/2008 4/6
Appointed 11/2005
Kim Horne has been with Alcoa for over 30 years and is currently Director Environment, Health & Safety and Human Resources for Australia. Prior to his appointment Mr Horne was Manager of Alcoa’s Pinjarra Refinery which is one of the world’s largest alumina refineries. He has been Manager of Mines for Western Australia and was responsible for Alcoa’s bauxite mining operation and mine rehabilitation program. Mr Horne is also President of the Chamber of Minerals and Energy of Western Australia and was the Chairman of the School of Fine Wood. Mr Horne is currently the Chairman of the Western Australian privately owned Logistics Company Mitchell Corp. Mr Horne has lived in the Peel Region for more than 40 years prior to a recent move to facilitate his new roles.
Ms Elizabeth Hoek Ministerial 3 Years 10/2010 5/6
Re-appointed 11/2006
Elizabeth Hoek is a long time resident of Boddington and is the coordinator of the Boddington Old School Community Centre. She has been a Councillor with the Shire of Boddington since 1998 and is heavily involved in the community of Boddington and through various local and regional committees. Mrs Hoek also owns a small business in Boddington.
Emeritus ProfKateryna Longley
Ministerial 3 Years 10/2010 5/6
Re-appointed 11/2007
Kateryna Longley was Pro Vice Chancellor for Regional Development at Murdoch University incorporating the development of Murdoch’s regional campuses at Rockingham and Mandurah until her retirement in late 2005. She was also Professor of English and Comparative Literature. Professor Longley has served on many committees and boards at local, national and international level. Her local and regional involvement also includes the Peel Area Consultative Committee, the Mandurah Arts and Cultural Advisory Committee and the Kwinana Industries and Education Partnership. She is currently the Chair of the Cockburn Sound Management Council. In 2001, she was the Western Australian winner of the Telstra Business Woman of the Year and received an Australian Centenary Medal for her contribution to business.
Cr John Price Local Government 3 Years 10/2007 2/2
Appointed 11/2004
John Price is a former broadcaster with many years experience in liasing with people at all levels of government, industry, public relations and advertising in Perth and the Peel Region. He was Vice Chairperson of the Peel Marketing Alliance and is a current member of the Peel Trails Group. In the Serpentine Jarrahdale Shire, Cr Price has been involved in partnerships with community members and Local Government to develop projects with a ‘sense of place’ that focus on creating awareness of the value that heritage, cultural activities and tourism add to the economy of the region. One of his volunteer roles is as a walks guide in the forest near Jarrahdale.
Our Board continued
Peel Development Commission Annual Report 2007-20089
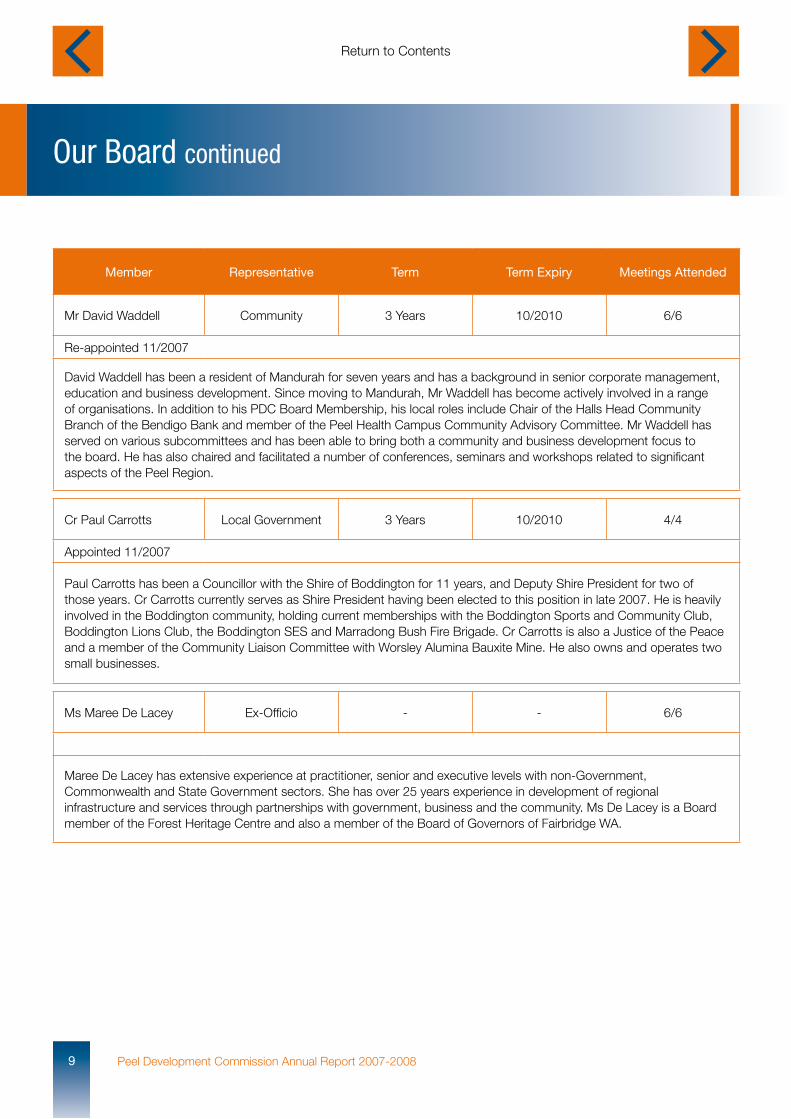
Member Representative Term Term Expiry Meetings Attended
Mr David Waddell Community 3 Years 10/2010 6/6
Re-appointed 11/2007
David Waddell has been a resident of Mandurah for seven years and has a background in senior corporate management, education and business development. Since moving to Mandurah, Mr Waddell has become actively involved in a range of organisations. In addition to his PDC Board Membership, his local roles include Chair of the Halls Head Community Branch of the Bendigo Bank and member of the Peel Health Campus Community Advisory Committee. Mr Waddell has served on various subcommittees and has been able to bring both a community and business development focus to the board. He has also chaired and facilitated a number of conferences, seminars and workshops related to significant aspects of the Peel Region.
Cr Paul Carrotts Local Government 3 Years 10/2010 4/4
Appointed 11/2007
Paul Carrotts has been a Councillor with the Shire of Boddington for 11 years, and Deputy Shire President for two of those years. Cr Carrotts currently serves as Shire President having been elected to this position in late 2007. He is heavily involved in the Boddington community, holding current memberships with the Boddington Sports and Community Club, Boddington Lions Club, the Boddington SES and Marradong Bush Fire Brigade. Cr Carrotts is also a Justice of the Peace and a member of the Community Liaison Committee with Worsley Alumina Bauxite Mine. He also owns and operates two small businesses.
Ms Maree De Lacey Ex-Officio - - 6/6
Maree De Lacey has extensive experience at practitioner, senior and executive levels with non-Government, Commonwealth and State Government sectors. She has over 25 years experience in development of regional infrastructure and services through partnerships with government, business and the community. Ms De Lacey is a Board member of the Forest Heritage Centre and also a member of the Board of Governors of Fairbridge WA.
Our Staff
10Peel Development Commission Annual Report 2007-2008
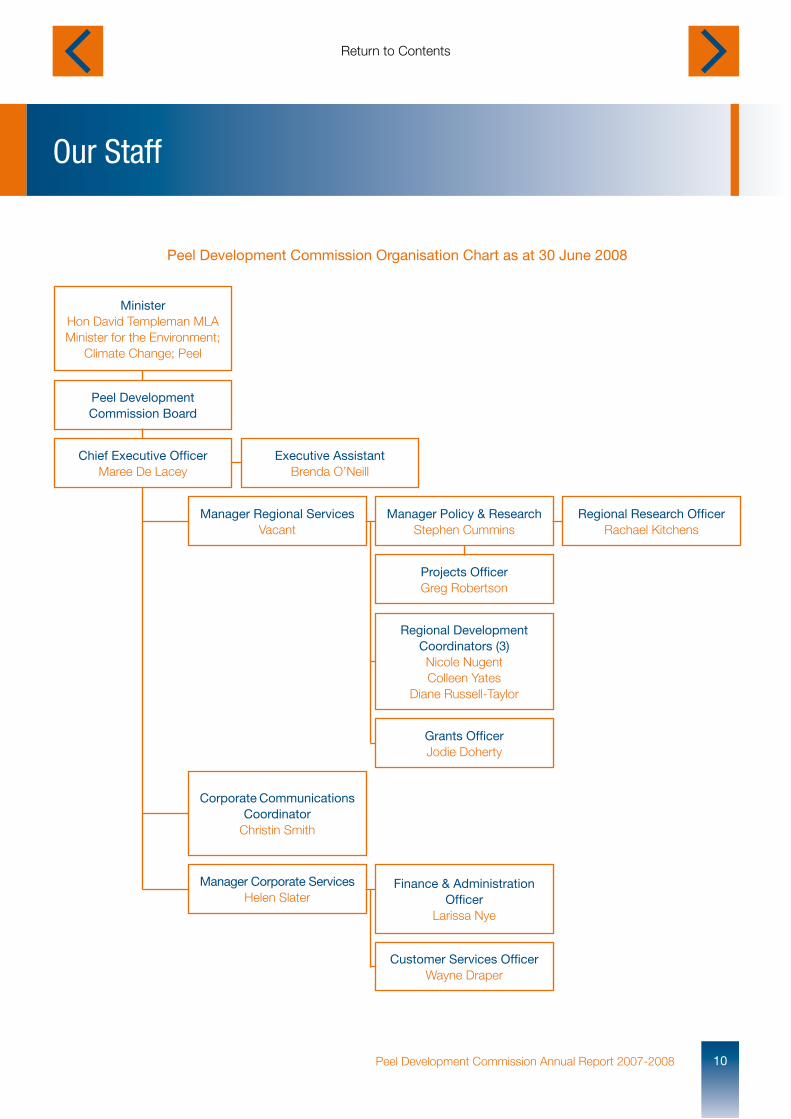
Peel Development Commission Organisation Chart as at 30 June 2008
MinisterHon David Templeman MLAMinister for the Environment;
Climate Change; Peel
Manager Corporate ServicesHelen Slater
Corporate Communications Coordinator
Christin Smith
Customer Services OfficerWayne Draper
Grants OfficerJodie Doherty
Regional DevelopmentCoordinators (3)Nicole NugentColleen Yates
Diane Russell-Taylor
Projects OfficerGreg Robertson
Regional Research OfficerRachael Kitchens
Manager Policy & ResearchStephen Cummins
Manager Regional ServicesVacant
Executive AssistantBrenda O’Neill
Chief Executive OfficerMaree De Lacey
Peel Development Commission Board
Finance & Administration Officer
Larissa Nye
Other Key Legislation
Peel Development Commission Annual Report 2007-200811
In the performance of its functions, the Peel Development Commission complies with the following statutes:
• Regional Development Commissions Act 1993;• Financial Management Act 2006;• Library Board of Western Australia Act 1951;• Public Interest Disclosure Act 2003;• Public Sector Management Act 1994;• Equal Opportunity Act 1984;• Occupational Safety and Health Act 1984;• Salaries and Allowances Act 1975;• Disability Services Act 1993;• State Records Act 2000;• Electoral Act 1907;• Freedom of Information Act 1992;• Industrial Relations Act 1979;• Minimum Conditions of Employment Act 1993;• Workplace Agreements Act 1993; and• Circulars to Ministers from the Premier.
In its financial administration, the Commission has complied with the requirements of the Financial Management Act 2006, and all other relevant law, and exercised controls that provide reasonable assurance that the receipt and expenditure of monies, the acquisition and disposal of public property and the incurring of liabilities have been in accordance with the legislative provisions.
In accordance with subsection 31(1) of the Public Sector Management Act 1994 the Commission has, in its administration, complied with the Public Sector Standards in Human Resource Management and the Western Australian Code of Ethics and Code of Conduct. The Commission has put in place procedures designed to ensure such compliance as well as conducted the appropriate internal checks to satisfy its duty of compliance.
No applications have been lodged which have caused the Commission to review the standards or any matter pertaining to them. At the end of the period of reporting the Commission is unaware of any circumstances that would render the particulars included in this document misleading or inaccurate.
Performance Management Framework
12Peel Development Commission Annual Report 2007-2008
Outcome Based Management FrameworkThe Peel Development Commission’s guiding framework is the Regional Development Commissions Act 1993. The Commission also reports on its achievements against the State Government’s Better Planning: Better Futures – A Framework for the Strategic Management of the Western Australian Public Sector. Our focus is primarily on Goal 4 of this framework which is “Regional Development”.
Strategic PlanThe Peel Development Commission’s Strategic Plan 2005-2008 provides the strategic direction for all of the Commission’s activities. The outcome headings identified in the Strategic Plan are taken directly from the previous Framework for the Strategic Management of the Western Australian Public Sector. The Commission’s Strategic Plan has been reviewed, and the 2008-2013 Strategic Plan reflects the goals and outcomes of Better Planning: Better Futures – A Framework for the Strategic Management of the Western Australian Public Sector released in 2006-07. The Strategic Plan is available on the website www.peel.wa.gov.au .
Our VisionA prosperous and healthy Peel Region.
Our MissionLead and encourage economic growth and strong communities within a healthy environment.
Our Commitment• Accountability We are accountable – individually and as a team – for our actions, behaviour and outcomes. We are honest, transparent, and ethical in all our interactions.• Professionalism Our work is founded on evidence-based approaches. We continually strive to improve our skills and knowledge and to apply them to the development of our region. We are proactive and responsive and we deliver on our commitments. • Partnership We respect and value our existing partnerships, and are committed to further strengthening and developing partnerships that support the sustainable development of the Peel Region.• Sustainability Our work is focused on meeting the needs of current and future generations through the integration of environmental protection, social advancement and economic prosperity.• Innovation We value the past while building the future. We actively seek new and better approaches to regional development and seek opportunities to share ideas and approaches.• Equity We value the diversity of the region’s people, and actively seek the input of those affected by our work or our decisions. We actively pursue opportunities to improve the lives of disadvantaged people and sections of the community, while focusing on the strategic long-term development of the region.• Efficiency We apply our resources wisely. Our efforts are directed to those strategies that will contribute strongly to a better long- term future for the whole region.• Reliability Our advice to all spheres of Government and others is well-considered, timely and reliable.
Our Outcomes
Peel Development Commission Annual Report 2007-200813
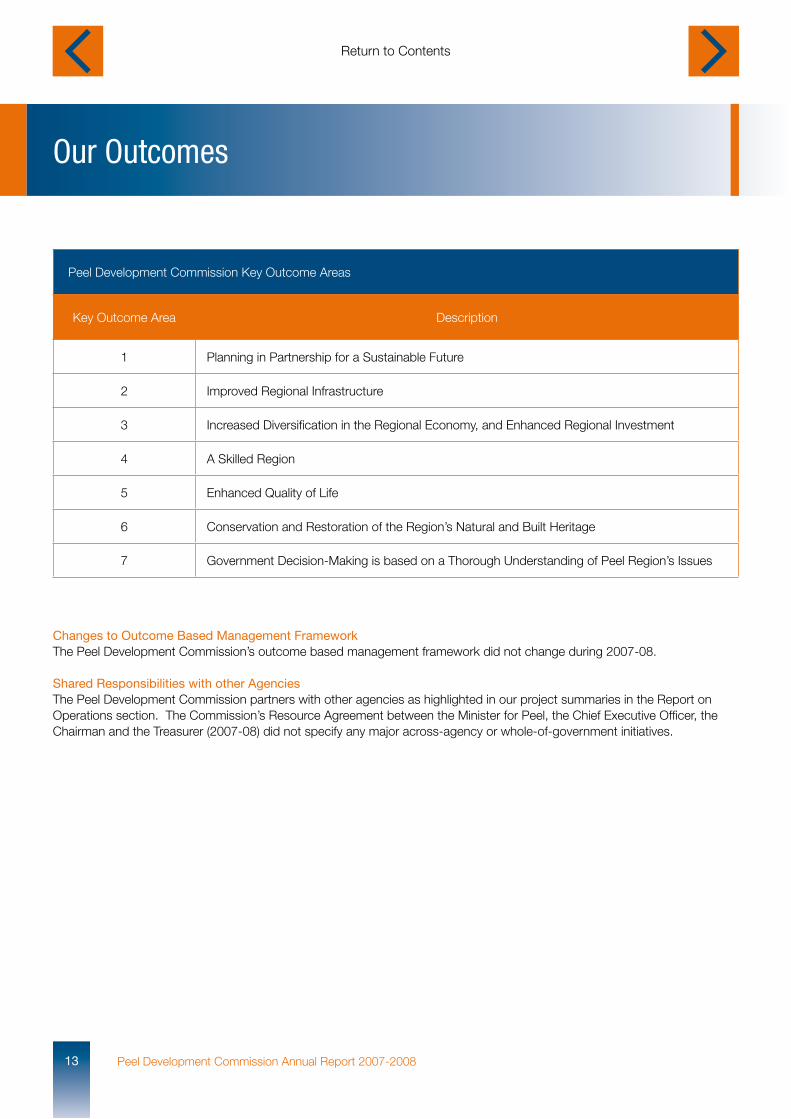
Peel Development Commission Key Outcome Areas
Key Outcome Area Description
1 Planning in Partnership for a Sustainable Future
2 Improved Regional Infrastructure
3 Increased Diversification in the Regional Economy, and Enhanced Regional Investment
4 A Skilled Region
5 Enhanced Quality of Life
6 Conservation and Restoration of the Region’s Natural and Built Heritage
7 Government Decision-Making is based on a Thorough Understanding of Peel Region’s Issues
Changes to Outcome Based Management FrameworkThe Peel Development Commission’s outcome based management framework did not change during 2007-08.
Shared Responsibilities with other AgenciesThe Peel Development Commission partners with other agencies as highlighted in our project summaries in the Report on Operations section. The Commission’s Resource Agreement between the Minister for Peel, the Chief Executive Officer, the Chairman and the Treasurer (2007-08) did not specify any major across-agency or whole-of-government initiatives.
Significant Issues and Trends
14Peel Development Commission Annual Report 2007-2008
• From 1996 to 2006, Peel’s average annual population growth rate was 3.3%, compared to 1.6% for the State and 1.4% for regional Western Australia.
• The regional economy remains strong. In 2006-07, the gross regional product was $5.5 billion, a 22% increase from the previous financial year. Peel is the fourth largest regional economy in Western Australia and the fastest growing.
• Much of this economic activity is driven by mining developments and population growth, with the main industry sectors being mining; rental, hiring and real estate services; manufacturing; and construction. Together, these make up 70% of the gross regional product. The Commission is proactive in encouraging economic diversity in order to ensure a sustainable regional economy into the future.
• Peel is the third largest mineral producing region in Western Australia, with its value of production accounting for 9% of State output. In 2007, the Shires of Boddington, Murray and Waroona provided feedstock for Western Australia’s total output of alumina, valued at $4.7 billion. This equates to about 30% of the world’s alumina. The State Government also collected royalties valued at $85 million from the production of alumina.
• The development of industrial land has been identified as the Region’s highest infrastructure priority, with a current shortage impacting on the Region’s economic, business and jobs growth. The Commission is addressing this through leadership of the Peel Industrial Land Steering Group, which coordinates required actions to ensure the development of industrial land meets the short, medium and long term requirements of the Peel.
• The Boddington Gold Mine redevelopment is generating a rapid physical and community infrastructure need for Boddington and surrounding areas. An allocation of $9 million was made by the State Government towards community infrastructure in order to support an expanding workforce and rapid population growth.
• The Southern Suburbs Railway is already bringing benefits and opportunities to the Peel Region. Major transport infrastructure projects, including the Mandurah Entrance Road and completion of the New Perth Bunbury Highway will support population and economic growth.
• The health of the Peel waterways, incorporating the entire estuary and catchment areas, remains a priority. Rapid population growth, urban development and infrastructure growth, while positive, places considerable pressure on this asset. The Commission has taken a leadership role in defining actions required into the future to protect and improve the health of the waterways, some of which are reflected in Major Projects and Achievements section of the report.
• Climate change is a significant issue for the Peel region and the Commission is supporting increased information and improved planning in this area.
Significant Issues and Trends continued
Peel Development Commission Annual Report 2007-200815
2001-02 2002-03 2003-04 2004-05 2005-06 2006-070
1,000
2,000
3,000
4,000
5,000
6,000
2,748
3,0013,208
3,700
4,522
5,495
$ (m
)
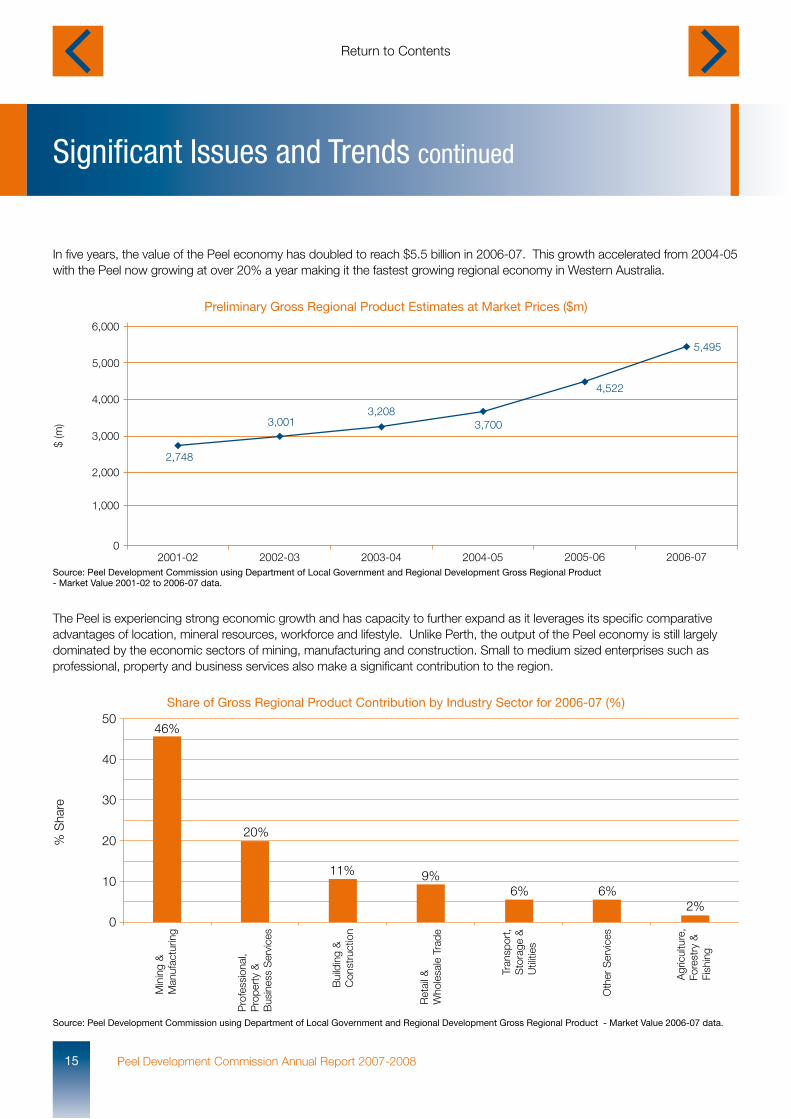
Preliminary Gross Regional Product Estimates at Market Prices ($m)
Source: Peel Development Commission using Department of Local Government and Regional Development Gross Regional Product - Market Value 2001-02 to 2006-07 data.
% S
hare
46%
20%
11% 9%6% 6%
2%
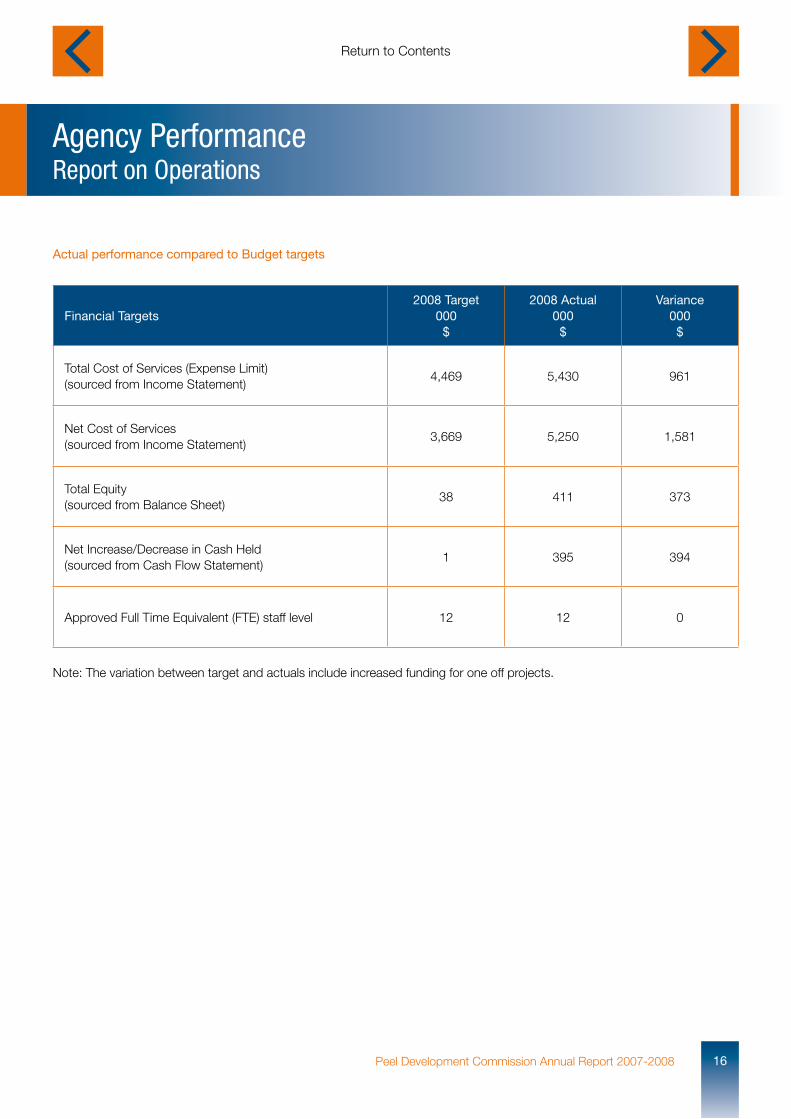
Share of Gross Regional Product Contribution by Industry Sector for 2006-07 (%)
Source: Peel Development Commission using Department of Local Government and Regional Development Gross Regional Product - Market Value 2006-07 data.
In five years, the value of the Peel economy has doubled to reach $5.5 billion in 2006-07. This growth accelerated from 2004-05 with the Peel now growing at over 20% a year making it the fastest growing regional economy in Western Australia.
The Peel is experiencing strong economic growth and has capacity to further expand as it leverages its specific comparative advantages of location, mineral resources, workforce and lifestyle. Unlike Perth, the output of the Peel economy is still largely dominated by the economic sectors of mining, manufacturing and construction. Small to medium sized enterprises such as professional, property and business services also make a significant contribution to the region.
Agency PerformanceReport on Operations
16Peel Development Commission Annual Report 2007-2008
Financial Targets2008 Target
000$
2008 Actual000
$
Variance000
$
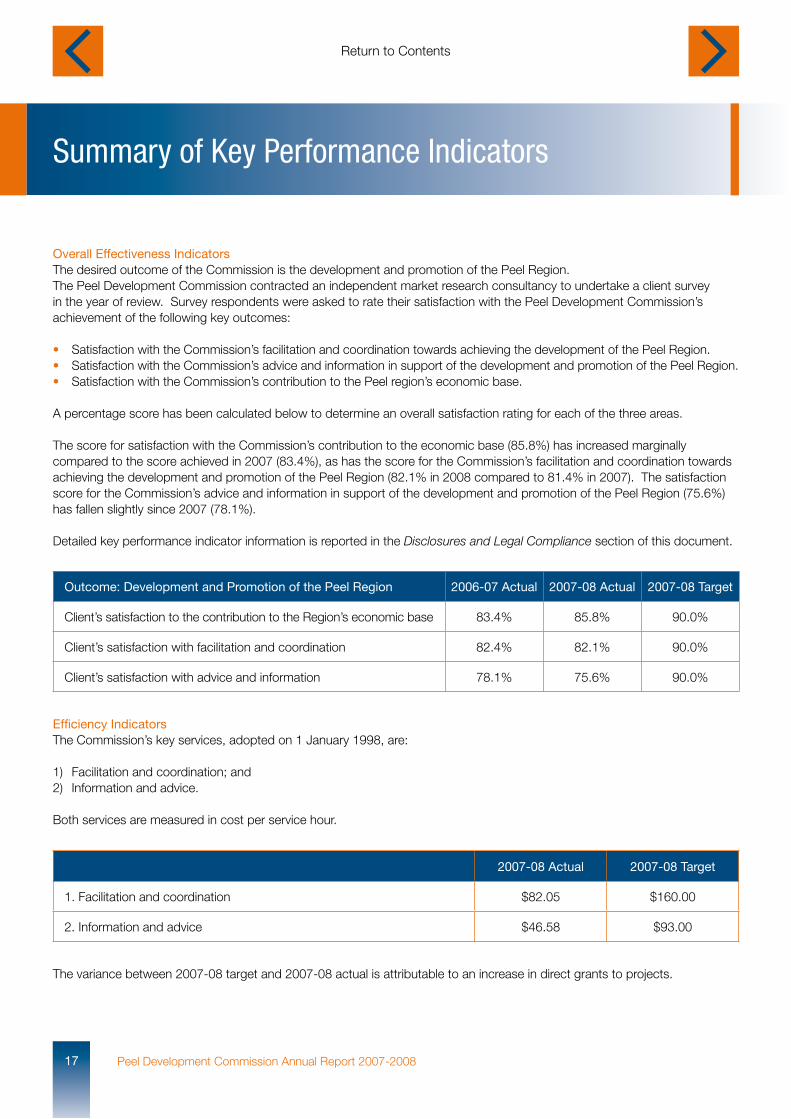
Total Cost of Services (Expense Limit)(sourced from Income Statement)
4,469 5,430 961
Net Cost of Services(sourced from Income Statement)
3,669 5,250 1,581
Total Equity(sourced from Balance Sheet)
38 411 373
Net Increase/Decrease in Cash Held(sourced from Cash Flow Statement)
1 395 394
Approved Full Time Equivalent (FTE) staff level 12 12 0
Actual performance compared to Budget targets
Note: The variation between target and actuals include increased funding for one off projects.
Summary of Key Performance Indicators
Peel Development Commission Annual Report 2007-200817
Overall Effectiveness IndicatorsThe desired outcome of the Commission is the development and promotion of the Peel Region.The Peel Development Commission contracted an independent market research consultancy to undertake a client survey in the year of review. Survey respondents were asked to rate their satisfaction with the Peel Development Commission’s achievement of the following key outcomes:
• Satisfaction with the Commission’s facilitation and coordination towards achieving the development of the Peel Region.• Satisfaction with the Commission’s advice and information in support of the development and promotion of the Peel Region.• Satisfaction with the Commission’s contribution to the Peel region’s economic base.
A percentage score has been calculated below to determine an overall satisfaction rating for each of the three areas.
The score for satisfaction with the Commission’s contribution to the economic base (85.8%) has increased marginally compared to the score achieved in 2007 (83.4%), as has the score for the Commission’s facilitation and coordination towards achieving the development and promotion of the Peel Region (82.1% in 2008 compared to 81.4% in 2007). The satisfaction score for the Commission’s advice and information in support of the development and promotion of the Peel Region (75.6%) has fallen slightly since 2007 (78.1%).
Detailed key performance indicator information is reported in the Disclosures and Legal Compliance section of this document.
Outcome: Development and Promotion of the Peel Region 2006-07 Actual 2007-08 Actual 2007-08 Target
Client’s satisfaction to the contribution to the Region’s economic base 83.4% 85.8% 90.0%
Client’s satisfaction with facilitation and coordination 82.4% 82.1% 90.0%
Client’s satisfaction with advice and information 78.1% 75.6% 90.0%
Efficiency IndicatorsThe Commission’s key services, adopted on 1 January 1998, are:
1) Facilitation and coordination; and2) Information and advice.
Both services are measured in cost per service hour.
2007-08 Actual 2007-08 Target
1. Facilitation and coordination $82.05 $160.00
2. Information and advice $46.58 $93.00
The variance between 2007-08 target and 2007-08 actual is attributable to an increase in direct grants to projects.
Major Projects & Achievements 2007-08
18Peel Development Commission Annual Report 2007-2008
The following section provides some key examples of major achievements this year.
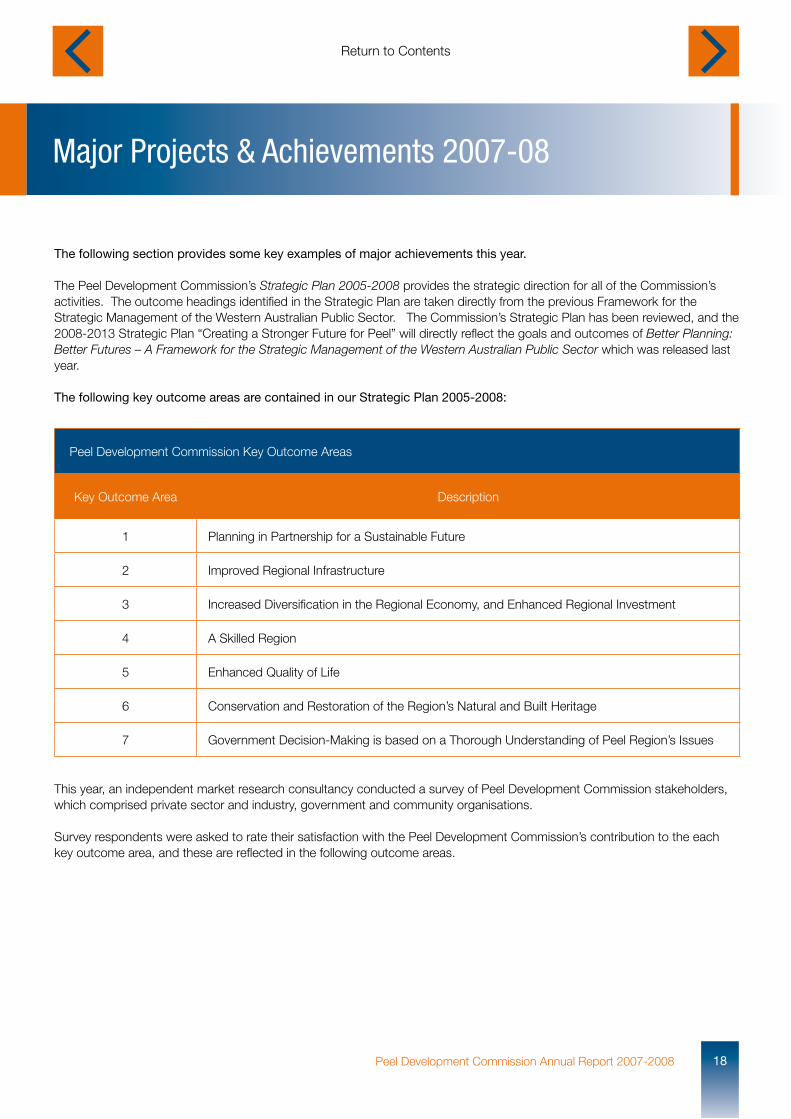
The Peel Development Commission’s Strategic Plan 2005-2008 provides the strategic direction for all of the Commission’s activities. The outcome headings identified in the Strategic Plan are taken directly from the previous Framework for the Strategic Management of the Western Australian Public Sector. The Commission’s Strategic Plan has been reviewed, and the 2008-2013 Strategic Plan “Creating a Stronger Future for Peel” will directly reflect the goals and outcomes of Better Planning: Better Futures – A Framework for the Strategic Management of the Western Australian Public Sector which was released last year.
The following key outcome areas are contained in our Strategic Plan 2005-2008:
Peel Development Commission Key Outcome Areas
Key Outcome Area Description
1 Planning in Partnership for a Sustainable Future
2 Improved Regional Infrastructure
3 Increased Diversification in the Regional Economy, and Enhanced Regional Investment
4 A Skilled Region
5 Enhanced Quality of Life
6 Conservation and Restoration of the Region’s Natural and Built Heritage
7 Government Decision-Making is based on a Thorough Understanding of Peel Region’s Issues
This year, an independent market research consultancy conducted a survey of Peel Development Commission stakeholders, which comprised private sector and industry, government and community organisations.
Survey respondents were asked to rate their satisfaction with the Peel Development Commission’s contribution to the each key outcome area, and these are reflected in the following outcome areas.
Outcome 1Planning in Partnership for a Sustainable Future
Peel Development Commission Annual Report 2007-200819
Key Outcome Area2005-06
Satisfaction %2006-07
Satisfaction %2007-08
Satisfaction %
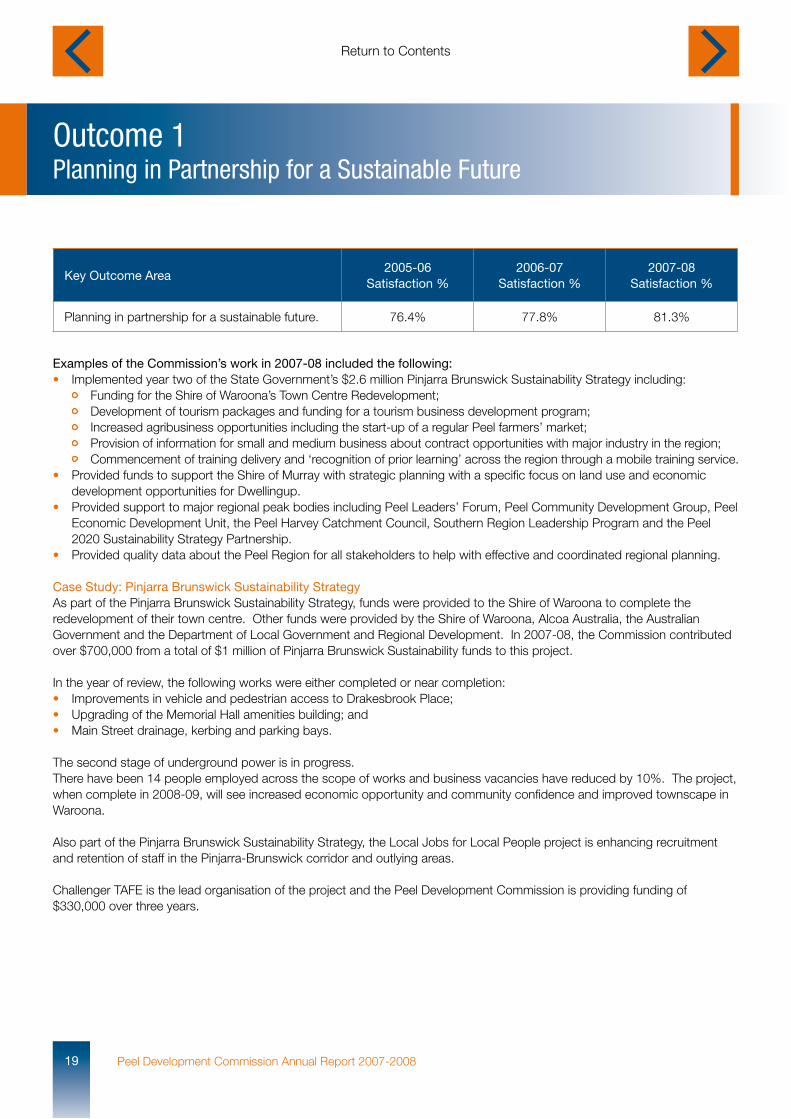
Planning in partnership for a sustainable future. 76.4% 77.8% 81.3%
Examples of the Commission’s work in 2007-08 included the following:• Implemented year two of the State Government’s $2.6 million Pinjarra Brunswick Sustainability Strategy including:
Funding for the Shire of Waroona’s Town Centre Redevelopment; Development of tourism packages and funding for a tourism business development program; Increased agribusiness opportunities including the start-up of a regular Peel farmers’ market; Provision of information for small and medium business about contract opportunities with major industry in the region; Commencement of training delivery and ‘recognition of prior learning’ across the region through a mobile training service.
• Provided funds to support the Shire of Murray with strategic planning with a specific focus on land use and economic development opportunities for Dwellingup.• Provided support to major regional peak bodies including Peel Leaders’ Forum, Peel Community Development Group, Peel Economic Development Unit, the Peel Harvey Catchment Council, Southern Region Leadership Program and the Peel 2020 Sustainability Strategy Partnership.• Provided quality data about the Peel Region for all stakeholders to help with effective and coordinated regional planning. Case Study: Pinjarra Brunswick Sustainability StrategyAs part of the Pinjarra Brunswick Sustainability Strategy, funds were provided to the Shire of Waroona to complete the redevelopment of their town centre. Other funds were provided by the Shire of Waroona, Alcoa Australia, the Australian Government and the Department of Local Government and Regional Development. In 2007-08, the Commission contributed over $700,000 from a total of $1 million of Pinjarra Brunswick Sustainability funds to this project.
In the year of review, the following works were either completed or near completion:• Improvements in vehicle and pedestrian access to Drakesbrook Place; • Upgrading of the Memorial Hall amenities building; and• Main Street drainage, kerbing and parking bays.
The second stage of underground power is in progress. There have been 14 people employed across the scope of works and business vacancies have reduced by 10%. The project, when complete in 2008-09, will see increased economic opportunity and community confidence and improved townscape in Waroona.
Also part of the Pinjarra Brunswick Sustainability Strategy, the Local Jobs for Local People project is enhancing recruitment and retention of staff in the Pinjarra-Brunswick corridor and outlying areas.
Challenger TAFE is the lead organisation of the project and the Peel Development Commission is providing funding of $330,000 over three years.
Outcome 1 continued
20Peel Development Commission Annual Report 2007-2008
The project is implementing innovative training formats to provide more skilled workers. This includes:• One day work release for training;• Community-based training delivery;• The use of an equipped trailer for on-site training and assessment;• Flexible delivery that allows employees to study at their own pace;• Providing on-site assessment to formally recognise existing employees’ skills and experience and identify any further training needed to attain formal qualifications;• Business health checks and training and support for business owners; and• Networking with employment agencies to fill vacancies.
Employers are being encouraged to embrace the concept of skills recognition – the process of giving value to employees by formal recognition of the skills, knowledge and abilities they have gained through different pathways such as employment, community work, volunteering and informal training.
In the reporting period, 21 skills recognition applications were received with several applicants commencing the assessment process and/or training.
Outcome 2Improved Regional Infrastructure
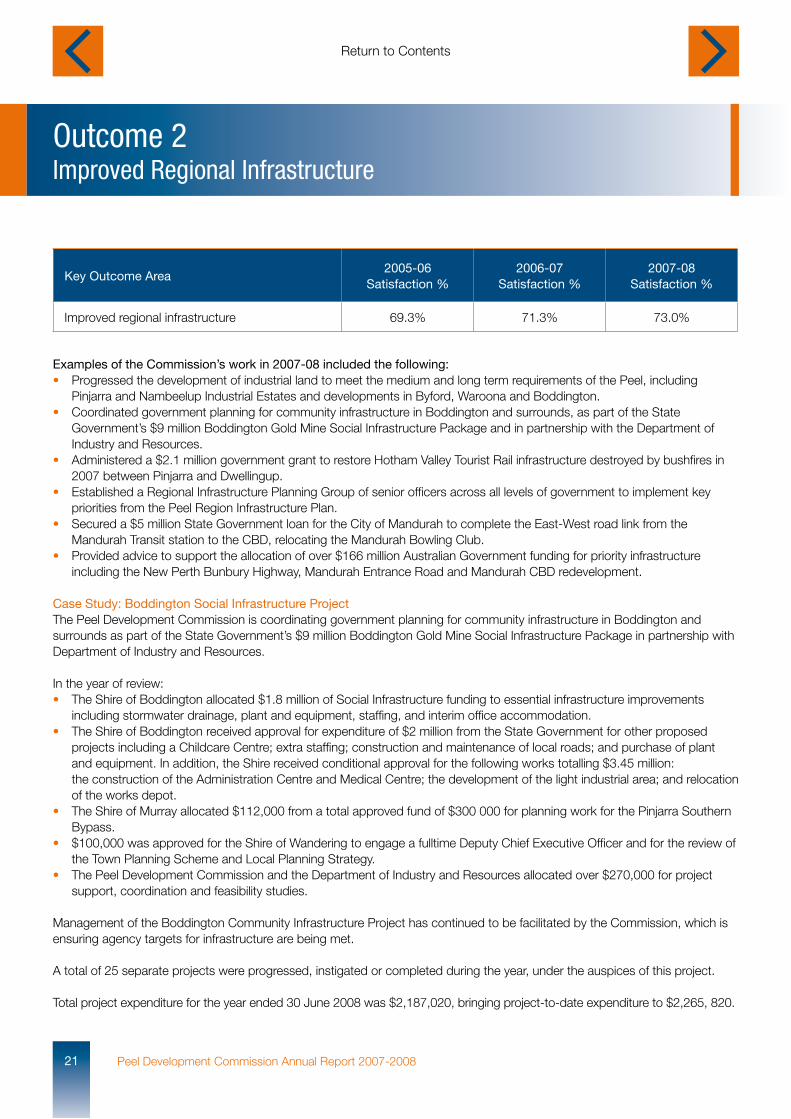
Examples of the Commission’s work in 2007-08 included the following:• Progressed the development of industrial land to meet the medium and long term requirements of the Peel, including Pinjarra and Nambeelup Industrial Estates and developments in Byford, Waroona and Boddington.• Coordinated government planning for community infrastructure in Boddington and surrounds, as part of the State Government’s $9 million Boddington Gold Mine Social Infrastructure Package and in partnership with the Department of Industry and Resources.• Administered a $2.1 million government grant to restore Hotham Valley Tourist Rail infrastructure destroyed by bushfires in 2007 between Pinjarra and Dwellingup.• Established a Regional Infrastructure Planning Group of senior officers across all levels of government to implement key priorities from the Peel Region Infrastructure Plan.• Secured a $5 million State Government loan for the City of Mandurah to complete the East-West road link from the Mandurah Transit station to the CBD, relocating the Mandurah Bowling Club.• Provided advice to support the allocation of over $166 million Australian Government funding for priority infrastructure including the New Perth Bunbury Highway, Mandurah Entrance Road and Mandurah CBD redevelopment.
Case Study: Boddington Social Infrastructure ProjectThe Peel Development Commission is coordinating government planning for community infrastructure in Boddington and surrounds as part of the State Government’s $9 million Boddington Gold Mine Social Infrastructure Package in partnership with Department of Industry and Resources.
In the year of review:• The Shire of Boddington allocated $1.8 million of Social Infrastructure funding to essential infrastructure improvements including stormwater drainage, plant and equipment, staffing, and interim office accommodation.• The Shire of Boddington received approval for expenditure of $2 million from the State Government for other proposed projects including a Childcare Centre; extra staffing; construction and maintenance of local roads; and purchase of plant and equipment. In addition, the Shire received conditional approval for the following works totalling $3.45 million: the construction of the Administration Centre and Medical Centre; the development of the light industrial area; and relocation of the works depot.• The Shire of Murray allocated $112,000 from a total approved fund of $300 000 for planning work for the Pinjarra Southern Bypass.• $100,000 was approved for the Shire of Wandering to engage a fulltime Deputy Chief Executive Officer and for the review of the Town Planning Scheme and Local Planning Strategy.• The Peel Development Commission and the Department of Industry and Resources allocated over $270,000 for project support, coordination and feasibility studies.
Management of the Boddington Community Infrastructure Project has continued to be facilitated by the Commission, which is ensuring agency targets for infrastructure are being met.
A total of 25 separate projects were progressed, instigated or completed during the year, under the auspices of this project.
Total project expenditure for the year ended 30 June 2008 was $2,187,020, bringing project-to-date expenditure to $2,265, 820.
Key Outcome Area2005-06
Satisfaction %2006-07
Satisfaction %2007-08
Satisfaction %
Improved regional infrastructure 69.3% 71.3% 73.0%
Peel Development Commission Annual Report 2007-200821
Outcome 2 continued
22Peel Development Commission Annual Report 2007-2008
Significant projects progressed by government agencies through additional state funding included: renovations to the Boddington Hospital; upgrade to Boddington and Wandering water supplies; duplication of Boddington waste water treatment facilities; upgrade of the Williams electricity supply; and improvements to the Pinjarra-Williams Road.
Against the initial forecast of 350+ new dwellings required in the district by December 2008, slow progress is evident to date despite adequate land releases. 30 homes were completed to the end of June 2008, with a further 60 expected to be completed by December 2008.
The key initiative to address the shortfall in accommodation is a Housing Investment Study, awarded in June 2008 to a market research company with expertise in real estate. The objective of this contract is to gain market knowledge and utilise it in promoting opportunities to builders and financiers while encouraging partnering to provide house and land packages.
A regular information leaflet is being provided for community information, and work is underway on the development of a project specific web portal.

Outcome 3Increased Diversification
Peel Development Commission Annual Report 2007-200823
Examples of the Commission’s work in 2007-08 included the following:• Promoted the Peel Region and its products at forums including Western Australia On Show and Tasting Australia (held in South Australia).• Developed agribusiness opportunities including the development of a Peel Region Farmers’ Market with significant industry representation and the partnership of the Department of Agriculture and Food.• Finalised grants valued at $600,000 for the Peel Region Tourist Rail project from a total State funding allocation of $3.5m over the life of this project.• Supported the attraction of over $166 million in Australian government funding to Peel Region priorities.• Facilitated the development of seven tourism packages to support increased visitor numbers and diversification of the economy.• Promoted the Peel Region Capability Register www.peel.wa.gov.au which assists regional businesses to promote themselves to potential major industry contracts. 143 businesses were registered at 30 June 2008 which represents a 40% increase in the database from the previous year.• The Commission in partnership with the Department of Industry and Resources and the City of Mandurah launched the Peel-Mandurah Business Survey that supported further work on the development of a technology park in the region.• Funding provided by the Commission to Fairbridge has contributed to employment of nine Indigenous trainees and three permanent employees; the Commission funding to Boddington Old School contributed to employment of one Indigenous trainee, linked to Boddington Gold Mine.
Key Outcome Area2005-06
Satisfaction %2006-07
Satisfaction %2007-08
Satisfaction %
A diversified regional economy 67.6% 69.3% 68.8%
Enhanced regional investment 62.6% 73.5% 73.4%
Outcome 4A Skilled Region
24Peel Development Commission Annual Report 2007-2008
Key Outcome Area2005-06
Satisfaction %2006-07
Satisfaction %2007-08
Satisfaction %
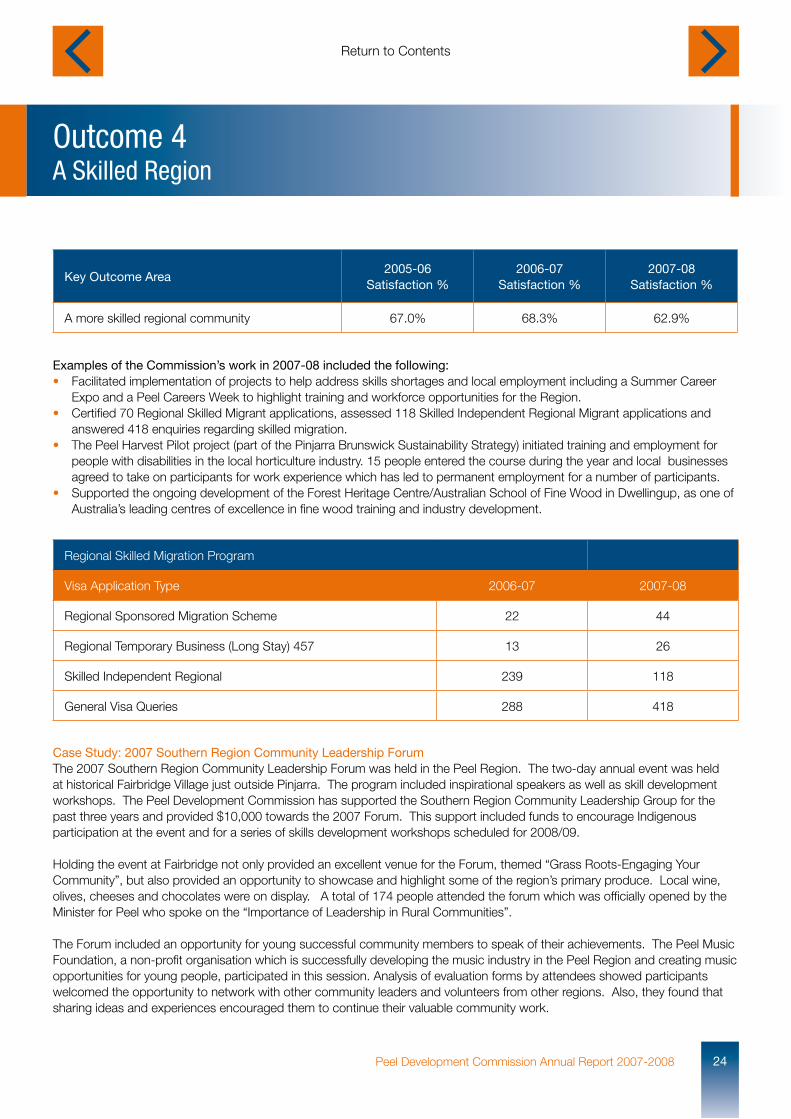
A more skilled regional community 67.0% 68.3% 62.9%
Examples of the Commission’s work in 2007-08 included the following:• Facilitated implementation of projects to help address skills shortages and local employment including a Summer Career Expo and a Peel Careers Week to highlight training and workforce opportunities for the Region.• Certified 70 Regional Skilled Migrant applications, assessed 118 Skilled Independent Regional Migrant applications and answered 418 enquiries regarding skilled migration.• The Peel Harvest Pilot project (part of the Pinjarra Brunswick Sustainability Strategy) initiated training and employment for people with disabilities in the local horticulture industry. 15 people entered the course during the year and local businesses agreed to take on participants for work experience which has led to permanent employment for a number of participants. • Supported the ongoing development of the Forest Heritage Centre/Australian School of Fine Wood in Dwellingup, as one of Australia’s leading centres of excellence in fine wood training and industry development.
Regional Skilled Migration Program
Visa Application Type 2006-07 2007-08
Regional Sponsored Migration Scheme 22 44
Regional Temporary Business (Long Stay) 457 13 26
Skilled Independent Regional 239 118
General Visa Queries 288 418
Case Study: 2007 Southern Region Community Leadership ForumThe 2007 Southern Region Community Leadership Forum was held in the Peel Region. The two-day annual event was held at historical Fairbridge Village just outside Pinjarra. The program included inspirational speakers as well as skill development workshops. The Peel Development Commission has supported the Southern Region Community Leadership Group for the past three years and provided $10,000 towards the 2007 Forum. This support included funds to encourage Indigenous participation at the event and for a series of skills development workshops scheduled for 2008/09.
Holding the event at Fairbridge not only provided an excellent venue for the Forum, themed “Grass Roots-Engaging Your Community”, but also provided an opportunity to showcase and highlight some of the region’s primary produce. Local wine, olives, cheeses and chocolates were on display. A total of 174 people attended the forum which was officially opened by the Minister for Peel who spoke on the “Importance of Leadership in Rural Communities”.
The Forum included an opportunity for young successful community members to speak of their achievements. The Peel Music Foundation, a non-profit organisation which is successfully developing the music industry in the Peel Region and creating music opportunities for young people, participated in this session. Analysis of evaluation forms by attendees showed participants welcomed the opportunity to network with other community leaders and volunteers from other regions. Also, they found that sharing ideas and experiences encouraged them to continue their valuable community work.
Outcome 5Enhanced Quality of Life
Peel Development Commission Annual Report 2007-200825
Key Outcome Area2005-06
Satisfaction %2006-07
Satisfaction %2007-08
Satisfaction %
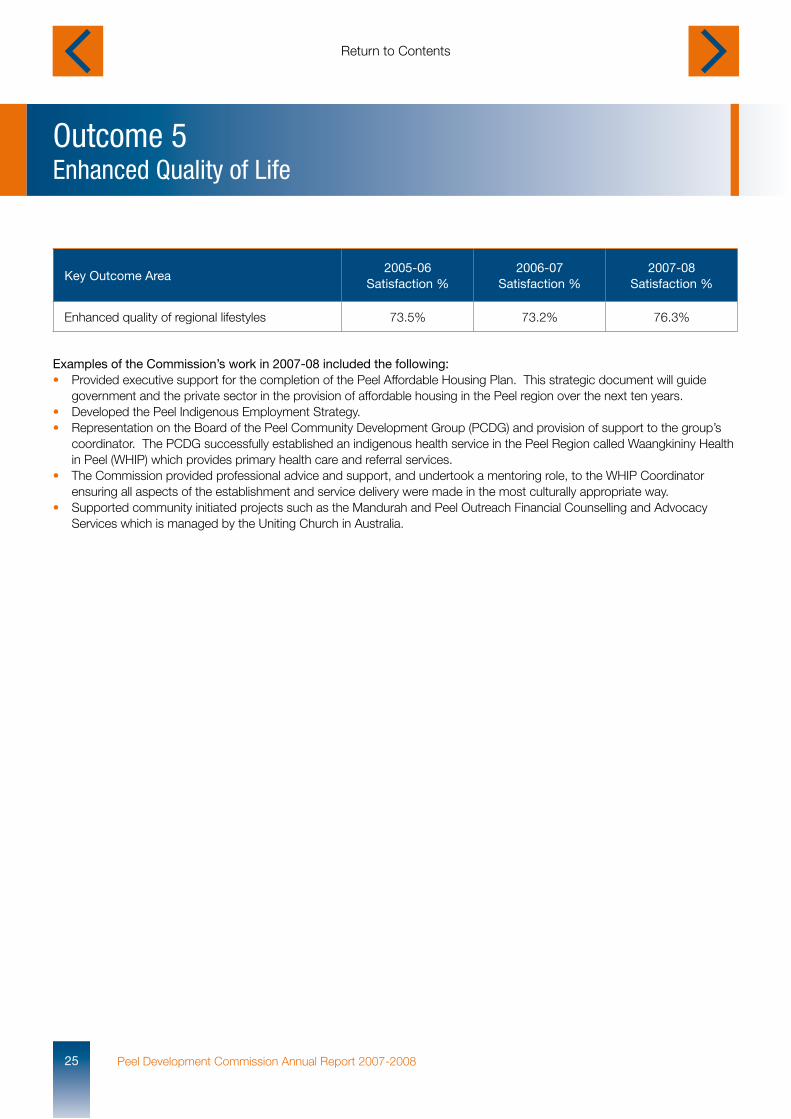
Enhanced quality of regional lifestyles 73.5% 73.2% 76.3%
Examples of the Commission’s work in 2007-08 included the following:• Provided executive support for the completion of the Peel Affordable Housing Plan. This strategic document will guide government and the private sector in the provision of affordable housing in the Peel region over the next ten years.• Developed the Peel Indigenous Employment Strategy.• Representation on the Board of the Peel Community Development Group (PCDG) and provision of support to the group’s coordinator. The PCDG successfully established an indigenous health service in the Peel Region called Waangkininy Health in Peel (WHIP) which provides primary health care and referral services.• The Commission provided professional advice and support, and undertook a mentoring role, to the WHIP Coordinator ensuring all aspects of the establishment and service delivery were made in the most culturally appropriate way. • Supported community initiated projects such as the Mandurah and Peel Outreach Financial Counselling and Advocacy Services which is managed by the Uniting Church in Australia.
Outcome 6Conservation & Restoration
26Peel Development Commission Annual Report 2007-2008
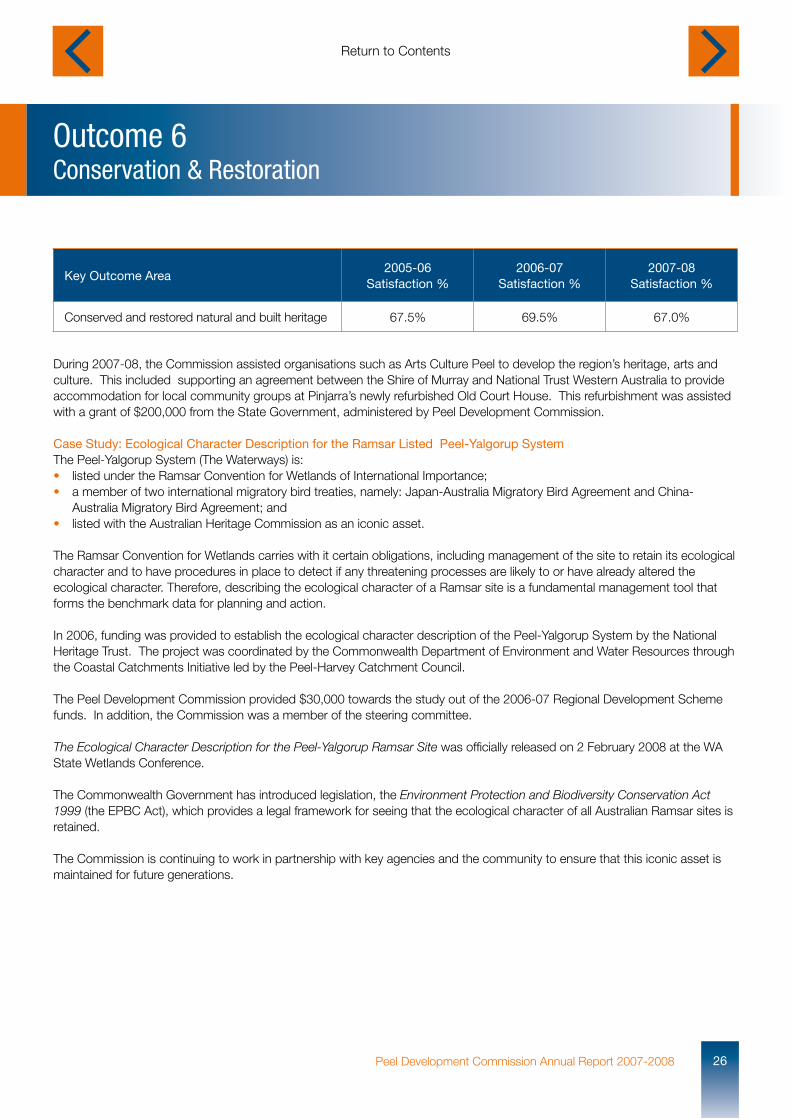
During 2007-08, the Commission assisted organisations such as Arts Culture Peel to develop the region’s heritage, arts and culture. This included supporting an agreement between the Shire of Murray and National Trust Western Australia to provide accommodation for local community groups at Pinjarra’s newly refurbished Old Court House. This refurbishment was assisted with a grant of $200,000 from the State Government, administered by Peel Development Commission.
Case Study: Ecological Character Description for the Ramsar Listed Peel-Yalgorup SystemThe Peel-Yalgorup System (The Waterways) is:• listed under the Ramsar Convention for Wetlands of International Importance;• a member of two international migratory bird treaties, namely: Japan-Australia Migratory Bird Agreement and China- Australia Migratory Bird Agreement; and • listed with the Australian Heritage Commission as an iconic asset.
The Ramsar Convention for Wetlands carries with it certain obligations, including management of the site to retain its ecological character and to have procedures in place to detect if any threatening processes are likely to or have already altered the ecological character. Therefore, describing the ecological character of a Ramsar site is a fundamental management tool that forms the benchmark data for planning and action.
In 2006, funding was provided to establish the ecological character description of the Peel-Yalgorup System by the National Heritage Trust. The project was coordinated by the Commonwealth Department of Environment and Water Resources through the Coastal Catchments Initiative led by the Peel-Harvey Catchment Council.
The Peel Development Commission provided $30,000 towards the study out of the 2006-07 Regional Development Scheme funds. In addition, the Commission was a member of the steering committee.
The Ecological Character Description for the Peel-Yalgorup Ramsar Site was officially released on 2 February 2008 at the WA State Wetlands Conference.
The Commonwealth Government has introduced legislation, the Environment Protection and Biodiversity Conservation Act 1999 (the EPBC Act), which provides a legal framework for seeing that the ecological character of all Australian Ramsar sites is retained.
The Commission is continuing to work in partnership with key agencies and the community to ensure that this iconic asset is maintained for future generations.
Key Outcome Area2005-06
Satisfaction %2006-07
Satisfaction %2007-08
Satisfaction %
Conserved and restored natural and built heritage 67.5% 69.5% 67.0%
Outcome 7Government Decisions
Peel Development Commission Annual Report 2007-200827
Key Outcome Area2005-06
Satisfaction %2006-07
Satisfaction %2007-08
Satisfaction %
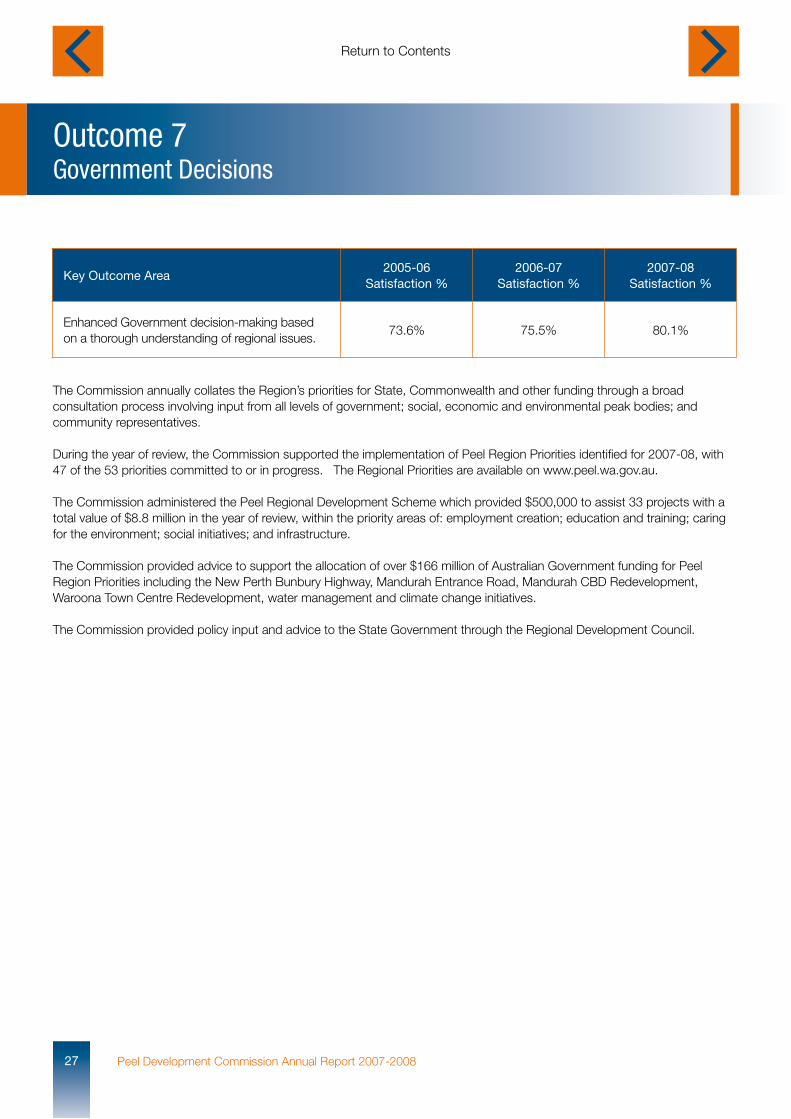
Enhanced Government decision-making based on a thorough understanding of regional issues.
73.6% 75.5% 80.1%
The Commission annually collates the Region’s priorities for State, Commonwealth and other funding through a broad consultation process involving input from all levels of government; social, economic and environmental peak bodies; and community representatives.
During the year of review, the Commission supported the implementation of Peel Region Priorities identified for 2007-08, with 47 of the 53 priorities committed to or in progress. The Regional Priorities are available on www.peel.wa.gov.au.
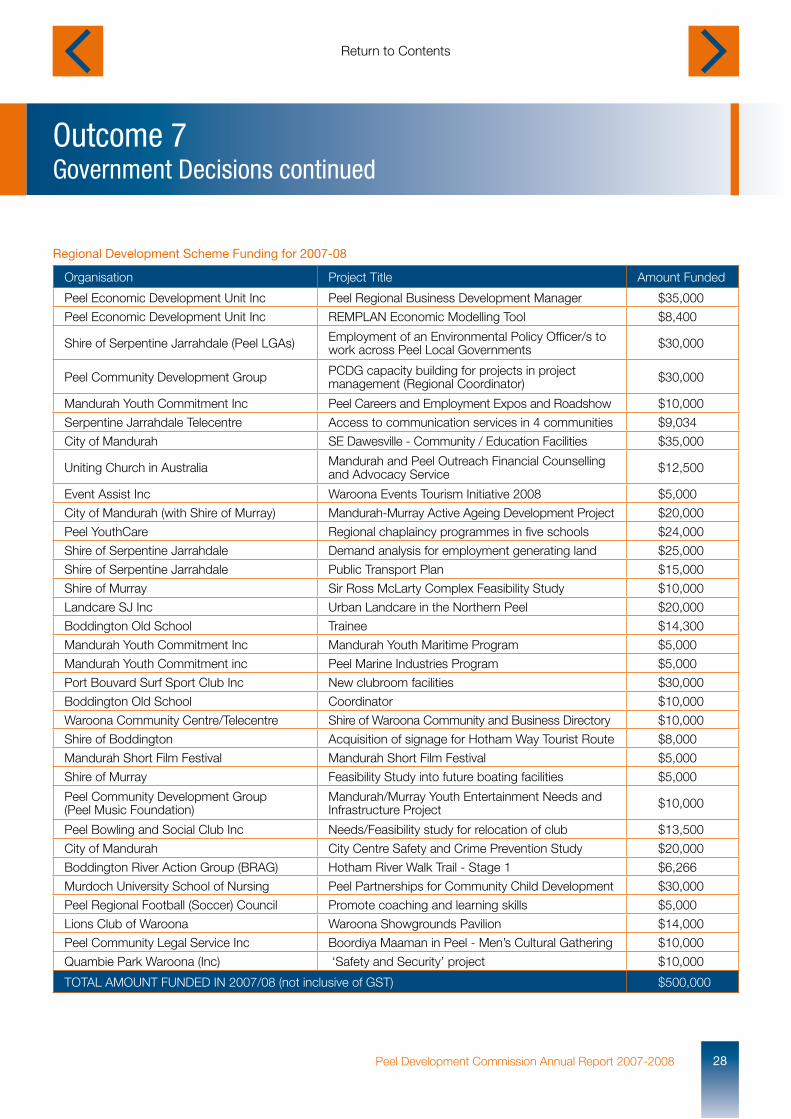
The Commission administered the Peel Regional Development Scheme which provided $500,000 to assist 33 projects with a total value of $8.8 million in the year of review, within the priority areas of: employment creation; education and training; caring for the environment; social initiatives; and infrastructure.
The Commission provided advice to support the allocation of over $166 million of Australian Government funding for Peel Region Priorities including the New Perth Bunbury Highway, Mandurah Entrance Road, Mandurah CBD Redevelopment, Waroona Town Centre Redevelopment, water management and climate change initiatives.
The Commission provided policy input and advice to the State Government through the Regional Development Council.
Outcome 7Government Decisions continued
28Peel Development Commission Annual Report 2007-2008
Organisation Project Title Amount Funded
Peel Economic Development Unit Inc Peel Regional Business Development Manager $35,000
Peel Economic Development Unit Inc REMPLAN Economic Modelling Tool $8,400
Shire of Serpentine Jarrahdale (Peel LGAs) Employment of an Environmental Policy Officer/s to work across Peel Local Governments $30,000
Peel Community Development Group PCDG capacity building for projects in project management (Regional Coordinator) $30,000
Mandurah Youth Commitment Inc Peel Careers and Employment Expos and Roadshow $10,000
Serpentine Jarrahdale Telecentre Access to communication services in 4 communities $9,034
City of Mandurah SE Dawesville - Community / Education Facilities $35,000
Uniting Church in Australia Mandurah and Peel Outreach Financial Counselling and Advocacy Service $12,500
Event Assist Inc Waroona Events Tourism Initiative 2008 $5,000
City of Mandurah (with Shire of Murray) Mandurah-Murray Active Ageing Development Project $20,000
Peel YouthCare Regional chaplaincy programmes in five schools $24,000
Shire of Serpentine Jarrahdale Demand analysis for employment generating land $25,000
Shire of Serpentine Jarrahdale Public Transport Plan $15,000
Shire of Murray Sir Ross McLarty Complex Feasibility Study $10,000
Landcare SJ Inc Urban Landcare in the Northern Peel $20,000
Boddington Old School Trainee $14,300
Mandurah Youth Commitment Inc Mandurah Youth Maritime Program $5,000
Mandurah Youth Commitment inc Peel Marine Industries Program $5,000
Port Bouvard Surf Sport Club Inc New clubroom facilities $30,000
Boddington Old School Coordinator $10,000
Waroona Community Centre/Telecentre Shire of Waroona Community and Business Directory $10,000
Shire of Boddington Acquisition of signage for Hotham Way Tourist Route $8,000
Mandurah Short Film Festival Mandurah Short Film Festival $5,000
Shire of Murray Feasibility Study into future boating facilities $5,000
Peel Community Development Group(Peel Music Foundation)
Mandurah/Murray Youth Entertainment Needs and Infrastructure Project $10,000
Peel Bowling and Social Club Inc Needs/Feasibility study for relocation of club $13,500
City of Mandurah City Centre Safety and Crime Prevention Study $20,000
Boddington River Action Group (BRAG) Hotham River Walk Trail - Stage 1 $6,266
Murdoch University School of Nursing Peel Partnerships for Community Child Development $30,000
Peel Regional Football (Soccer) Council Promote coaching and learning skills $5,000
Lions Club of Waroona Waroona Showgrounds Pavilion $14,000
Peel Community Legal Service Inc Boordiya Maaman in Peel - Men’s Cultural Gathering $10,000
Quambie Park Waroona (Inc) ‘Safety and Security’ project $10,000
TOTAL AMOUNT FUNDED IN 2007/08 (not inclusive of GST) $500,000
Regional Development Scheme Funding for 2007-08
Peel Development Commission Annual Report 2007-200829
Disclosures and Legal Compliance
30Peel Development Commission Annual Report 2007-2008
Disclosures and Legal Compliance continued
Financial Statements
Peel Development Commission Annual Report 2007-200831
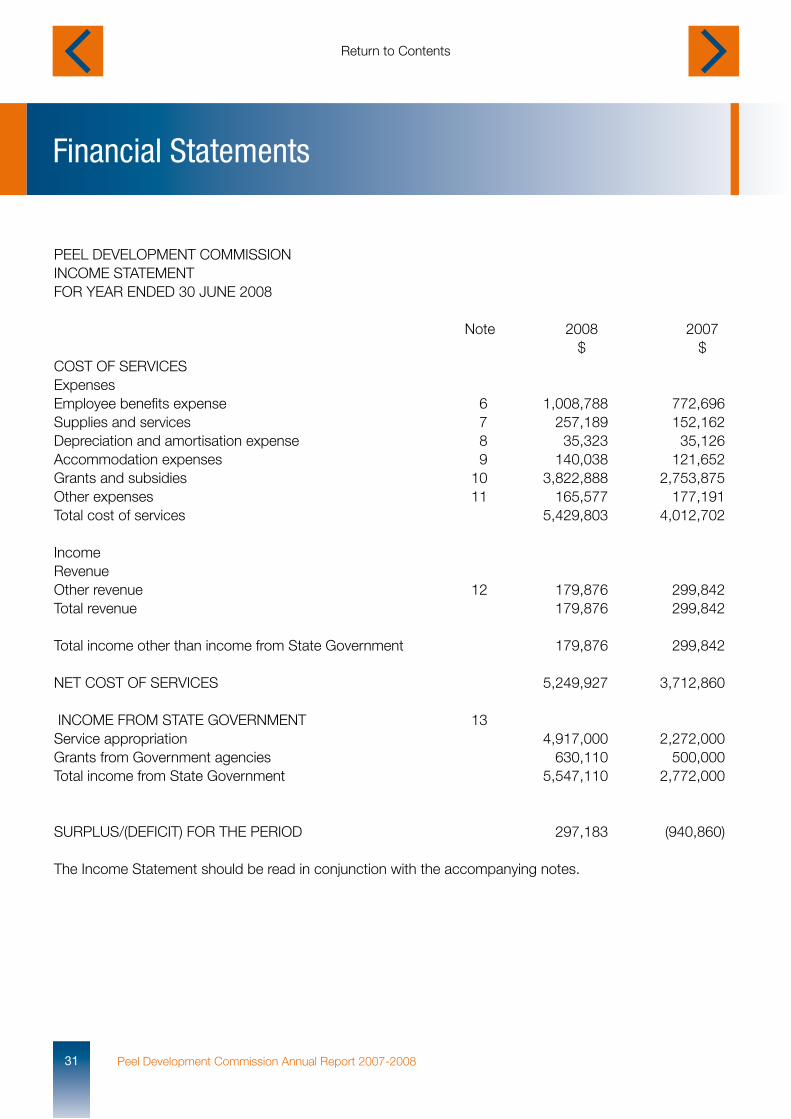
PEEL DEVELOPMENT COMMISSIONINCOME STATEMENTFOR YEAR ENDED 30 JUNE 2008 Note 2008 2007 $ $COST OF SERVICES Expenses Employee benefits expense 6 1,008,788 772,696Supplies and services 7 257,189 152,162Depreciation and amortisation expense 8 35,323 35,126Accommodation expenses 9 140,038 121,652Grants and subsidies 10 3,822,888 2,753,875Other expenses 11 165,577 177,191Total cost of services 5,429,803 4,012,702 Income Revenue Other revenue 12 179,876 299,842Total revenue 179,876 299,842 Total income other than income from State Government 179,876 299,842 NET COST OF SERVICES 5,249,927 3,712,860 INCOME FROM STATE GOVERNMENT 13 Service appropriation 4,917,000 2,272,000Grants from Government agencies 630,110 500,000Total income from State Government 5,547,110 2,772,000
SURPLUS/(DEFICIT) FOR THE PERIOD 297,183 (940,860) The Income Statement should be read in conjunction with the accompanying notes.
Financial Statements continued
32Peel Development Commission Annual Report 2007-2008
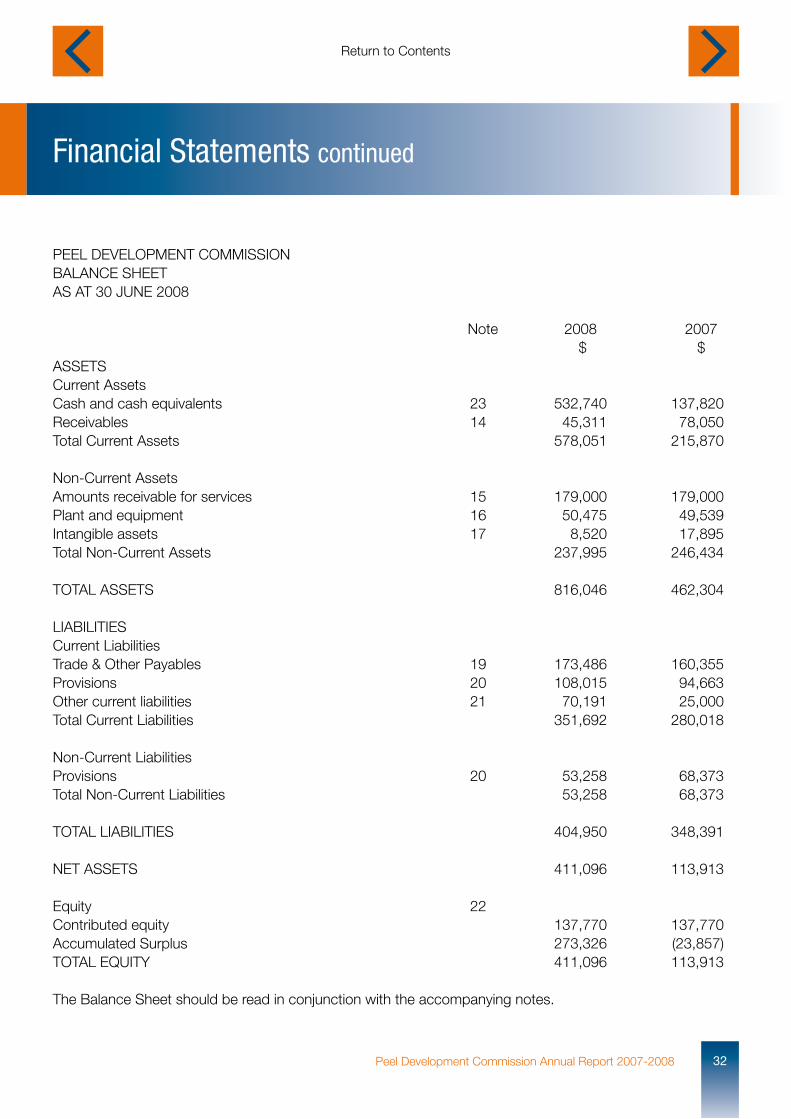
PEEL DEVELOPMENT COMMISSION BALANCE SHEET AS AT 30 JUNE 2008 Note 2008 2007 $ $ASSETS Current Assets Cash and cash equivalents 23 532,740 137,820Receivables 14 45,311 78,050Total Current Assets 578,051 215,870
Non-Current Assets Amounts receivable for services 15 179,000 179,000Plant and equipment 16 50,475 49,539Intangible assets 17 8,520 17,895Total Non-Current Assets 237,995 246,434
TOTAL ASSETS 816,046 462,304
LIABILITIES Current Liabilities Trade & Other Payables 19 173,486 160,355Provisions 20 108,015 94,663Other current liabilities 21 70,191 25,000Total Current Liabilities 351,692 280,018
Non-Current Liabilities Provisions 20 53,258 68,373Total Non-Current Liabilities 53,258 68,373 TOTAL LIABILITIES 404,950 348,391 NET ASSETS 411,096 113,913
Equity 22 Contributed equity 137,770 137,770Accumulated Surplus 273,326 (23,857)TOTAL EQUITY 411,096 113,913
The Balance Sheet should be read in conjunction with the accompanying notes.
Financial Statements continued
Peel Development Commission Annual Report 2007-200833
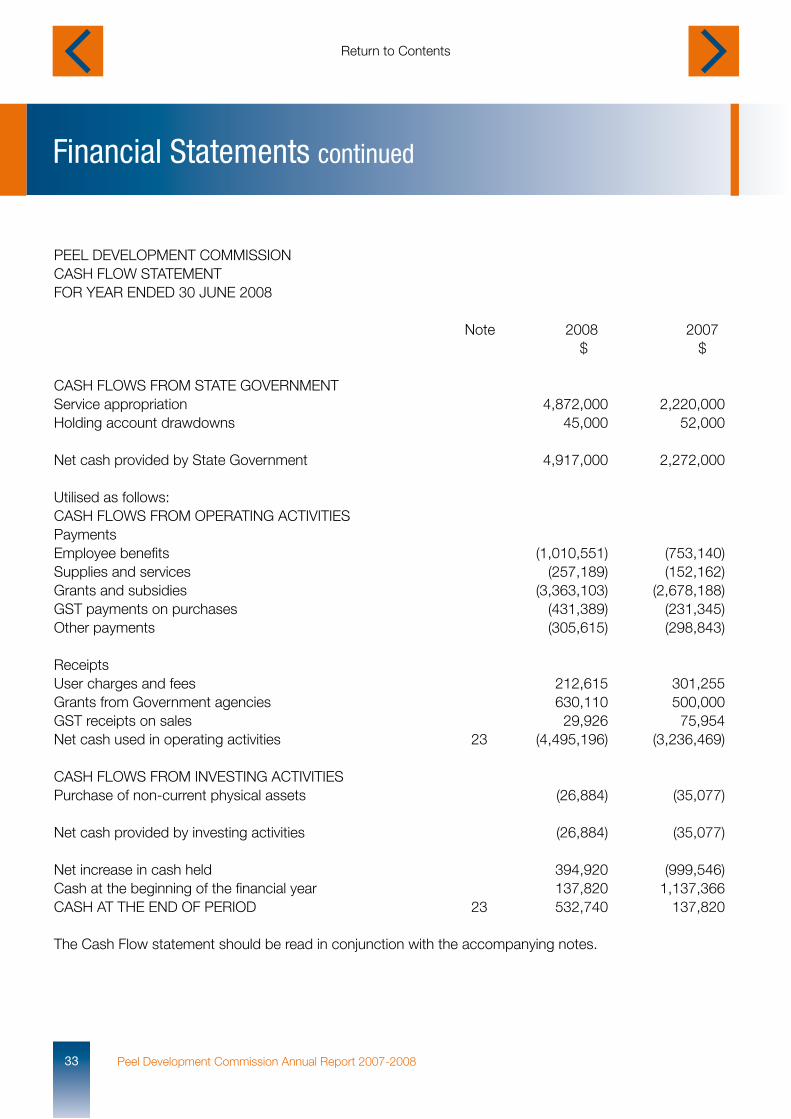
PEEL DEVELOPMENT COMMISSION CASH FLOW STATEMENT FOR YEAR ENDED 30 JUNE 2008 Note 2008 2007 $ $ CASH FLOWS FROM STATE GOVERNMENT Service appropriation 4,872,000 2,220,000Holding account drawdowns 45,000 52,000 Net cash provided by State Government 4,917,000 2,272,000 Utilised as follows: CASH FLOWS FROM OPERATING ACTIVITIES Payments Employee benefits (1,010,551) (753,140)Supplies and services (257,189) (152,162)Grants and subsidies (3,363,103) (2,678,188)GST payments on purchases (431,389) (231,345)Other payments (305,615) (298,843) Receipts User charges and fees 212,615 301,255Grants from Government agencies 630,110 500,000GST receipts on sales 29,926 75,954Net cash used in operating activities 23 (4,495,196) (3,236,469) CASH FLOWS FROM INVESTING ACTIVITIES Purchase of non-current physical assets (26,884) (35,077) Net cash provided by investing activities (26,884) (35,077) Net increase in cash held 394,920 (999,546)Cash at the beginning of the financial year 137,820 1,137,366CASH AT THE END OF PERIOD 23 532,740 137,820 The Cash Flow statement should be read in conjunction with the accompanying notes.
Financial Statements continued
34Peel Development Commission Annual Report 2007-2008
PEEL DEVELOPMENT COMMISSION STATEMENT OF CHANGES IN EQUITY FOR THE YEAR ENDED 30 JUNE 2008 Note 2008 2007 $ $
Balance of equity at start of period 113,913 1,054,773
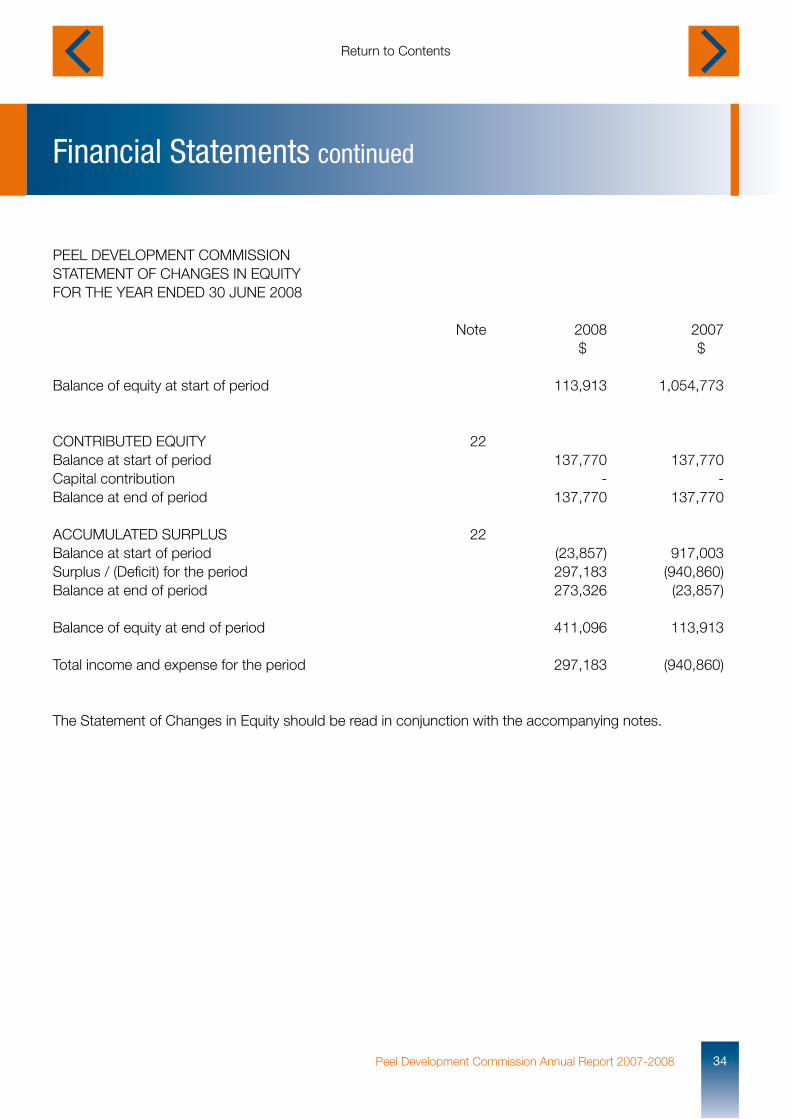
CONTRIBUTED EQUITY 22 Balance at start of period 137,770 137,770Capital contribution - -Balance at end of period 137,770 137,770 ACCUMULATED SURPLUS 22 Balance at start of period (23,857) 917,003Surplus / (Deficit) for the period 297,183 (940,860)Balance at end of period 273,326 (23,857) Balance of equity at end of period 411,096 113,913 Total income and expense for the period 297,183 (940,860)
The Statement of Changes in Equity should be read in conjunction with the accompanying notes.
Financial Statements continued
Peel Development Commission Annual Report 2007-200835
PEEL DEVELOPMENT COMMISSION NOTES TO THE FINANCIAL STATEMENTS FOR YEAR ENDED 30 JUNE 2008
1. Australian equivalents to International Financial Reporting StandardsGeneralThe Commissions financial statements for the year ended 30 June 2008 have been prepared in accordance with Australian equivalents to International Financial Reporting Standards (AIFRS), which comprise a Framework for the Preparation and Presentation of Financial Statements (the Framework) and Australian Accounting Standards (including the Australian Accounting Interpretations).
In preparing these financial statements the Commission has adopted, where relevant to it operations, new and revised Standards and Interpretations from their operative dates as issued by the AASB and formerly the Urgent Issues Group (UIG).
Early adoption of standardsThe Commission cannot early adopt an Australian Accounting Standard or Australian Accounting Interpretation unless specifically permitted by TI101 ‘Application of Australian Accounting Standards and Other Pronouncements’. No Standards and Interpretations that have been issued or amended but are not yet effective have been early adopted by the Commission for the annual reporting period ended 30 June 2008.
2. Significant Accounting Policiesa) General StatementThe financial statements constitute a general purpose financial report, which has been prepared in accordance with the Australian Accounting Standards, the Framework, Statements of Accounting Concepts and other authoritative pronouncements of the Australian Accounting Standards Board as applied by the Treasurer’s Instructions. Several of these are modified by the Treasurer’s Instructions to vary application, disclosure, format and wording.
The Financial Management Act and the Treasurer’s instructions are legislative provisions governing the preparation of financial statements and take precedence over the Accounting Standards, the Framework, Statements of Accounting Concepts and other authoritative pronouncements of the Australian Accounting Standards Board.
Where modification is required and has a material or significant financial effect upon the reported results, details of that modification and the resulting financial effect are disclosed in the notes to the financial statements.
b) Basis of PreparationThe financial statements have been prepared on the accrual basis of accounting using the historical cost convention, modified by the revaluation of land, buildings and Infrastructure which have been measured at fair value.
The accounting policies adopted in the preparation of the financial statements have been consistently applied throughout all periods presented unless otherwise stated. The financial statements are presented in Australian dollars.
The judgements that have been made in the process of applying the Commission’s accounting policies that have the most significant effect on the amounts recognised in the financial statements are disclosed at note 3 ‘Judgements made by management in applying accounting policies’.
The key assumptions made concerning the future, and other key sources of estimation uncertainty at the balance sheet date that have a significant risk of causing a material adjustment to the carrying amounts of assets and liabilities within the next financial year are disclosed at note 4 ‘Key sources of estimation uncertainty’.
Financial Statements continued
36Peel Development Commission Annual Report 2007-2008
c) Reporting EntityThe reporting entity is the Peel Development Commission.
d) Contributed EquityUIG Interpretation 1038 ‘Contributions by Owners Made to Wholly-Owned Public Sector Entities’ requires transfers in the nature of equity contributions to be designated by the Government (the owner) as contributions by owners (at the time of, or prior to transfer) before such transfers can be recognised as equity contributions.
Capital contributions (appropriations) have been designated as contributions by owners by TI 955 ‘Contributions by Owners made to Wholly Owned Public Sector Entities’ and have been credited directly to Contributed Equity.
e) IncomeRevenue RecognitionRevenue is measured at the fair value of consideration received or receivable. Revenue is recognised for the major business activities as follows:
Service AppropriationsService Appropriations are recognised as revenues at nominal value in the period in which the Commission gains control of the appropriated funds.
The Commission gains control of appropriated funds at the time those funds are deposited to the bank account or credited to the holding account held at Treasury.
Sale of goodsRevenue is recognised from the sale of goods and disposal of other assets when the significant risks and rewards of ownership control transfer to the purchaser and can be measured reliably.
Rendering of servicesRevenue is recognised on delivery of the service to the client or by reference to the stage of completion of the transaction.
Grants, donations, gifts and other non-reciprocal contributionsRevenue is recognised at the fair value when the Commission obtains control over the assets comprising the contributions, usually when cash is received.
Other non-reciprocal contributions that are not contributions by owners are recognised at their fair value. Contributions of services are only recognised when a fair value can be reliably determined and the services would be purchased if not donated.
Where contributions recognised as revenues during the reporting period were obtained on the condition that they may be expended in a particular manner or used over a particular period, and those conditions were undischarged as at the reporting date, the nature of, and amounts pertaining to, those undischarged conditions are disclosed in the notes.
GainsGains may be realised or unrealised and are usually recognised on a net basis. These include gains arising on the disposal of non-current assets.
Financial Statements continued
Peel Development Commission Annual Report 2007-200837
f) Plant and EquipmentCapitalisation/Expensing of assetsItems of plant and equipment costing over $1,000 are recognised as assets and the cost of utilising assets is expensed (depreciated) over their useful lives. Items of property, plant and equipment costing less than $1,000 are immediately expensed direct to the Income Statement (other than where they form part of a group of similar items which are significant in total).
Initial recognition and measurementAll items of plant and equipment are initially recognised at cost. For items of plant and equipment acquired at no cost or for nominal cost, the cost is their fair value at the date of acquisition.
Subsequent measurementAfter recognition as an asset, the cost model is used for the measurement of all plant and equipment. All items of plant and equipment are stated at historical cost less accumulated depreciation and accumulated impairment losses.
Depreciation All non-current assets having a limited useful life are systematically depreciated over their estimated useful lives in a manner that reflects the consumption of their future economic benefits. Depreciation on other assets is calculated on the straight line methods, using rates which are reviewed annually. Expected useful lives for each class of depreciable asset are:Office equipment, 2 years to 10 years g) Intangible AssetsCapitalisation/Expensing of assetsAcquisitions of intangible assets costing over $1,000 and internally generated intangible assets costing over $1,000 are capitalised. The cost of utilising the assets is expensed (amortised) over their useful life. Costs incurred below these thresholds are immediately expensed directly to the Income Statement.
All acquired and internally developed intangible assets are initially recognised at cost. For assets acquired at no cost or for nominal consideration, the cost is their fair value at the date of acquisition.
The cost model is applied for subsequent measurement requiring the asset to be carried at cost less any accumulated amortisation and accumulated impairment losses.
Amortisation for intangible assets with finite useful lives is calculated for the period of the expected benefit (estimated useful life) on the straight line basis using rates which are reviewed annually. All intangible assets controlled by the Commission have a finite useful life and zero residual value. The expected useful lives of this class of intangible asset are: Software, 2 to 5 years
Computer SoftwareSoftware that is an integral part of the related hardware is treated as property, plant and equipment. Software that is not an integral part of the related hardware is treated as an intangible asset. Software costing less than $1,000 is expensed in the year of acquisition.
Web site costsWeb site costs are charged as expenses when they are incurred unless they relate to the acquisition of development of an asset when they may be capitalised and amortised. Generally, costs in relation to feasibility studies during the planning of a web site, and on-going costs of maintenance during the operating phase are expensed. Costs incurred in building or enhancing a web site, to the extent that they represent probable future economic benefits that can be reliably measured, are capitalised.
Financial Statements continued
38Peel Development Commission Annual Report 2007-2008
h) Impairment of AssetsPlant and equipment and intangible assets are tested for any indication of impairment at each balance sheet date. Where there is an indication of impairment, the recoverable amount is estimated. Where the recoverable amount is less than the carrying amount, the asset is written down to the recoverable amount and impairment is recognised. As the Commission is a not-for-profit entity, unless an asset has been identified as a surplus asset, the recoverable amount is the higher of an asset’s fair value less costs to sell and depreciated replacement cost. The risk of impairment is generally limited to circumstances where an asset’s depreciation is materially understated or where the replacement cost is falling. Each relevant class of assets is reviewed annually to verify that the accumulated depreciation/amortization reflects the level of consumption or expiration of an asset’s future economic benefits and to evaluate any impairment risk from falling replacement costs.
Intangible assets with an indefinite useful life and intangible assets not yet available for use are tested for impairment at each reporting date irrespective of whether there is any indication of impairment.
The recoverable amount of assets identified as surplus assets is the higher of fair value less costs to sell and the present value of future cash flows expected to be derived from the asset. Surplus assets carried at fair value have no risk of material impairment where fair value is determined by reference to market evidence. Where fair value is determined by reference to depreciated replacement cost, surplus asserts are at risk of impairment and the recoverable amount is measured. Surplus assets at cost are tested for indications of impairments at each balance sheet date.
i) Non-current Assets Classified as Held for SaleNon-current assets (or disposal groups) held for sale are recognised at the lower of carrying amount and fair value less costs to sell and are presented separately from other assets in the Balance Sheet. Assets classified as held for sale are not depreciated or amortised.
j) LeasesThe Commission holds an operating lease for its office building. Lease payments are expensed on a straight line basis over the lease term as this represents the pattern of benefits derived from the leased properties.
k) Financial InstrumentsIn addition to cash, the Commission has two categories of financial instrument:• Loans and receivables; and• Financial liabilities measured at amortised cost.
These have been disaggregated into the following classes:Financial assets• Cash and cash equivalents• Receivables• Amounts receivable for services
Financial liabilities• Payables
Initial recognition and measurement of financial instruments is at fair value which normally equates to the transaction cost of the face value. Subsequent measurement is at amortised cost using the effective interest method.
The fair value of short-term receivables and payables is the transaction cost or the face value because there is no interest rate applicable and subsequent measurement is not required as the effect of discounting is not material.
Financial Statements continued
Peel Development Commission Annual Report 2007-200839
l) Cash and Cash EquivalentsFor the purpose of the Cash Flow Statement, cash and cash equivalent assets comprise cash on hand.
m) Accrued Salaries Accrued salaries (see Note 21 ‘Other liabilities’) represent the amount due to staff but unpaid at the end of the financial year, as the end of the last pay period for that financial year does not coincide with the end of the financial year.
The Commission considers the carrying amount of accrued salaries to be equivalent to its net fair value.
n) Amounts Receivable for Services (Holding Account)The Commission receives funding on an accrual basis that recognises the full annual cash and non-cash cost of services. The appropriations are paid partly in cash and partly as an asset (Holding Account receivable) that is accessible on the emergence of the cash funding requirement to cover items such as leave entitlement and asset replacement.
See also note 13 ‘Income from State Government’ and note 15 ‘Amounts receivable for services’.
o) Receivables Receivables are recognised and carried at original invoice amount less an allowance for any uncollectible amounts (impairment). The collectability of receivables is reviewed on an on-going basis and any receivables identified as uncollectible are written off. The allowance for uncollectible amounts (doubtful debts) is raised when there is objective evidence that the Commission will not be able to collect the debts. The carrying amount is equivalent to fair value as it is due for settlement within 30 days.
p) PayablesPayables are recognised at the amounts payable when the Commission becomes obliged to make future payments as a result of a purchase of assets or services. The carrying amount is equivalent to fair value, as they are generally settled within 30 days.
q) ProvisionsProvisions are liabilities of uncertain timing and amount and are recognised where there is a present legal, equitable or constructive obligation as a result of a past event and when the outflow of economic benefits is probable and can be measured reliably. Provisions are reviewed at each balance sheet date. i) Provisions – Employee BenefitsAnnual Leave and Long Service Leave The liability of annual and long service leave expected to be settled within 12 months after the end of the reporting date is recognised and measured at the undiscounted amounts expected to be paid when the liabilities are settled. Annual and long service leave expected to be settled more than 12 months after the end of the reporting date is measured at the present value of amounts expected to be paid when the liabilities are settled. Leave liabilities are in respect of services provided by employees up to the reporting date.
When assessing expected future payments consideration is given to expected future wage and salary levels including non-salary components such as employer superannuation contributions. In addition, the long service leave liability also considers the experience of employee departures and periods of service.
The expected future payments are discounted using market yields at the reporting date on national government bonds with terms to maturity that match, as closely as possible, the estimated future cash outflows. All annual leave and unconditional long service leave provisions are classified as current liabilities as the Commission does not have an unconditional right to defer settlement of the liability for at least 12 months after the reporting date.
Financial Statements continued
40Peel Development Commission Annual Report 2007-2008
SuperannuationThe Government Employees Superannuation Board (GESB) administers the following superannuation schemes.
Employees may contribute to the Pension Scheme, a defined benefit pension scheme now closed to new members or the Gold State Superannuation Scheme (GSS) a defined benefit lump sum scheme also closed to new members.
The Commission has no liabilities under the Pension or the GSS Schemes. The liabilities for the unfunded Pension Scheme and the unfunded GSS Scheme transfer benefits due to members, who transferred from the Pension Scheme, are assumed by the Treasurer. All other GSS Scheme obligations are funded by concurrent contributions made by the Commission to GESB. The concurrently funded part of the GSS Scheme is a defined contribution scheme as these contributions extinguish all liabilities in respect of the concurrently funded GSS Scheme obligations.
Employees commencing employment prior to 16 April 2007 who are not members of either the Pension or the GSS Schemes became non-contributory members of the West State Superannuation Scheme (WSSS). Employees commencing employment on or after 16 April 2007 became members of the GESB Super Scheme (GESBS). Both of these schemes are accumulation schemes. The Commission makes concurrent contributions to GESB on behalf of employees in compliance with the Commonwealth Government’s Superannuation Guarantee (Administration) Act 1992. These contributions extinguish the liability for superannuation charges in respect of the WSS and GESBS Schemes.
The GESB makes all benefit payments in respect of the Pension and GSS Schemes, and is recouped by the Treasurer for the employer’s share. ii) Provisions – OtherEmployment On-CostsEmployment on-costs, including worker’s compensation insurance, are not employee benefits and are recognised as separate liabilities and expenses when the employment to which they relate has occurred. Employment on-costs are included as part of ‘Other expenses’ and are not included as part of the Commission’s ‘Employee benefits expense’. The related liability is included in Employment on-costs provision. (See note 11 ‘Other expenses’ and note 20 ‘Provisions’)
r) Superannuation Expense The following elements are included in calculating a superannuation expense.
(a) Defined benefit plans – Change in the unfunded employer’s liability (i.e. current service cost and, actuarial gains and losses) assumed by the Treasurer in respect of current employees who are members of the Pension Scheme and current employees who accrued a benefit on transfer from that Scheme to the Gold State Superannuation Scheme (GSS); and
(b) Defined contribution plans – Employer contributions paid to the GSS and the West State Superannuation Scheme (WSS).
Defined benefit plans - in order to reflect the true cost of services, the movements (i.e. current service cost, and actuarial gains and losses) in the liabilities in respect of the Pension Scheme and the GSS transfer benefits are recognised as expenses. As these liabilities are assumed by the Treasurer (a revenue titled ‘Liabilities assumed by the Treasurer’ equivalent to the expense is recognised under Income from State Government in the Income Statement (see note 13 ‘Income from State Government’).
s) Resources Received Free of Charge or for Nominal ConsiderationResources received free of charge or for nominal value that can be reliably measured are recognised as revenues and as assets or expenses as appropriate at fair value.
t) Comparative FiguresComparative figures are, where appropriate, reclassified to be comparable with the figures presented in the current financial year.
Financial Statements continued
Peel Development Commission Annual Report 2007-200841
3) Judgements made by management in applying accounting policiesThe judgement that has been made in the process of applying accounting policies that have the most significant effect on the amounts recognised in the financial statements include:
Operating lease commitmentThe Commission has entered into a commercial lease and has determined that the lessor retains all the significant risks and rewards of the ownership of the property. Accordingly, the lease has been classified as an operating lease.
4) Key sources of estimation uncertaintyThe key estimates and assumptions made concerning the future, and other key sources of estimation uncertainty at the balance sheet date that have a significant risk of causing a material adjustment to the carrying amounts of assets and liabilities within the next financial year include:
Employee benefits provisionA discount rate of 7.02% per annum applied to long service leave provisions. The discount rate is based upon the Commonwealth 7 year Treasury Bond rates published by the Reserve Bank of Australia.
5) Disclosure of Changes in Accounting Policy and EstimatesInitial application of an Australian Accounting StandardThe Commission has applied the following Australian Accounting Standards and Australian Accounting Interpretations effective for annual reporting periods beginning on or after 1 July 2007 that impacted on the Authority:
1. AASB 7 ‘Financial Instruments: Disclosures’ (including consequential amendments in AASB 2005-10 ‘Amendments to Australian Accounting Standards [AASB 132, AASB 101, AASB 114, AASB 117, AASB 133, AASB 139, AASB 1, AASB 4, AASB 1023 & AASB 1038]’). This Standard requires new disclosures in relation to financial instruments and while there is no financial impact, the changes have resulted in increased disclosures, both quantitative and qualitative, of the Authority’s exposure to risks, including enhanced disclosure regarding components of the Authority’s financial position and performance, and changes to the way of presenting certain items in the notes to the financial statements.
Future impact of Australian Accounting Standards not yet operativeThe Commission cannot early adopt an Australian Accounting Standard or Australian Accounting Interpretation unless specifically permitted by TI 1101 ‘Application of Australian Accounting Standards and Other Pronouncements’.Consequently, the Commission has not applied the following Australian Accounting Standards and Australian Accounting Interpretations that have been issued but are not yet effective. These will be applied from their application date:
1. AASB 1010 ‘Presentation of Financial Statements’ (September 2007). This standard has been revised and will change the structure of the financial statements. These changes will require that owner changes in equity are presented separately from non-owner changes in equity. The Commission does not expect any financial impact when the Standard is first applied.2. Review of AAS 27 ‘Financial Reporting by Local Governments’, 29 ‘Financial Reporting by Government Departments’ and 31 ‘Financial Reporting by Governments’. The AASB has made the following pronouncements from its short term review of AAS 27, AAS 29 and AAS 31:
Financial Statements continued
42Peel Development Commission Annual Report 2007-2008
• AASB 1004 ‘Contributions’ (December 2007).• AASB 1050 ‘Administered Items’ (December 2007).• AASB 1051 ‘Land Under Roads’ (December 2007).• AASB 1052 ‘Disaggregated Disclosures’ (December 2007).• AASB 2007-9 ‘amendments to Australian Accounting Standards arising from the review of AAS’s 27, 29 and 31 [AASB 3, AASB 5, AASB 8, AASB 101, AASB 114, AASB 116, AASB 127 and AASB 137] (December 2007).• Interpretation 1038 ‘Contributions by Owners Made to Wholly-Owned Public Sector Entities (revised) (December 2007).
The existing requirements in AAS 27, AAS 29 and AAS 31 have been transferred to the above new and existing topic-based Standards and Interpretation. These requirements remain substantively unchanged. AASB 1050, AASB 1051 and AASB 1052 only apply to government departments. The other Standards and Interpretations make some modifications to disclosures and provide additional guidance; otherwise there will be no financial impact.
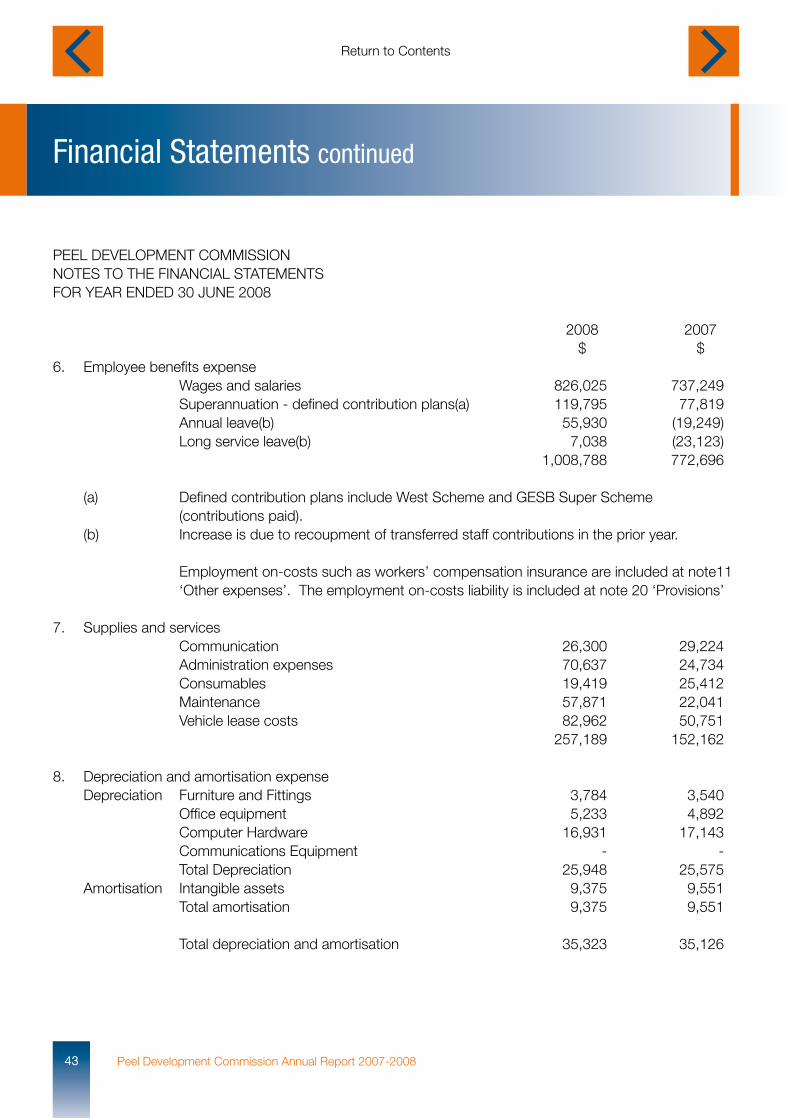
Financial Statements continued
Peel Development Commission Annual Report 2007-200843
PEEL DEVELOPMENT COMMISSIONNOTES TO THE FINANCIAL STATEMENTSFOR YEAR ENDED 30 JUNE 2008 2008 2007 $ $6. Employee benefits expense Wages and salaries 826,025 737,249 Superannuation - defined contribution plans(a) 119,795 77,819 Annual leave(b) 55,930 (19,249) Long service leave(b) 7,038 (23,123) 1,008,788 772,696 (a) Defined contribution plans include West Scheme and GESB Super Scheme (contributions paid). (b) Increase is due to recoupment of transferred staff contributions in the prior year. Employment on-costs such as workers’ compensation insurance are included at note11 ‘Other expenses’. The employment on-costs liability is included at note 20 ‘Provisions’ 7. Supplies and services Communication 26,300 29,224 Administration expenses 70,637 24,734 Consumables 19,419 25,412 Maintenance 57,871 22,041 Vehicle lease costs 82,962 50,751 257,189 152,162
8. Depreciation and amortisation expense Depreciation Furniture and Fittings 3,784 3,540 Office equipment 5,233 4,892 Computer Hardware 16,931 17,143 Communications Equipment - - Total Depreciation 25,948 25,575 Amortisation Intangible assets 9,375 9,551 Total amortisation 9,375 9,551 Total depreciation and amortisation 35,323 35,126
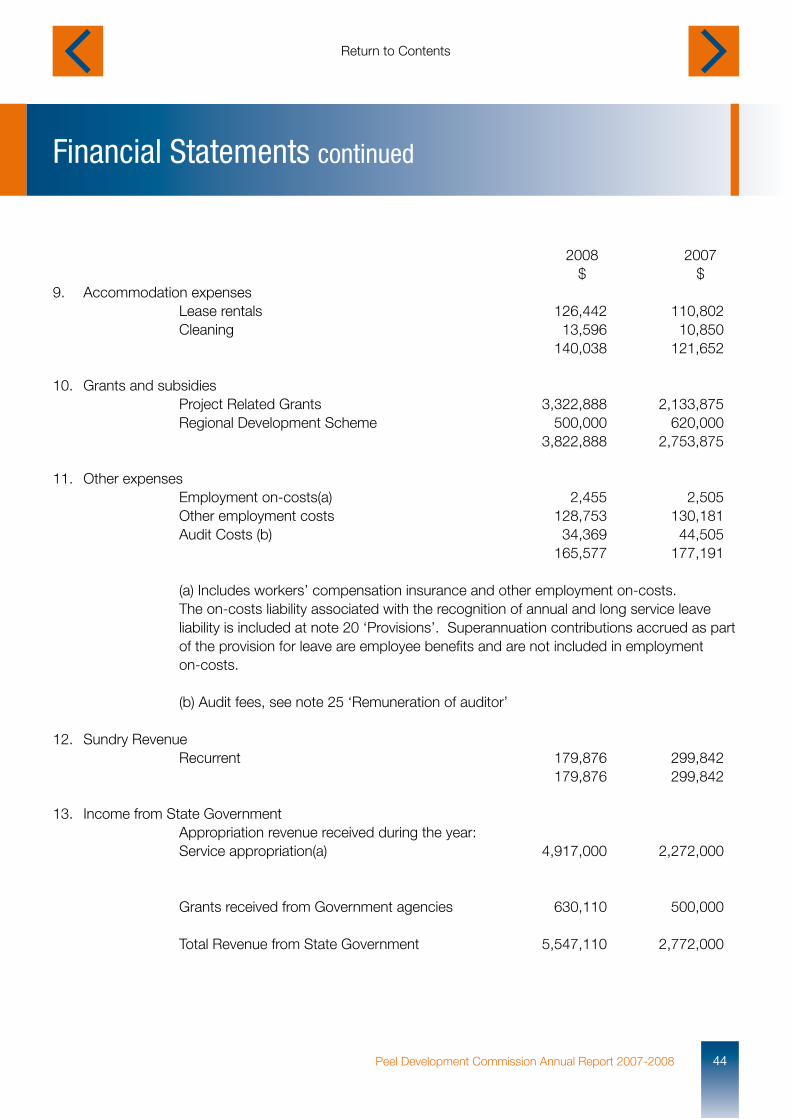
Financial Statements continued
44Peel Development Commission Annual Report 2007-2008
2008 2007 $ $9. Accommodation expenses Lease rentals 126,442 110,802 Cleaning 13,596 10,850 140,038 121,652 10. Grants and subsidies Project Related Grants 3,322,888 2,133,875 Regional Development Scheme 500,000 620,000 3,822,888 2,753,875 11. Other expenses Employment on-costs(a) 2,455 2,505 Other employment costs 128,753 130,181 Audit Costs (b) 34,369 44,505 165,577 177,191 (a) Includes workers’ compensation insurance and other employment on-costs. The on- costs liability associated with the recognition of annual and long service leave liability is included at note 20 ‘Provisions’. Superannuation contributions accrued as part of the provision for leave are employee benefits and are not included in employment on-costs. (b) Audit fees, see note 25 ‘Remuneration of auditor’ 12. Sundry Revenue Recurrent 179,876 299,842 179,876 299,842
13. Income from State Government Appropriation revenue received during the year: Service appropriation(a) 4,917,000 2,272,000 Grants received from Government agencies 630,110 500,000 Total Revenue from State Government 5,547,110 2,772,000
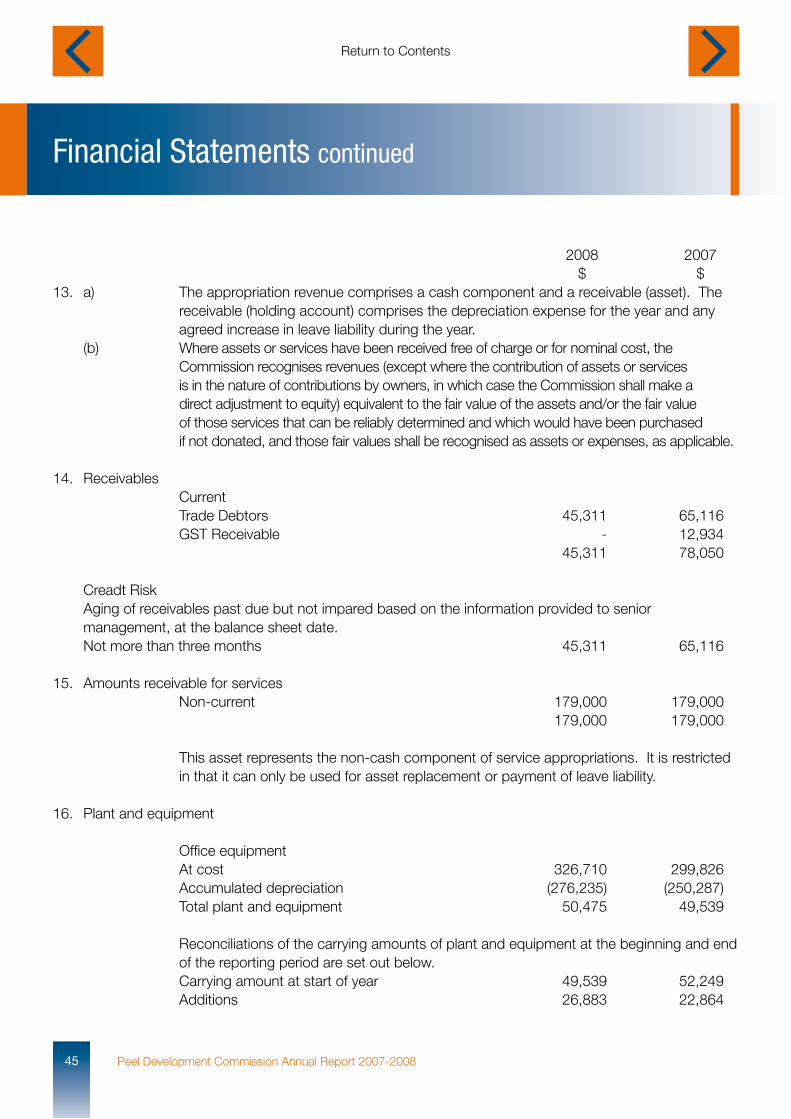
Financial Statements continued
Peel Development Commission Annual Report 2007-200845
2008 2007 $ $13. a) The appropriation revenue comprises a cash component and a receivable (asset). The receivable (holding account) comprises the depreciation expense for the year and any agreed increase in leave liability during the year. (b) Where assets or services have been received free of charge or for nominal cost, the Commission recognises revenues (except where the contribution of assets or services is in the nature of contributions by owners, in which case the Commission shall make a direct adjustment to equity) equivalent to the fair value of the assets and/or the fair value of those services that can be reliably determined and which would have been purchased if not donated, and those fair values shall be recognised as assets or expenses, as applicable. 14. Receivables Current Trade Debtors 45,311 65,116 GST Receivable - 12,934 45,311 78,050
Creadt Risk Aging of receivables past due but not impared based on the information provided to senior management, at the balance sheet date. Not more than three months 45,311 65,116 15. Amounts receivable for services Non-current 179,000 179,000 179,000 179,000 This asset represents the non-cash component of service appropriations. It is restricted in that it can only be used for asset replacement or payment of leave liability. 16. Plant and equipment Office equipment At cost 326,710 299,826 Accumulated depreciation (276,235) (250,287) Total plant and equipment 50,475 49,539 Reconciliations of the carrying amounts of plant and equipment at the beginning and end of the reporting period are set out below. Carrying amount at start of year 49,539 52,249 Additions 26,883 22,864

Financial Statements continued
46Peel Development Commission Annual Report 2007-2008
2008 2007 $ $17. Intangible assets Computer Software At cost 84,420 84,420 Accumulated depreciation (75,900) (66,525) 8,520 17,895 Reconciliations: Carrying amount at start of year 17,895 15,234 Additions - 12,212 Depreciation (9,375) (9,551) Carrying amount at end of year 8,520 17,895 18. Impairment of assets There were no indications of impairment of plant and equipment, infrastructure and intangible assets at 30 June 2008. The Commission held no goodwill or intangible assets with an indefinite useful life during the reporting period and at reporting date there were no intangible assets not yet available for use. All surplus assets at 30 June 2008 have been classified as assets held for sale or written off. 19. Trade & Other Payables Current Trade payables 145,201 160,355 GST payable 28,285 - 173,486 160,355 20. Provisions Current Employee benefits provision Annual leave (a) 69,549 67,937 Long service leave(b) 32,207 17,345 101,756 85,282 Other provisions Employment on-costs(c) 6,259 9,381 6,259 9,381 Total current provisions 108,015 94,663 Non-current Long service leave(b) 46,201 61,597 46,201 61,597
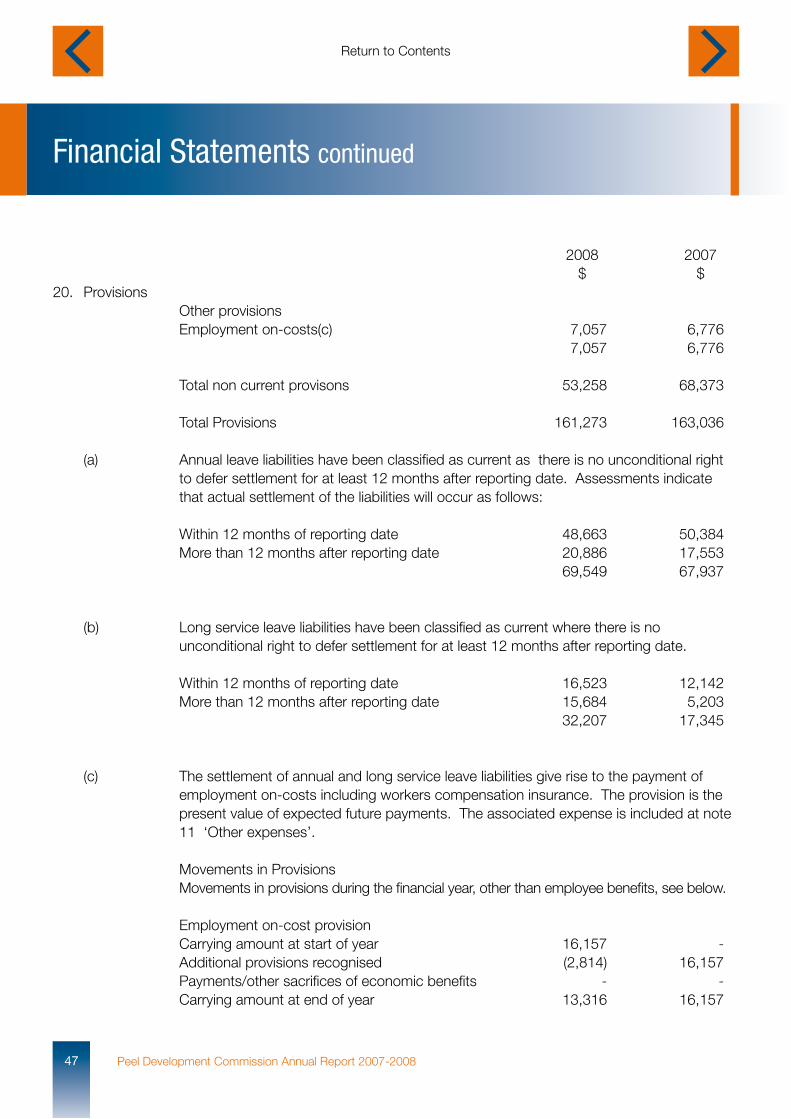
Financial Statements continued
Peel Development Commission Annual Report 2007-200847
2008 2007 $ $20. Provisions Other provisions Employment on-costs(c) 7,057 6,776 7,057 6,776 Total non current provisons 53,258 68,373 Total Provisions 161,273 163,036 (a) Annual leave liabilities have been classified as current as there is no unconditional right to defer settlement for at least 12 months after reporting date. Assessments indicate that actual settlement of the liabilities will occur as follows: Within 12 months of reporting date 48,663 50,384 More than 12 months after reporting date 20,886 17,553 69,549 67,937 (b) Long service leave liabilities have been classified as current where there is no unconditional right to defer settlement for at least 12 months after reporting date. Within 12 months of reporting date 16,523 12,142 More than 12 months after reporting date 15,684 5,203 32,207 17,345 (c) The settlement of annual and long service leave liabilities give rise to the payment of employment on-costs including workers compensation insurance. The provision is the present value of expected future payments. The associated expense is included at note 11 ‘Other expenses’. Movements in Provisions Movements in provisions during the financial year, other than employee benefits, see below. Employment on-cost provision Carrying amount at start of year 16,157 - Additional provisions recognised (2,814) 16,157 Payments/other sacrifices of economic benefits - - Carrying amount at end of year 13,316 16,157
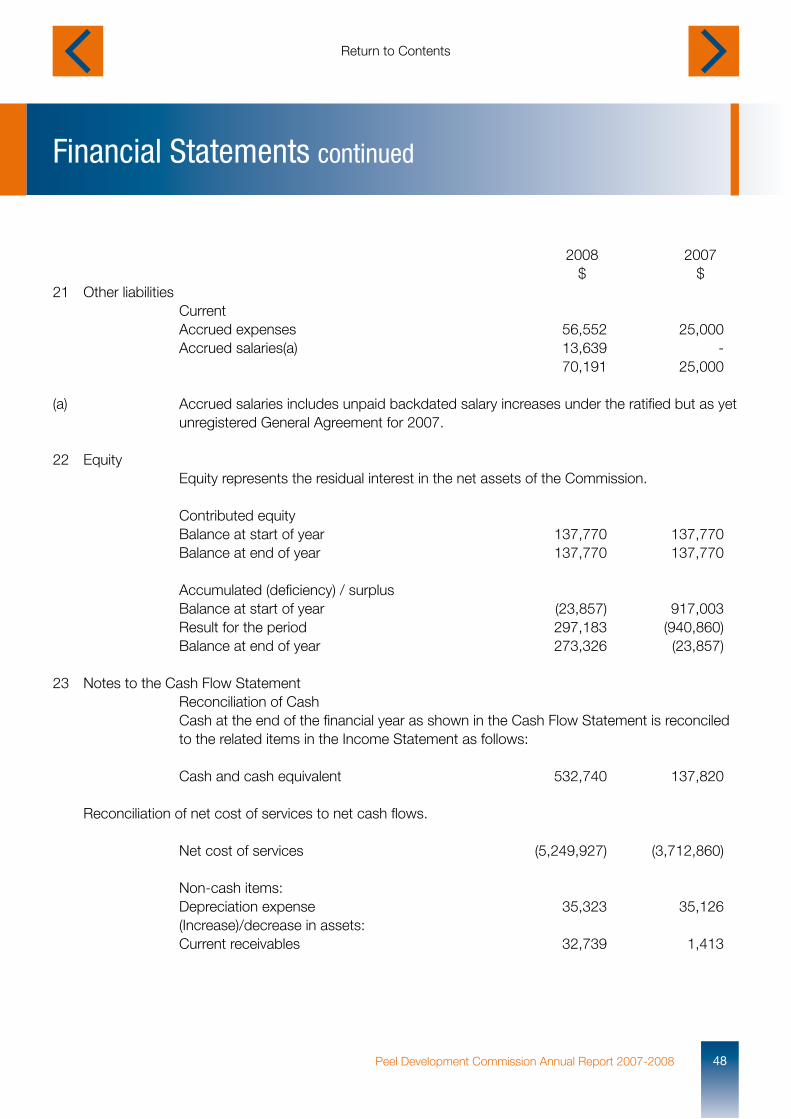
Financial Statements continued
48Peel Development Commission Annual Report 2007-2008
2008 2007 $ $21 Other liabilities Current Accrued expenses 56,552 25,000 Accrued salaries(a) 13,639 - 70,191 25,000 (a) Accrued salaries includes unpaid backdated salary increases under the ratified but as yet unregistered General Agreement for 2007. 22 Equity Equity represents the residual interest in the net assets of the Commission. Contributed equity Balance at start of year 137,770 137,770 Balance at end of year 137,770 137,770 Accumulated (deficiency) / surplus Balance at start of year (23,857) 917,003 Result for the period 297,183 (940,860) Balance at end of year 273,326 (23,857) 23 Notes to the Cash Flow Statement Reconciliation of Cash Cash at the end of the financial year as shown in the Cash Flow Statement is reconciled to the related items in the Income Statement as follows: Cash and cash equivalent 532,740 137,820 Reconciliation of net cost of services to net cash flows. Net cost of services (5,249,927) (3,712,860) Non-cash items: Depreciation expense 35,323 35,126 (Increase)/decrease in assets: Current receivables 32,739 1,413
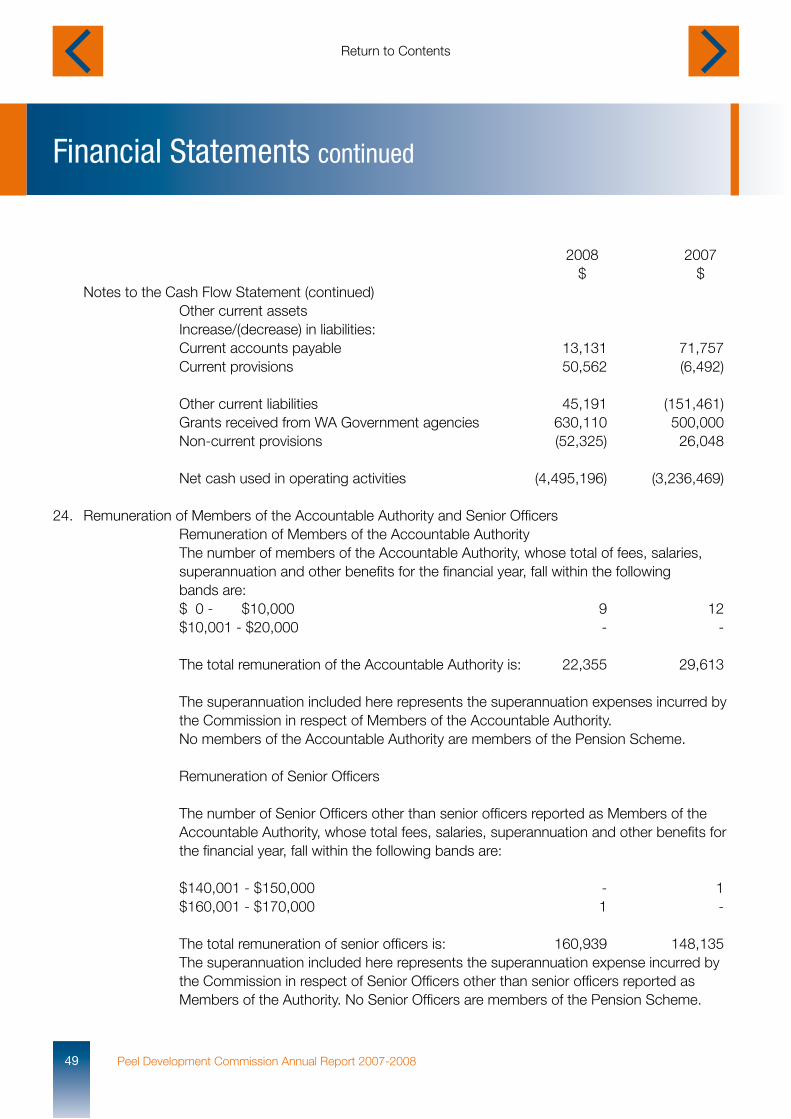
Financial Statements continued
Peel Development Commission Annual Report 2007-200849
2008 2007 $ $ Notes to the Cash Flow Statement (continued) Other current assets Increase/(decrease) in liabilities: Current accounts payable 13,131 71,757 Current provisions 50,562 (6,492) Other current liabilities 45,191 (151,461) Grants received from WA Government agencies 630,110 500,000 Non-current provisions (52,325) 26,048 Net cash used in operating activities (4,495,196) (3,236,469) 24. Remuneration of Members of the Accountable Authority and Senior Officers Remuneration of Members of the Accountable Authority The number of members of the Accountable Authority, whose total of fees, salaries, superannuation and other benefits for the financial year, fall within the following bands are: $ 0 - $10,000 9 12 $10,001 - $20,000 - - The total remuneration of the Accountable Authority is: 22,355 29,613 The superannuation included here represents the superannuation expenses incurred by the Commission in respect of Members of the Accountable Authority. No members of the Accountable Authority are members of the Pension Scheme. Remuneration of Senior Officers The number of Senior Officers other than senior officers reported as Members of the Accountable Authority, whose total fees, salaries, superannuation and other benefits for the financial year, fall within the following bands are: $140,001 - $150,000 - 1 $160,001 - $170,000 1 - The total remuneration of senior officers is: 160,939 148,135 The superannuation included here represents the superannuation expense incurred by the Commission in respect of Senior Officers other than senior officers reported as Members of the Authority. No Senior Officers are members of the Pension Scheme.
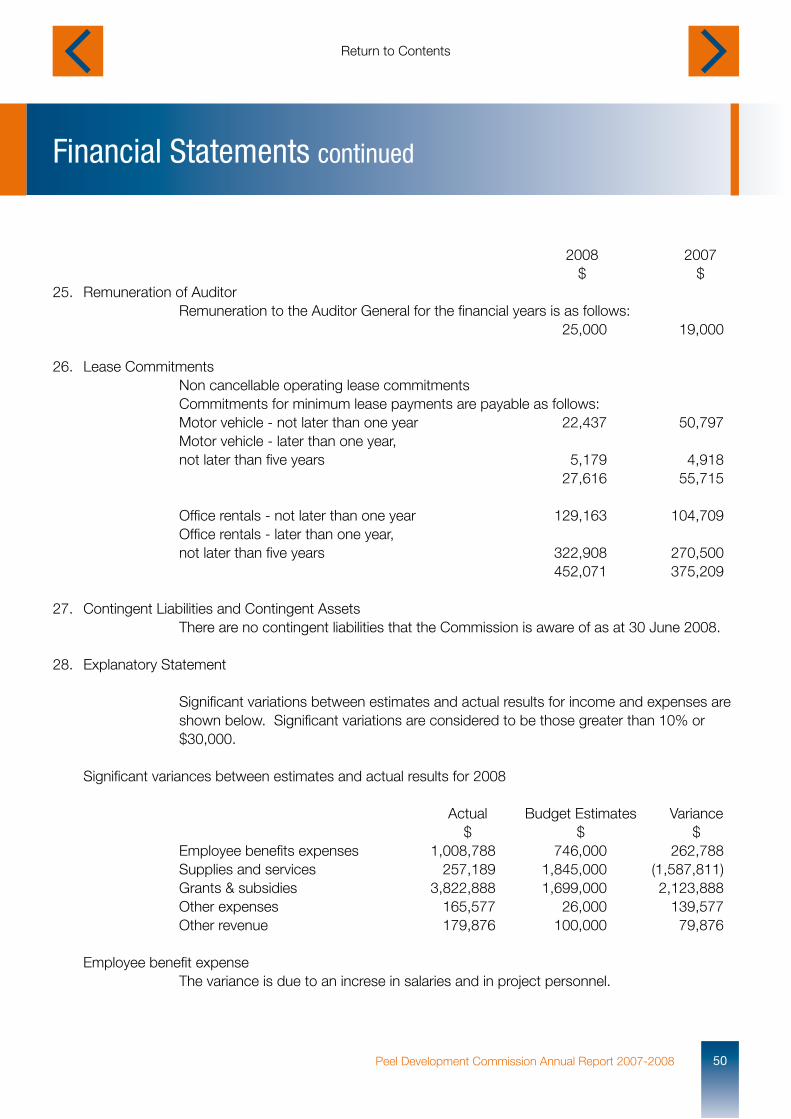
Financial Statements continued
50Peel Development Commission Annual Report 2007-2008
2008 2007 $ $25. Remuneration of Auditor Remuneration to the Auditor General for the financial years is as follows: 25,000 19,000 26. Lease Commitments Non cancellable operating lease commitments Commitments for minimum lease payments are payable as follows: Motor vehicle - not later than one year 22,437 50,797 Motor vehicle - later than one year, not later than five years 5,179 4,918 27,616 55,715 Office rentals - not later than one year 129,163 104,709 Office rentals - later than one year, not later than five years 322,908 270,500 452,071 375,209 27. Contingent Liabilities and Contingent Assets There are no contingent liabilities that the Commission is aware of as at 30 June 2008.
28. Explanatory Statement Significant variations between estimates and actual results for income and expenses are shown below. Significant variations are considered to be those greater than 10% or $30,000. Significant variances between estimates and actual results for 2008 Actual Budget Estimates Variance $ $ $ Employee benefits expenses 1,008,788 746,000 262,788 Supplies and services 257,189 1,845,000 (1,587,811) Grants & subsidies 3,822,888 1,699,000 2,123,888 Other expenses 165,577 26,000 139,577 Other revenue 179,876 100,000 79,876
Employee benefit expense The variance is due to an increse in salaries and in project personnel.
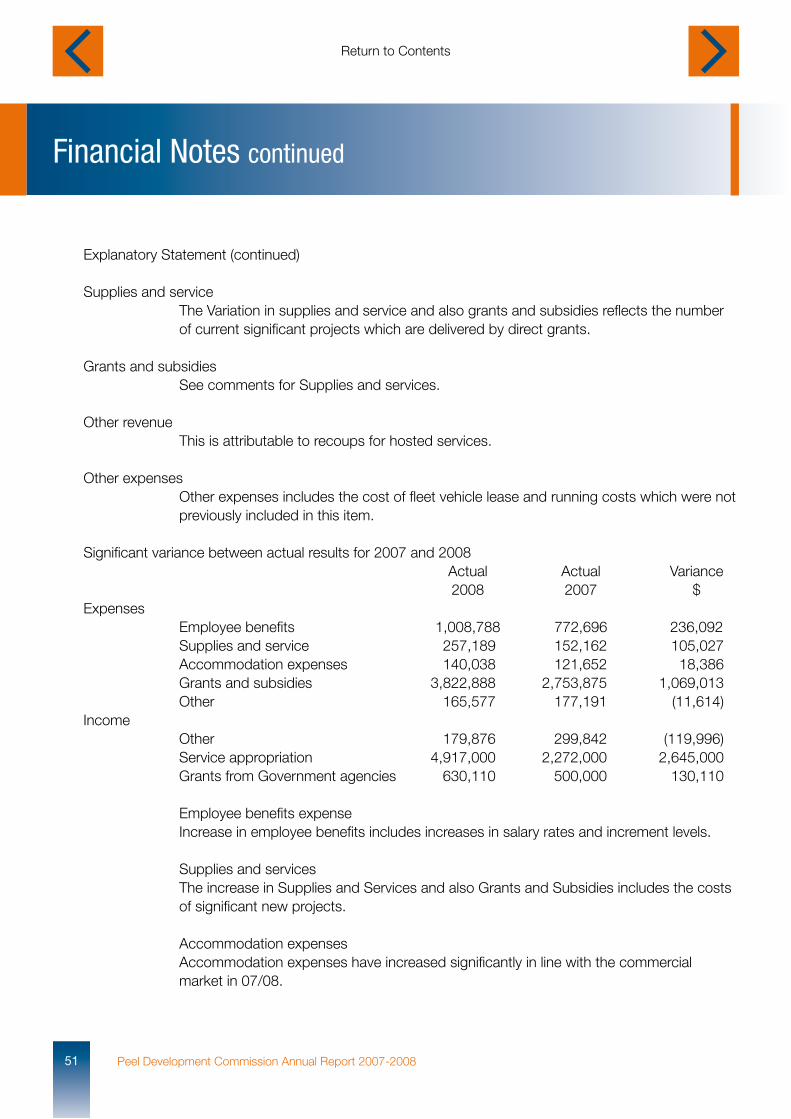
Financial Notes continued
Peel Development Commission Annual Report 2007-200851
Explanatory Statement (continued)
Supplies and service The Variation in supplies and service and also grants and subsidies reflects the number of current significant projects which are delivered by direct grants.
Grants and subsidies See comments for Supplies and services.
Other revenue This is attributable to recoups for hosted services.
Other expenses Other expenses includes the cost of fleet vehicle lease and running costs which were not previously included in this item. Significant variance between actual results for 2007 and 2008 Actual Actual Variance 2008 2007 $ Expenses Employee benefits 1,008,788 772,696 236,092 Supplies and service 257,189 152,162 105,027 Accommodation expenses 140,038 121,652 18,386 Grants and subsidies 3,822,888 2,753,875 1,069,013 Other 165,577 177,191 (11,614) Income Other 179,876 299,842 (119,996) Service appropriation 4,917,000 2,272,000 2,645,000 Grants from Government agencies 630,110 500,000 130,110 Employee benefits expense Increase in employee benefits includes increases in salary rates and increment levels. Supplies and services The increase in Supplies and Services and also Grants and Subsidies includes the costs of significant new projects. Accommodation expenses Accommodation expenses have increased significantly in line with the commercial market in 07/08.
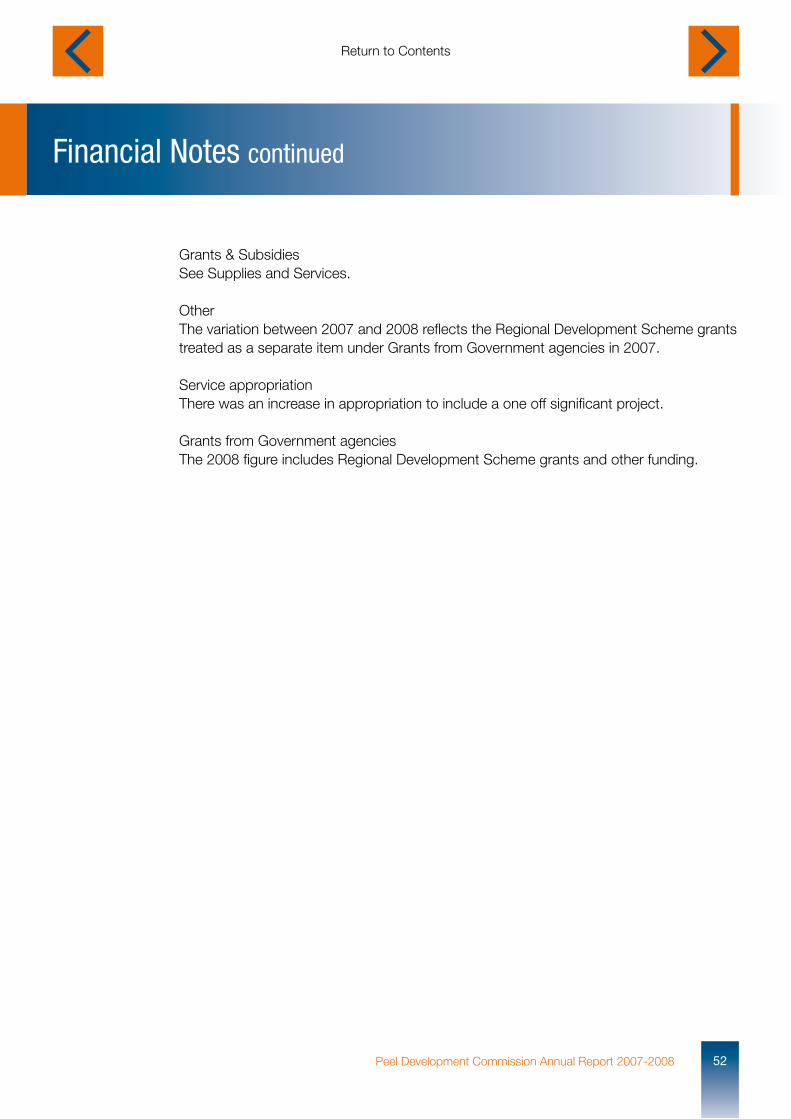
Financial Notes continued
52Peel Development Commission Annual Report 2007-2008
Grants & Subsidies See Supplies and Services. Other The variation between 2007 and 2008 reflects the Regional Development Scheme grants treated as a separate item under Grants from Government agencies in 2007. Service appropriation There was an increase in appropriation to include a one off significant project. Grants from Government agencies The 2008 figure includes Regional Development Scheme grants and other funding.
Financial Notes continued
Peel Development Commission Annual Report 2007-200853
29 Financial instruments(a) Financial Risk Management Objectives and Policies
Financial instruments held by the Commission are cash and cash equivalents, restricted cash and cash equivalents, borrowings, finance leases, Treasurer’s advances, loans and receivables, and payables. The Commission has limited exposure to financial risks. The Commission’s overall risk management program focuses on managing the risks identified below.
Credit riskCredit risk arises when there is the possibility of the Commission’s receivables defaulting on their contractual obligations resulting in financial loss to the Commission. The Commission measures credit risk on a fair value basis and monitors risk on a regular basis.
The maximum exposure to credit risk at balance sheet date in relation to each class of recognised financial assets is the gross carrying amount of those assets inclusive of any provisions for impairment as shown in the table at Note 29(c).
Credit risk associated with the Commission’s financial assets is minimal because the main receivable is the amounts receivable for services (holding account). For receivables other than government, the Commission trades only with recognised, creditworthy third parties. The Commission has policies in place to ensure that sales of products and services are made to customers with an appropriate credit history. In addition, receivable balances are monitored on an ongoing basis with the result that the Commission’s exposure to bad debts is minimal. There are no significant concentrations of credit risk.
Provision for impairment of financial assets is calculated based on past experience, and current and expected changes in client credit ratings. For financial assets that are either past due or impaired, refer to Note 14 ‘Receivables’.
Liquidity riskThe Commission is exposed to liquidity risk through its trading in the normal course of business. Liquidity risk arises when the Commission is unable to meet its financial obligations as they fall due.
The Commission has appropriate procedures to manage cash flows including drawdowns of appropriations by monitoring forecast cash flows to ensure that sufficient funds are available to meet its commitments.
Market riskThe Commission does not trade in foreign currency and is not materially exposed to other price risks. Other than as detailed in the Interest rate sensitivity analysis table at Note 29(c), the Commission is not exposed to interest rate risk because cash and cash equivalents are non-interest bearing and have no borrowings other than the Treasurer’s advance (non-interest bearing).
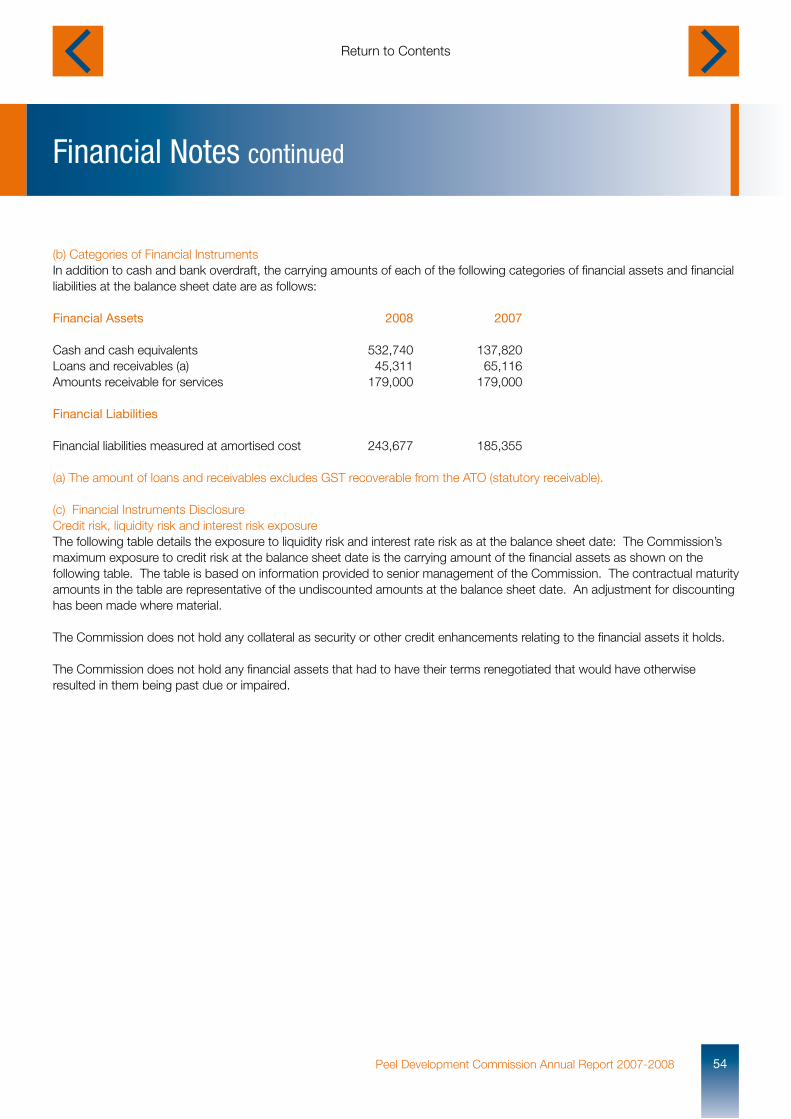
Financial Notes continued
54Peel Development Commission Annual Report 2007-2008
(b) Categories of Financial InstrumentsIn addition to cash and bank overdraft, the carrying amounts of each of the following categories of financial assets and financial liabilities at the balance sheet date are as follows:
Financial Assets 2008 2007 Cash and cash equivalents 532,740 137,820Loans and receivables (a) 45,311 65,116Amounts receivable for services 179,000 179,000 Financial Liabilities
Financial liabilities measured at amortised cost 243,677 185,355
(a) The amount of loans and receivables excludes GST recoverable from the ATO (statutory receivable).
(c) Financial Instruments DisclosureCredit risk, liquidity risk and interest risk exposureThe following table details the exposure to liquidity risk and interest rate risk as at the balance sheet date: The Commission’s maximum exposure to credit risk at the balance sheet date is the carrying amount of the financial assets as shown on the following table. The table is based on information provided to senior management of the Commission. The contractual maturity amounts in the table are representative of the undiscounted amounts at the balance sheet date. An adjustment for discounting has been made where material.
The Commission does not hold any collateral as security or other credit enhancements relating to the financial assets it holds.
The Commission does not hold any financial assets that had to have their terms renegotiated that would have otherwise resulted in them being past due or impaired.
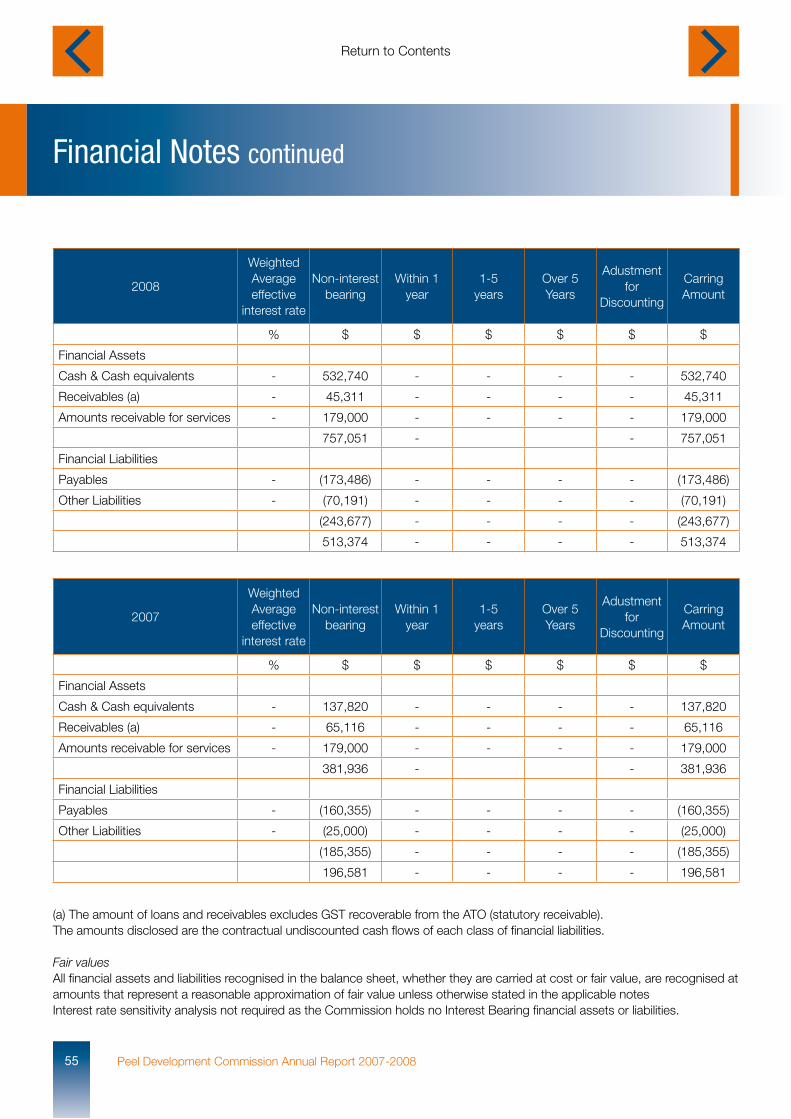
Financial Notes continued
Peel Development Commission Annual Report 2007-200855
2008
Weighted Average effective
interest rate
Non-interestbearing
Within 1 year
1-5years
Over 5Years
Adustmentfor
Discounting
Carring Amount
% $ $ $ $ $ $
Financial Assets
Cash & Cash equivalents - 532,740 - - - - 532,740
Receivables (a) - 45,311 - - - - 45,311
Amounts receivable for services - 179,000 - - - - 179,000
757,051 - - 757,051
Financial Liabilities
Payables - (173,486) - - - - (173,486)
Other Liabilities - (70,191) - - - - (70,191)
(243,677) - - - - (243,677)
513,374 - - - - 513,374
2007
Weighted Average effective
interest rate
Non-interestbearing
Within 1 year
1-5years
Over 5Years
Adustmentfor
Discounting
Carring Amount
% $ $ $ $ $ $
Financial Assets
Cash & Cash equivalents - 137,820 - - - - 137,820
Receivables (a) - 65,116 - - - - 65,116
Amounts receivable for services - 179,000 - - - - 179,000
381,936 - - 381,936
Financial Liabilities
Payables - (160,355) - - - - (160,355)
Other Liabilities - (25,000) - - - - (25,000)
(185,355) - - - - (185,355)
196,581 - - - - 196,581
(a) The amount of loans and receivables excludes GST recoverable from the ATO (statutory receivable).The amounts disclosed are the contractual undiscounted cash flows of each class of financial liabilities.
Fair valuesAll financial assets and liabilities recognised in the balance sheet, whether they are carried at cost or fair value, are recognised at amounts that represent a reasonable approximation of fair value unless otherwise stated in the applicable notesInterest rate sensitivity analysis not required as the Commission holds no Interest Bearing financial assets or liabilities.
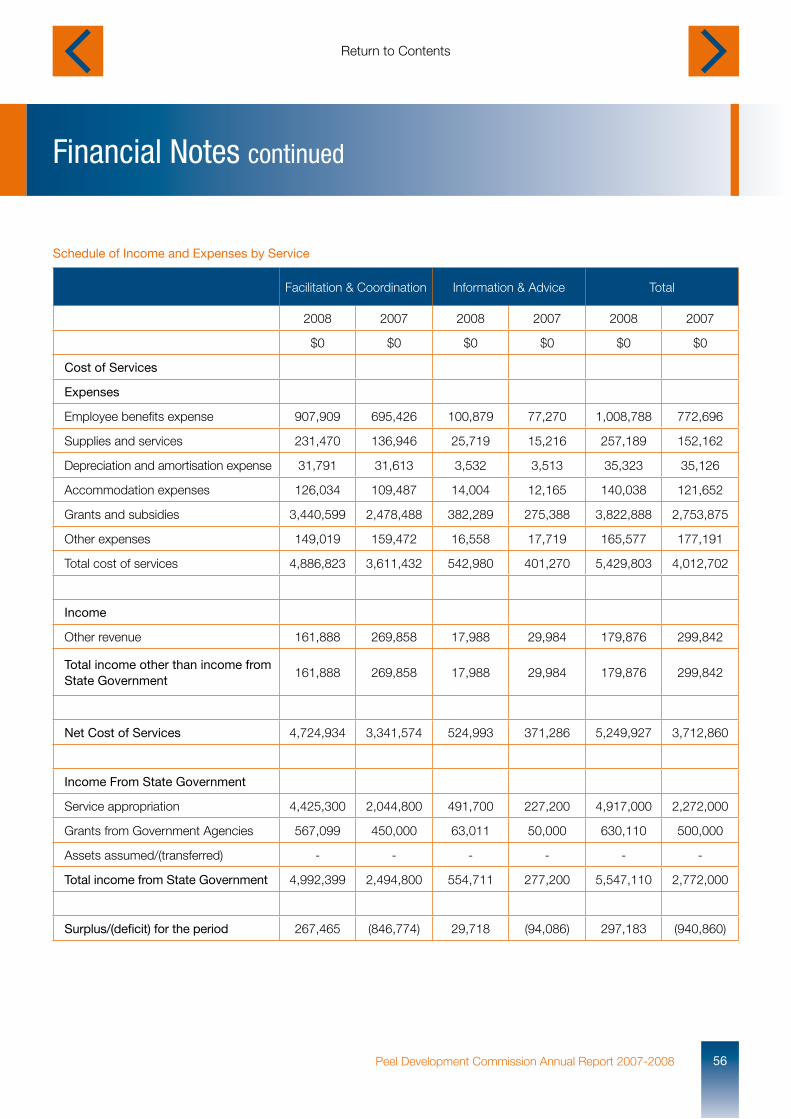
Financial Notes continued
56Peel Development Commission Annual Report 2007-2008
Facilitation & Coordination Information & Advice Total
2008 2007 2008 2007 2008 2007
$0 $0 $0 $0 $0 $0
Cost of Services
Expenses
Employee benefits expense 907,909 695,426 100,879 77,270 1,008,788 772,696
Supplies and services 231,470 136,946 25,719 15,216 257,189 152,162
Depreciation and amortisation expense 31,791 31,613 3,532 3,513 35,323 35,126
Accommodation expenses 126,034 109,487 14,004 12,165 140,038 121,652
Grants and subsidies 3,440,599 2,478,488 382,289 275,388 3,822,888 2,753,875
Other expenses 149,019 159,472 16,558 17,719 165,577 177,191
Total cost of services 4,886,823 3,611,432 542,980 401,270 5,429,803 4,012,702
Income
Other revenue 161,888 269,858 17,988 29,984 179,876 299,842
Total income other than income from State Government
161,888 269,858 17,988 29,984 179,876 299,842
Net Cost of Services 4,724,934 3,341,574 524,993 371,286 5,249,927 3,712,860
Income From State Government
Service appropriation 4,425,300 2,044,800 491,700 227,200 4,917,000 2,272,000
Grants from Government Agencies 567,099 450,000 63,011 50,000 630,110 500,000
Assets assumed/(transferred) - - - - - -
Total income from State Government 4,992,399 2,494,800 554,711 277,200 5,547,110 2,772,000
Surplus/(deficit) for the period 267,465 (846,774) 29,718 (94,086) 297,183 (940,860)
Schedule of Income and Expenses by Service
Detailed Key Performance Indicator Information
Peel Development Commission Annual Report 2007-200857
Certification of Performance Indicators for the Year Ended 30 June 2008
We hereby certify that the Performance Indicators are based on proper records, are relevant and appropriate for assisting users to assess the Peel Development Commission’s performance, and fairly represent the performance of the Commission for the financial year ending 30 June 2008.
Hon John Cowdell Maree De Lacey Helen SlaterChairman Chief Executive Officer Chief Financial Officer
1 September 2008 1 September 2008 1 September 2008
Overall Effectiveness IndicatorsThe desired outcome of the Commission is the development and promotion of the Peel Region.
The effectiveness of the Commission in achieving its outcomes is determined by undertaking an annual client/stakeholder survey. In 2007-08, the Commission engaged an independent market research consultancy to undertake its Client Survey.
The Commission provided a database of 452 individuals who had been key clients and stakeholders during 2007-08. From this list 380 clients were randomly selected by the research consultant for the survey sample. Using the telephone as the primary means of contact 203 surveys were successfully completed providing a response rate of 53.4% of the sample. The response rate is sufficient to ensure that the overall results are representative of the opinions of the population of key clients within an actual sampling error of +/- 5%.
Survey respondents were asked to rate their satisfaction with the Peel Development Commission’s (PDC) achievement of the following key outcomes:
• Satisfaction with the Commission’s facilitation and coordination towards achieving the development and promotion of the Peel Region.• Satisfaction with the Commission’s advice and information in support of the development and promotion of the Peel Region.• Satisfaction with the Development Commission’s contribution to the Peel region’s economic base.
A percentage score has been calculated below to determine an overall satisfaction rating for each of the three areas.
The score for satisfaction with the Commission’s contribution to the economic base (85.8%) has increased marginally compared to the score achieved in 2007 (83.4%), as has the score for the Commission’s facilitation and coordination towards achieving the development and promotion of the Peel Region (82.1% in 2008 compared to 81.4% in 2007). The satisfaction score for the Commission’s advice and information in support of the development and promotion of the Peel Region (75.6%) has fallen slightly since 2007 (78.1%).
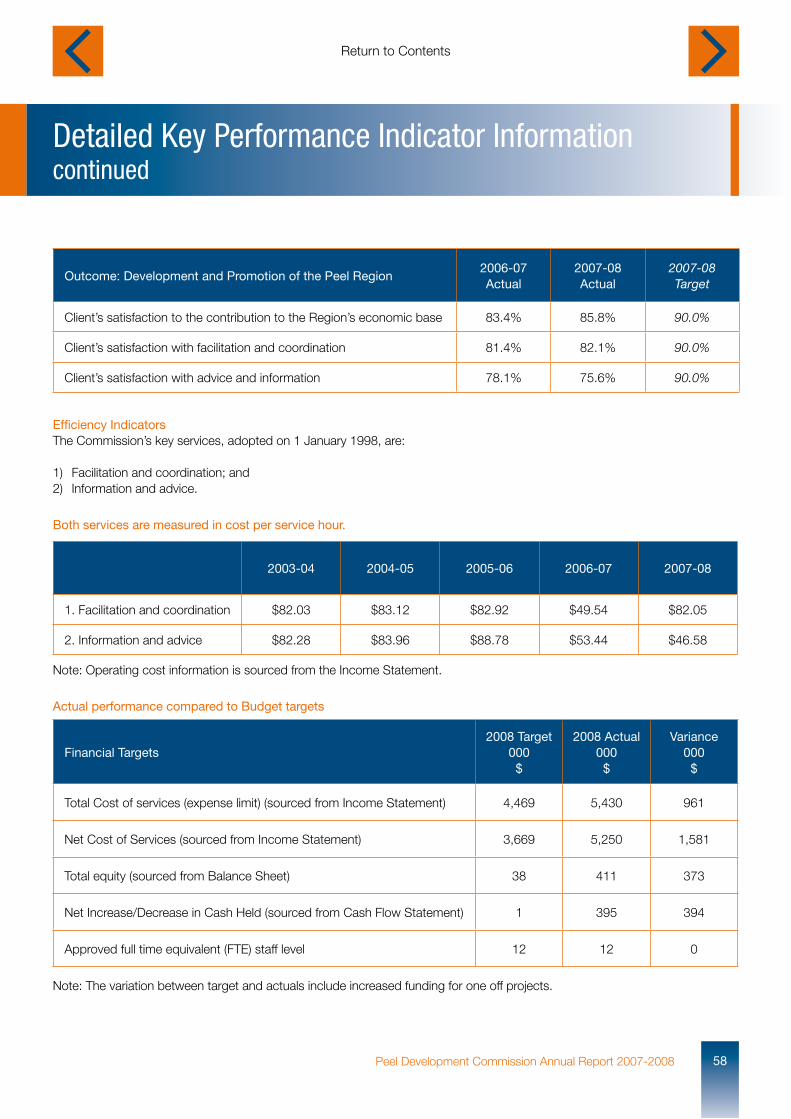
Detailed Key Performance Indicator Information continued
58Peel Development Commission Annual Report 2007-2008
Outcome: Development and Promotion of the Peel Region2006-07 Actual
2007-08 Actual
2007-08 Target
Client’s satisfaction to the contribution to the Region’s economic base 83.4% 85.8% 90.0%
Client’s satisfaction with facilitation and coordination 81.4% 82.1% 90.0%
Client’s satisfaction with advice and information 78.1% 75.6% 90.0%
Efficiency IndicatorsThe Commission’s key services, adopted on 1 January 1998, are:
1) Facilitation and coordination; and2) Information and advice.
2003-04 2004-05 2005-06 2006-07 2007-08
1. Facilitation and coordination $82.03 $83.12 $82.92 $49.54 $82.05
2. Information and advice $82.28 $83.96 $88.78 $53.44 $46.58
Both services are measured in cost per service hour.
Note: Operating cost information is sourced from the Income Statement.
Actual performance compared to Budget targets
Financial Targets2008 Target
000$
2008 Actual000
$
Variance000$
Total Cost of services (expense limit) (sourced from Income Statement) 4,469 5,430 961
Net Cost of Services (sourced from Income Statement) 3,669 5,250 1,581
Total equity (sourced from Balance Sheet) 38 411 373
Net Increase/Decrease in Cash Held (sourced from Cash Flow Statement) 1 395 394
Approved full time equivalent (FTE) staff level 12 12 0
Note: The variation between target and actuals include increased funding for one off projects.
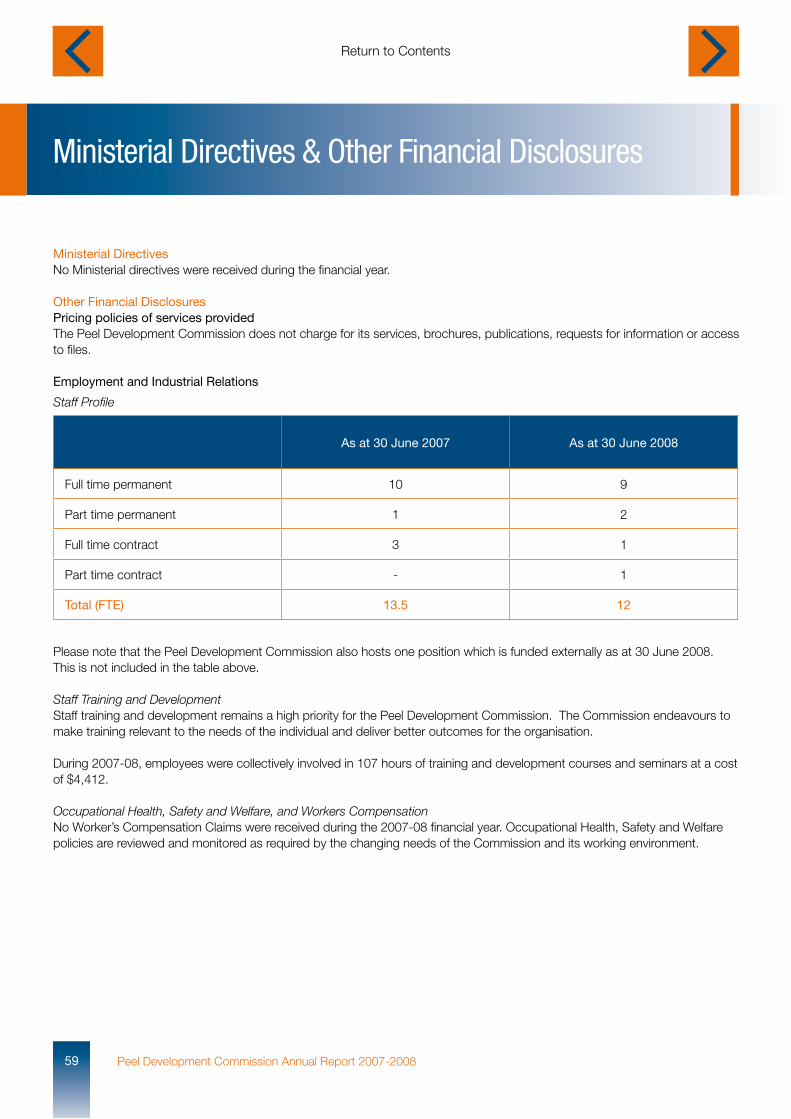
Ministerial Directives & Other Financial Disclosures
Peel Development Commission Annual Report 2007-200859
Ministerial DirectivesNo Ministerial directives were received during the financial year.
Other Financial DisclosuresPricing policies of services providedThe Peel Development Commission does not charge for its services, brochures, publications, requests for information or access to files.
Employment and Industrial Relations
As at 30 June 2007 As at 30 June 2008
Full time permanent 10 9
Part time permanent 1 2
Full time contract 3 1
Part time contract - 1
Total (FTE) 13.5 12
Staff Profile
Please note that the Peel Development Commission also hosts one position which is funded externally as at 30 June 2008. This is not included in the table above.
Staff Training and DevelopmentStaff training and development remains a high priority for the Peel Development Commission. The Commission endeavours to make training relevant to the needs of the individual and deliver better outcomes for the organisation.
During 2007-08, employees were collectively involved in 107 hours of training and development courses and seminars at a cost of $4,412.
Occupational Health, Safety and Welfare, and Workers CompensationNo Worker’s Compensation Claims were received during the 2007-08 financial year. Occupational Health, Safety and Welfare policies are reviewed and monitored as required by the changing needs of the Commission and its working environment.
Governance Disclosures
60Peel Development Commission Annual Report 2007-2008
Contracts with Senior OfficersAt the date of reporting, other than normal contracts of employment of service, no Board members or senior officers, or firms of which members or senior officers are members, or entities in which members or senior officers have substantial interests had any interests in existing or proposed contracts with the Commission and members or with senior officers.
The Commission funds grants through the Regional Development Scheme of which Board members may be members of the recipient organisation. The Peel Development Commission management assesses each grant proposal according to specific criteria, then makes recommendations to the Board. Where there is potential for a conflict of interest, Board members excuse themselves from the decision-making process.
Other Legal Requirements
Peel Development Commission Annual Report 2007-200861
AdvertisingIn compliance with section 175ZE of the Electoral Act 1907 the Commission monitors expenditure incurred during the financial year in relation to advertising agencies, market research organisations, polling organisations, direct mail organisations and media advertising organisations. The details of the Commission’s expenditure in these areas are as follows:
Market research organisations $4,653
Advertising agency services $12,738
Market advertising promotion campaigns -
Total $17,391
Payments (incl. GST) totalling $1,800 or more during the reporting year were made to each of the following organisations:
Asset Research $4,653Market Force $12,738
Compliance with Public Sector Management Act 1994 31 (1)In the administration of the Peel Development Commission, I have complied with the Public Sector Standards in Human Resource Management, the Western Australian Public Sector Code of Ethics, and the Code of Conduct. The applications made for breach of standards review and the corresponding outcomes for the reporting period are as follows:
Compliance issues Significant action taken to monitor and ensure compliance
Public Sector Standards (PSS)Nil breach claims
•
••
•
Regularly updated information about Standards included on the Peel Development Commission internal information system & within induction materials as well as being provided to the Board.Ongoing awareness raising process conducted on the Standards.Training provided to grievance officers and persons on recruitment panels to ensure compliance with relevant Standards.Transactions audited internally as a standard operating procedure.
WA Code of EthicsNil reports of non compliance with WA Code of Ethics
•
••
WA Code of Ethics part of induction materials & on Peel Development Commission internal information system.Ethics a standing topic for all executive and staff meetings.Executive staff report on ethical issues arising to the Chief Executive Officer.
Peel Development Commission Code of ConductNil breach claims or reports
•
•
Code of Conduct accessible on intranet and hard copies available to staff (signed off on induction).Ongoing awareness for staff conducted on Code of Conduct.
Mary De LaceyChief Executive Officer1 September 2008
Other Legal Requirements continued
62Peel Development Commission Annual Report 2007-2008
Disability Access and Inclusion Plan OutcomesThe Disability Services Act 1993 was amended in December 2004, creating a requirement for the Peel Development Commission to develop and implement Disability Access and Inclusion Plans. Other legislation, underpinning access and inclusion, includes the WA Equal Opportunity Act 1984 and the Commonwealth Disability Discrimination Act 1992.
During the year the Commission progressed the following strategies:
Outcome 1: People with disabilities have the same opportunities as other people to access the services of, and any events organised by, the Peel Development Commission. • Providing opportunities for people with disabilities to comment on access to services and advice provided by the Commission. • Ensuring that agents and contractors, particularly publishers and events/ promotional service providers, of the Commission are aware of their requirements under the Disability Access and Inclusion Plan.Outcome 2: People with disabilities have the same opportunities as other people to access the buildings and other facilities of the Peel Development Commission. • Ensuring procedures for enabling access to our staff and materials (including participation in relevant meetings) by people with disabilities are communicated to staff, and to people with disabilities and their families/carers through relevant agencies.Outcome 3: People with disabilities receive information from Peel Development Commission in a format that will enable them to access the information as readily as other people are able to access it. • Improving community awareness that Commission information can be made available in alternative formats upon request.Outcome 4: People with disabilities receive the same level and quality of service from the staff of the Peel Development Commission as other people. • Improving the awareness of new staff of the Commission about disability and access issues.Outcome 5: People with disabilities have the same opportunities as other people to make complaints to the Peel Development Commission. • Ensuring that current grievance mechanisms are accessible for people with disabilities.Outcome 6: People with disabilities have the same opportunities as other people to participate in public consultation by the Peel Development Commission. • Improving community awareness about consultation processes in place.
Recordkeeping PlansAs required by the State Records Act 2000 the Commission maintains a Record Keeping Plan (RKP) which was approved by the State Records Office. The Commission’s recordkeeping system has been substantially updated with the installation of the RecFind electronic file storage and cataloguing software together with the systematic archiving of files no longer in use.
Accompanying the change to a new electronic recordkeeping system:
• All Commission staff were provided with training in the use of the new software; • Training in the use of RecFind has been included as a component of the Commission’s staff induction process; and • State Records Office provided training to staff on record keeping.
During 2007-2008, the Office of the Auditor General conducted a Record Management Audit on several State Government agencies including Peel Development Commission. Areas assessed in the audit included: Record Keeping Plans; Designated Staff; Dedicated Systems; Staff Training; IT Disaster Management Plan; and Compliance with Records Retention Schedule. The only issue identified for the Commission was in the area of the IT Disaster Management Plan. The Commission had already identified this as an area of concern and work had commenced to address this area prior to the audit.
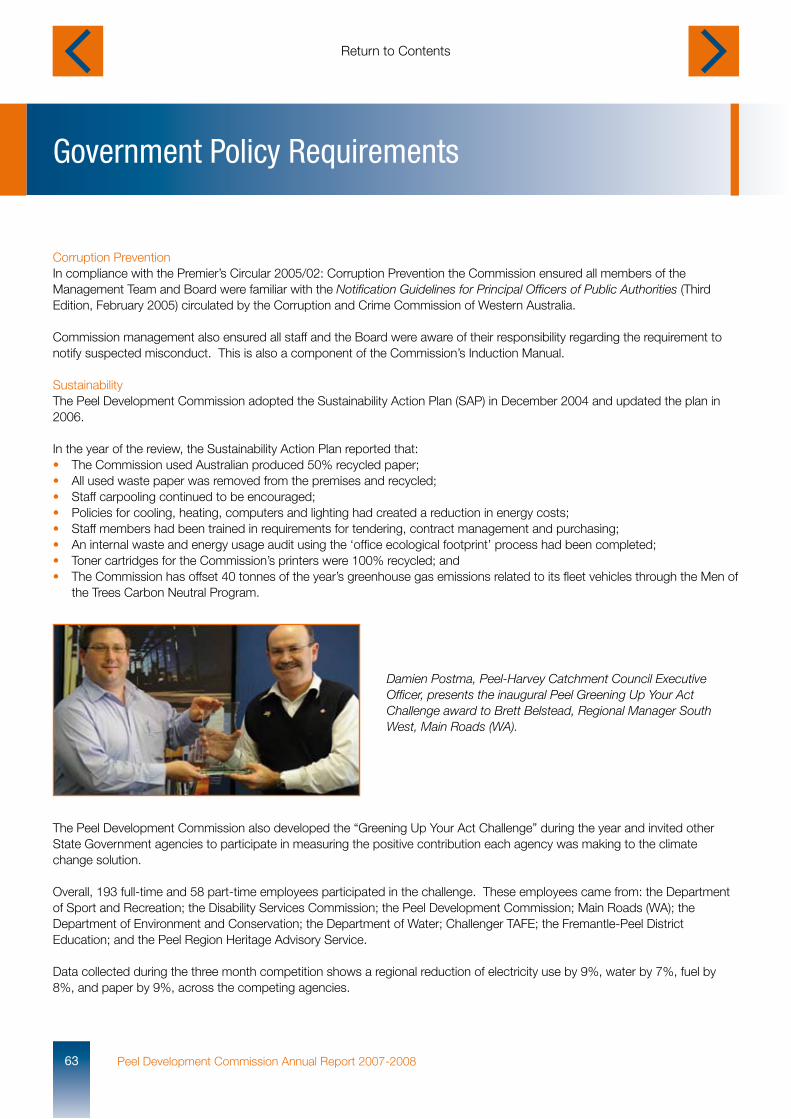
Government Policy Requirements
Peel Development Commission Annual Report 2007-200863
Corruption PreventionIn compliance with the Premier’s Circular 2005/02: Corruption Prevention the Commission ensured all members of the Management Team and Board were familiar with the Notification Guidelines for Principal Officers of Public Authorities (Third Edition, February 2005) circulated by the Corruption and Crime Commission of Western Australia.
Commission management also ensured all staff and the Board were aware of their responsibility regarding the requirement to notify suspected misconduct. This is also a component of the Commission’s Induction Manual.
SustainabilityThe Peel Development Commission adopted the Sustainability Action Plan (SAP) in December 2004 and updated the plan in 2006.
In the year of the review, the Sustainability Action Plan reported that: • The Commission used Australian produced 50% recycled paper;• All used waste paper was removed from the premises and recycled;• Staff carpooling continued to be encouraged;• Policies for cooling, heating, computers and lighting had created a reduction in energy costs;• Staff members had been trained in requirements for tendering, contract management and purchasing;• An internal waste and energy usage audit using the ‘office ecological footprint’ process had been completed;• Toner cartridges for the Commission’s printers were 100% recycled; and• The Commission has offset 40 tonnes of the year’s greenhouse gas emissions related to its fleet vehicles through the Men of the Trees Carbon Neutral Program.
The Peel Development Commission also developed the “Greening Up Your Act Challenge” during the year and invited other State Government agencies to participate in measuring the positive contribution each agency was making to the climate change solution.
Overall, 193 full-time and 58 part-time employees participated in the challenge. These employees came from: the Department of Sport and Recreation; the Disability Services Commission; the Peel Development Commission; Main Roads (WA); the Department of Environment and Conservation; the Department of Water; Challenger TAFE; the Fremantle-Peel District Education; and the Peel Region Heritage Advisory Service.
Data collected during the three month competition shows a regional reduction of electricity use by 9%, water by 7%, fuel by 8%, and paper by 9%, across the competing agencies.
Damien Postma, Peel-Harvey Catchment Council Executive Officer, presents the inaugural Peel Greening Up Your Act Challenge award to Brett Belstead, Regional Manager South West, Main Roads (WA).
Government Policy Requirements continued
64Peel Development Commission Annual Report 2007-2008
Occupational Safety & HealthIn compliance with the Premier’s Circular 2007/12: Code of Practice: Occupational Safety and Health in the Western Australian Public Sector, the Commission is required to report on occupational safety and health (OSH) performance in the year of review.
• The Peel Development Commission’s executive and employees work together to achieve a standard of excellence in occupational safety and health management in our own workplaces.
• Peel Development Commission does this by operating in accordance with occupational safety and health legislation, regulations and approved codes of practice, by making all employees and contractors aware of their OSH responsibilities through access to OSH information and training and by encouraging all staff to take leadership in OSH matters with a common view to improve OSH outcomes.
• Peel Development Commission is committed to assisting injured workers to return to work as soon as medically appropriate and will adhere to the requirements of the Workers’ Compensation and Injury Management Act 1981 in the event of a work related injury or illness. Management supports the injury management process and recognises that success relies on the active participation and cooperation of the injured worker. Whenever possible, suitable duties will be arranged internally having regard for the injured worker’s medical restrictions.
Report of Annual Performance for 2007/08
Indicator Actual Target
Number of fatalities Zero (0) Zero (0)
Lost time injury/diseases (LTI/D) incidence rate Zero (0) Zero (0)
Lost time injury severity rate Zero (0) Zero (0)
Publications
The following publications are available at www.peel.wa.gov.au :
1. Mandurah and Peel Business Survey (2007): A report on the findings of a major survey of business proprietors from Mandurah and the surrounding Shires of Serpentine Jarrahdale, Waroona, and Murray.
2. Peel Region Infrastructure Plan (2006): An analysis of identified infrastructure needs with recommendations on implementation across the Peel Region.
3. Peel Workforce Development Strategy (2006): A strategic document that addresses the supply of, and demand for, a labour force in the Peel Region.
4. Business and Lifestyle Opportunities in the Peel Region (2006): An informative document that explains the reasons why people choose to live and work in the Peel Region. Used for regional migration initiatives.
5. Peel Economic Perspective (2006): An overview of the economy, infrastructure and industries of the Peel Region.
6. Peel 2020 Sustainability Strategy (2006): The final report of the development of a sustainability strategy and vision for Peel Region.
7. The Development of Horticulture in the Peel Region (2004): A final report to determine the potential for the expansion of the Peel Region horticultural sector.
8. Peel Geographic Perspective (2003): Provides an easily understood profile of the geographic features of the Peel Region and their impact on its development.
9. Peel People and Population (2001): This publication provides in depth demographic information on the Peel Region.
Peel Development Commission Annual Report 2007-200865

Peel Development Commission45 Mandurah Terrace (PO Box 543) Mandurah WA 6210
Phone: (+61 8) 9535 0000Fax: (+61 8) 9535 2119
Web: www.peel.wa.gov.au