pedestrian activity in chicago’s downtown activity in chicago’s downtown prepared for chicago...
TRANSCRIPT
Pedestrian Activity in Chicago’s Downtown
prepared for Chicago Department of Transportation
by
TranSystems and
TransInfo LLC
December 2008
2
ABSTRACT................................................................................................................................... 5
CHAPTER I. INTRODUCTION................................................................................................ 6
CHAPTER II. DATA COLLECTION AND STUDY AREA ................................................... 7 LOOP ............................................................................................................................................ 7 DATA COLLECTION PERIOD ................................................................................................ 8 METHOD OF DATA COLLECTION........................................................................................ 8
CHAPTER III. PEDESTRIAN-TRAFFIC COUNTS............................................................. 10
THE LOOP................................................................................................................................ 10 THE BRIDGES ......................................................................................................................... 18 NORTH MICHIGAN AVENUE – (NORTH OF THE RIVER) ...................................................... 22 STATE STREET....................................................................................................................... 31 PEDWAY.................................................................................................................................. 38 RIVER NORTH ........................................................................................................................ 39 WEST LOOP............................................................................................................................. 47 MICHIGAN AVENUE SOUTH OF CONGRESS ................................................................... 50
CHAPTER IV. SUMMARY AND CONCLUSIONS ............................................................. 51 MAJOR PEDESTRIAN-COUNT FINDINGS ......................................................................... 51 BIBLIOGRAPHY..................................................................................................................... 53
APPENDIX A .............................................................................................................................. 54 REASONS WHY PEDESTRIAN TRAFFIC INCREASES AND DECREASES ........................................... 54 PLACES NOT COUNTED............................................................................................................... 55 CONSTRUCTION.......................................................................................................................... 55
3
LIST OF FIGURES
1. 2007 Loop Weekday Pedestrian Counts. . . . . . . . . . . . . . . . . . . . . . . . . . . . . . . . . .. . . .11 2. South Side of the Adams Street Bridge at Union Station. . . . . . . . . . . . . . . . . . . . . .. . . .12 3. North Side of Madison Street between Clark and Dearborn Streets . . . . . . . . . . . . .. . . .13 4. East Side of Clark Street between Washington and Madison. . . . . . . . . . . . . . . . . . . . . . 13 5. East Side of State Street between Washington and Madison. . . . . . . . . . . . . . . . . . . . . . . 14 6. East Side of North Michigan Avenue between Huron and Superior. . . . . . . . . . . . . . . . . 15 7. 1999 and 2007 Aggregate Loop Counts by 15-minute Intervals. . . . . . . . . . . . . . . . . . . . 17 8. Ratio of Aggregate Loop 2007 Counts to the 1999 Counts by 15-minute Intervals. . . . 18 9. Aggregate Bridge Traffic Proportion of Daily Total 1999 and 2007 . . . . . . . . . . . . . . . 21 10. Comparison of Pedestrian Traffic on Chicago River Bridges, 2007. . . . . . . . . . . . . . . . . 22 11. 1999/2007 North Michigan Avenue Weekday Counts. . . . . . . . . . . . . . . . . . . . . . . . . . . 25 12. Comparison of Weekday 1999 and 2007 Michigan Avenue Totals. . . . . . . . . . . . . . . . . 27 13. 1999/2007 North Michigan Avenue Saturday Counts . . . . . . . . . . . . . . . . . . . . . . . . . . . 28 14. Comparison of Aggregate Michigan Avenue 2007 Weekday and Saturday Counts. . . . . 30 15. Growth in North Michigan Avenue Pedestrian Traffic, 1986 to 2007. . . . . . . . . . . . . . . 31 16. 2007 State Street Weekday Counts. . . . . . . . . . . . . . . . . . . . . . . . . . . . . . . . . . . . . . . . . . 33 17. 2007 State Street Saturday Counts. . . . . . . . . . . . . . . . . . . . . . . . . . . . . . . . . . . . . . . . . . . 34 18. Comparison of 1999 and 2007 Saturday Totals. . . . . . . . . . . . . . . . . . . . . . . . . . . . . . . . . 35 19. Proportion of the Nine-hour Saturday Total During each 15-minute Period. . . . . . . . . . . 36 20. Comparison of Aggregate State Street 2007 Weekdays and Saturdays . . . . . . . . . . . . . 37 21. 2007 Pedway Weekday Counts. . . . . . . . . . . . . . . . . . . . . . . . . . . . . . . . . . . . . . . . . . . . . 39 22. River North and Streeterville Weekday Counts. . . . . . . . . . . . . . . . . . . . . . . . . . . . . . . . .40 23. 1999 and 2007 Counts Summer for 58 Sites Counted in Both Years. . . . . . . . . . . . . . . . 41 24. Ratio of 2007 and 1999 Data by 15-minute Intervals. . . . . . . . . . . . . . . . . . . . . . . . . . . . 42 25. River North Corner Counts. . . . . . . . . . . . . . . . . . . . . . . . . . . . . . . . . . . . . . . . . . . . . . . . 44 26. Comparison of 1999 and 2007 Corner Counts in River North. . . . . . . . . . . . . . . . . . . . . 45 27. 1999 / 2007 River North PM Counts. . . . . . . . . . . . . . . . . . . . . . . . . . . . . . . . . . . . . . . . . 46 28. Comparison of 1999 and 2007 Afternoon/Evening Counts in River North. . . . . . . . . . . 47 29. West Loop Pedestrian Counts. . . . . . . . . . . . . . . . . . . . . . . . . . . . . . . . . . . . . . . . . . . . . . 48 30. South Michigan Avenue Weekday Counts. . . . . . . . . . . . . . . . . . . . . . . . . . . . . . . . . . . . 50 A.1 Loop Construction Zones. . . . . . . . . . . . . . . . . . . . . . . . . . . . . . . . . . . . . . . . . . . . . . . . . 58 A.2 River North Construction Zones. . . . . . . . . . . . . . . . . . . . . . . . . . . . . . . . . . . . . . . . . . . . 59 A.3 Block Face Identification Numbers . . . . . . . . . . . . . . . . . . . . . . . . . . . . . . . . . . . . . . . . 60 A.4 River North Block Identification Numbers. . . . . . . . . . . . . . . . . . . . . . . . . . . . . . . . . . 61
4
LIST OF TABLES
1. Count Sites in the 2007 Study. . . . . . . . . . . . . . . . . . . . . . . . . . . . . . . . . . . . . . . . . . . . . . . . . .7 2. Changes in the Loop Pedestrian Traffic by Five Time Periods . . . . . . . . . . . . . . . . . . . . . . .16 3. Weekday Pedestrian Traffic Across the Chicago River . . . . . . . . . . . . . . . . . . . . . . . . . . . . .19 4. Weekday Pedestrian Traffic Across the South Branch of the Chicago River. . . . . . . . . . . . .20 5. Weekday Pedestrian Counts on North Michigan Avenue 1986 to 2007 . . . . . . . . . . . . . . . .26 6. Saturday Pedestrian Counts on North Michigan Avenue 1986 to 2007. . . . . . . . . . . . . . . . .29 7. Effects of Heavy Rain and Sunny Weather on Pedway Traffic . . . . . . . . . . . . . . . . . . . . . . .38
LIST OF PHOTOGRAPHS
1. Data-collection Supplies and Equipment. . . . . . . . . . . . . . . . . . . . . . . . . . . . . . . . . . . . . . 9 2. Park in Front of 311 South Wacker during lunch . . . . . . . . . . . . . . . . . . . . . . . . . . . . . . 17 3. Pedestrian Traffic on the north side of the Madison Street Bridge. . . . . . . . . . . . . . . . . 19 4. Street Entertainment and Pedestrian Traffic on Michigan Avenue. . . . . . . . . . . . . . . . . .23 5. Scaffolding on State Street. . . . . . . . . . . . . . . . . . . . . . . . . . . . . . . . . . . . . . . . . . . . . . . . .32 6. Evening Traffic on State Street. . . . . . . . . . . . . . . . . . . . . . . . . . . . . . . . . . . . . . . . . . . . . 37 7. Pedestrians Clustering in Front of Union Station. . . . . . . . . . . . . . . . . . . . . . . . . . . . . . . 49 8. Sidewalks between Ogilvie and Union Stations. . . . . . . . . . . . . . . . . . . . . . . . . . . . . . . . 49
A.1 Pedestrians in an alley located in the Loop. . . . . . . . . . . . . . . . . . . . . . . . . . . . . . . . . . . 56 A.2 Platooning on the South Side of Madison Street between State and Dearborn Streets . .56
5
ABSTRACT
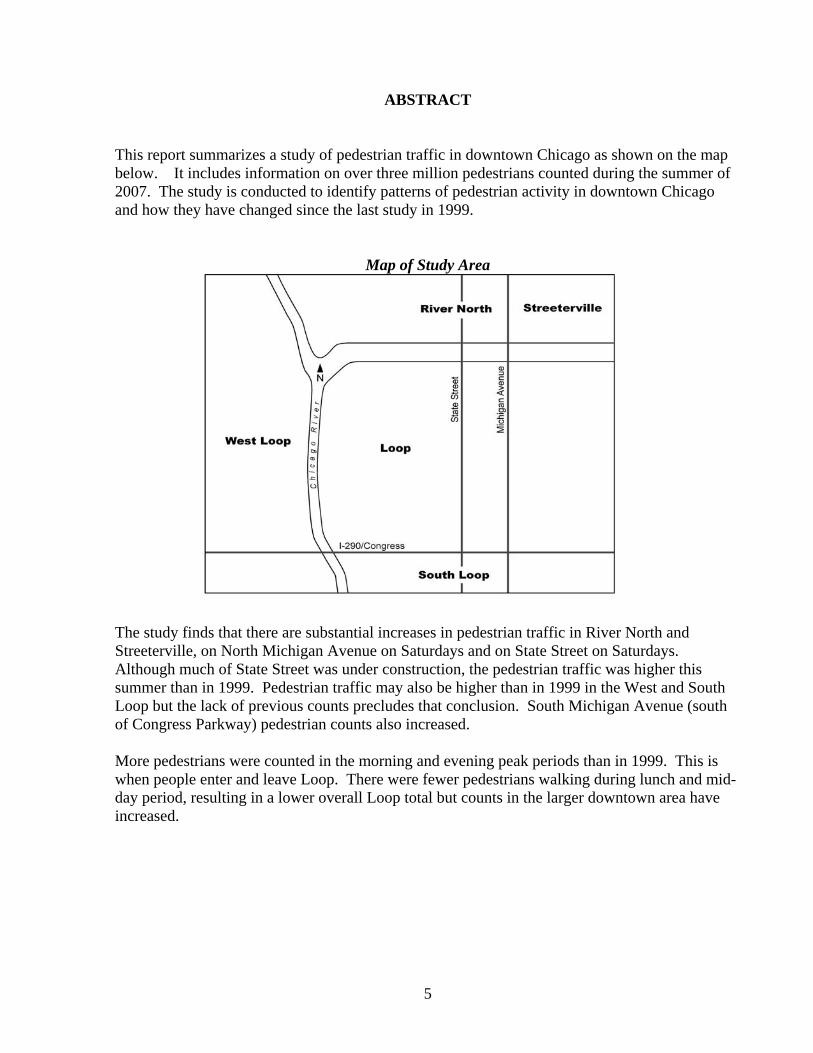
This report summarizes a study of pedestrian traffic in downtown Chicago as shown on the map below. It includes information on over three million pedestrians counted during the summer of 2007. The study is conducted to identify patterns of pedestrian activity in downtown Chicago and how they have changed since the last study in 1999.
Map of Study Area
The study finds that there are substantial increases in pedestrian traffic in River North and Streeterville, on North Michigan Avenue on Saturdays and on State Street on Saturdays. Although much of State Street was under construction, the pedestrian traffic was higher this summer than in 1999. Pedestrian traffic may also be higher than in 1999 in the West and South Loop but the lack of previous counts precludes that conclusion. South Michigan Avenue (south of Congress Parkway) pedestrian counts also increased. More pedestrians were counted in the morning and evening peak periods than in 1999. This is when people enter and leave Loop. There were fewer pedestrians walking during lunch and mid-day period, resulting in a lower overall Loop total but counts in the larger downtown area have increased.
6
CHAPTER I. INTRODUCTION
This report describes the 2007 count of downtown pedestrians. It includes over three million pedestrians counted at 510 locations. The study area includes nearly all possible sites in the Loop and along North Michigan Avenue as, eighty sites throughout River North and Streeterville, plus a dozen sites in the West Loop and South Loop. The purpose of the study is to document pedestrian activity in downtown Chicago and to determine how pedestrian traffic has changed since the last study conducted in 1999. With slight modifications, this study replicates the 1981, 1989 and 1999 counts in which we counted pedestrians at over 300 sites. As in the previous three studies, the counting occurred during the summer months on days without rain. Downtown Chicago is a dynamic area with dramatic pedestrian traffic increases in many areas and modest decreases in others. The areas north of the Chicago River continue to show growth. Pedestrian traffic on North Michigan Avenue has also grown, particularly on Saturdays, but River North shows stronger growth on weekdays. For over a decade the highest pedestrian traffic in the greater downtown area has been on North Michigan Avenue on Saturday. The 43,000 pedestrians counted on Saturday north of the Water Tower is comparable to the highest volumes on Fifth Avenue in New York and far exceeds the 36,000 pedestrians recorded weekdays on State Street in 1981, the highest count in the 1981 study. These and other findings as well as the method used are summarized in this report. The report is organized into four chapters. Chapter 1 is the introduction and Chapter 2 describes the data collection methodology and geographic scope of the study area. Chapter 3 interprets the pedestrian counts by area, starting with the Loop, followed by sections on North Michigan Avenue, State Street, the Pedway, River North-Streeterville, and South Michigan Avenue. Chapter 4 summarizes the general findings. Appendix A follows with additional discussion and several maps. There are also separate computer files (spreadsheets) of the data collected and a graph of each count site. The graphs show the forty 15-minutes counts that make up the 10-hour count periods as well as the data collected at that location in 1999, when available.
7
CHAPTER II. DATA COLLECTION AND STUDY AREA
PEDESTRIAN-COUNT LOCATIONS
The study includes pedestrian counts at 510 locations (Table 1). Most of these are weekday counts, but counts were conducted on Saturday at all sites on Michigan Avenue and many locations on State Street as well.
Table 1 Count Sites in the 2007 Study
Number of sites
335 Loop (Figure 1) 25 North Michigan Avenue 82 River North and Streeterville 16 River North (Afternoon/evening) 16 River North (corner counts) 8 Pedway Network 11 State Street* (included in the Loop 335 count) 13 West Loop 6 Michigan Avenue south of Congress 9 South Loop
510 Total 10-hour Sites Counted 24 North Michigan Avenue—Saturday 11 State Street – Saturday
545* Total Count Days *Eleven State Street sites were counted for 12 hours, Saturdays were counted for nine hours
Loop All of the active sidewalks in the Loop were counted. The Loop is generally defined here as the Chicago River on the north and west, Congress Parkway on the south and Michigan Avenue on the east. All bridges are included in the Loop data. Several but not all of the possible sites on the east side of Michigan Avenue were counted. There were also a few sites in the Illinois Center area, east of Michigan Avenue and south of Congress Parkway that were counted and included in the discussion of the Loop.
8
River North and Streeterville
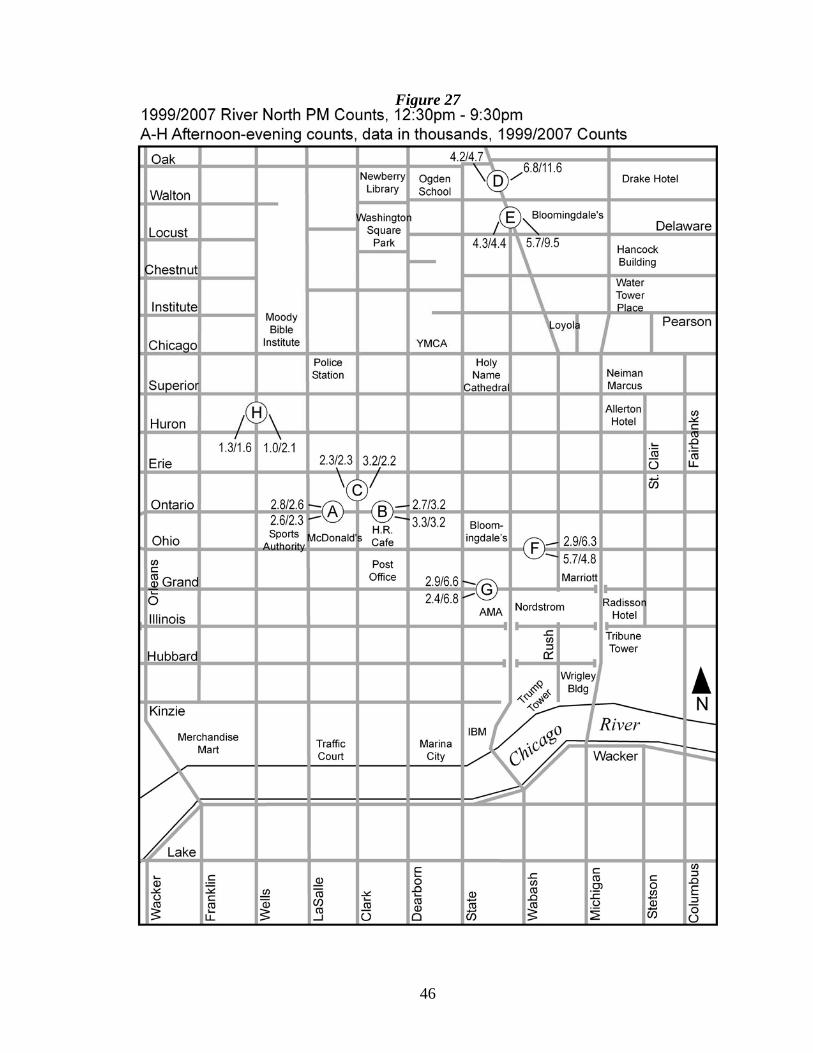
River North is the area north of the Chicago River. The east, north and west boundaries are not precise but generally follow Michigan Avenue, Oak Street and Orleans Street respectively. In the discussion below, the Streeterville sites east of North Michigan Avenue are found in the section titled River North and Streeterville. We used three approaches for counting River North. First, eight corner counts provide data that permit comparisons with the 1989 and 1999 study (eight intersections with two sites each). Second, there are sixteen afternoon/evening count sites (12:30 p.m. to 9:30 p.m.) on Ontario, Clark and Rush Streets. These are labeled A – H on Figure 27. Third, there are eighty-two 10-hour count sites throughout the rest of River North and Streeterville. Pedway
The Pedway has been under construction for various periods over the last several decades. The Metra Electric Station, Millennium Park, Millennium Park Tower and now the Pedway under Block 37 (between Macy’s and Daley Plaza) required closures of the Randolph Street Pedway. These disruptions make comparisons difficult and have forced several changes in the number and locations of Pedway sites counted. DATA COLLECTION PERIOD
The work commenced on June 11, 2007. All data collection ended before Labor Day weekend. We cancelled data collection on several unusually hot days and all days with rain. The Pedway section in Chapter III has a discussion of the effects of weather on pedestrian counts. As in the three previous pedestrian studies, 1981, 1989 and 1999, weekday counts cover a 10-hour period from 7:45 a.m. to 5:45 p.m. Saturday counts start at 9:00 a.m. and end at 6:00 p.m., for a nine-hour day. Many weekday State Street counts were extended to twelve hours from 7:45 a.m. to 7:45 p.m. At many other locations extending the count period would result in substantially higher volumes but would also complicate comparisons with earlier studies. METHOD OF DATA COLLECTION On a typical day, twelve to fifteen counters and two field supervisors were employed. The field supervisors performed three tasks: verified that counters were in their proper locations, provided covert count checks and provided relief for counters during breaks. The data collection methodology in 2007 duplicated that used in 1981, 1989 and 1999. Counters were positioned in mid-block locations and tallied pedestrians crossing an imaginary line between the building and a point in the middle of the street. They counted pedestrians walking in either
9
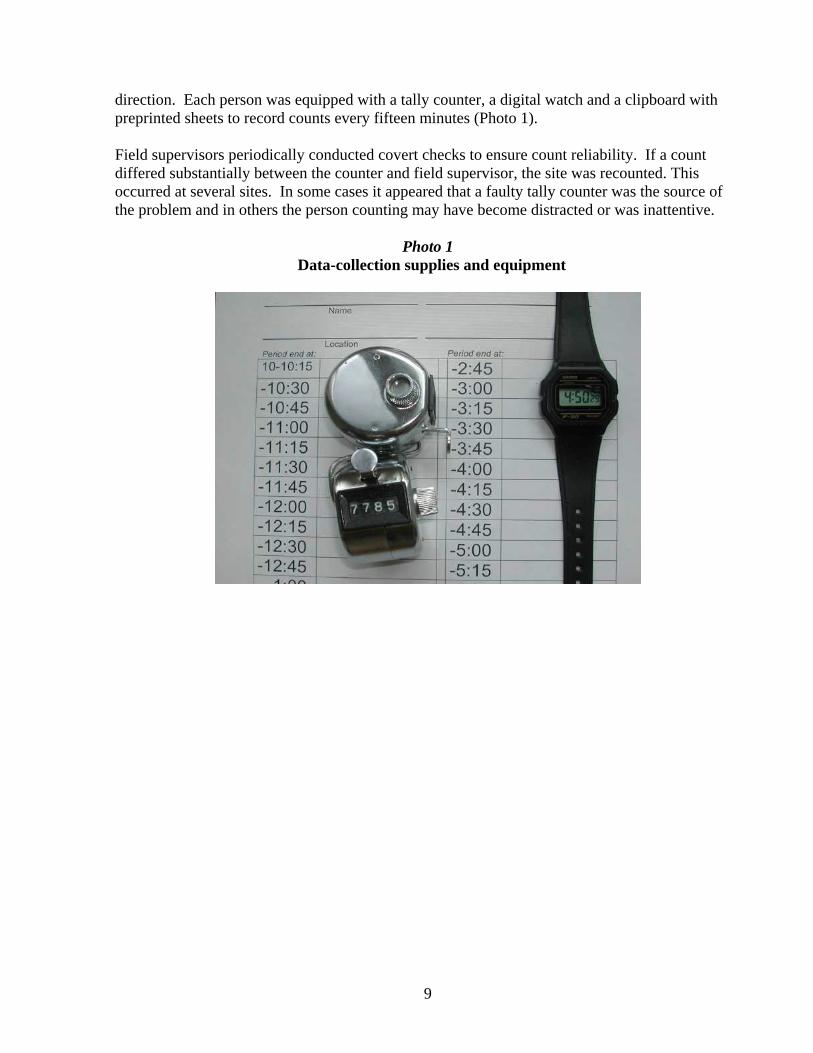
direction. Each person was equipped with a tally counter, a digital watch and a clipboard with preprinted sheets to record counts every fifteen minutes (Photo 1). Field supervisors periodically conducted covert checks to ensure count reliability. If a count differed substantially between the counter and field supervisor, the site was recounted. This occurred at several sites. In some cases it appeared that a faulty tally counter was the source of the problem and in others the person counting may have become distracted or was inattentive.
Photo 1 Data-collection supplies and equipment
10
CHAPTER III. PEDESTRIAN-TRAFFIC COUNTS
As in previous studies the survey team counted the entire Loop area and Michigan Avenue north of the Chicago River. The latter area is identified throughout this report as North Michigan Avenue. In this study, however, the number of count sites increased substantially in River North and Streeterville. New sites were also added south of Congress Parkway and west of the Chicago River (West Loop). THE LOOP Weekday 10-Hour Counts
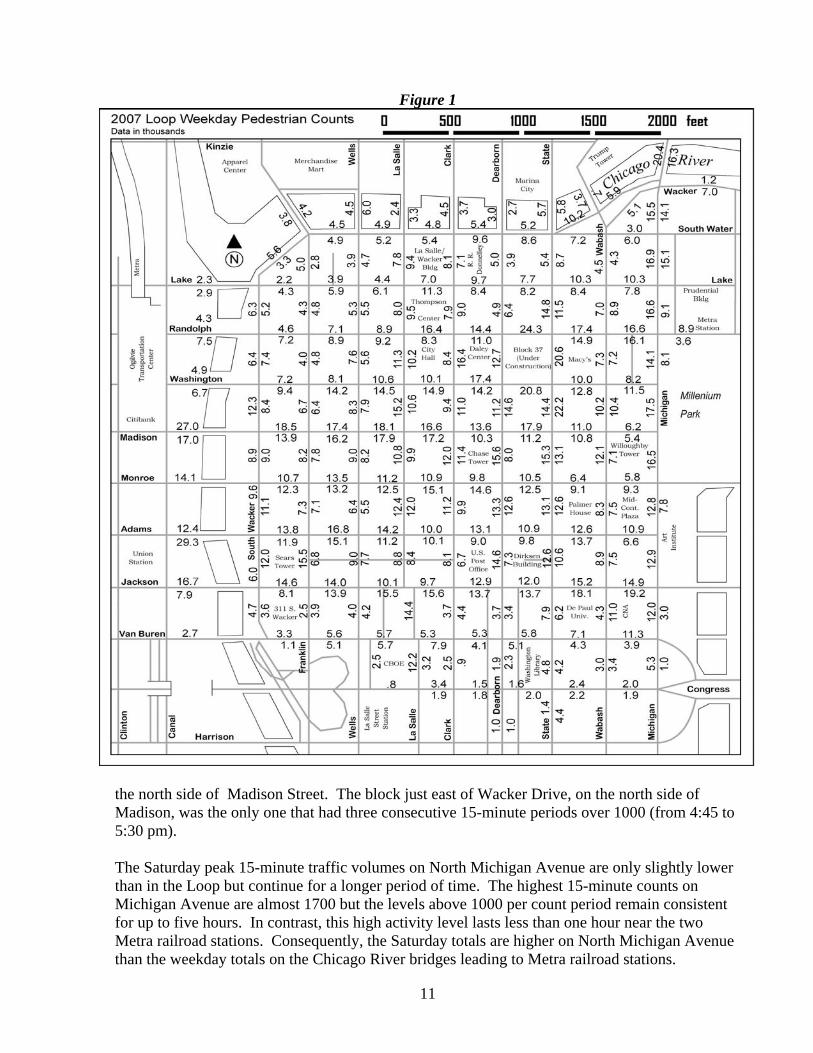
The Loop has approximately 335 count locations (Figure 1). This includes all of the bridges across the Chicago River and all block faces north of Congress Parkway. The new sites not counted in 1999 include several sites on the Millennium Park (east) side of Michigan Avenue and in the Illinois Center area (on Wacker Drive and Randolph Street) as well as both sides of Congress Parkway. Most of these locations exhibit 10-hour pedestrian counts from 5,000 to 20,000. The highest counts are associated with access routes to and from the Loop. The highest count, 29,000 was on the south side of the Adams Street bridge at Union Station followed by the 27,000 pedestrians that crossed the north side of Madison Street bridge leading to Metra’s Ogilvie Transportation Center (Metra station). Counters recorded more than 20,000 pedestrians at several other locations including the sidewalks on State Street, Randolph Street and Washington Street across from the construction on Block 37, on State Street just south of Macy’s and on the west side of the Michigan Avenue bridge across the Chicago River. In the core of the Loop most of the block faces have counts over 10,000. Much lower traffic volumes occur in the northern part of the Loop near Lake and Wacker. The lowest counts are in the south part of the Loop near Van Buren and Congress Parkway, with the exception of the LaSalle Street Metra Station area. Highest 15-minute Pedestrian Counts
The most intense short-term pedestrian traffic, as well as the highest 10-hour totals, exists on two bridges across the South Branch of the Chicago River, one near Union Station and the other near Ogilvie Transportation Center. The highest 15-minute counts were on the south side of the Adams Street bridge and the north side of the Madison Street bridge between 5:00 and 5:15 p.m. The former site reached 2200 pedestrians during the peak 15-minute period. The north side of the Madison Street bridge only reached 1,800 during its peak period. The west side of LaSalle Street between Congress Parkway and Van Buren Street at the LaSalle Street Metra station, also has two 15-minute periods in the morning that exceed 1000 pedestrians. Within the Loop there are a half-dozen sites that exceeded 1,000 pedestrians per 15-minute period. Each of these sites reached this intensity during the 5:00 to 5:15 p.m. period. All but one is located near the Amtrak and commuter rail stations (Ogilvie and Union Station); three were on
11
Figure 1
the north side of Madison Street. The block just east of Wacker Drive, on the north side of Madison, was the only one that had three consecutive 15-minute periods over 1000 (from 4:45 to 5:30 pm). The Saturday peak 15-minute traffic volumes on North Michigan Avenue are only slightly lower than in the Loop but continue for a longer period of time. The highest 15-minute counts on Michigan Avenue are almost 1700 but the levels above 1000 per count period remain consistent for up to five hours. In contrast, this high activity level lasts less than one hour near the two Metra railroad stations. Consequently, the Saturday totals are higher on North Michigan Avenue than the weekday totals on the Chicago River bridges leading to Metra railroad stations.
12
Block-Face Signatures (Profiles)
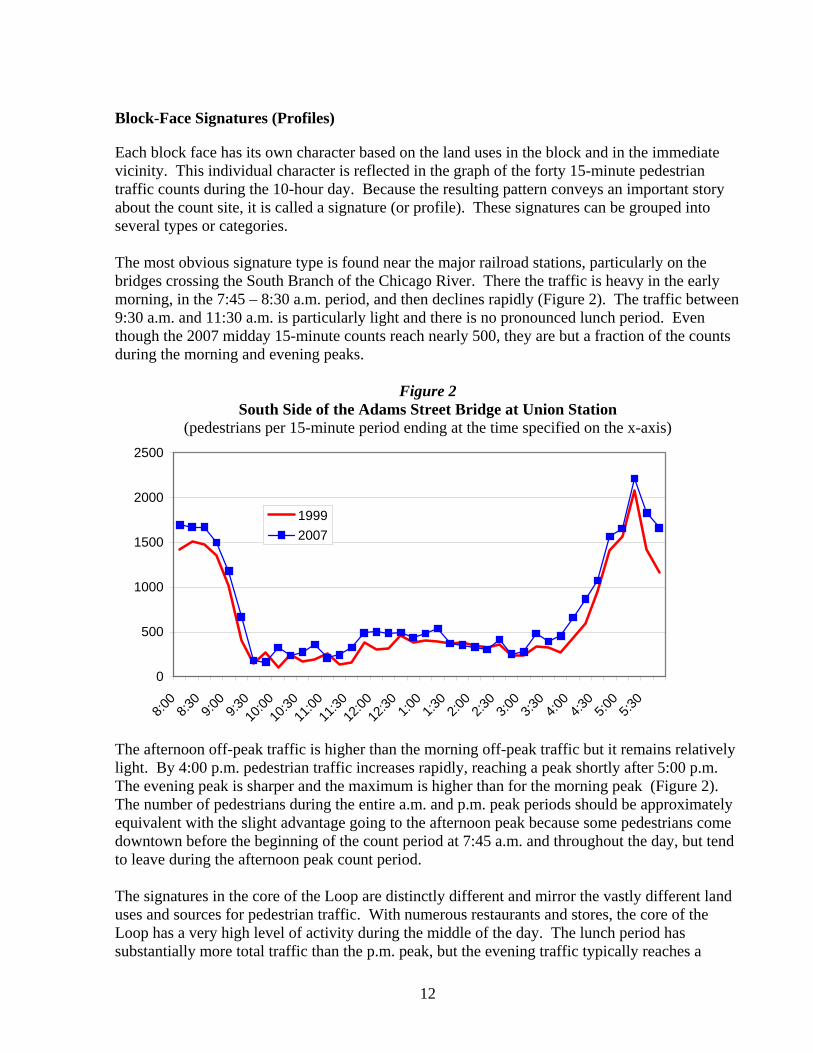
Each block face has its own character based on the land uses in the block and in the immediate vicinity. This individual character is reflected in the graph of the forty 15-minute pedestrian traffic counts during the 10-hour day. Because the resulting pattern conveys an important story about the count site, it is called a signature (or profile). These signatures can be grouped into several types or categories. The most obvious signature type is found near the major railroad stations, particularly on the bridges crossing the South Branch of the Chicago River. There the traffic is heavy in the early morning, in the 7:45 – 8:30 a.m. period, and then declines rapidly (Figure 2). The traffic between 9:30 a.m. and 11:30 a.m. is particularly light and there is no pronounced lunch period. Even though the 2007 midday 15-minute counts reach nearly 500, they are but a fraction of the counts during the morning and evening peaks.
Figure 2 South Side of the Adams Street Bridge at Union Station
(pedestrians per 15-minute period ending at the time specified on the x-axis)
0
500
1000
1500
2000
2500
8:00
8:30
9:00
9:3010
:0010
:3011
:0011
:3012
:0012
:30 1:00
1:30
2:00
2:30
3:00
3:30
4:00
4:30
5:00
5:30
19992007
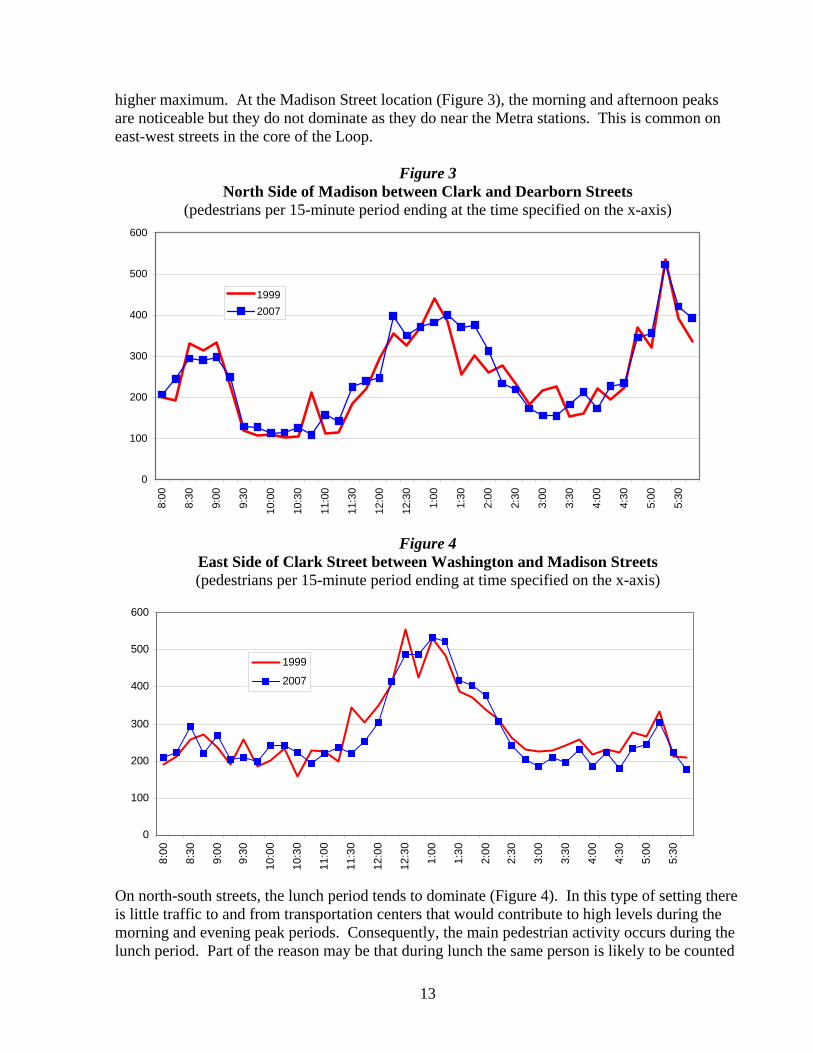
The afternoon off-peak traffic is higher than the morning off-peak traffic but it remains relatively light. By 4:00 p.m. pedestrian traffic increases rapidly, reaching a peak shortly after 5:00 p.m. The evening peak is sharper and the maximum is higher than for the morning peak (Figure 2). The number of pedestrians during the entire a.m. and p.m. peak periods should be approximately equivalent with the slight advantage going to the afternoon peak because some pedestrians come downtown before the beginning of the count period at 7:45 a.m. and throughout the day, but tend to leave during the afternoon peak count period. The signatures in the core of the Loop are distinctly different and mirror the vastly different land uses and sources for pedestrian traffic. With numerous restaurants and stores, the core of the Loop has a very high level of activity during the middle of the day. The lunch period has substantially more total traffic than the p.m. peak, but the evening traffic typically reaches a
13
higher maximum. At the Madison Street location (Figure 3), the morning and afternoon peaks are noticeable but they do not dominate as they do near the Metra stations. This is common on east-west streets in the core of the Loop.
Figure 3 North Side of Madison between Clark and Dearborn Streets
(pedestrians per 15-minute period ending at the time specified on the x-axis)
0
100
200
300
400
500
600
8:00
8:30
9:00
9:30
10:0
0
10:3
0
11:0
0
11:3
0
12:0
0
12:3
0
1:00
1:30
2:00
2:30
3:00
3:30
4:00
4:30
5:00
5:30
19992007
Figure 4 East Side of Clark Street between Washington and Madison Streets (pedestrians per 15-minute period ending at time specified on the x-axis)
0
100
200
300
400
500
600
8:00
8:30
9:00
9:30
10:0
0
10:3
0
11:0
0
11:3
0
12:0
0
12:3
0
1:00
1:30
2:00
2:30
3:00
3:30
4:00
4:30
5:00
5:30
1999
2007
On north-south streets, the lunch period tends to dominate (Figure 4). In this type of setting there is little traffic to and from transportation centers that would contribute to high levels during the morning and evening peak periods. Consequently, the main pedestrian activity occurs during the lunch period. Part of the reason may be that during lunch the same person is likely to be counted
14
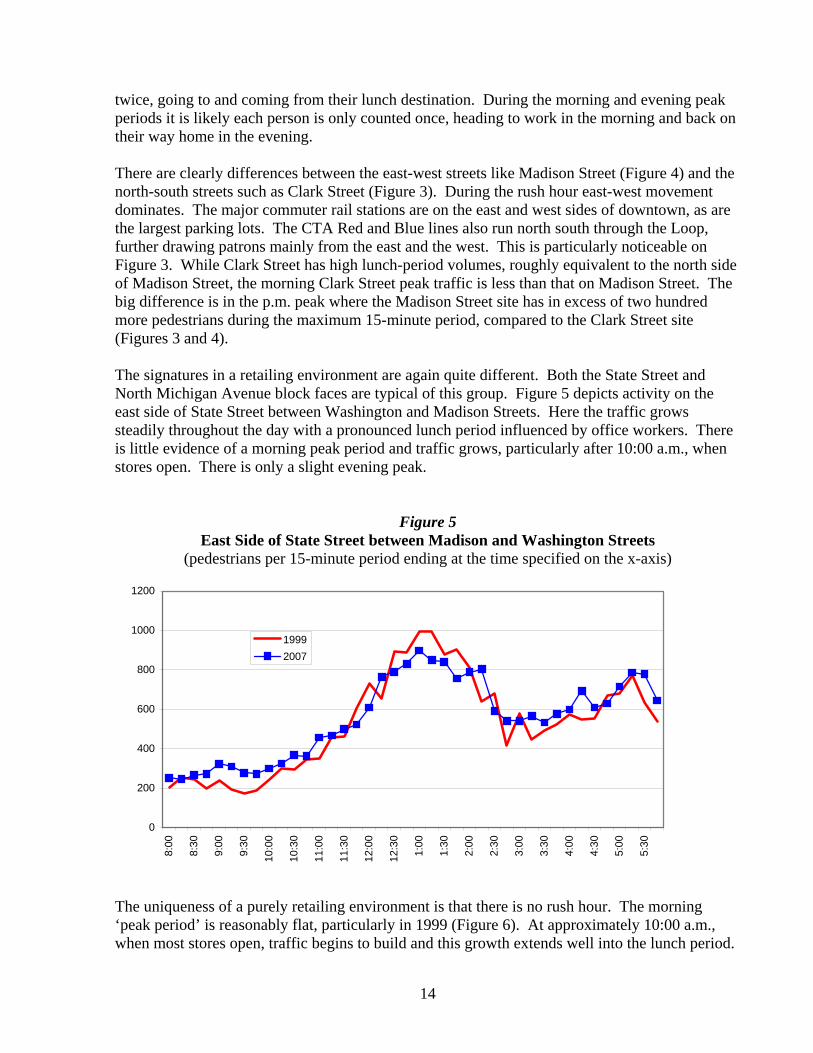
twice, going to and coming from their lunch destination. During the morning and evening peak periods it is likely each person is only counted once, heading to work in the morning and back on their way home in the evening. There are clearly differences between the east-west streets like Madison Street (Figure 4) and the north-south streets such as Clark Street (Figure 3). During the rush hour east-west movement dominates. The major commuter rail stations are on the east and west sides of downtown, as are the largest parking lots. The CTA Red and Blue lines also run north south through the Loop, further drawing patrons mainly from the east and the west. This is particularly noticeable on Figure 3. While Clark Street has high lunch-period volumes, roughly equivalent to the north side of Madison Street, the morning Clark Street peak traffic is less than that on Madison Street. The big difference is in the p.m. peak where the Madison Street site has in excess of two hundred more pedestrians during the maximum 15-minute period, compared to the Clark Street site (Figures 3 and 4). The signatures in a retailing environment are again quite different. Both the State Street and North Michigan Avenue block faces are typical of this group. Figure 5 depicts activity on the east side of State Street between Washington and Madison Streets. Here the traffic grows steadily throughout the day with a pronounced lunch period influenced by office workers. There is little evidence of a morning peak period and traffic grows, particularly after 10:00 a.m., when stores open. There is only a slight evening peak.
Figure 5 East Side of State Street between Madison and Washington Streets
(pedestrians per 15-minute period ending at the time specified on the x-axis)
0
200
400
600
800
1000
1200
8:00
8:30
9:00
9:30
10:0
0
10:3
0
11:0
0
11:3
0
12:0
0
12:3
0
1:00
1:30
2:00
2:30
3:00
3:30
4:00
4:30
5:00
5:30
19992007
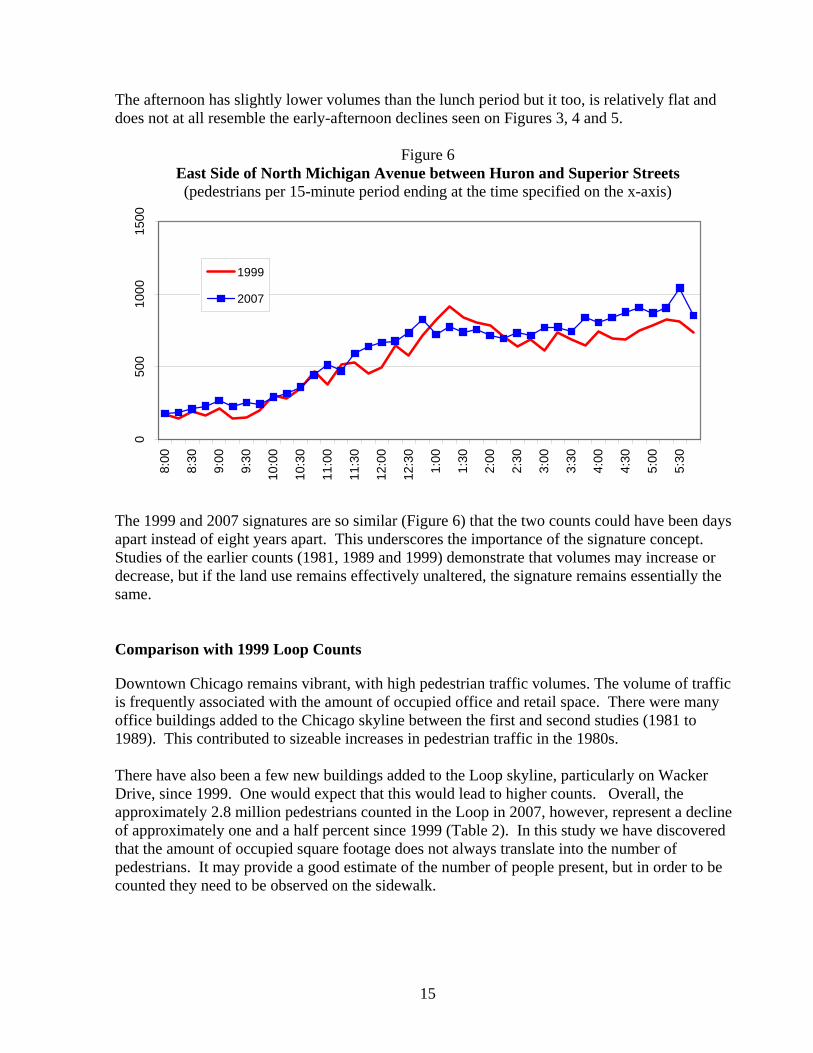
The uniqueness of a purely retailing environment is that there is no rush hour. The morning ‘peak period’ is reasonably flat, particularly in 1999 (Figure 6). At approximately 10:00 a.m., when most stores open, traffic begins to build and this growth extends well into the lunch period.
15
The afternoon has slightly lower volumes than the lunch period but it too, is relatively flat and does not at all resemble the early-afternoon declines seen on Figures 3, 4 and 5.
Figure 6 East Side of North Michigan Avenue between Huron and Superior Streets (pedestrians per 15-minute period ending at the time specified on the x-axis)
050
010
0015
00
8:00
8:30
9:00
9:30
10:0
0
10:3
0
11:0
0
11:3
0
12:0
0
12:3
0
1:00
1:30
2:00
2:30
3:00
3:30
4:00
4:30
5:00
5:30
1999
2007
The 1999 and 2007 signatures are so similar (Figure 6) that the two counts could have been days apart instead of eight years apart. This underscores the importance of the signature concept. Studies of the earlier counts (1981, 1989 and 1999) demonstrate that volumes may increase or decrease, but if the land use remains effectively unaltered, the signature remains essentially the same. Comparison with 1999 Loop Counts
Downtown Chicago remains vibrant, with high pedestrian traffic volumes. The volume of traffic is frequently associated with the amount of occupied office and retail space. There were many office buildings added to the Chicago skyline between the first and second studies (1981 to 1989). This contributed to sizeable increases in pedestrian traffic in the 1980s. There have also been a few new buildings added to the Loop skyline, particularly on Wacker Drive, since 1999. One would expect that this would lead to higher counts. Overall, the approximately 2.8 million pedestrians counted in the Loop in 2007, however, represent a decline of approximately one and a half percent since 1999 (Table 2). In this study we have discovered that the amount of occupied square footage does not always translate into the number of pedestrians. It may provide a good estimate of the number of people present, but in order to be counted they need to be observed on the sidewalk.
16
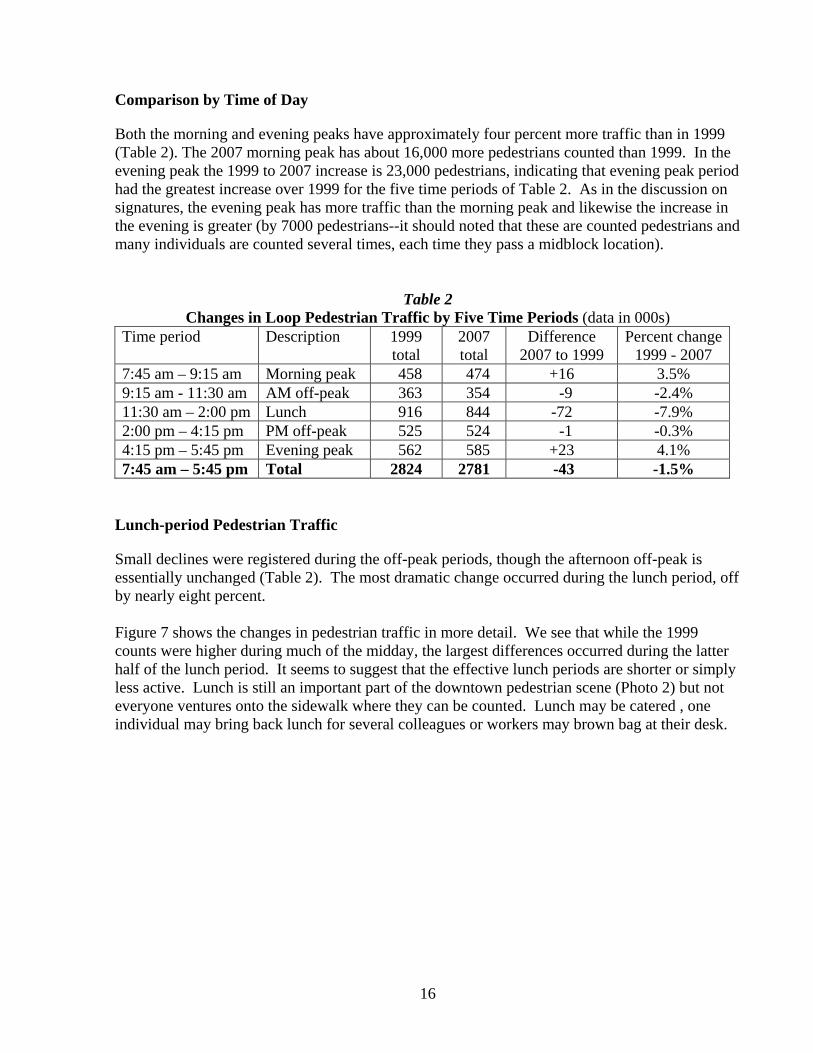
Comparison by Time of Day
Both the morning and evening peaks have approximately four percent more traffic than in 1999 (Table 2). The 2007 morning peak has about 16,000 more pedestrians counted than 1999. In the evening peak the 1999 to 2007 increase is 23,000 pedestrians, indicating that evening peak period had the greatest increase over 1999 for the five time periods of Table 2. As in the discussion on signatures, the evening peak has more traffic than the morning peak and likewise the increase in the evening is greater (by 7000 pedestrians--it should noted that these are counted pedestrians and many individuals are counted several times, each time they pass a midblock location).
Table 2 Changes in Loop Pedestrian Traffic by Five Time Periods (data in 000s)
Time period Description 1999 total
2007 total
Difference 2007 to 1999
Percent change 1999 - 2007
7:45 am – 9:15 am Morning peak 458 474 +16 3.5% 9:15 am - 11:30 am AM off-peak 363 354 -9 -2.4% 11:30 am – 2:00 pm Lunch 916 844 -72 -7.9% 2:00 pm – 4:15 pm PM off-peak 525 524 -1 -0.3% 4:15 pm – 5:45 pm Evening peak 562 585 +23 4.1% 7:45 am – 5:45 pm Total 2824 2781 -43 -1.5%
Lunch-period Pedestrian Traffic
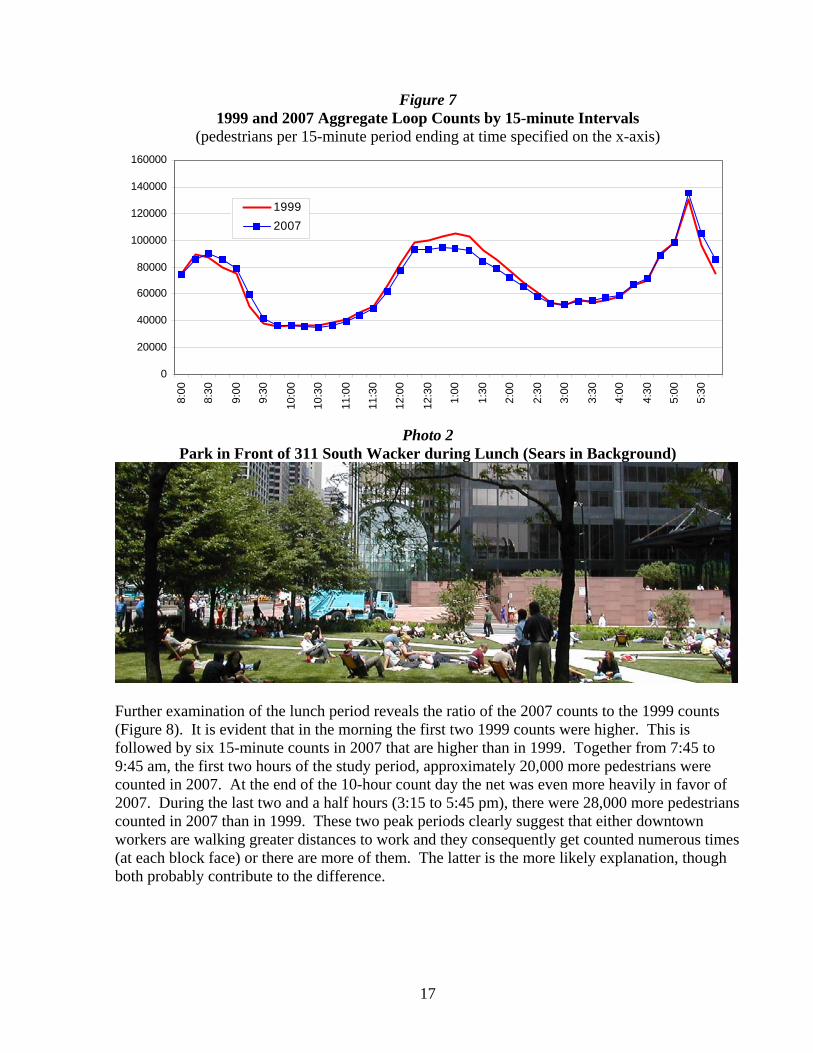
Small declines were registered during the off-peak periods, though the afternoon off-peak is essentially unchanged (Table 2). The most dramatic change occurred during the lunch period, off by nearly eight percent. Figure 7 shows the changes in pedestrian traffic in more detail. We see that while the 1999 counts were higher during much of the midday, the largest differences occurred during the latter half of the lunch period. It seems to suggest that the effective lunch periods are shorter or simply less active. Lunch is still an important part of the downtown pedestrian scene (Photo 2) but not everyone ventures onto the sidewalk where they can be counted. Lunch may be catered , one individual may bring back lunch for several colleagues or workers may brown bag at their desk.
17
Figure 7 1999 and 2007 Aggregate Loop Counts by 15-minute Intervals
(pedestrians per 15-minute period ending at time specified on the x-axis)
0
20000
40000
60000
80000
100000
120000
140000
160000
8:00
8:30
9:00
9:30
10:0
0
10:3
0
11:0
0
11:3
0
12:0
0
12:3
0
1:00
1:30
2:00
2:30
3:00
3:30
4:00
4:30
5:00
5:30
19992007
Photo 2
Park in Front of 311 South Wacker during Lunch (Sears in Background)
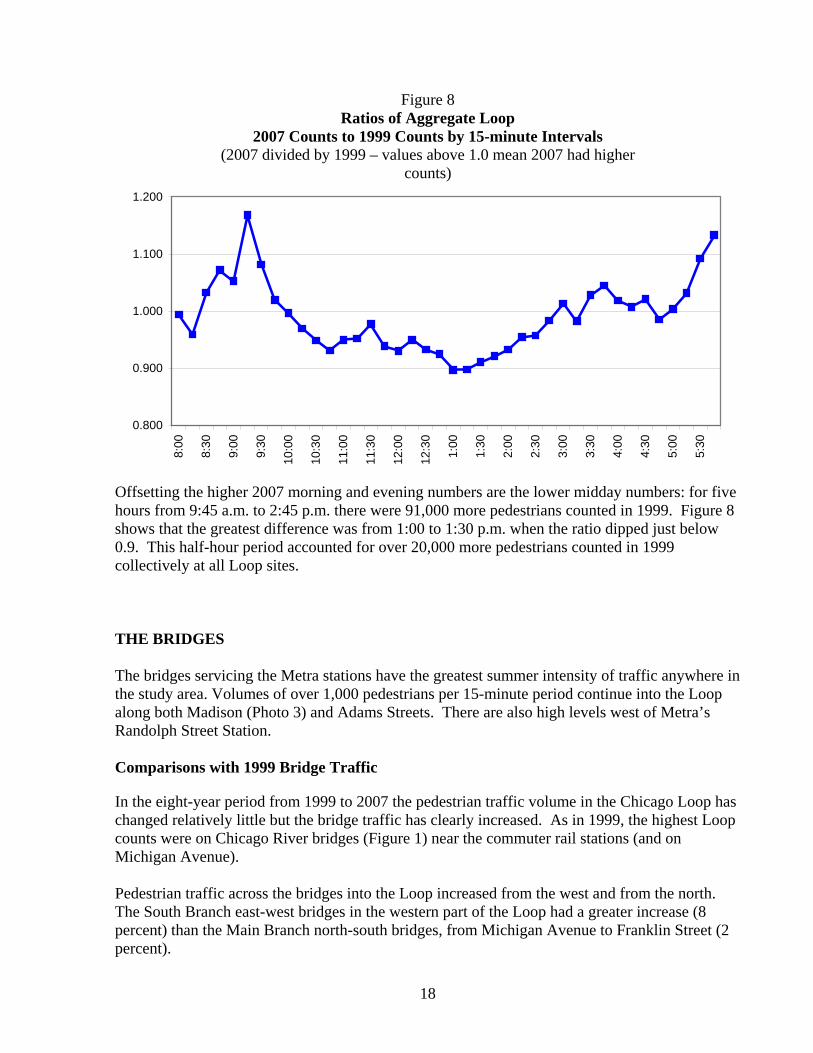
Further examination of the lunch period reveals the ratio of the 2007 counts to the 1999 counts (Figure 8). It is evident that in the morning the first two 1999 counts were higher. This is followed by six 15-minute counts in 2007 that are higher than in 1999. Together from 7:45 to 9:45 am, the first two hours of the study period, approximately 20,000 more pedestrians were counted in 2007. At the end of the 10-hour count day the net was even more heavily in favor of 2007. During the last two and a half hours (3:15 to 5:45 pm), there were 28,000 more pedestrians counted in 2007 than in 1999. These two peak periods clearly suggest that either downtown workers are walking greater distances to work and they consequently get counted numerous times (at each block face) or there are more of them. The latter is the more likely explanation, though both probably contribute to the difference.
18
Figure 8 Ratios of Aggregate Loop
2007 Counts to 1999 Counts by 15-minute Intervals (2007 divided by 1999 – values above 1.0 mean 2007 had higher
counts)
0.800
0.900
1.000
1.100
1.2008:
00
8:30
9:00
9:30
10:0
0
10:3
0
11:0
0
11:3
0
12:0
0
12:3
0
1:00
1:30
2:00
2:30
3:00
3:30
4:00
4:30
5:00
5:30
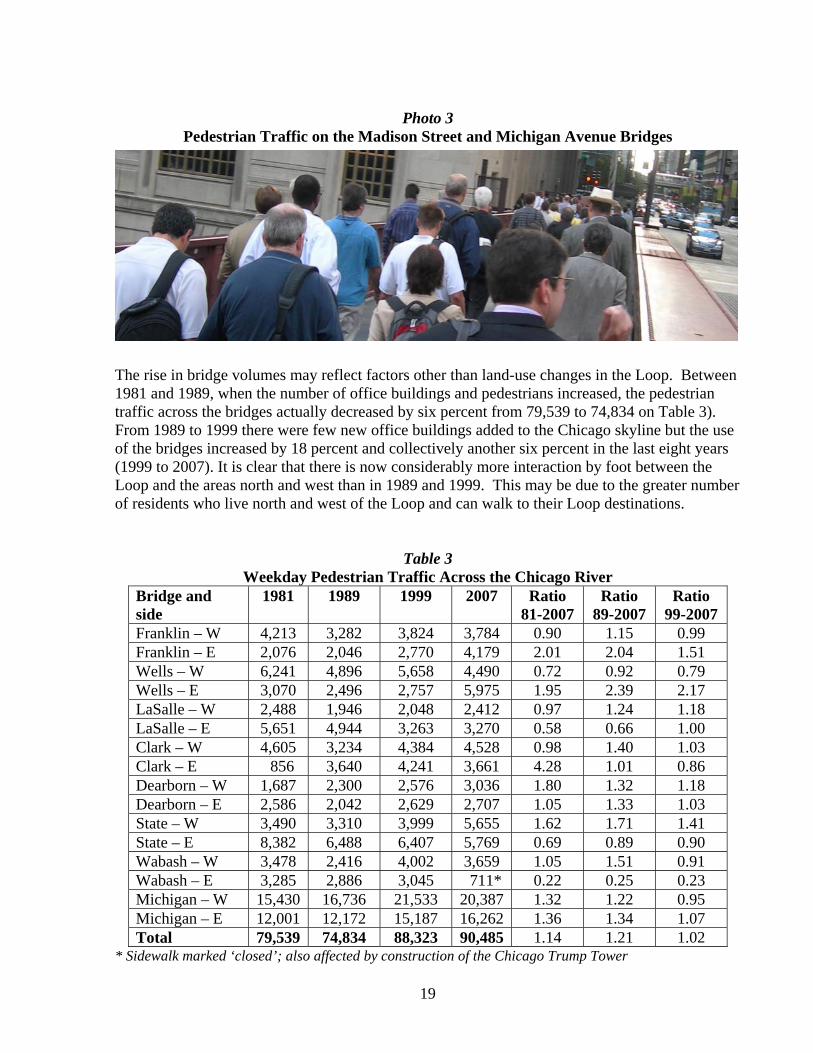
Offsetting the higher 2007 morning and evening numbers are the lower midday numbers: for five hours from 9:45 a.m. to 2:45 p.m. there were 91,000 more pedestrians counted in 1999. Figure 8 shows that the greatest difference was from 1:00 to 1:30 p.m. when the ratio dipped just below 0.9. This half-hour period accounted for over 20,000 more pedestrians counted in 1999 collectively at all Loop sites. THE BRIDGES The bridges servicing the Metra stations have the greatest summer intensity of traffic anywhere in the study area. Volumes of over 1,000 pedestrians per 15-minute period continue into the Loop along both Madison (Photo 3) and Adams Streets. There are also high levels west of Metra’s Randolph Street Station. Comparisons with 1999 Bridge Traffic
In the eight-year period from 1999 to 2007 the pedestrian traffic volume in the Chicago Loop has changed relatively little but the bridge traffic has clearly increased. As in 1999, the highest Loop counts were on Chicago River bridges (Figure 1) near the commuter rail stations (and on Michigan Avenue). Pedestrian traffic across the bridges into the Loop increased from the west and from the north. The South Branch east-west bridges in the western part of the Loop had a greater increase (8 percent) than the Main Branch north-south bridges, from Michigan Avenue to Franklin Street (2 percent).
19
Photo 3
Pedestrian Traffic on the Madison Street and Michigan Avenue Bridges
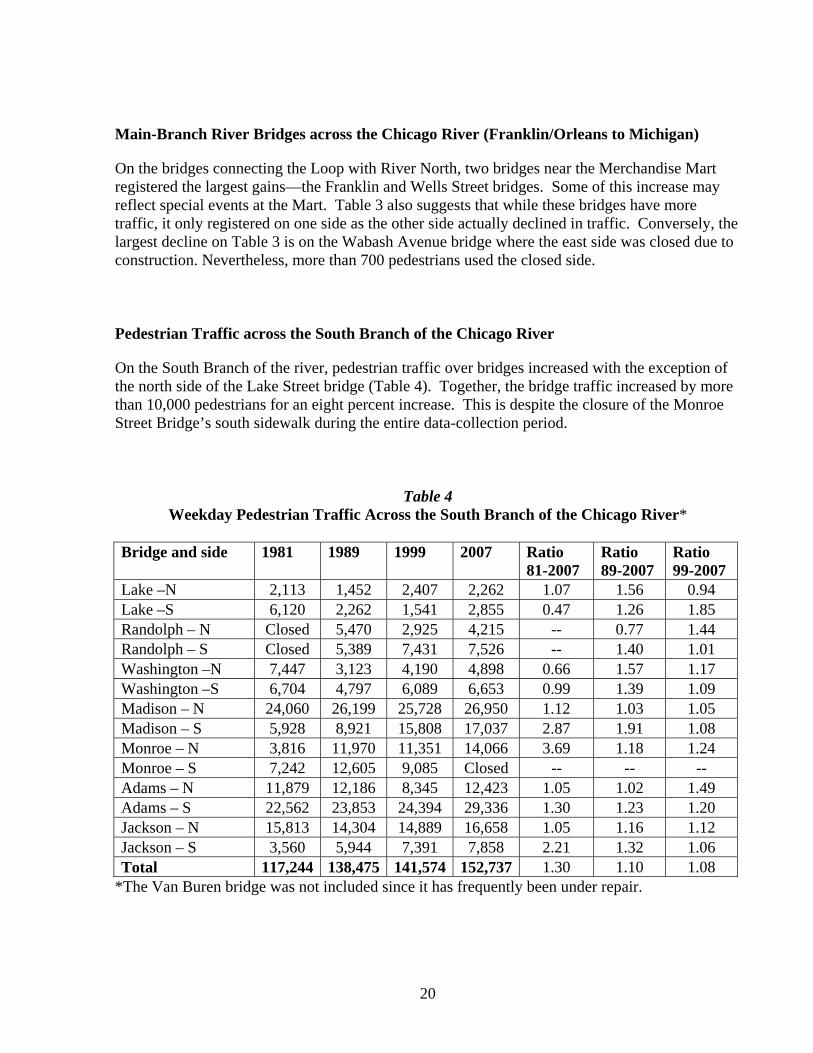
The rise in bridge volumes may reflect factors other than land-use changes in the Loop. Between 1981 and 1989, when the number of office buildings and pedestrians increased, the pedestrian traffic across the bridges actually decreased by six percent from 79,539 to 74,834 on Table 3). From 1989 to 1999 there were few new office buildings added to the Chicago skyline but the use of the bridges increased by 18 percent and collectively another six percent in the last eight years (1999 to 2007). It is clear that there is now considerably more interaction by foot between the Loop and the areas north and west than in 1989 and 1999. This may be due to the greater number of residents who live north and west of the Loop and can walk to their Loop destinations.
Table 3
Weekday Pedestrian Traffic Across the Chicago River Bridge and side
1981 1989 1999 2007 Ratio 81-2007
Ratio 89-2007
Ratio 99-2007
Franklin – W 4,213 3,282 3,824 3,784 0.90 1.15 0.99 Franklin – E 2,076 2,046 2,770 4,179 2.01 2.04 1.51 Wells – W 6,241 4,896 5,658 4,490 0.72 0.92 0.79 Wells – E 3,070 2,496 2,757 5,975 1.95 2.39 2.17 LaSalle – W 2,488 1,946 2,048 2,412 0.97 1.24 1.18 LaSalle – E 5,651 4,944 3,263 3,270 0.58 0.66 1.00 Clark – W 4,605 3,234 4,384 4,528 0.98 1.40 1.03 Clark – E 856 3,640 4,241 3,661 4.28 1.01 0.86 Dearborn – W 1,687 2,300 2,576 3,036 1.80 1.32 1.18 Dearborn – E 2,586 2,042 2,629 2,707 1.05 1.33 1.03 State – W 3,490 3,310 3,999 5,655 1.62 1.71 1.41 State – E 8,382 6,488 6,407 5,769 0.69 0.89 0.90 Wabash – W 3,478 2,416 4,002 3,659 1.05 1.51 0.91 Wabash – E 3,285 2,886 3,045 711* 0.22 0.25 0.23 Michigan – W 15,430 16,736 21,533 20,387 1.32 1.22 0.95 Michigan – E 12,001 12,172 15,187 16,262 1.36 1.34 1.07 Total 79,539 74,834 88,323 90,485 1.14 1.21 1.02
* Sidewalk marked ‘closed’; also affected by construction of the Chicago Trump Tower
20
Main-Branch River Bridges across the Chicago River (Franklin/Orleans to Michigan)
On the bridges connecting the Loop with River North, two bridges near the Merchandise Mart registered the largest gains—the Franklin and Wells Street bridges. Some of this increase may reflect special events at the Mart. Table 3 also suggests that while these bridges have more traffic, it only registered on one side as the other side actually declined in traffic. Conversely, the largest decline on Table 3 is on the Wabash Avenue bridge where the east side was closed due to construction. Nevertheless, more than 700 pedestrians used the closed side. Pedestrian Traffic across the South Branch of the Chicago River
On the South Branch of the river, pedestrian traffic over bridges increased with the exception of the north side of the Lake Street bridge (Table 4). Together, the bridge traffic increased by more than 10,000 pedestrians for an eight percent increase. This is despite the closure of the Monroe Street Bridge’s south sidewalk during the entire data-collection period.
Table 4 Weekday Pedestrian Traffic Across the South Branch of the Chicago River*
Bridge and side 1981 1989 1999 2007 Ratio
81-2007 Ratio 89-2007
Ratio 99-2007
Lake –N 2,113 1,452 2,407 2,262 1.07 1.56 0.94 Lake –S 6,120 2,262 1,541 2,855 0.47 1.26 1.85 Randolph – N Closed 5,470 2,925 4,215 -- 0.77 1.44 Randolph – S Closed 5,389 7,431 7,526 -- 1.40 1.01 Washington –N 7,447 3,123 4,190 4,898 0.66 1.57 1.17 Washington –S 6,704 4,797 6,089 6,653 0.99 1.39 1.09 Madison – N 24,060 26,199 25,728 26,950 1.12 1.03 1.05 Madison – S 5,928 8,921 15,808 17,037 2.87 1.91 1.08 Monroe – N 3,816 11,970 11,351 14,066 3.69 1.18 1.24 Monroe – S 7,242 12,605 9,085 Closed -- -- -- Adams – N 11,879 12,186 8,345 12,423 1.05 1.02 1.49 Adams – S 22,562 23,853 24,394 29,336 1.30 1.23 1.20 Jackson – N 15,813 14,304 14,889 16,658 1.05 1.16 1.12 Jackson – S 3,560 5,944 7,391 7,858 2.21 1.32 1.06 Total 117,244 138,475 141,574 152,737 1.30 1.10 1.08
*The Van Buren bridge was not included since it has frequently been under repair.
21
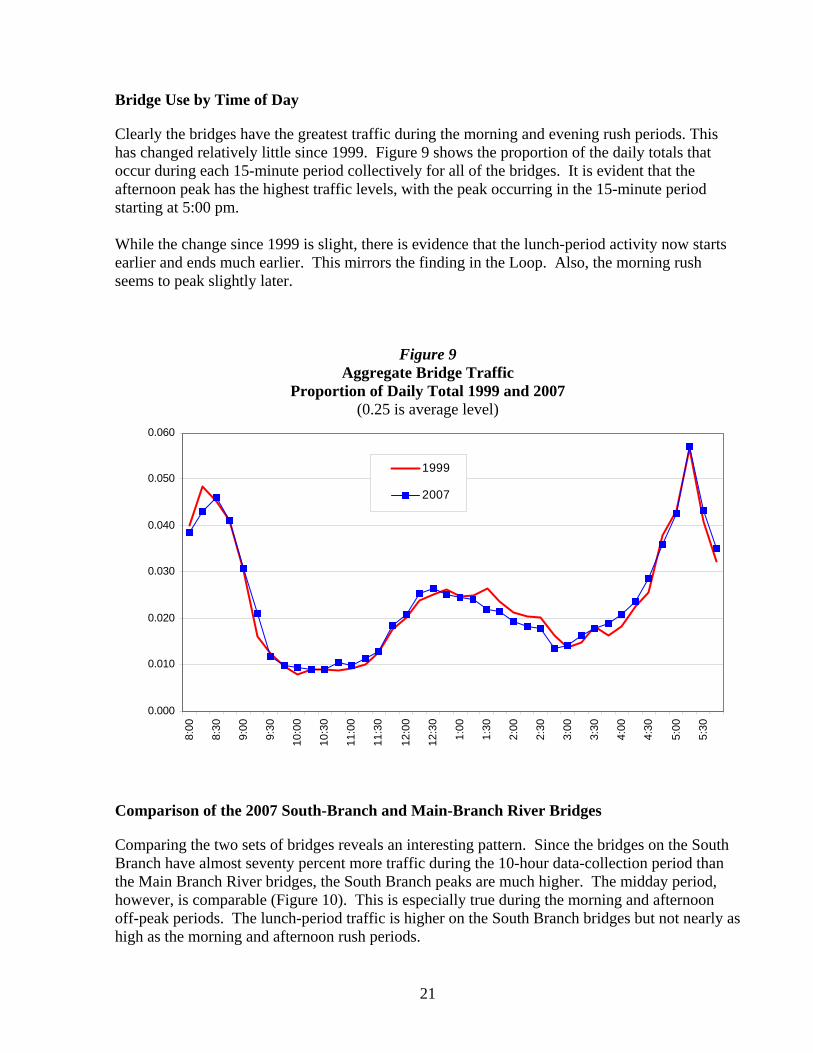
Bridge Use by Time of Day
Clearly the bridges have the greatest traffic during the morning and evening rush periods. This has changed relatively little since 1999. Figure 9 shows the proportion of the daily totals that occur during each 15-minute period collectively for all of the bridges. It is evident that the afternoon peak has the highest traffic levels, with the peak occurring in the 15-minute period starting at 5:00 pm. While the change since 1999 is slight, there is evidence that the lunch-period activity now starts earlier and ends much earlier. This mirrors the finding in the Loop. Also, the morning rush seems to peak slightly later.
Figure 9 Aggregate Bridge Traffic
Proportion of Daily Total 1999 and 2007 (0.25 is average level)
0.000
0.010
0.020
0.030
0.040
0.050
0.060
8:00
8:30
9:00
9:30
10:0
0
10:3
0
11:0
0
11:3
0
12:0
0
12:3
0
1:00
1:30
2:00
2:30
3:00
3:30
4:00
4:30
5:00
5:30
1999
2007
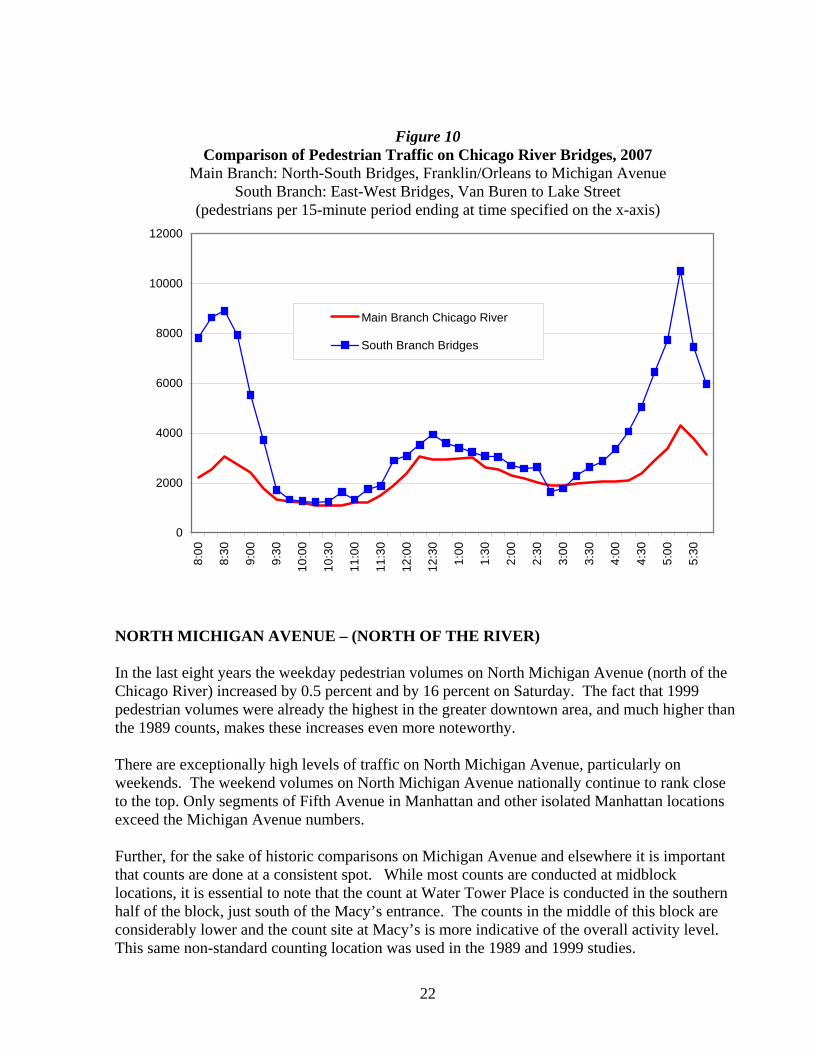
Comparison of the 2007 South-Branch and Main-Branch River Bridges
Comparing the two sets of bridges reveals an interesting pattern. Since the bridges on the South Branch have almost seventy percent more traffic during the 10-hour data-collection period than the Main Branch River bridges, the South Branch peaks are much higher. The midday period, however, is comparable (Figure 10). This is especially true during the morning and afternoon off-peak periods. The lunch-period traffic is higher on the South Branch bridges but not nearly as high as the morning and afternoon rush periods.
22
Figure 10 Comparison of Pedestrian Traffic on Chicago River Bridges, 2007
Main Branch: North-South Bridges, Franklin/Orleans to Michigan Avenue South Branch: East-West Bridges, Van Buren to Lake Street
(pedestrians per 15-minute period ending at time specified on the x-axis)
0
2000
4000
6000
8000
10000
12000
8:00
8:30
9:00
9:30
10:0
0
10:3
0
11:0
0
11:3
0
12:0
0
12:3
0
1:00
1:30
2:00
2:30
3:00
3:30
4:00
4:30
5:00
5:30
Main Branch Chicago River
South Branch Bridges
NORTH MICHIGAN AVENUE – (NORTH OF THE RIVER) In the last eight years the weekday pedestrian volumes on North Michigan Avenue (north of the Chicago River) increased by 0.5 percent and by 16 percent on Saturday. The fact that 1999 pedestrian volumes were already the highest in the greater downtown area, and much higher than the 1989 counts, makes these increases even more noteworthy. There are exceptionally high levels of traffic on North Michigan Avenue, particularly on weekends. The weekend volumes on North Michigan Avenue nationally continue to rank close to the top. Only segments of Fifth Avenue in Manhattan and other isolated Manhattan locations exceed the Michigan Avenue numbers. Further, for the sake of historic comparisons on Michigan Avenue and elsewhere it is important that counts are done at a consistent spot. While most counts are conducted at midblock locations, it is essential to note that the count at Water Tower Place is conducted in the southern half of the block, just south of the Macy’s entrance. The counts in the middle of this block are considerably lower and the count site at Macy’s is more indicative of the overall activity level. This same non-standard counting location was used in the 1989 and 1999 studies.
23
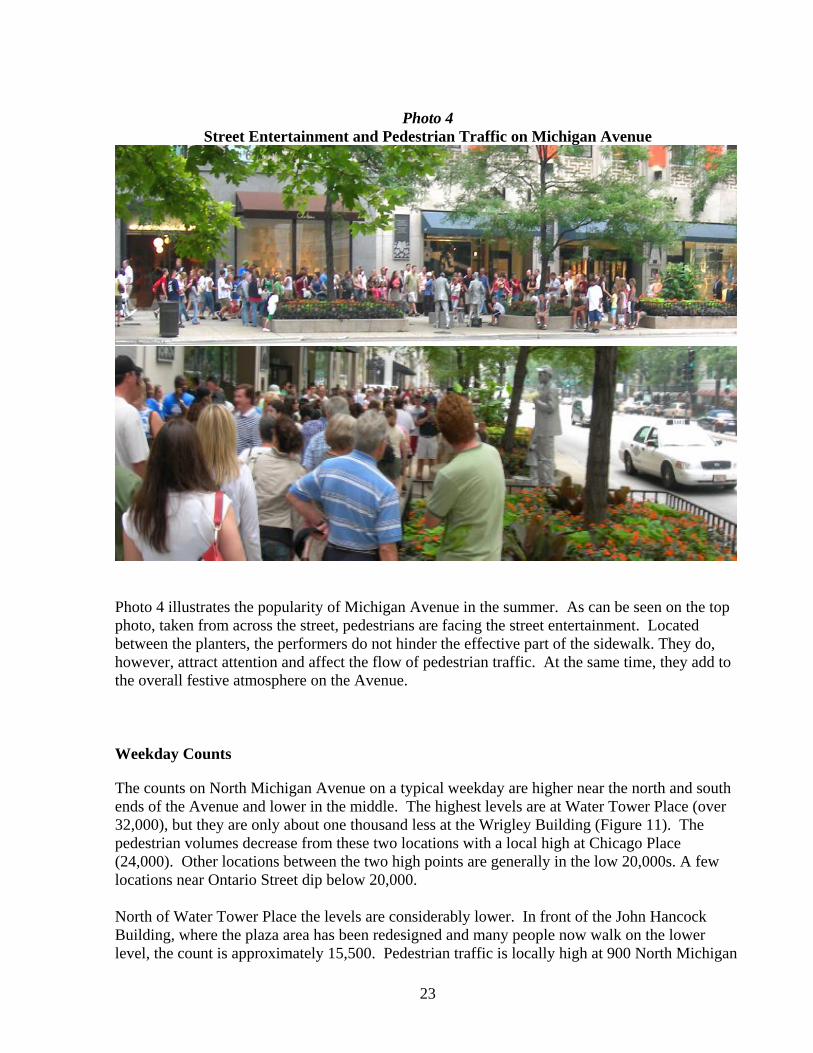
Photo 4
Street Entertainment and Pedestrian Traffic on Michigan Avenue
Photo 4 illustrates the popularity of Michigan Avenue in the summer. As can be seen on the top photo, taken from across the street, pedestrians are facing the street entertainment. Located between the planters, the performers do not hinder the effective part of the sidewalk. They do, however, attract attention and affect the flow of pedestrian traffic. At the same time, they add to the overall festive atmosphere on the Avenue. Weekday Counts
The counts on North Michigan Avenue on a typical weekday are higher near the north and south ends of the Avenue and lower in the middle. The highest levels are at Water Tower Place (over 32,000), but they are only about one thousand less at the Wrigley Building (Figure 11). The pedestrian volumes decrease from these two locations with a local high at Chicago Place (24,000). Other locations between the two high points are generally in the low 20,000s. A few locations near Ontario Street dip below 20,000. North of Water Tower Place the levels are considerably lower. In front of the John Hancock Building, where the plaza area has been redesigned and many people now walk on the lower level, the count is approximately 15,500. Pedestrian traffic is locally high at 900 North Michigan
24
Avenue (19,600) before it drops to the lowest level on the Avenue (3,300) north of Walton on the east side of Michigan Avenue. Weekday Comparisons, 1986 to 1999 to 2007 (No North Michigan Avenue data for 1981)
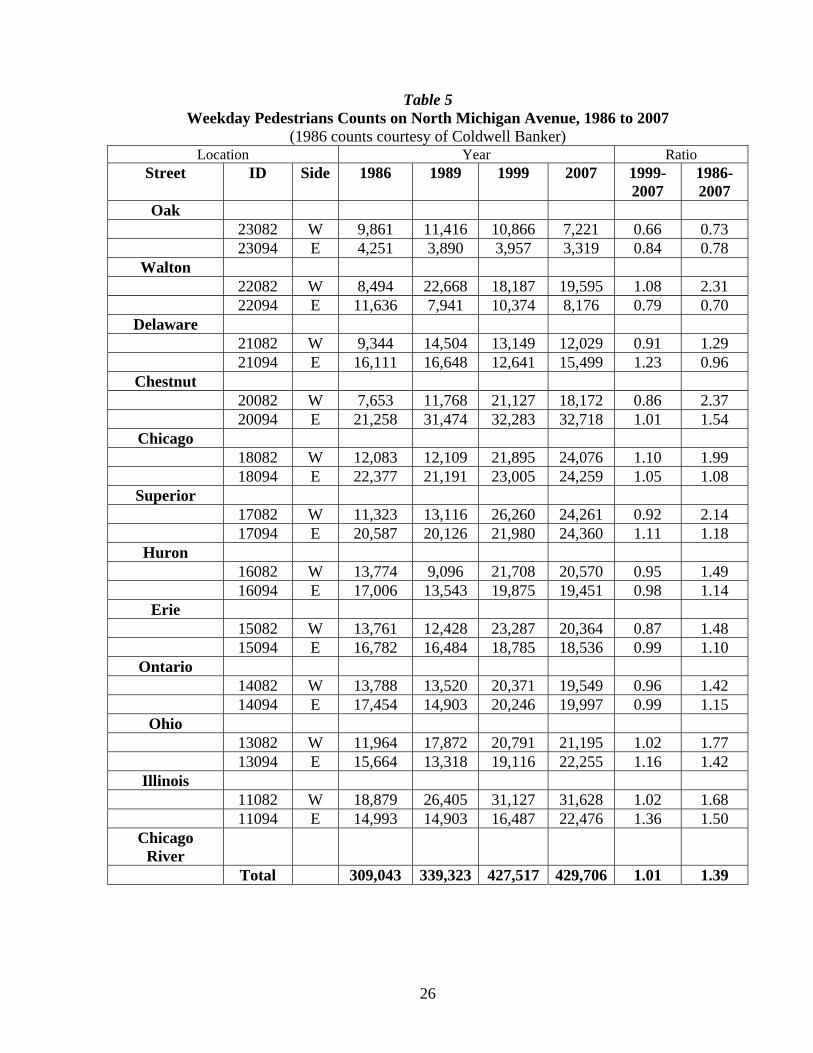
Since 1986 weekday pedestrian traffic on North Michigan Avenue has increased by almost forty percent (Table 5). During this twenty-one year period the largest gains have been on the west side of the Avenue (Figure 11). In 1986 the east side of the Avenue had much higher numbers than the west side but now both sides are nearly equal. Initially, the largest gains were recorded at 900 North Michigan (Bloomingdale’s), which was built between 1986 and 1989 and also two blocks to the south. In 1986 there was relatively little traffic north of Water Tower Place or across the street. With the completion of 900 North Michigan Avenue, pedestrian traffic moved northward. In those early years 900 North Michigan and Water Tower Place tended to dominate the activity on the Miracle Mile. Now with the completion of North Bridge (Nordstrom’s) the traffic is building near the southern end of North Michigan Avenue. The highest counts on Michigan Avenue, however, remain at Water Tower Place. Water Tower Place also has the second highest weekday counts in the study, surpassed only by Madison Street in front of the Ogilvie Transportation Center (Figure 29). Since 1999 the very north end of North Michigan Avenue is beginning to show decreases as the high intensity of activity is moving south. The very south end shows some of the highest absolute increases – on the east side of the Avenue south of Ohio. Moreover, since 1986 only four block faces had declines and all four are north of Chestnut Street. In the last eight years (1999-2007), on balance, there has been relatively little change in total weekday pedestrian traffic on North Michigan Avenue. Collectively, pedestrian traffic on the Avenue increased by approximately one percent with relatively minor fluctuations at many sites. In general, high traffic levels are now evident throughout North Michigan Avenue with the exception of the far north end.

25
Figure 11
26
Table 5 Weekday Pedestrians Counts on North Michigan Avenue, 1986 to 2007
(1986 counts courtesy of Coldwell Banker) Location Year Ratio
Street ID Side 1986 1989 1999 2007 1999-2007
1986-2007
Oak 23082 W 9,861 11,416 10,866 7,221 0.66 0.73
23094 E 4,251 3,890 3,957 3,319 0.84 0.78 Walton
22082 W 8,494 22,668 18,187 19,595 1.08 2.31 22094 E 11,636 7,941 10,374 8,176 0.79 0.70
Delaware 21082 W 9,344 14,504 13,149 12,029 0.91 1.29
21094 E 16,111 16,648 12,641 15,499 1.23 0.96 Chestnut
20082 W 7,653 11,768 21,127 18,172 0.86 2.37 20094 E 21,258 31,474 32,283 32,718 1.01 1.54
Chicago 18082 W 12,083 12,109 21,895 24,076 1.10 1.99
18094 E 22,377 21,191 23,005 24,259 1.05 1.08 Superior
17082 W 11,323 13,116 26,260 24,261 0.92 2.14 17094 E 20,587 20,126 21,980 24,360 1.11 1.18
Huron 16082 W 13,774 9,096 21,708 20,570 0.95 1.49
16094 E 17,006 13,543 19,875 19,451 0.98 1.14 Erie
15082 W 13,761 12,428 23,287 20,364 0.87 1.48 15094 E 16,782 16,484 18,785 18,536 0.99 1.10
Ontario 14082 W 13,788 13,520 20,371 19,549 0.96 1.42 14094 E 17,454 14,903 20,246 19,997 0.99 1.15
Ohio 13082 W 11,964 17,872 20,791 21,195 1.02 1.77
13094 E 15,664 13,318 19,116 22,255 1.16 1.42 Illinois
11082 W 18,879 26,405 31,127 31,628 1.02 1.68 11094 E 14,993 14,903 16,487 22,476 1.36 1.50
Chicago River
Total 309,043 339,323 427,517 429,706 1.01 1.39
27
Weekday Counts by Time of Day, 1999 and 2007
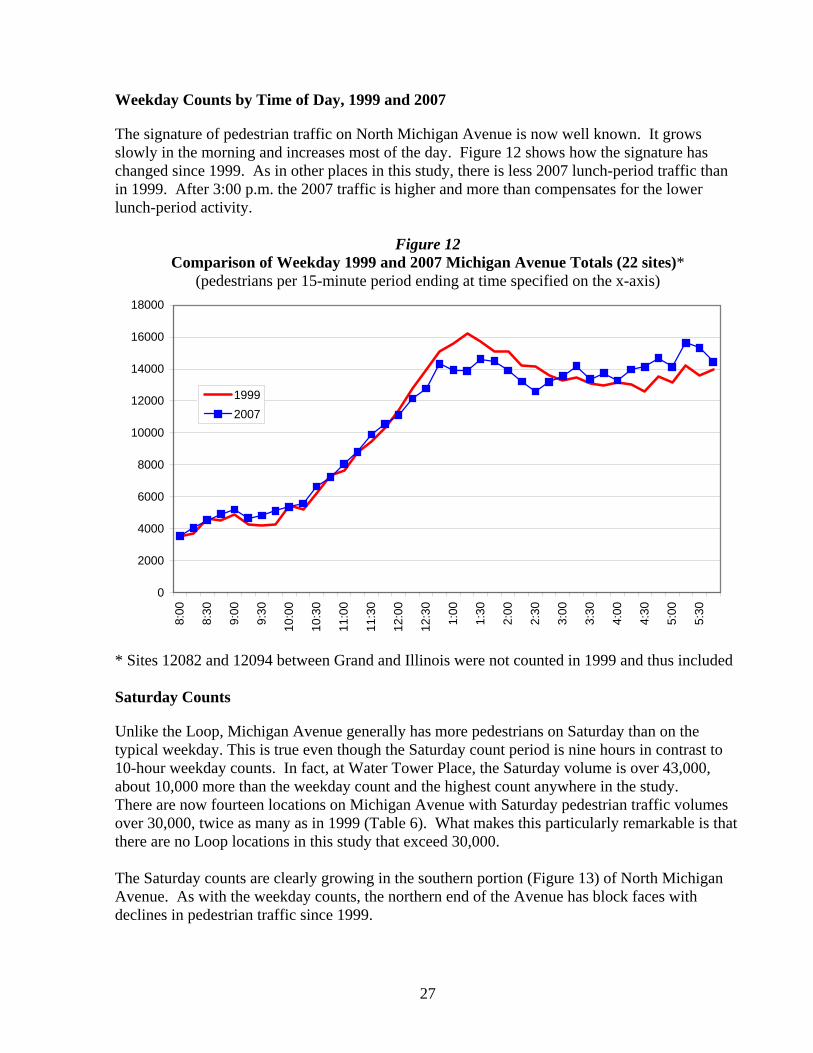
The signature of pedestrian traffic on North Michigan Avenue is now well known. It grows slowly in the morning and increases most of the day. Figure 12 shows how the signature has changed since 1999. As in other places in this study, there is less 2007 lunch-period traffic than in 1999. After 3:00 p.m. the 2007 traffic is higher and more than compensates for the lower lunch-period activity.
Figure 12 Comparison of Weekday 1999 and 2007 Michigan Avenue Totals (22 sites)*
(pedestrians per 15-minute period ending at time specified on the x-axis)
0
2000
4000
6000
8000
10000
12000
14000
16000
18000
8:00
8:30
9:00
9:30
10:0
0
10:3
0
11:0
0
11:3
0
12:0
0
12:3
0
1:00
1:30
2:00
2:30
3:00
3:30
4:00
4:30
5:00
5:30
19992007
* Sites 12082 and 12094 between Grand and Illinois were not counted in 1999 and thus included Saturday Counts
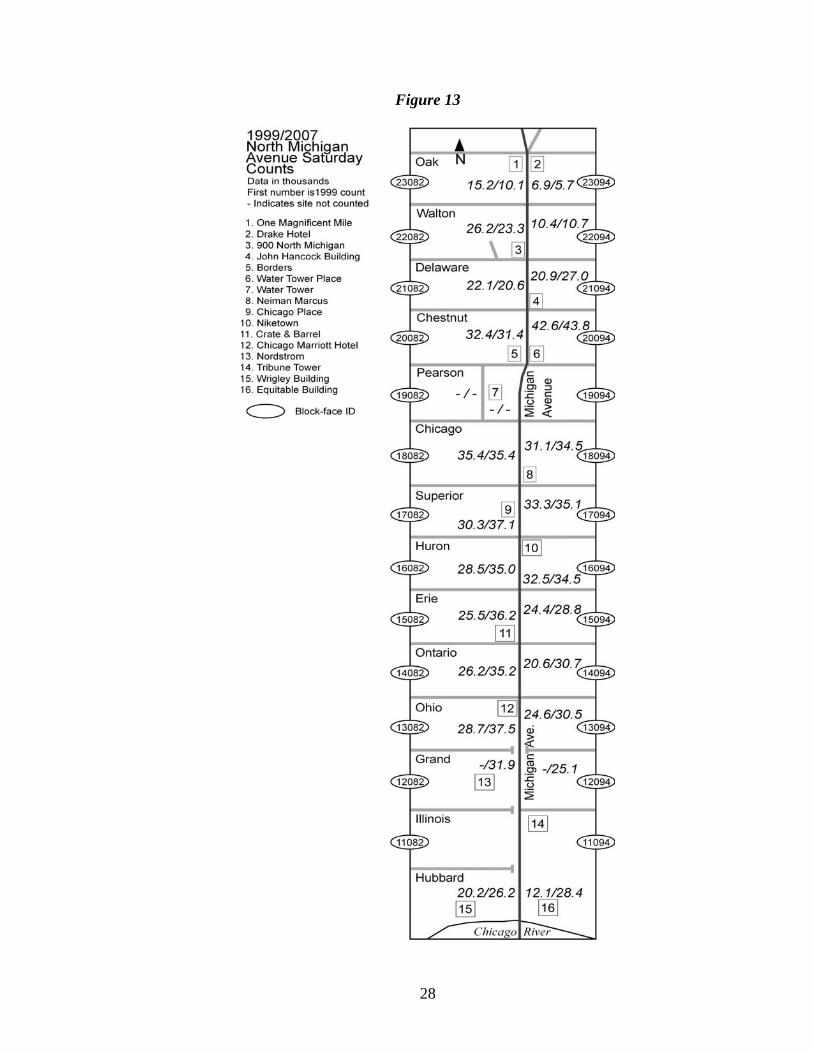
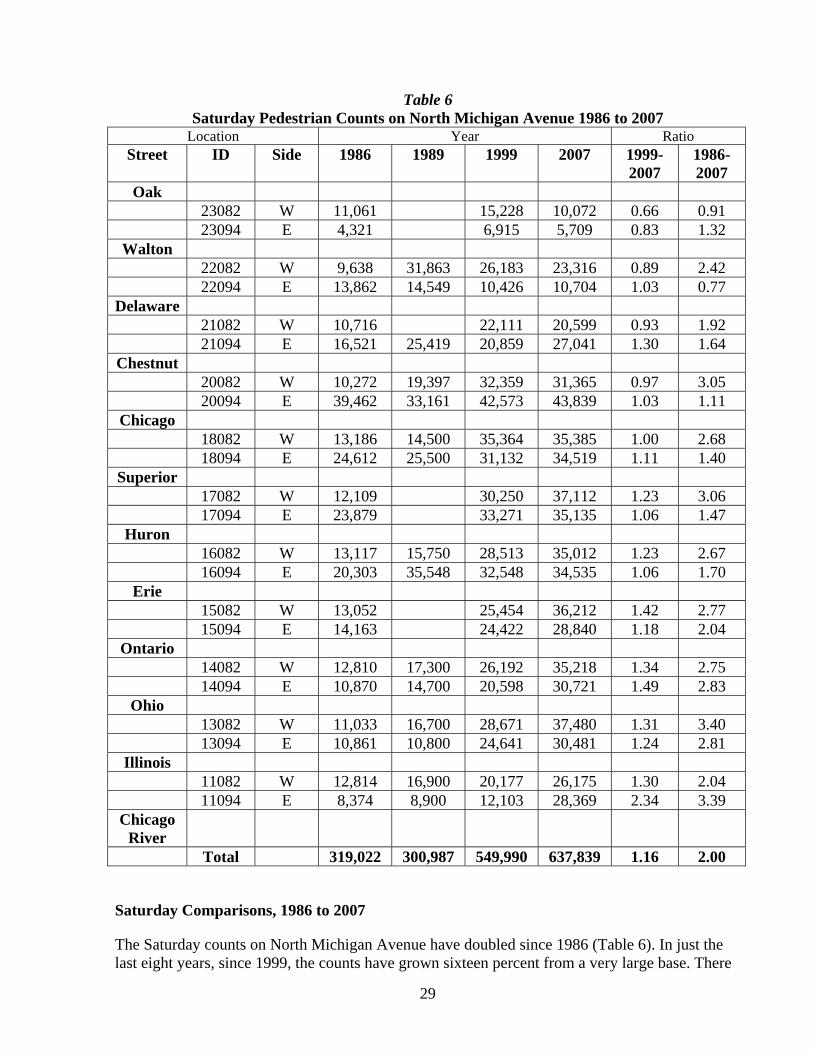
Unlike the Loop, Michigan Avenue generally has more pedestrians on Saturday than on the typical weekday. This is true even though the Saturday count period is nine hours in contrast to 10-hour weekday counts. In fact, at Water Tower Place, the Saturday volume is over 43,000, about 10,000 more than the weekday count and the highest count anywhere in the study. There are now fourteen locations on Michigan Avenue with Saturday pedestrian traffic volumes over 30,000, twice as many as in 1999 (Table 6). What makes this particularly remarkable is that there are no Loop locations in this study that exceed 30,000. The Saturday counts are clearly growing in the southern portion (Figure 13) of North Michigan Avenue. As with the weekday counts, the northern end of the Avenue has block faces with declines in pedestrian traffic since 1999.
28
Figure 13
29
Table 6 Saturday Pedestrian Counts on North Michigan Avenue 1986 to 2007
Location Year Ratio Street ID Side 1986 1989 1999 2007 1999-
2007 1986-2007
Oak 23082 W 11,061 15,228 10,072 0.66 0.91
23094 E 4,321 6,915 5,709 0.83 1.32 Walton
22082 W 9,638 31,863 26,183 23,316 0.89 2.42 22094 E 13,862 14,549 10,426 10,704 1.03 0.77
Delaware 21082 W 10,716 22,111 20,599 0.93 1.92
21094 E 16,521 25,419 20,859 27,041 1.30 1.64 Chestnut 20082 W 10,272 19,397 32,359 31,365 0.97 3.05
20094 E 39,462 33,161 42,573 43,839 1.03 1.11 Chicago
18082 W 13,186 14,500 35,364 35,385 1.00 2.68 18094 E 24,612 25,500 31,132 34,519 1.11 1.40
Superior 17082 W 12,109 30,250 37,112 1.23 3.06
17094 E 23,879 33,271 35,135 1.06 1.47 Huron
16082 W 13,117 15,750 28,513 35,012 1.23 2.67 16094 E 20,303 35,548 32,548 34,535 1.06 1.70
Erie 15082 W 13,052 25,454 36,212 1.42 2.77
15094 E 14,163 24,422 28,840 1.18 2.04 Ontario
14082 W 12,810 17,300 26,192 35,218 1.34 2.75 14094 E 10,870 14,700 20,598 30,721 1.49 2.83
Ohio 13082 W 11,033 16,700 28,671 37,480 1.31 3.40
13094 E 10,861 10,800 24,641 30,481 1.24 2.81 Illinois
11082 W 12,814 16,900 20,177 26,175 1.30 2.04 11094 E 8,374 8,900 12,103 28,369 2.34 3.39 Chicago
River
Total 319,022 300,987 549,990 637,839 1.16 2.00
Saturday Comparisons, 1986 to 2007
The Saturday counts on North Michigan Avenue have doubled since 1986 (Table 6). In just the last eight years, since 1999, the counts have grown sixteen percent from a very large base. There
30
is little doubt that North Michigan Avenue has become a major tourist and shopping destination. As on weekdays, the west side of the street grew more than the east side. Several west-side counts tripled since 1986 including at North Bridge (Nordstrom). There were, however, two sites at the north end that experienced declines in pedestrian traffic over the last twenty-one years. Together these two sites account for only about three percent of the Avenue total and run counter to the phenomenal growth in the last two decades. Contrasts between the 2007 Weekday and Saturday Counts
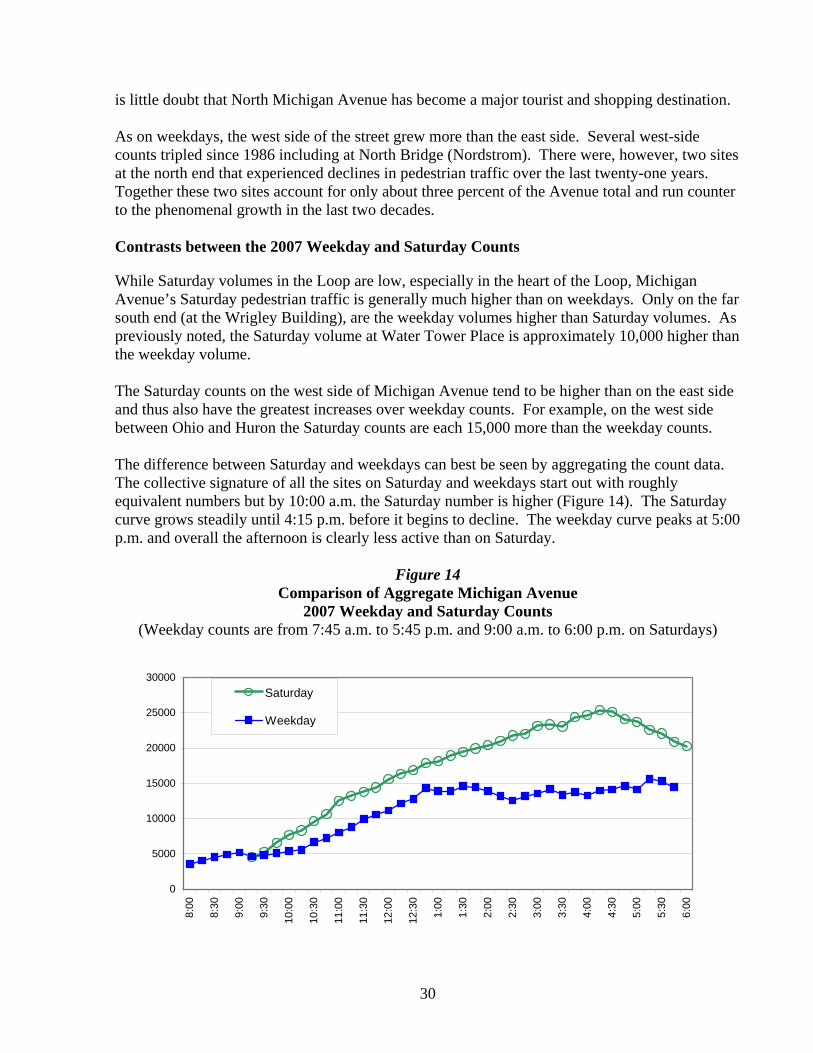
While Saturday volumes in the Loop are low, especially in the heart of the Loop, Michigan Avenue’s Saturday pedestrian traffic is generally much higher than on weekdays. Only on the far south end (at the Wrigley Building), are the weekday volumes higher than Saturday volumes. As previously noted, the Saturday volume at Water Tower Place is approximately 10,000 higher than the weekday volume. The Saturday counts on the west side of Michigan Avenue tend to be higher than on the east side and thus also have the greatest increases over weekday counts. For example, on the west side between Ohio and Huron the Saturday counts are each 15,000 more than the weekday counts. The difference between Saturday and weekdays can best be seen by aggregating the count data. The collective signature of all the sites on Saturday and weekdays start out with roughly equivalent numbers but by 10:00 a.m. the Saturday number is higher (Figure 14). The Saturday curve grows steadily until 4:15 p.m. before it begins to decline. The weekday curve peaks at 5:00 p.m. and overall the afternoon is clearly less active than on Saturday.
Figure 14 Comparison of Aggregate Michigan Avenue
2007 Weekday and Saturday Counts (Weekday counts are from 7:45 a.m. to 5:45 p.m. and 9:00 a.m. to 6:00 p.m. on Saturdays)
0
5000
10000
15000
20000
25000
30000
8:00
8:30
9:00
9:30
10:0
0
10:3
0
11:0
0
11:3
0
12:0
0
12:3
0
1:00
1:30
2:00
2:30
3:00
3:30
4:00
4:30
5:00
5:30
6:00
Saturday
Weekday
31
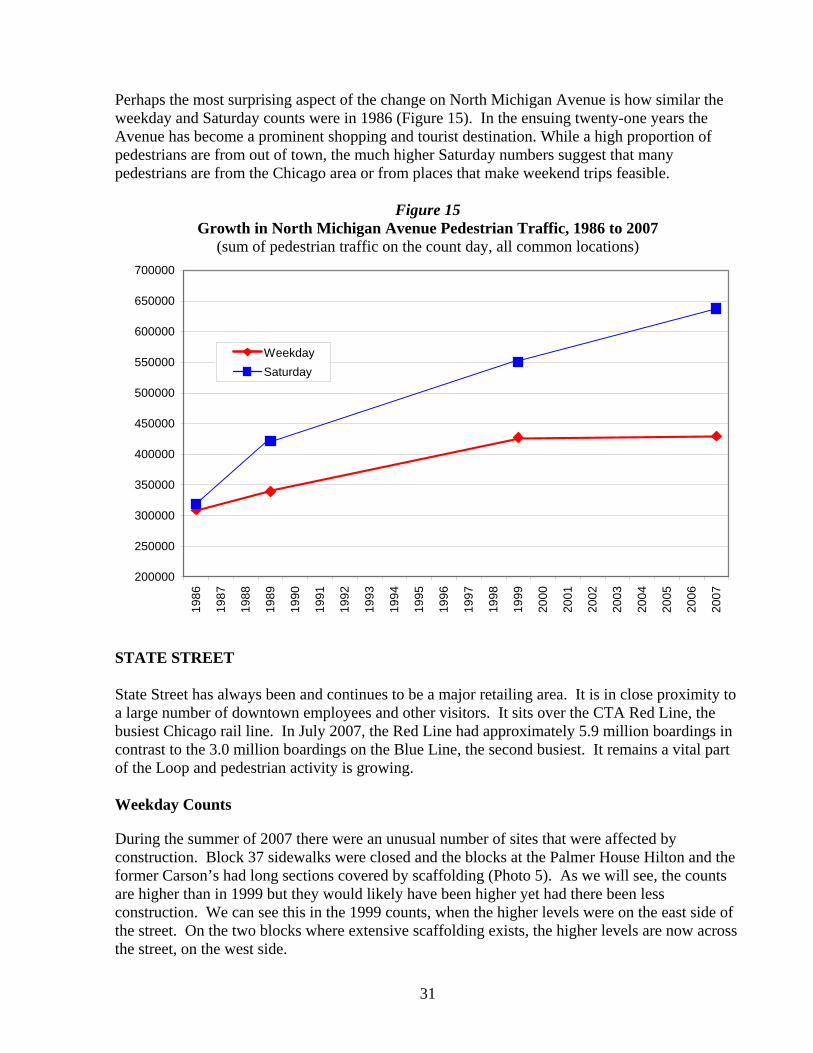
Perhaps the most surprising aspect of the change on North Michigan Avenue is how similar the weekday and Saturday counts were in 1986 (Figure 15). In the ensuing twenty-one years the Avenue has become a prominent shopping and tourist destination. While a high proportion of pedestrians are from out of town, the much higher Saturday numbers suggest that many pedestrians are from the Chicago area or from places that make weekend trips feasible.
Figure 15 Growth in North Michigan Avenue Pedestrian Traffic, 1986 to 2007
(sum of pedestrian traffic on the count day, all common locations)
200000
250000
300000
350000
400000
450000
500000
550000
600000
650000
700000
1986
1987
1988
1989
1990
1991
1992
1993
1994
1995
1996
1997
1998
1999
2000
2001
2002
2003
2004
2005
2006
2007
WeekdaySaturday
STATE STREET State Street has always been and continues to be a major retailing area. It is in close proximity to a large number of downtown employees and other visitors. It sits over the CTA Red Line, the busiest Chicago rail line. In July 2007, the Red Line had approximately 5.9 million boardings in contrast to the 3.0 million boardings on the Blue Line, the second busiest. It remains a vital part of the Loop and pedestrian activity is growing. Weekday Counts
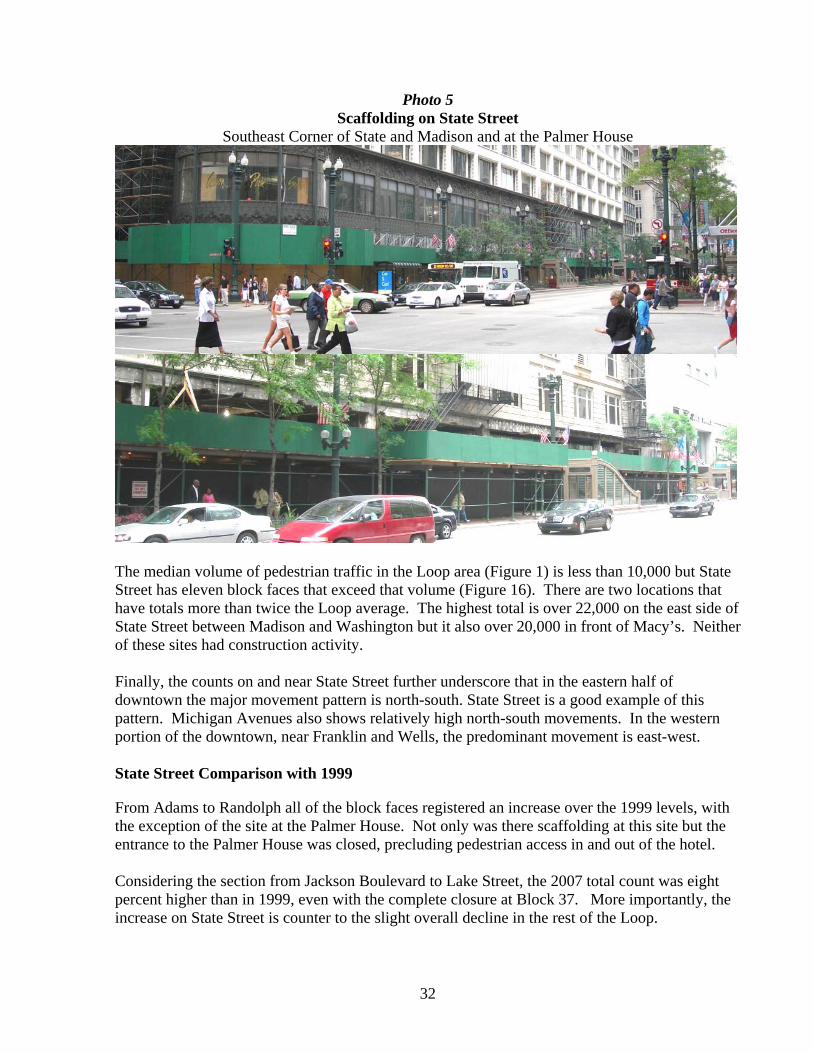
During the summer of 2007 there were an unusual number of sites that were affected by construction. Block 37 sidewalks were closed and the blocks at the Palmer House Hilton and the former Carson’s had long sections covered by scaffolding (Photo 5). As we will see, the counts are higher than in 1999 but they would likely have been higher yet had there been less construction. We can see this in the 1999 counts, when the higher levels were on the east side of the street. On the two blocks where extensive scaffolding exists, the higher levels are now across the street, on the west side.
32
Photo 5 Scaffolding on State Street
Southeast Corner of State and Madison and at the Palmer House
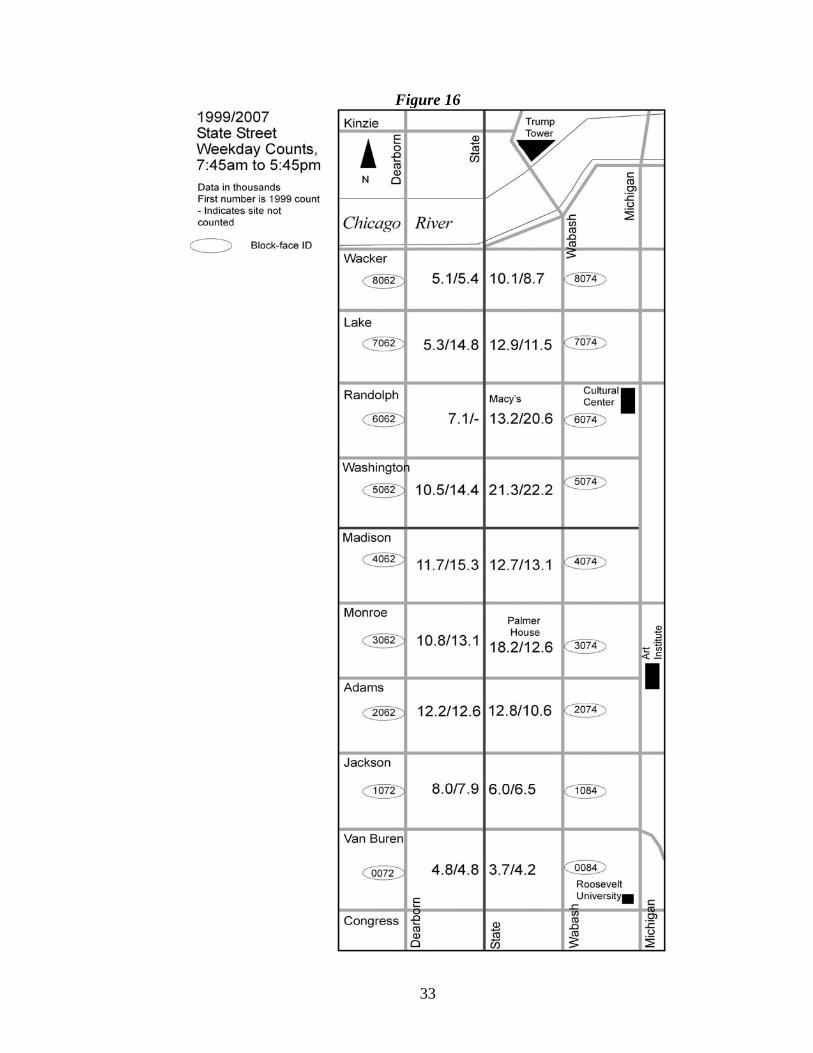
The median volume of pedestrian traffic in the Loop area (Figure 1) is less than 10,000 but State Street has eleven block faces that exceed that volume (Figure 16). There are two locations that have totals more than twice the Loop average. The highest total is over 22,000 on the east side of State Street between Madison and Washington but it also over 20,000 in front of Macy’s. Neither of these sites had construction activity. Finally, the counts on and near State Street further underscore that in the eastern half of downtown the major movement pattern is north-south. State Street is a good example of this pattern. Michigan Avenues also shows relatively high north-south movements. In the western portion of the downtown, near Franklin and Wells, the predominant movement is east-west. State Street Comparison with 1999
From Adams to Randolph all of the block faces registered an increase over the 1999 levels, with the exception of the site at the Palmer House. Not only was there scaffolding at this site but the entrance to the Palmer House was closed, precluding pedestrian access in and out of the hotel. Considering the section from Jackson Boulevard to Lake Street, the 2007 total count was eight percent higher than in 1999, even with the complete closure at Block 37. More importantly, the increase on State Street is counter to the slight overall decline in the rest of the Loop.
33
Figure 16
34
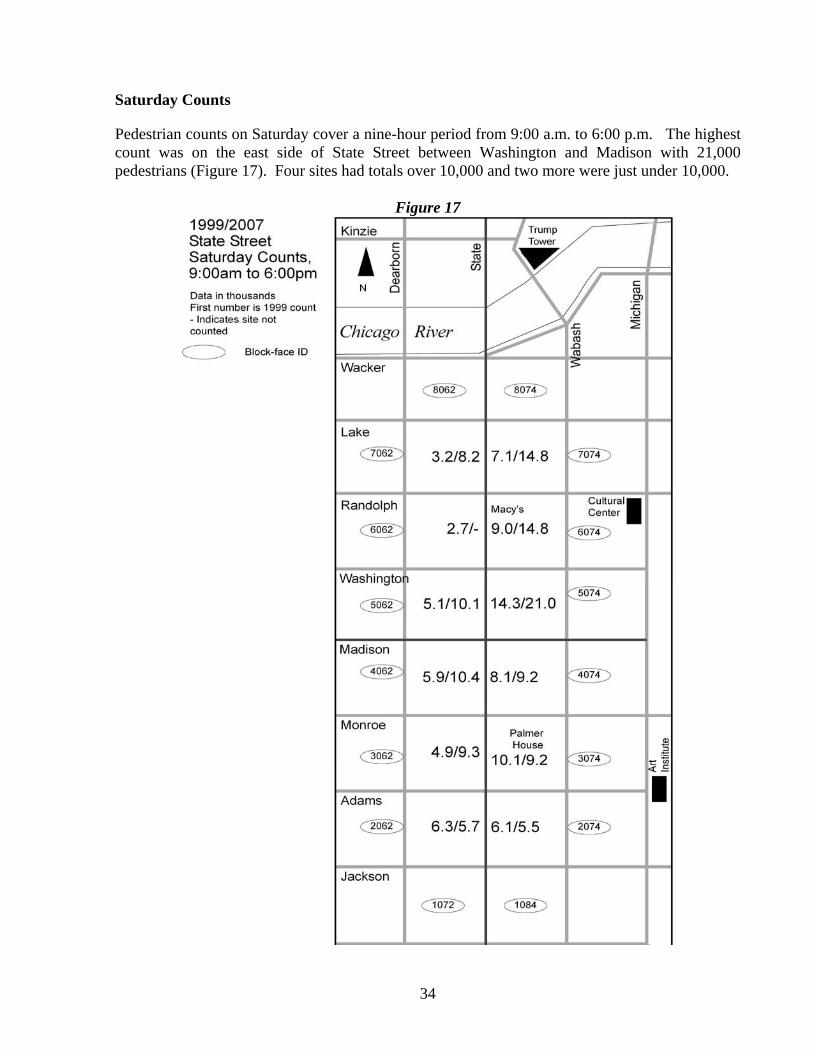
Saturday Counts
Pedestrian counts on Saturday cover a nine-hour period from 9:00 a.m. to 6:00 p.m. The highest count was on the east side of State Street between Washington and Madison with 21,000 pedestrians (Figure 17). Four sites had totals over 10,000 and two more were just under 10,000.
Figure 17
35
State Street Comparison with 1999
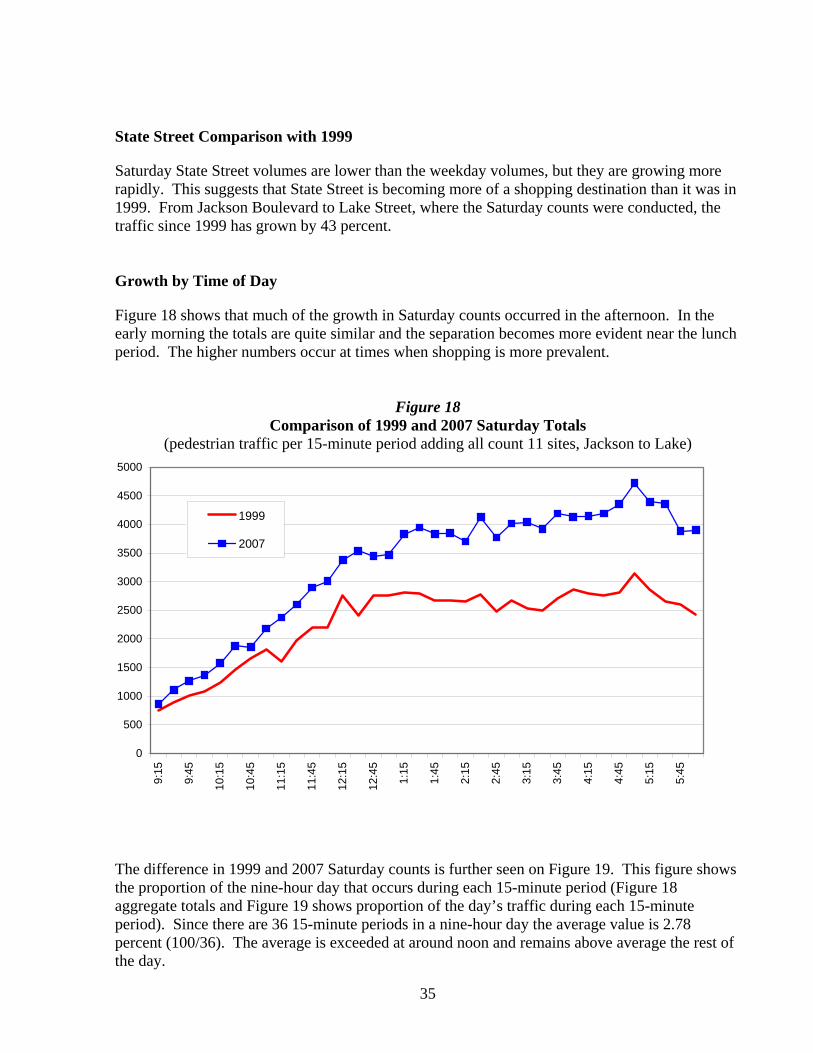
Saturday State Street volumes are lower than the weekday volumes, but they are growing more rapidly. This suggests that State Street is becoming more of a shopping destination than it was in 1999. From Jackson Boulevard to Lake Street, where the Saturday counts were conducted, the traffic since 1999 has grown by 43 percent. Growth by Time of Day
Figure 18 shows that much of the growth in Saturday counts occurred in the afternoon. In the early morning the totals are quite similar and the separation becomes more evident near the lunch period. The higher numbers occur at times when shopping is more prevalent.
Figure 18 Comparison of 1999 and 2007 Saturday Totals
(pedestrian traffic per 15-minute period adding all count 11 sites, Jackson to Lake)
0
500
1000
1500
2000
2500
3000
3500
4000
4500
5000
9:15
9:45
10:1
5
10:4
5
11:1
5
11:4
5
12:1
5
12:4
5
1:15
1:45
2:15
2:45
3:15
3:45
4:15
4:45
5:15
5:45
1999
2007
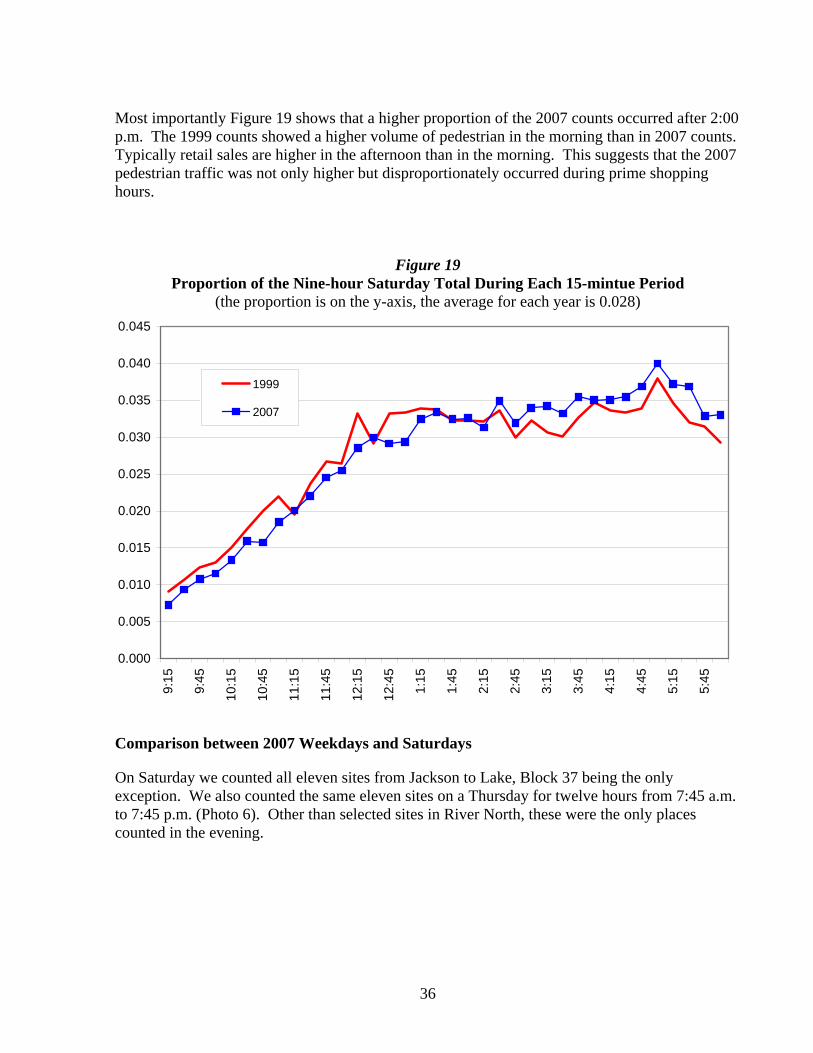
The difference in 1999 and 2007 Saturday counts is further seen on Figure 19. This figure shows the proportion of the nine-hour day that occurs during each 15-minute period (Figure 18 aggregate totals and Figure 19 shows proportion of the day’s traffic during each 15-minute period). Since there are 36 15-minute periods in a nine-hour day the average value is 2.78 percent (100/36). The average is exceeded at around noon and remains above average the rest of the day.
36
Most importantly Figure 19 shows that a higher proportion of the 2007 counts occurred after 2:00 p.m. The 1999 counts showed a higher volume of pedestrian in the morning than in 2007 counts. Typically retail sales are higher in the afternoon than in the morning. This suggests that the 2007 pedestrian traffic was not only higher but disproportionately occurred during prime shopping hours.
Figure 19 Proportion of the Nine-hour Saturday Total During Each 15-mintue Period
(the proportion is on the y-axis, the average for each year is 0.028)
0.000
0.005
0.010
0.015
0.020
0.025
0.030
0.035
0.040
0.045
9:15
9:45
10:1
5
10:4
5
11:1
5
11:4
5
12:1
5
12:4
5
1:15
1:45
2:15
2:45
3:15
3:45
4:15
4:45
5:15
5:45
1999
2007
Comparison between 2007 Weekdays and Saturdays
On Saturday we counted all eleven sites from Jackson to Lake, Block 37 being the only exception. We also counted the same eleven sites on a Thursday for twelve hours from 7:45 a.m. to 7:45 p.m. (Photo 6). Other than selected sites in River North, these were the only places counted in the evening.
37
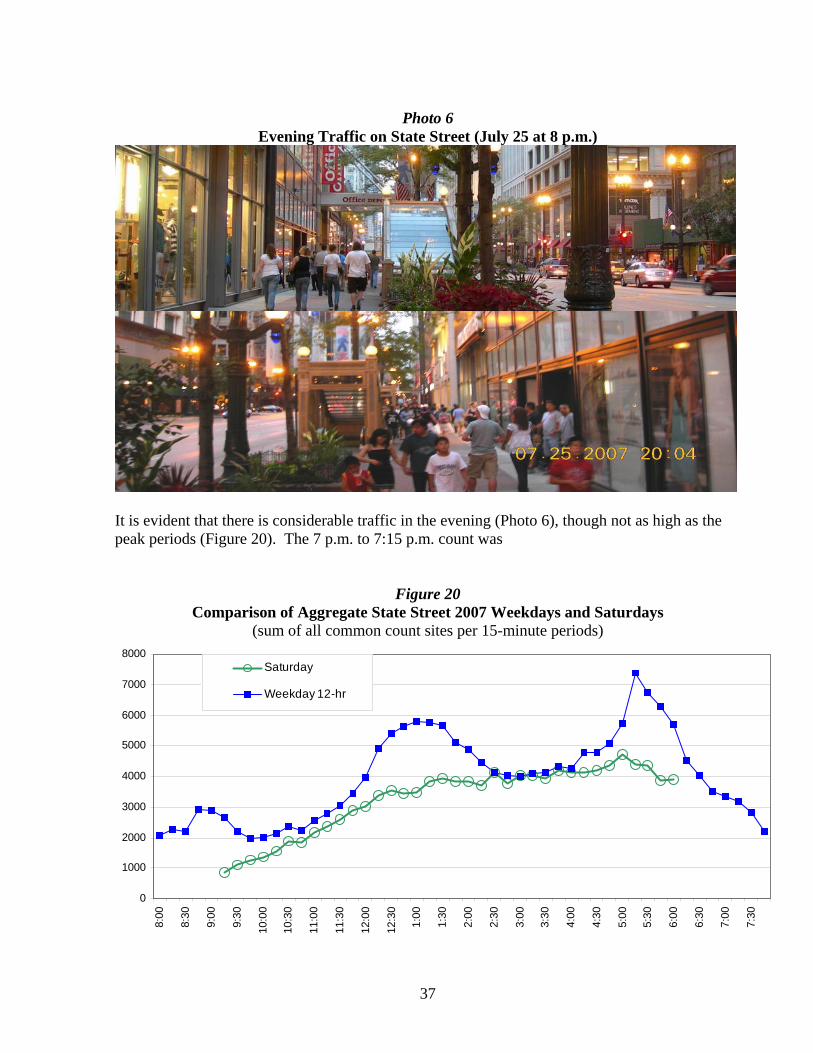
Photo 6
Evening Traffic on State Street (July 25 at 8 p.m.)
It is evident that there is considerable traffic in the evening (Photo 6), though not as high as the peak periods (Figure 20). The 7 p.m. to 7:15 p.m. count was
Figure 20 Comparison of Aggregate State Street 2007 Weekdays and Saturdays
(sum of all common count sites per 15-minute periods)
0
1000
2000
3000
4000
5000
6000
7000
8000
8:00
8:30
9:00
9:30
10:0
0
10:3
0
11:0
0
11:3
0
12:0
0
12:3
0
1:00
1:30
2:00
2:30
3:00
3:30
4:00
4:30
5:00
5:30
6:00
6:30
7:00
7:30
Saturday
Weekday 12-hr
38
about the same as the count at 11:30 in the morning. At least on State Street, this suggests that the count period could be extended beyond the current 5:45 p.m. and still have a large number of pedestrians to count. While the Saturday counts are lower than the weekday counts, with the large number of Loop workers in the immediate area, the early afternoon is roughly equivalent. The biggest differences occur during the two peak periods, morning and evening, as well as during lunch. PEDWAY Weather Effects
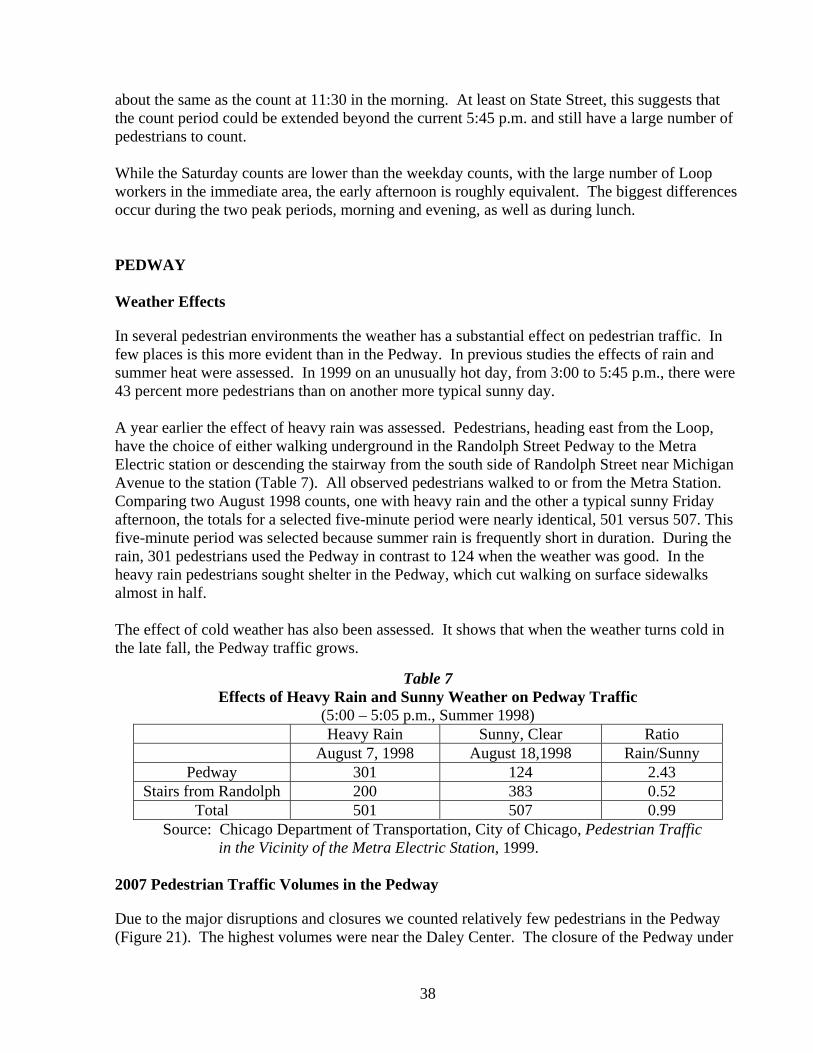
In several pedestrian environments the weather has a substantial effect on pedestrian traffic. In few places is this more evident than in the Pedway. In previous studies the effects of rain and summer heat were assessed. In 1999 on an unusually hot day, from 3:00 to 5:45 p.m., there were 43 percent more pedestrians than on another more typical sunny day. A year earlier the effect of heavy rain was assessed. Pedestrians, heading east from the Loop, have the choice of either walking underground in the Randolph Street Pedway to the Metra Electric station or descending the stairway from the south side of Randolph Street near Michigan Avenue to the station (Table 7). All observed pedestrians walked to or from the Metra Station. Comparing two August 1998 counts, one with heavy rain and the other a typical sunny Friday afternoon, the totals for a selected five-minute period were nearly identical, 501 versus 507. This five-minute period was selected because summer rain is frequently short in duration. During the rain, 301 pedestrians used the Pedway in contrast to 124 when the weather was good. In the heavy rain pedestrians sought shelter in the Pedway, which cut walking on surface sidewalks almost in half. The effect of cold weather has also been assessed. It shows that when the weather turns cold in the late fall, the Pedway traffic grows.
Table 7 Effects of Heavy Rain and Sunny Weather on Pedway Traffic
(5:00 – 5:05 p.m., Summer 1998) Heavy Rain Sunny, Clear Ratio August 7, 1998 August 18,1998 Rain/Sunny
Pedway 301 124 2.43 Stairs from Randolph 200 383 0.52
Total 501 507 0.99 Source: Chicago Department of Transportation, City of Chicago, Pedestrian Traffic in the Vicinity of the Metra Electric Station, 1999. 2007 Pedestrian Traffic Volumes in the Pedway
Due to the major disruptions and closures we counted relatively few pedestrians in the Pedway (Figure 21). The highest volumes were near the Daley Center. The closure of the Pedway under
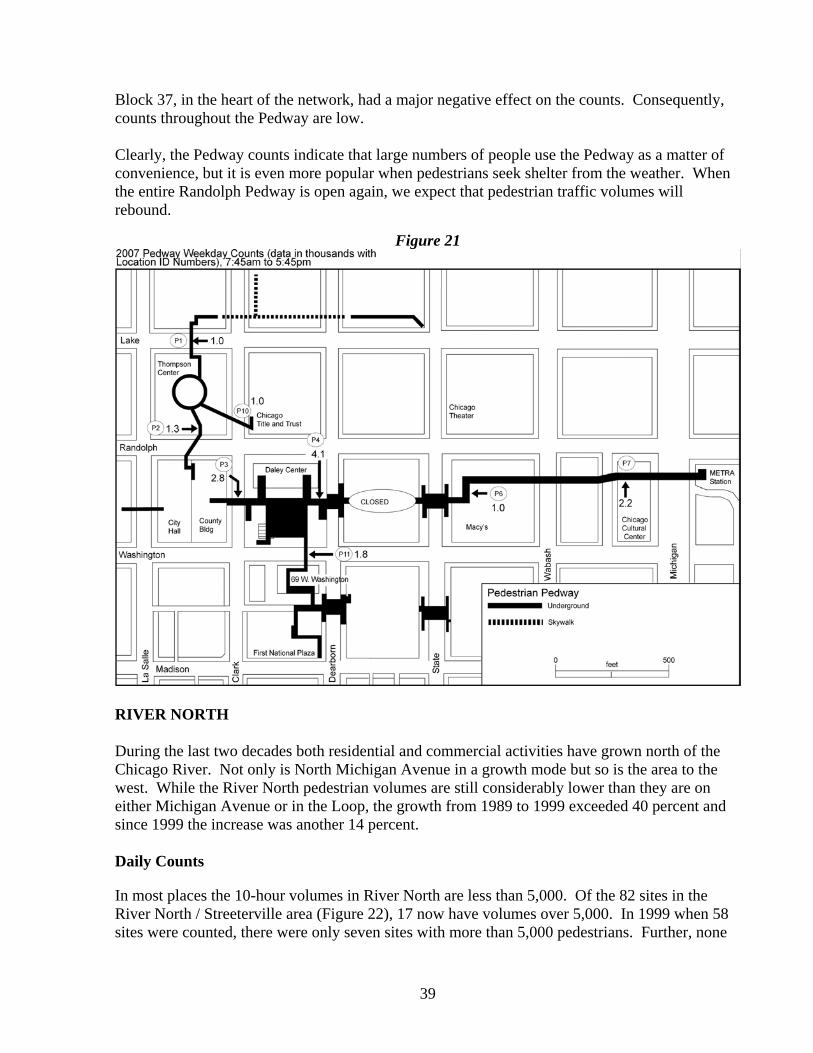
39
Block 37, in the heart of the network, had a major negative effect on the counts. Consequently, counts throughout the Pedway are low. Clearly, the Pedway counts indicate that large numbers of people use the Pedway as a matter of convenience, but it is even more popular when pedestrians seek shelter from the weather. When the entire Randolph Pedway is open again, we expect that pedestrian traffic volumes will rebound.
Figure 21
RIVER NORTH During the last two decades both residential and commercial activities have grown north of the Chicago River. Not only is North Michigan Avenue in a growth mode but so is the area to the west. While the River North pedestrian volumes are still considerably lower than they are on either Michigan Avenue or in the Loop, the growth from 1989 to 1999 exceeded 40 percent and since 1999 the increase was another 14 percent. Daily Counts
In most places the 10-hour volumes in River North are less than 5,000. Of the 82 sites in the River North / Streeterville area (Figure 22), 17 now have volumes over 5,000. In 1999 when 58 sites were counted, there were only seven sites with more than 5,000 pedestrians. Further, none
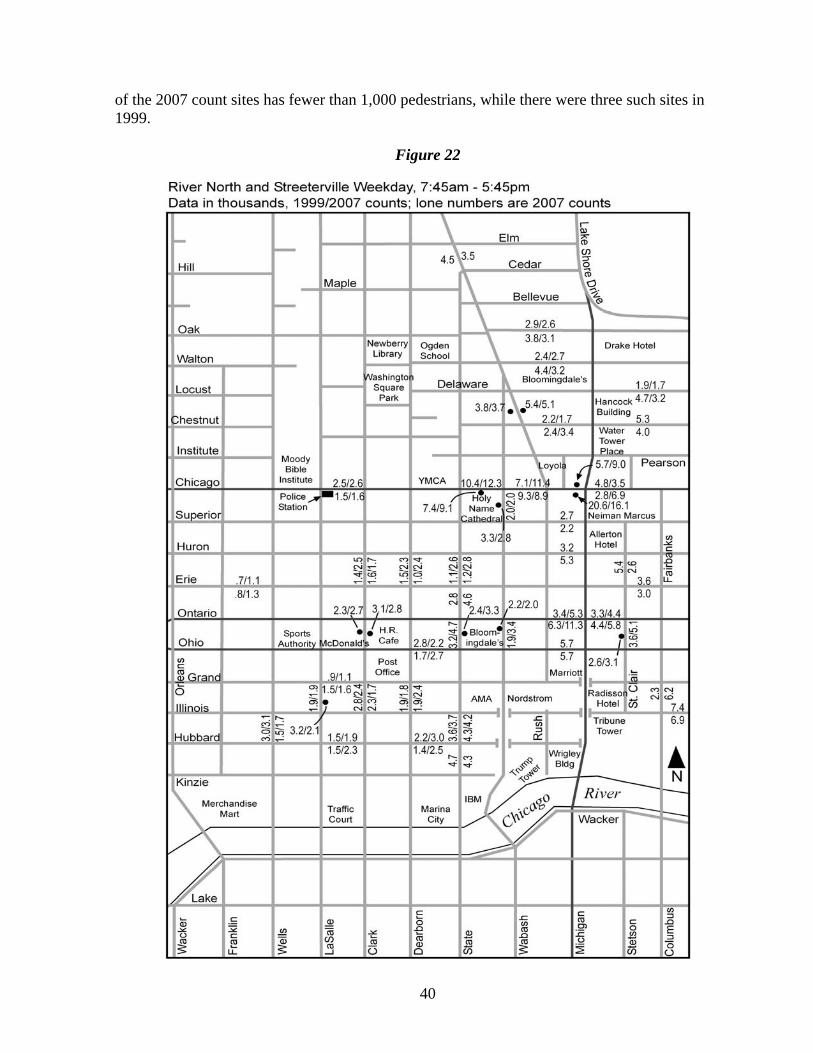
40
of the 2007 count sites has fewer than 1,000 pedestrians, while there were three such sites in 1999.
Figure 22
41
In selecting additional sites for counting, an effort was made to identify the areas with the highest pedestrian traffic. Undoubtedly, there are locations in the far western part of Figure 15 that have volumes of less than one thousand. As a whole, the data reported here provide a reasonable sampling of activity in the greater River North area.
Chicago Avenue as a Cross Section of River North
There are five pairs of counts on Chicago Avenue. These provide an instructive cross section. Starting from the west near LaSalle Street, there are about 4,000 pedestrians near the Chicago Avenue Police Station (adding the two sides together). Three blocks to the east there are a combined total of approximately 21,000 pedestrians. A block to the east the combined total remains above 20,000. One more block to the east the total rises to more than 25,000 with the south side of the street dominating. There are some popular stores on the south side of the street and the proximity to Michigan Avenue yields the highest volumes on Figure 22. East of Michigan Avenue the two-side total drops to approximately 10,000. Comparisons with 1999 Data
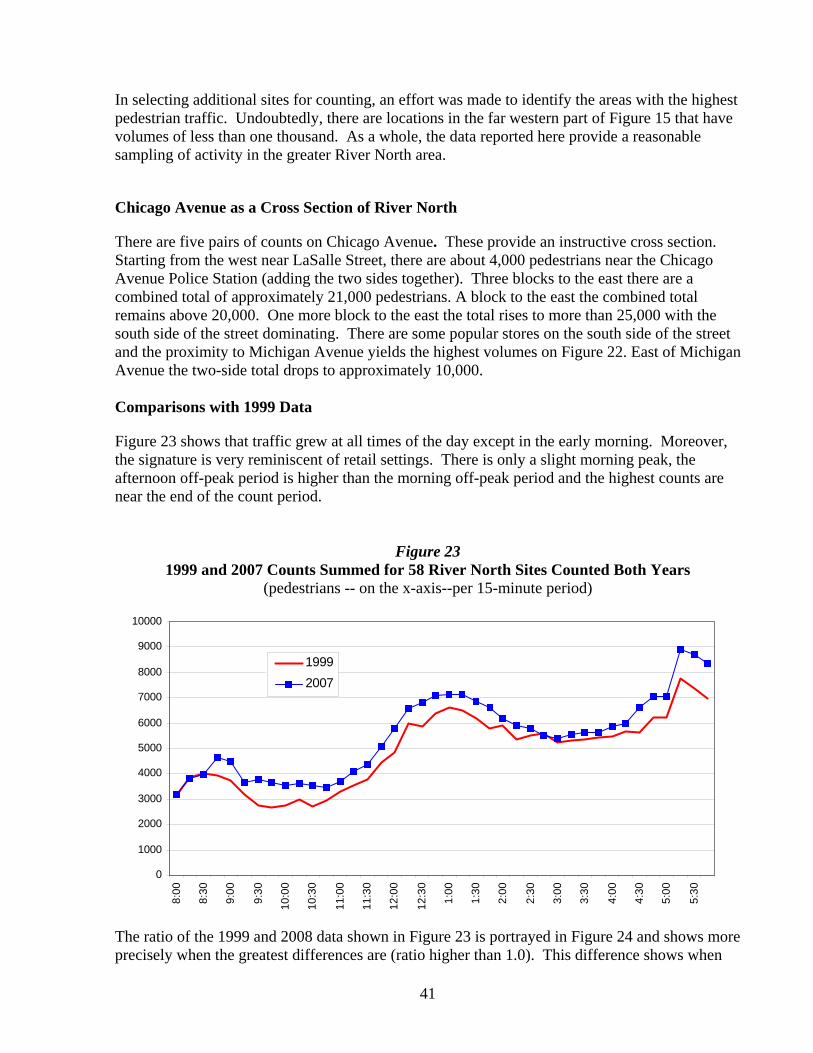
Figure 23 shows that traffic grew at all times of the day except in the early morning. Moreover, the signature is very reminiscent of retail settings. There is only a slight morning peak, the afternoon off-peak period is higher than the morning off-peak period and the highest counts are near the end of the count period.
Figure 23
1999 and 2007 Counts Summed for 58 River North Sites Counted Both Years (pedestrians -- on the x-axis--per 15-minute period)
0
1000
2000
3000
4000
5000
6000
7000
8000
9000
10000
8:00
8:30
9:00
9:30
10:0
0
10:3
0
11:0
0
11:3
0
12:0
0
12:3
0
1:00
1:30
2:00
2:30
3:00
3:30
4:00
4:30
5:00
5:30
19992007
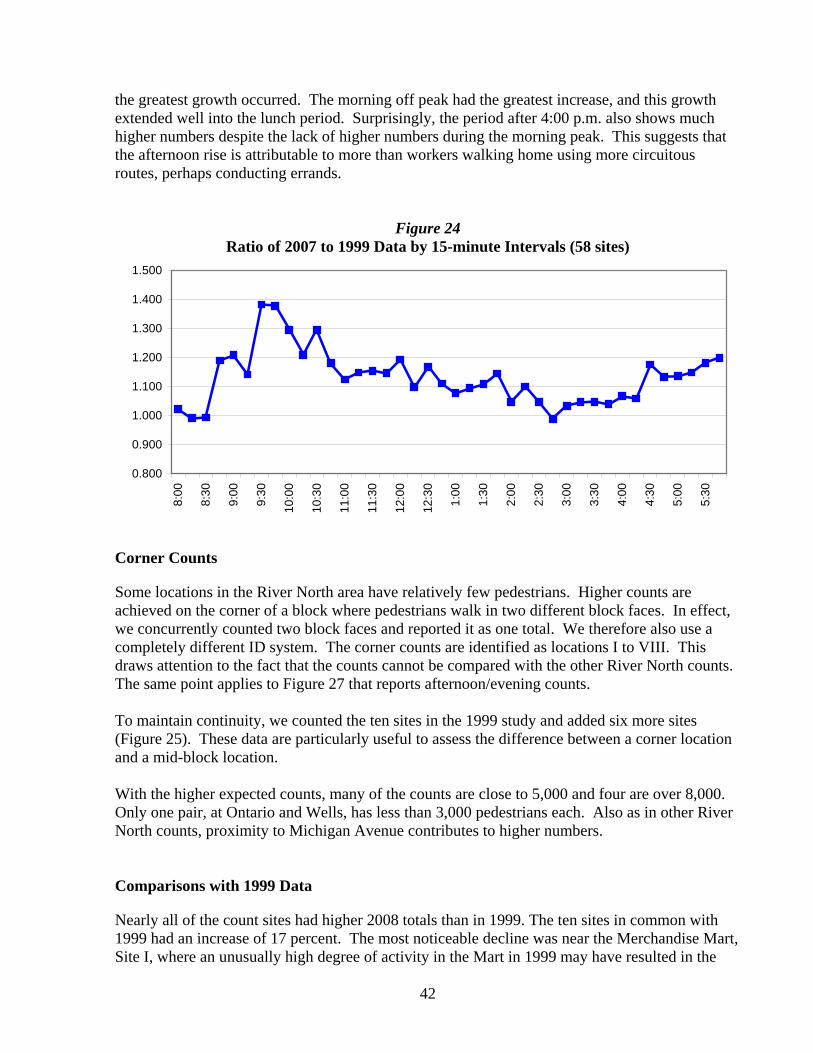
The ratio of the 1999 and 2008 data shown in Figure 23 is portrayed in Figure 24 and shows more precisely when the greatest differences are (ratio higher than 1.0). This difference shows when
42
the greatest growth occurred. The morning off peak had the greatest increase, and this growth extended well into the lunch period. Surprisingly, the period after 4:00 p.m. also shows much higher numbers despite the lack of higher numbers during the morning peak. This suggests that the afternoon rise is attributable to more than workers walking home using more circuitous routes, perhaps conducting errands.
Figure 24 Ratio of 2007 to 1999 Data by 15-minute Intervals (58 sites)
0.800
0.900
1.000
1.100
1.200
1.300
1.400
1.500
8:00
8:30
9:00
9:30
10:0
0
10:3
0
11:0
0
11:3
0
12:0
0
12:3
0
1:00
1:30
2:00
2:30
3:00
3:30
4:00
4:30
5:00
5:30
Corner Counts
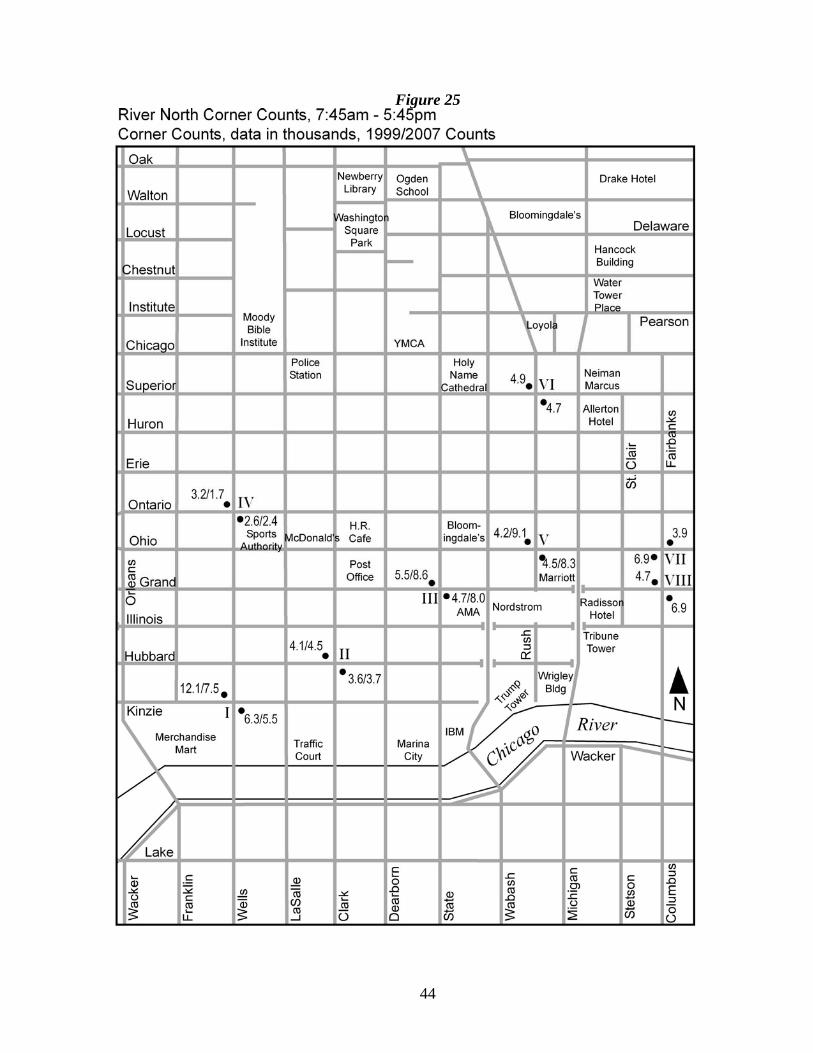
Some locations in the River North area have relatively few pedestrians. Higher counts are achieved on the corner of a block where pedestrians walk in two different block faces. In effect, we concurrently counted two block faces and reported it as one total. We therefore also use a completely different ID system. The corner counts are identified as locations I to VIII. This draws attention to the fact that the counts cannot be compared with the other River North counts. The same point applies to Figure 27 that reports afternoon/evening counts. To maintain continuity, we counted the ten sites in the 1999 study and added six more sites (Figure 25). These data are particularly useful to assess the difference between a corner location and a mid-block location. With the higher expected counts, many of the counts are close to 5,000 and four are over 8,000. Only one pair, at Ontario and Wells, has less than 3,000 pedestrians each. Also as in other River North counts, proximity to Michigan Avenue contributes to higher numbers. Comparisons with 1999 Data
Nearly all of the count sites had higher 2008 totals than in 1999. The ten sites in common with 1999 had an increase of 17 percent. The most noticeable decline was near the Merchandise Mart, Site I, where an unusually high degree of activity in the Mart in 1999 may have resulted in the
43
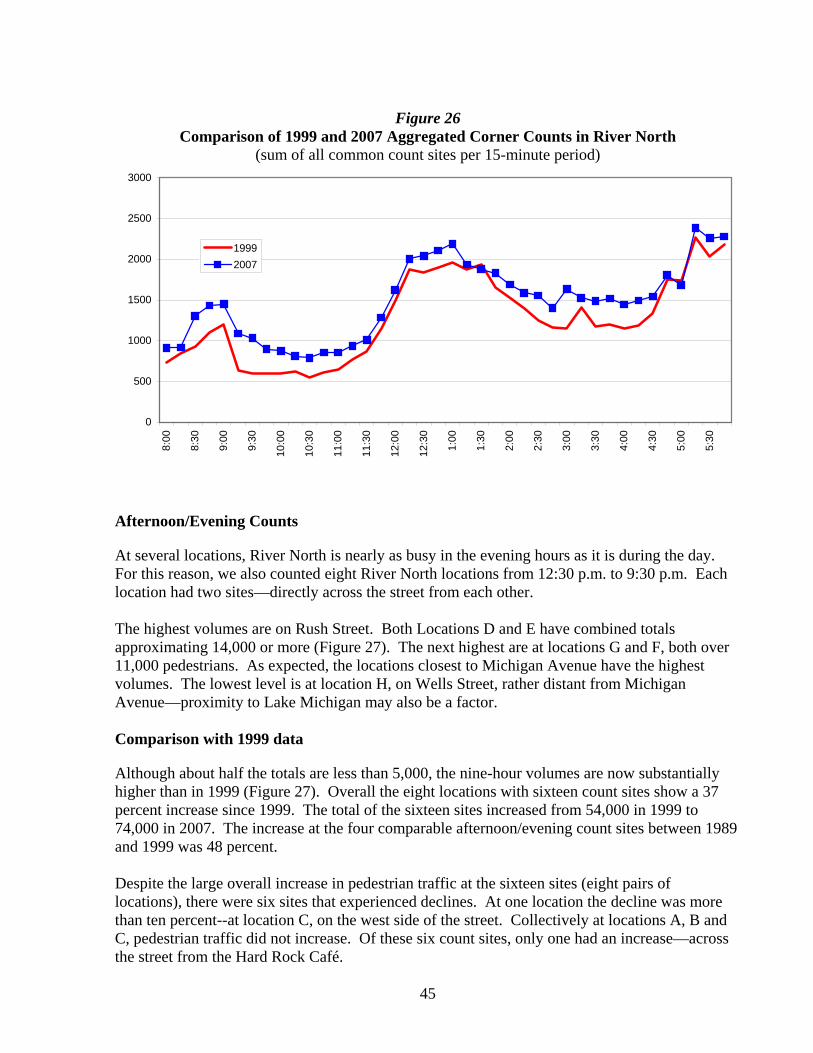
much higher 1999 count. The 1999 counts at Site I were approximately 90 percent higher than in 1989 suggesting that the pedestrian traffic on that day was inordinately high. This is unusual and typically only occurs when one traffic generator dominates and has substantial fluctuations from week to week. The other site with lower counts is on the corner of Ontario and Wells where Planet Hollywood was located. It closed between the 1999 and 2007 counts. Figure 26 shows that the growth occurred throughout the day at the corner count locations. River North (Figure 23) also had growth throughout the day rather than predominantly at the morning and evening peaks.
44
Figure 25
45
Figure 26
Comparison of 1999 and 2007 Aggregated Corner Counts in River North (sum of all common count sites per 15-minute period)
0
500
1000
1500
2000
2500
30008:
00
8:30
9:00
9:30
10:0
0
10:3
0
11:0
0
11:3
0
12:0
0
12:3
0
1:00
1:30
2:00
2:30
3:00
3:30
4:00
4:30
5:00
5:30
19992007
Afternoon/Evening Counts
At several locations, River North is nearly as busy in the evening hours as it is during the day. For this reason, we also counted eight River North locations from 12:30 p.m. to 9:30 p.m. Each location had two sites—directly across the street from each other. The highest volumes are on Rush Street. Both Locations D and E have combined totals approximating 14,000 or more (Figure 27). The next highest are at locations G and F, both over 11,000 pedestrians. As expected, the locations closest to Michigan Avenue have the highest volumes. The lowest level is at location H, on Wells Street, rather distant from Michigan Avenue—proximity to Lake Michigan may also be a factor. Comparison with 1999 data
Although about half the totals are less than 5,000, the nine-hour volumes are now substantially higher than in 1999 (Figure 27). Overall the eight locations with sixteen count sites show a 37 percent increase since 1999. The total of the sixteen sites increased from 54,000 in 1999 to 74,000 in 2007. The increase at the four comparable afternoon/evening count sites between 1989 and 1999 was 48 percent. Despite the large overall increase in pedestrian traffic at the sixteen sites (eight pairs of locations), there were six sites that experienced declines. At one location the decline was more than ten percent--at location C, on the west side of the street. Collectively at locations A, B and C, pedestrian traffic did not increase. Of these six count sites, only one had an increase—across the street from the Hard Rock Café.
46
Figure 27
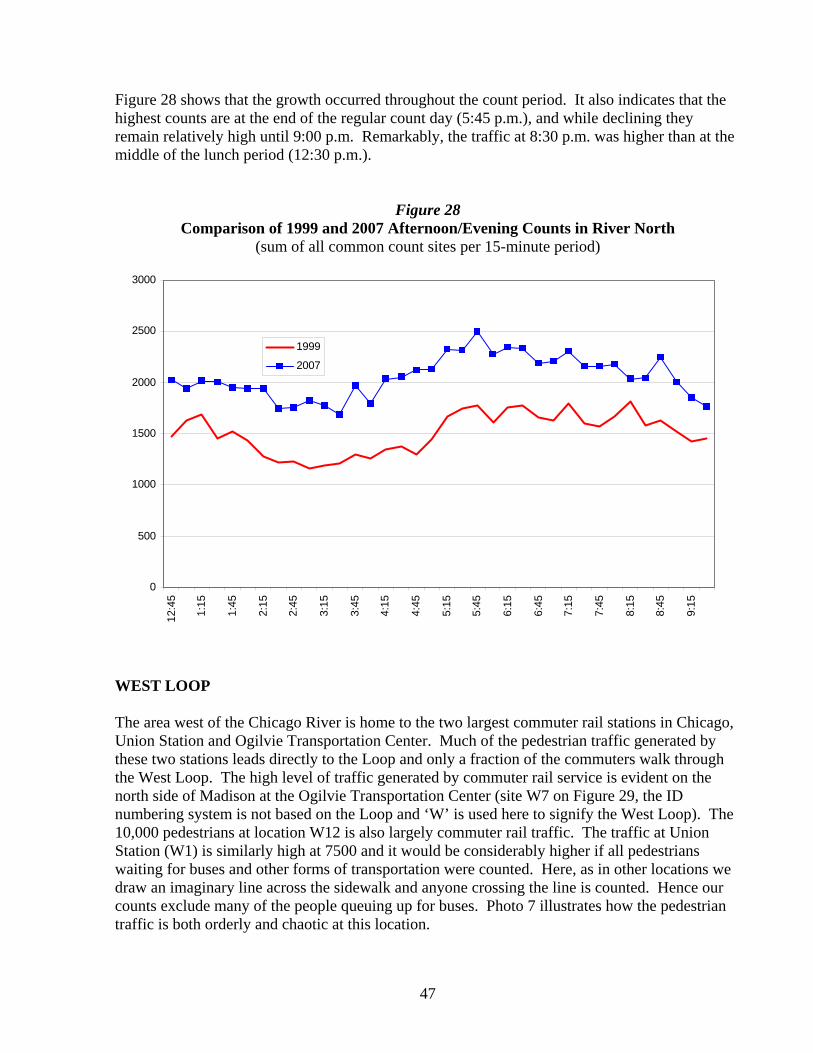
47
Figure 28 shows that the growth occurred throughout the count period. It also indicates that the highest counts are at the end of the regular count day (5:45 p.m.), and while declining they remain relatively high until 9:00 p.m. Remarkably, the traffic at 8:30 p.m. was higher than at the middle of the lunch period (12:30 p.m.).
Figure 28
Comparison of 1999 and 2007 Afternoon/Evening Counts in River North (sum of all common count sites per 15-minute period)
0
500
1000
1500
2000
2500
3000
12:4
5
1:15
1:45
2:15
2:45
3:15
3:45
4:15
4:45
5:15
5:45
6:15
6:45
7:15
7:45
8:15
8:45
9:15
1999
2007
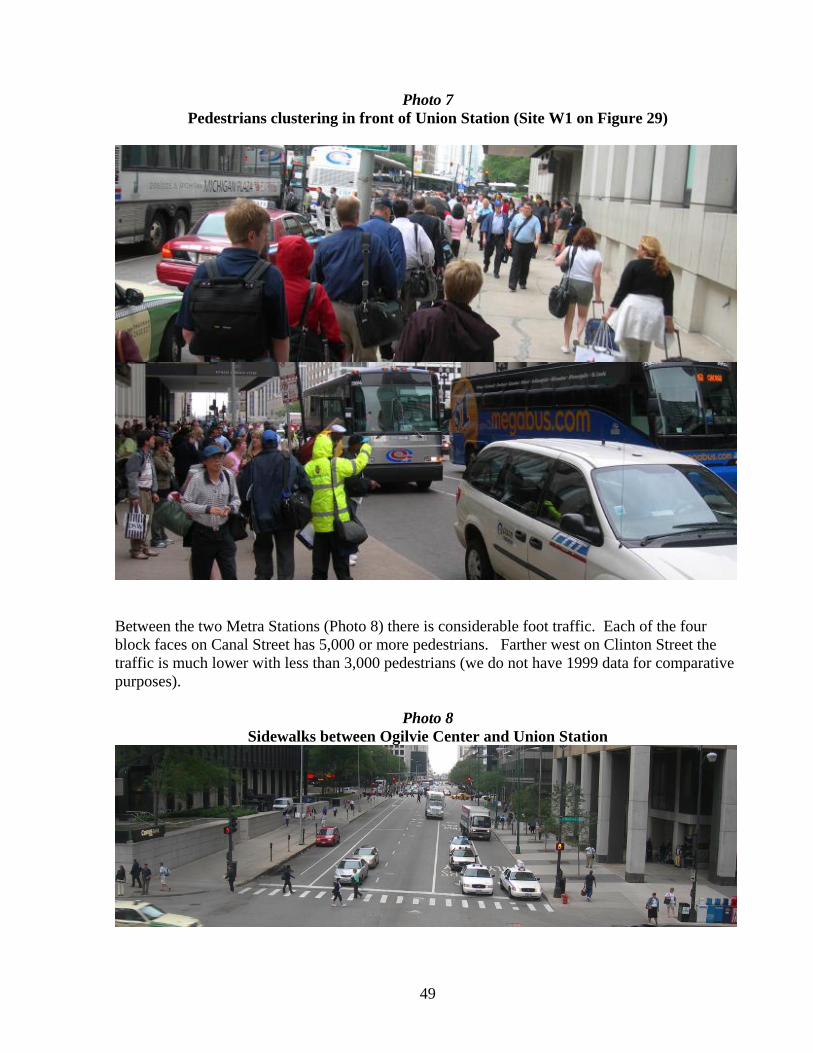
WEST LOOP The area west of the Chicago River is home to the two largest commuter rail stations in Chicago, Union Station and Ogilvie Transportation Center. Much of the pedestrian traffic generated by these two stations leads directly to the Loop and only a fraction of the commuters walk through the West Loop. The high level of traffic generated by commuter rail service is evident on the north side of Madison at the Ogilvie Transportation Center (site W7 on Figure 29, the ID numbering system is not based on the Loop and ‘W’ is used here to signify the West Loop). The 10,000 pedestrians at location W12 is also largely commuter rail traffic. The traffic at Union Station (W1) is similarly high at 7500 and it would be considerably higher if all pedestrians waiting for buses and other forms of transportation were counted. Here, as in other locations we draw an imaginary line across the sidewalk and anyone crossing the line is counted. Hence our counts exclude many of the people queuing up for buses. Photo 7 illustrates how the pedestrian traffic is both orderly and chaotic at this location.

48
Figure 29
49
Photo 7 Pedestrians clustering in front of Union Station (Site W1 on Figure 29)
Between the two Metra Stations (Photo 8) there is considerable foot traffic. Each of the four block faces on Canal Street has 5,000 or more pedestrians. Farther west on Clinton Street the traffic is much lower with less than 3,000 pedestrians (we do not have 1999 data for comparative purposes).
Photo 8
Sidewalks between Ogilvie Center and Union Station
50
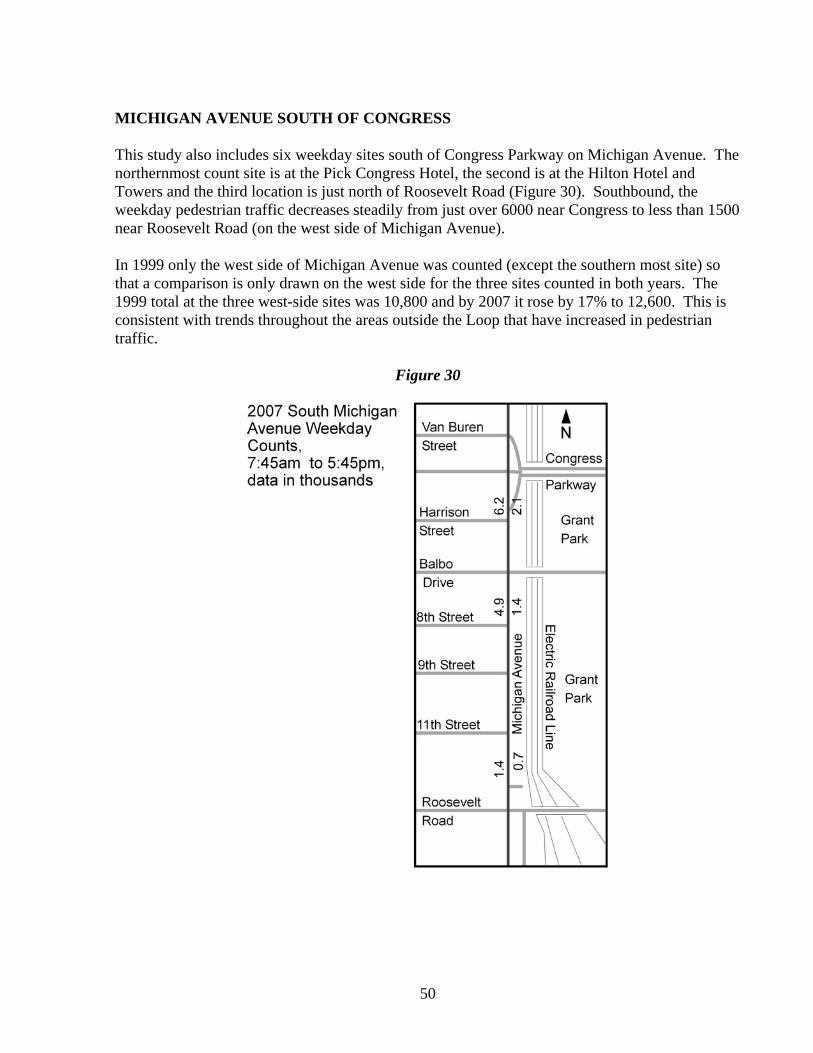
MICHIGAN AVENUE SOUTH OF CONGRESS This study also includes six weekday sites south of Congress Parkway on Michigan Avenue. The northernmost count site is at the Pick Congress Hotel, the second is at the Hilton Hotel and Towers and the third location is just north of Roosevelt Road (Figure 30). Southbound, the weekday pedestrian traffic decreases steadily from just over 6000 near Congress to less than 1500 near Roosevelt Road (on the west side of Michigan Avenue). In 1999 only the west side of Michigan Avenue was counted (except the southern most site) so that a comparison is only drawn on the west side for the three sites counted in both years. The 1999 total at the three west-side sites was 10,800 and by 2007 it rose by 17% to 12,600. This is consistent with trends throughout the areas outside the Loop that have increased in pedestrian traffic.
Figure 30
51
CHAPTER IV. SUMMARY AND CONCLUSIONS
Downtowns of major metropolitan areas are dynamic; they decline, shift and grow. Over the last few decades pedestrian traffic in downtown Chicago has grown but not uniformly. Each neighborhood in the downtown continues to develop its individual character. Much of this is apparent in the study of pedestrian movement and how pedestrians use the downtown and its various amenities. The following section summarizes the overall findings of the pedestrian counts in the greater downtown area and is divided into the various sub areas in the study area. MAJOR PEDESTRIAN-COUNT FINDINGS Overall Study Area
• The number of pedestrian counted is higher than in the previous studies. • The greatest growth is in areas outside of the core Loop, particularly in River North and
Streeterville. Loop
• The number of pedestrians counted in the Loop during the morning and afternoon peak periods is higher than in 1999.
• The number of pedestrians counted during the entire day is slightly lower than in 1999. This is attributable to lower counts during the extended lunch period.
• The highest weekday pedestrian traffic volumes, over 27,000, remain on the Adams and Madison Street bridges crossing the Chicago River near Metra railroad stations and large parking lots.
• Peak 15-minute counts on these bridges are approximately 2,000 pedestrians, the highest weekday levels in the study area.
• The growth in pedestrian traffic since 1999 is largely in the northern portion of the Loop. • There is now two percent more pedestrian traffic on the Chicago River bridges from
Michigan Avenue to Franklin Street and eight percent more pedestrian traffic on the South Branch bridges compared to 1999.
North Michigan Avenue (north of the Chicago River)
• Although the highest pedestrian traffic levels in the 1989 study were on North Michigan Avenue on a Saturday, they increased 30 percent by 1999 and have grown another 16 percent since then.
• On Saturdays approximately a half dozen block faces have tripled in pedestrian traffic since 1986.
• Saturday Water Tower Place counts are still the highest counts in the study area, with nearly 44,000 pedestrians.
• Other than Water Tower Place, the highest Saturday volumes are on the west side of Michigan Avenue between Illinois Street and Chicago Avenue.
• The weekday counts are about two thirds of the Saturday counts.
52
• Weekday pedestrian traffic volumes grew by 25 percent from 1989 to 1999 but grew only one percent since 1999.
• Other than the counts at Water Tower Place and the Wrigley Building, the highest weekday counts are between Huron Street and Chicago Avenue.
State Street
• Despite a number of construction projects that reduced sidewalk width or closed sidewalks during the summer of 2007, pedestrian traffic grew on State Street.
• Weekday pedestrian traffic counts rose by percent since 1999. • The east side of the street has more pedestrian traffic than the west side but planned and
potential developments on the west side may increase these volumes. • Saturday pedestrian traffic increased by 43 percent since 1999 despite closure of Block
37. Pedway
• The Pedway remains an important pedestrian alternative through a congested part of the Chicago downtown.
• Inclement weather contributes to pedestrian traffic in the Pedway. • Currently and in the past few years there have been major closures in the Pedway system
so that comparisons with previous studies, when the entire system was open, are not particularly informative to assess trends.
River North and Streeterville
• While the pedestrian volumes are much lower than in the Loop or on North Michigan Avenue, pedestrian traffic grew by 40 percent from 1989 to 1999 and another 14 percent since 1999.
• At locations counted in the afternoon and evening (12:30 p.m. to 9:30 p.m.), pedestrian traffic grew by 48 percent from 1989 to 1999 and another 37 percent from 1999 to 2007.
• The corner counts were also up, increasing by 17 percent since 1999. • A few locations such as on Chicago Avenue and Ontario have volumes over 10,000 but
many locations have traffic levels between 1,500 and 5,000 pedestrians. West Loop and South Loop
• We do not have 1999 data for comparison, but on average the 2007 data are higher than in River North. This is partly due to the fact that the counts were on Canal and Clinton Streets, close to the Loop and railroad stations.
• We are also counting in the South Loop for the first time. The data here were generally lower than in River North.
• On Michigan Avenue south of Congress Parkway the highest traffic is near the Hilton Hotel with 6200 pedestrian. The pedestrian volume here and at other South Michigan Avenue locations has increased by about 16 percent since 1999.
53
These findings need to be interpreted in the context of what is happening in major metropolitan areas across the nation. Many are experiencing urban sprawl and the emergence of major suburban activity centers. This phenomenon has contributed to the decline of many downtown areas. This study, however, shows that downtown Chicago not only has a large, vibrant core (the Loop) that has retained high levels of pedestrian traffic but it exhibits strong growth to the north, west and south. Pedestrian traffic is at record levels on North Michigan Avenue and the River North area. The bridges into the Loop from the west and north have particularly high pedestrian volumes, even with extensive bus, taxi and boat distributor services available at the major commuter rail stations. Continued growth in River North and North Michigan Avenue pedestrian traffic, could lead to fewer pedestrians in the core of the Loop. Downtown’s expansion now covers a vast territory and its expansion has added to traffic outside the Loop, but it has not diminished some of the intensity of pedestrian activity in the core of the Loop. The morning and evening peak traffic levels are now higher than in 1999 but lunch-period declines have contributed to a modest decrease in Loop pedestrian counts since 1999. As downtown residential and commercial development continues, we can expect pedestrian traffic to remain high. Downtown is now growing outward in all directions. Employment continues to grow in the West Loop in proximity to the two largest commuter rail stations, Union Station and Ogilvie Transportation Center. Large high-rise residential buildings are being built in the South Loop/Museum Campus area. The neighborhoods to the north have expanded entertainment, shopping, residential and employment activity. At the same time Lake Michigan, to the east, continues to attract high-rise residents with views of the lake. These different growth vectors add to the diversity and geographic scope of the downtown. BIBLIOGRAPHY Coldwell Banker, Downtown Chicago Pedestrian Traffic Study, 1986. Department of Planning, Greater Chicago Central Business District Pedestrian Survey and Interview Study, Summer, 1989, 78 pp. Department of Public Works, City of Chicago, 1989 Pedestrian Study. Department of Transportation, City of Chicago, Pedestrian Traffic in the Metra Electric Station Area, May, 1999. Urban Retail Properties, Study of Pedestrian Traffic Intensity on North Michigan Avenue, November, 1999, 18 pp.
54
APPENDIX A
This appendix includes text, maps and a table. It begins with a discussion of the reasons why pedestrian traffic may increase or decrease. This is provided to communicate why changes that are taking place in downtown Chicago are to be expected and are typical of other downtown areas. We also have short discussions about places not counted in this study such as alleys and some construction sites. We have not done so in past studies but a complete assessment of all foot traffic would need to consider this traffic as well. We also have a brief discussion of platooning—how pedestrian flow is affected by traffic signals at intersections. After these discussions the appendix includes the following maps:
• Map displaying pedestrian traffic affected by construction • Block-face identification numbers
REASONS WHY PEDESTRIAN TRAFFIC INCREASES AND DECREASES The volume of pedestrian traffic is not necessarily directly correlated to the growth of office space and retailing activity. A list of reasons is given below indicating why the correlation with pedestrian traffic levels may not be high. Reasons for decreasing pedestrian traffic
• The downtown is growing in overall territory, diffusing the number of pedestrians over a
larger area. There are major office buildings west of the Chicago River and rapid growth in the South Loop.
• Shops destinations are becoming more spread out as new residential areas to the north, west and south these areas have also attract retailers.
• Suburban shopping opportunities, with free parking, draw shoppers away from downtown.
• The population of the Chicago area continues to decentralize. Since the beginning of the millennium the population of Cook County has declined while the population of McHenry County and Will County continue to increase.
• The major Chicago sports venues remain outside the study area. • Telecommunication opportunities may decrease the necessity to walk. The internet may
promote interaction without personal contact—walking to meetings. • Downtown employees may, for professional reasons, remain in their offices, foregoing
trips out of the building, e.g., leaving the building on a coffee break. • Many downtown employees may start work earlier or stay later than the 7:45 a.m. to 5:45
p.m. count period. Staggered work hours and flextime may be more common. Also, recent studies have shown that average work hours are growing.
• Many Loop buildings are self-contained with restaurants and shops. There may be less reason to leave the building. We see this with declining traffic during the lunch period.
55
Reasons for increasing pedestrian traffic
• The Chicago downtown provides greater entertainment and shopping opportunities (e.g., specialty restaurants in River North, the Theater District in the Loop and more shopping choices on Michigan Avenue) attracting more pedestrians.
• Suburban residents coming downtown are likely to walk great distances either from a Metra station or a fringe parking facility.
• The number of residences in and near the edge of downtown is increasing rapidly. • Health-conscious downtown workers and residents may walk longer distances and be
counted more often. PLACES NOT COUNTED We made a serious effort to count all locations in the Loop and representative sites throughout the greater downtown area. In the Loop there were two places that we did not count: construction sites with highly restricted traffic and alleys. Both of these places have very little pedestrian activity and the volume of traffic at these sites is far less interesting to commercial and public interests than typical sidewalks. Construction At numerous sites there was construction activity. We have therefore prepared a construction map in the Appendix (Figures A.1 and A.2). At several locations the sidewalk was completely closed. This was the case on all block faces of Block 37 (bounded by Randolph, State, Dearborn and Washington Streets). One side of three bridge sidewalks were also closed—Monroe, Wabash and Van Buren. Alleys This study did not count pedestrian traffic in alleys (Photo A.1) nor did the previous three studies. During the peak periods there is a fair amount of pedestrian activity in the alleys located in the southwestern portion of the Loop. The east-west alley system access the Elevated station at Quincy Street and many of the CTA patrons find the alley to be convenient route to and from their destination. This is also true for other alleys leading to the Elevated station. Platooning The count sites are typically located in the middle of the block, so if the traffic light at each end of the block changes simultaneously, the two directions
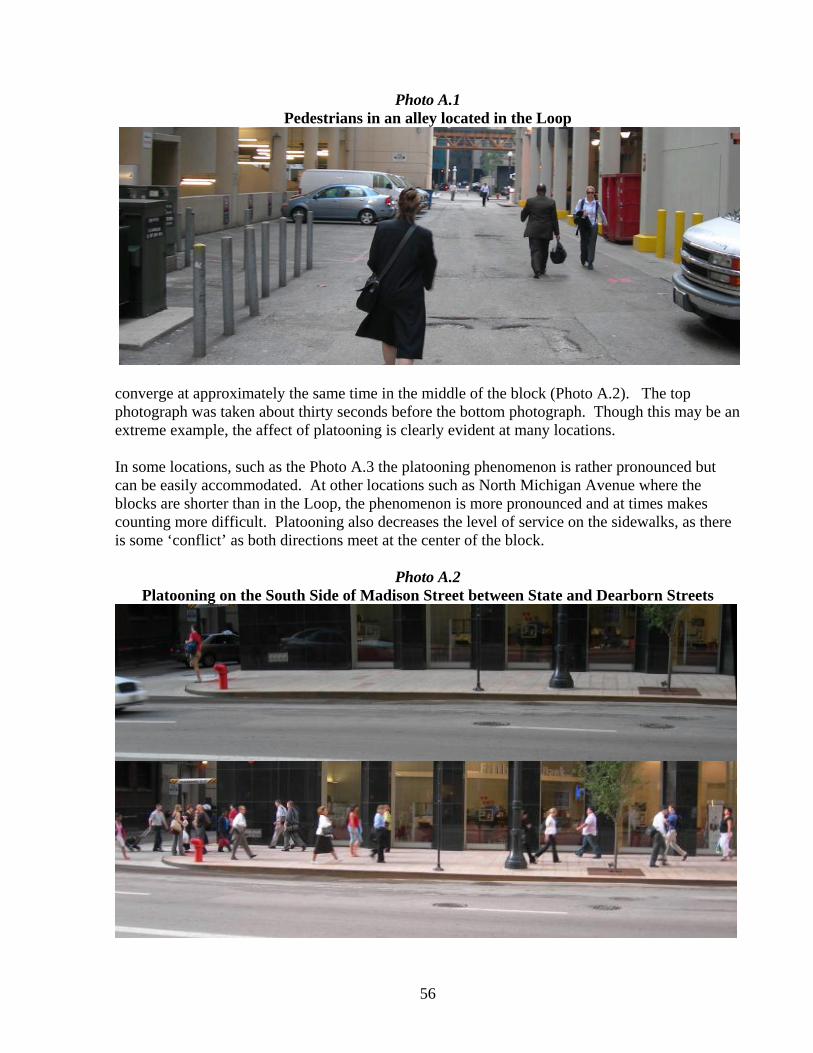
56
Photo A.1 Pedestrians in an alley located in the Loop
converge at approximately the same time in the middle of the block (Photo A.2). The top photograph was taken about thirty seconds before the bottom photograph. Though this may be an extreme example, the affect of platooning is clearly evident at many locations. In some locations, such as the Photo A.3 the platooning phenomenon is rather pronounced but can be easily accommodated. At other locations such as North Michigan Avenue where the blocks are shorter than in the Loop, the phenomenon is more pronounced and at times makes counting more difficult. Platooning also decreases the level of service on the sidewalks, as there is some ‘conflict’ as both directions meet at the center of the block.
Photo A.2
Platooning on the South Side of Madison Street between State and Dearborn Streets
57
Maps This section includes four maps. The first two (Figure A.1 and A.2) show the sites that had construction activity during the summer of 2007. The first map covers the Loop and the second one covers River North south of Chicago Avenue. The next two maps (Figure A.3 and A.4) provide the keys to the block-face identification system used in this and previous studies. The maps are essential in using the spreadsheets that provide the 15-minute counts. Acknowledgments This report was produced by a group of specialists including Siim Sööt and Ashish Sen representing TransInfo LLC and David Philips and Michael Lev of TransSystems LLC. The data collection was supervised and coordinated by Siim Sööt. The data-collection team included Dionne Ballinger, Lachan Band, Zachery Blair, Corbin Branch, Mike Brown, Stacey Dahmm, Christopher Davis, Rebbeca Deeb, Ian Dobbins, Anthony Forde, Adrianna Fernandez, Jimmy Gleason, Matiel Lattimer, Dusta Leo, Kaarin McCarthy, Ravin Mudiappa, Laurel Park, Sindi Palomino, Fernando Palomino, Eduard Pulst, Celestine Thornhill, Nelli Vahter. Also assisting in the project were Marika Dwyer, Peter Dwyer, Mari-Ann Karolin-Costanzo, Reet Pulme and Matt Stratton.
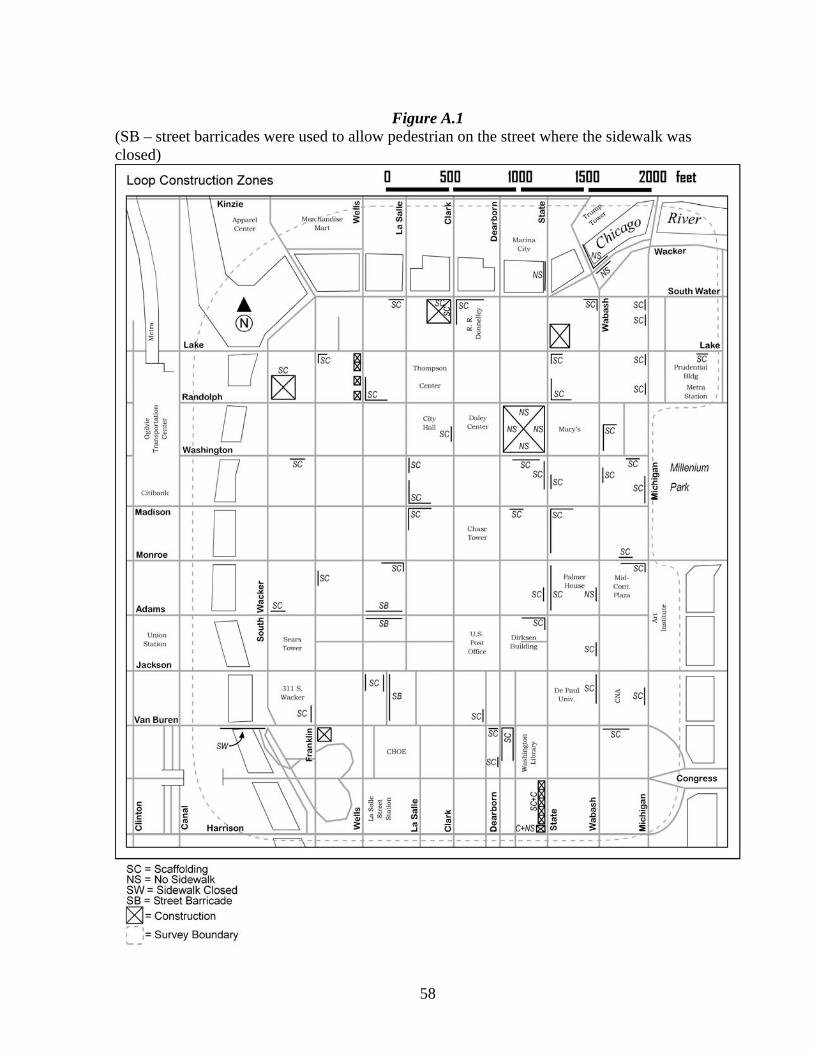
58
Figure A.1
(SB – street barricades were used to allow pedestrian on the street where the sidewalk was closed)
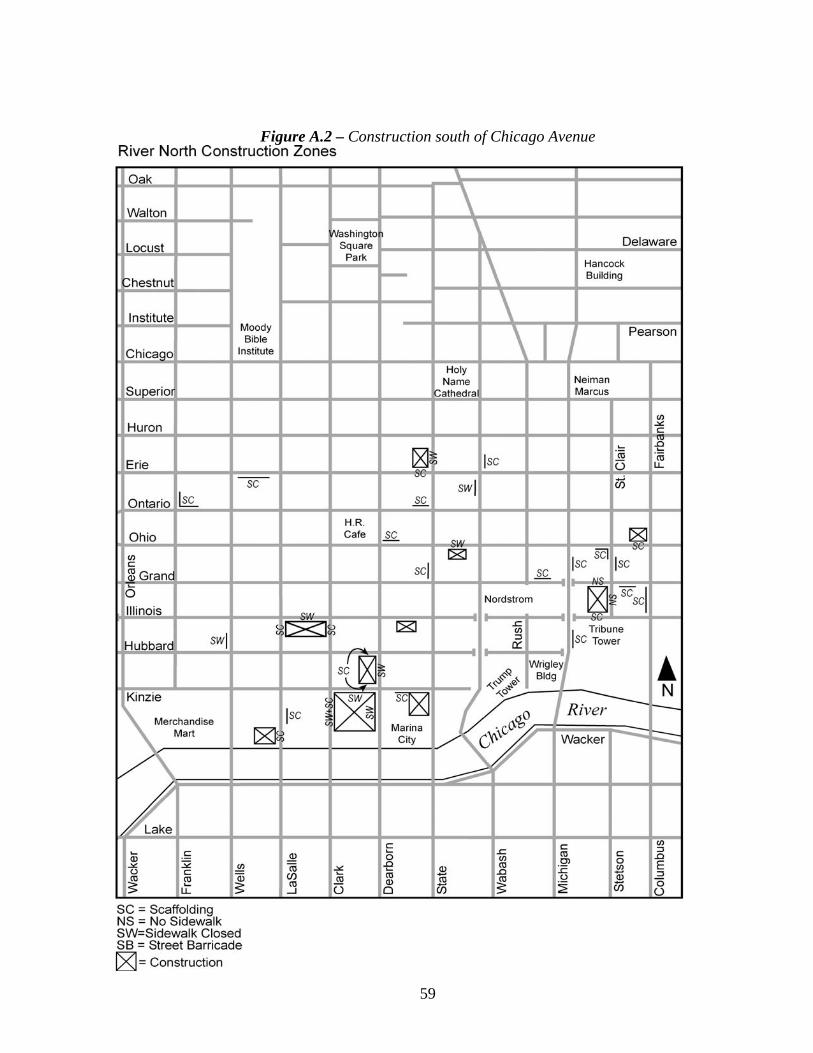
59
Figure A.2 – Construction south of Chicago Avenue
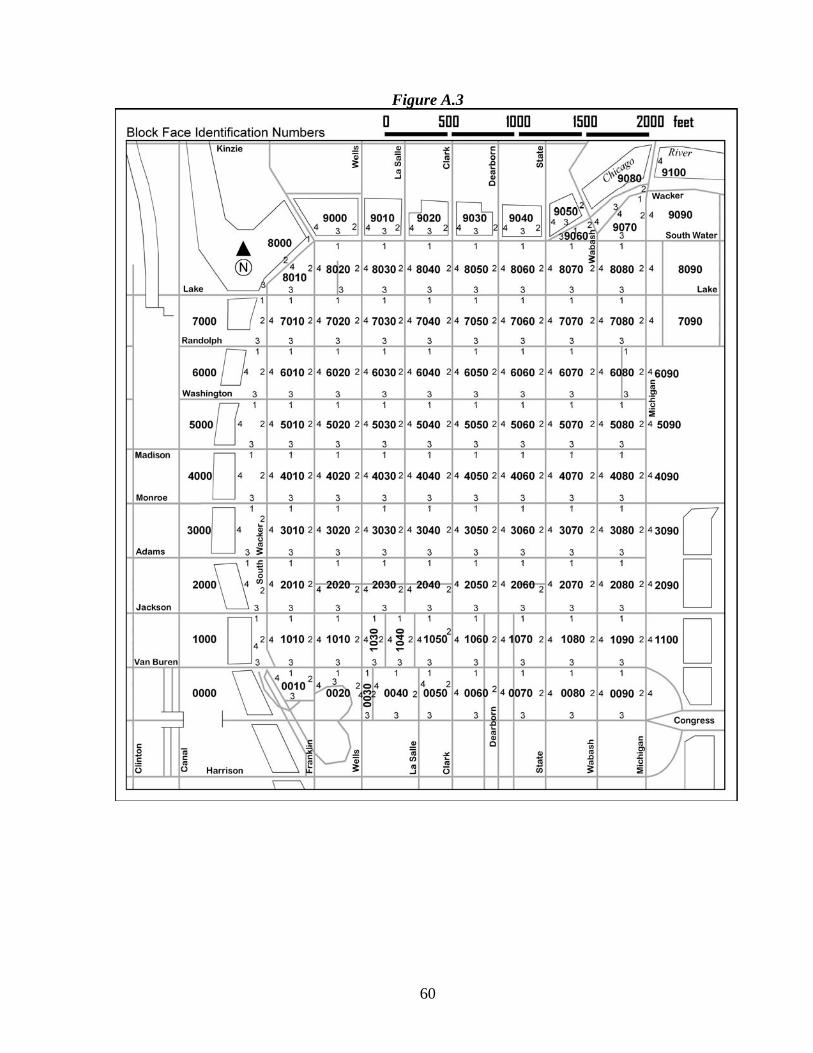
60
Figure A.3
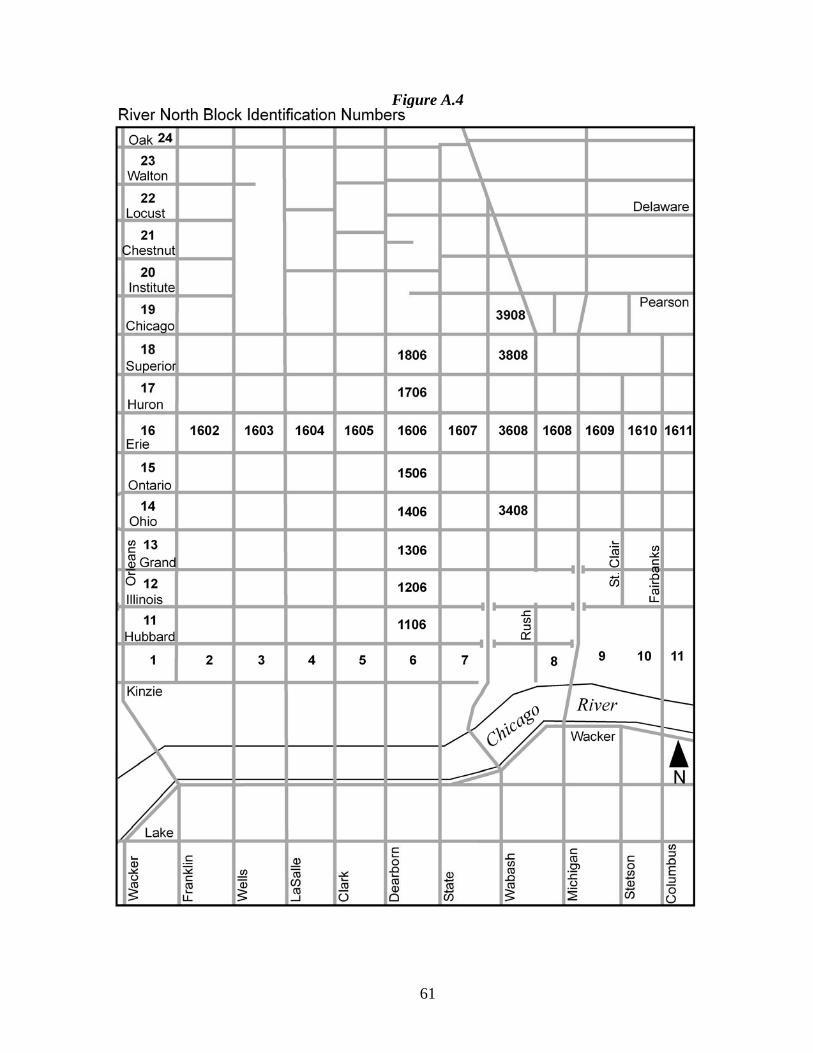
61
Figure A.4