visual controls at the workface of road...
TRANSCRIPT

VISUAL CONTROLS AT THE WORKFACE OF ROAD CONSTRUCTION AND MAINTENANCE : PRELIMINARY
REPORT
Algan TezelZeeshan Aziz
May 2015

i
All rights reserved; no part of this publication may be reproduced, stored in a retrieval system, or transmitted in any
form or by any means, electronic, mechanical, photopying, recording, or otherwise without prior written permission
of the copyright owner. However, there is no restriction on the onward circulation of this report in electronic form provided it is transmitted in its entirety.
Permission to use copyright material has been sought and obtained where possible. While all reasonable efforts
have been made by the University of Salford to trace and obtain permission from copyright holders some material
may have been included where this has proven impossible within the time limits available. The University of Salford
will be pleased to make amends to any such copyright holders at the earliest possible opportunity. Please contact [email protected]
© Algan Tezel, Zeeshan Aziz
Contacting Authors:If you would like to find out more about this project please contact any of the following authors:
Algan Tezel Zeeshan AzizResearch Fellow Senior Lecturer
University of Salford University of Salford
[email protected] [email protected]
School of the Built Environment, University of Salford, Maxwell Building, Salford M5 4WT, United Kingdom
Tel: +44 (0) 161 295 4600 Web: www.salford.ac.uk
ii
Executive Summary �������������������������������������������������������������������������������������������������������������� 1
Visual Management �������������������������������������������������������������������������������������������������������������� 2
Visual Management Implementation Framework ������������������������������������������������������������������� 5
Theory of Visual Controls �������������������������������������������������������������������������������������������������������������� 8
Visual Controls in Production and Logistics Management ��������������������������������������������� 9
Visual Controls in Production Levelling ��������������������������������������������������������������������������� 12
Visual Controls in Work Processing �������������������������������������������������������������������������������������� 15
Visual Controls in Project Planning and Control ����������������������������������������������������������������� 16
Visual Controls in Quality Management ��������������������������������������������������������������������������� 17
Visual Controls in Total Productive Maintenance (TPM) and Safety Management ����������� 20
Critical Points in Implementing Visual Management and Visual Controls in Construction 22
Research Method ���������������������������������������������������������������������������������������������������������������������� 23
Visual Management and Visual Controls Implementation Steps/Recommendations 24
Possible Areas of Implementation for Highways England ������������������������������������������������������ 25
Conclusion �� �������������������������������������������������������������������������������������������������������������������������������� 26
References �� �������������������������������������������������������������������������������������������������������������������������������� 27
Table of Contents
1
Executive SummaryVisual Management (VM) is a fundamental element of the lean production system that
relies on the effectiveness of sensory communication to realise the lean production/construc-tion goals. VM can be implemented by following certain frameworks in an incremental fash-ion. Visual controls are one of the main tools of VM that are used to limit and guide process outcomes. They are generally adopted in production management, process, safety, quality, and maintenance management efforts. VM and visual controls have extensively been an important part of lean construction initiatives for a while. Their implementation is also envisioned to be relevant to highway construction and maintenance projects. A set of critical points, general recommendations and possible areas of implementation for VM and visual controls identified from both research and practical experience are presented in this report.
2
Visual Management Visual Management is the managerial strategy (neither a technique nor a tool) of con-
sciously integrating visual (sensory) information into processes to increase process transpar-ency and self-management capabilities at a workplace (Greif, 1991). It is generally adopted at the operational level (Suzaki, 1993). Some VM benefits include increased information sharing and collaboration, worker autonomy, elimination of information related non-value adding activities (e.g. asking, counting, wondering, thinking, searching, testing etc.), reduced opera-tional defects/errors, fostering continuous improvement and quick exposure of abnormalities (Galsworth, 1997).
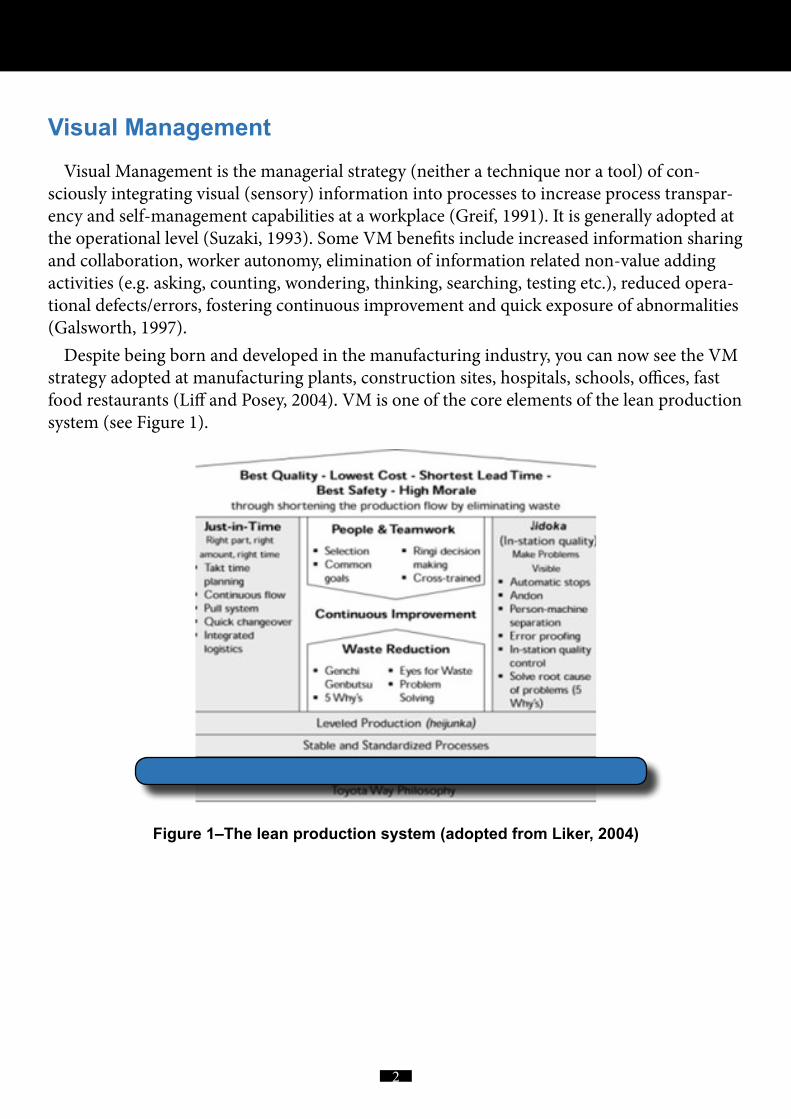
Despite being born and developed in the manufacturing industry, you can now see the VM strategy adopted at manufacturing plants, construction sites, hospitals, schools, offices, fast food restaurants (Liff and Posey, 2004). VM is one of the core elements of the lean production system (see Figure 1).
Figure 1–The lean production system (adopted from Liker, 2004)
3
The lean production system dictates visualisation of its fundamental process pillars, such as just-in-time production, continuous improvement and in-station quality. Thus, it can be said that VM binds those systems with human beings as a lean communication system by answer-ing the frequently asked questions (see Figure 2). VM in construction is generally discussed in the lean construction related papers with a focus on building construction projects.
Figure 2–VM provides answers for the frequently asked questions
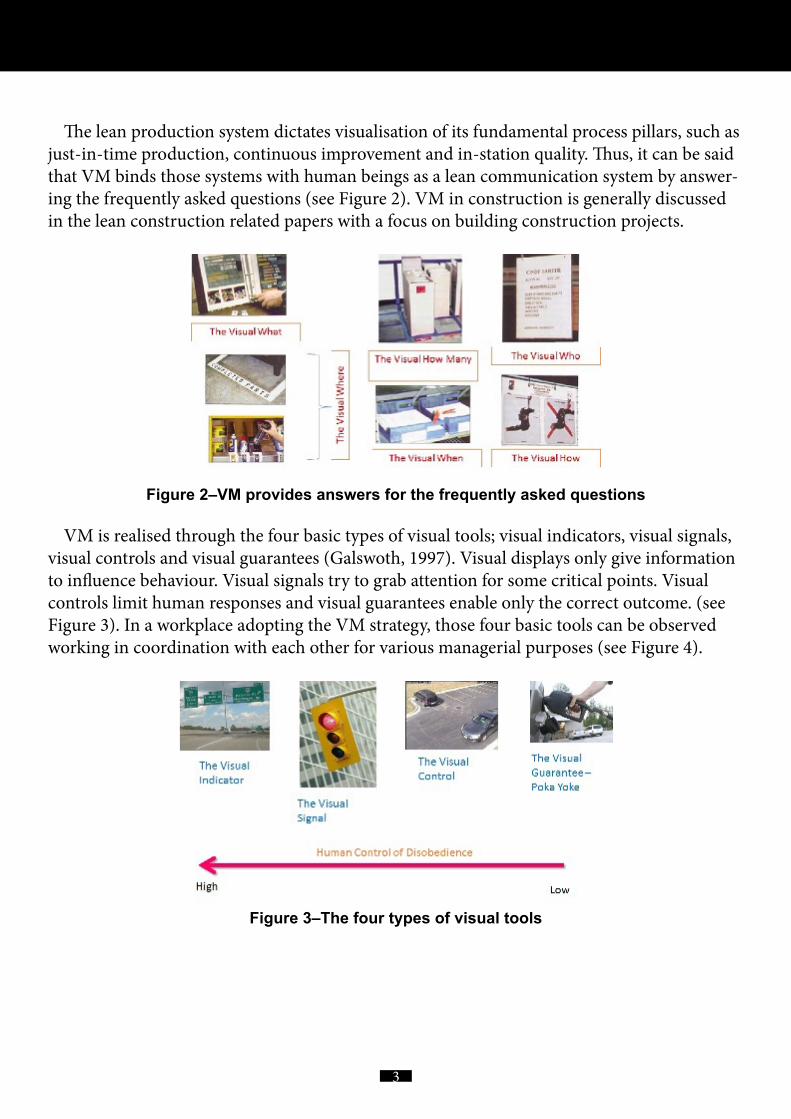
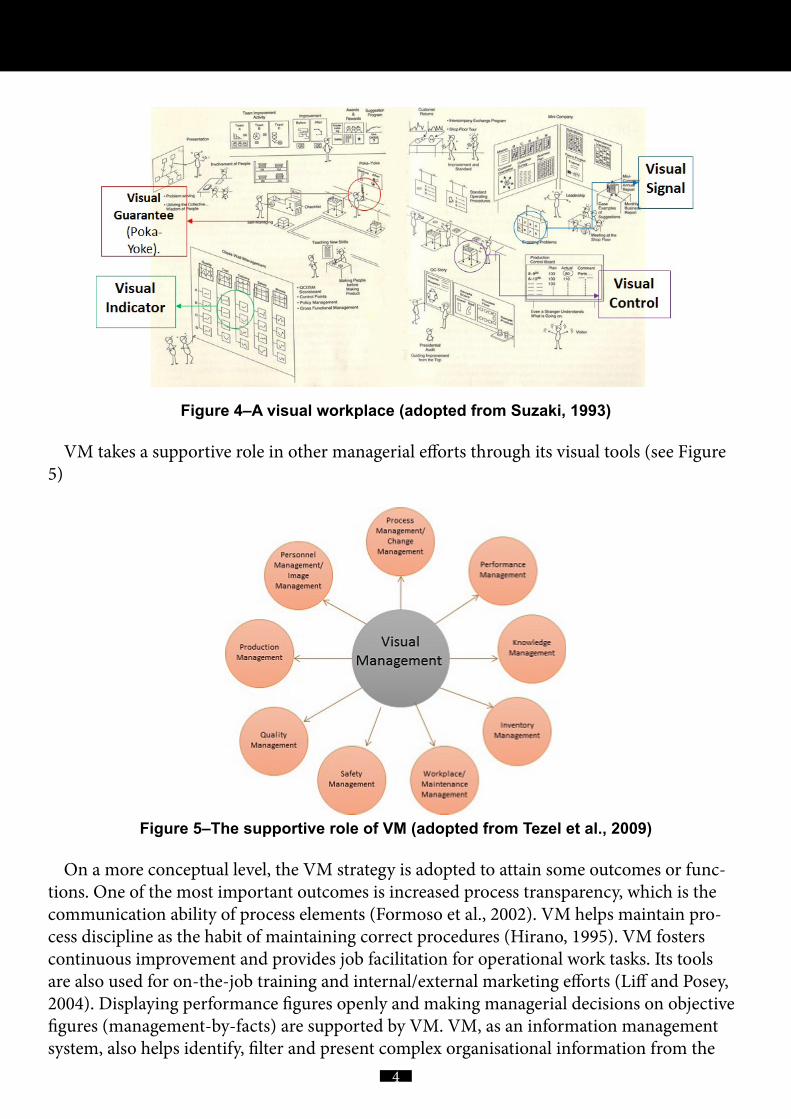
VM is realised through the four basic types of visual tools; visual indicators, visual signals, visual controls and visual guarantees (Galswoth, 1997). Visual displays only give information to influence behaviour. Visual signals try to grab attention for some critical points. Visual controls limit human responses and visual guarantees enable only the correct outcome. (see Figure 3). In a workplace adopting the VM strategy, those four basic tools can be observed working in coordination with each other for various managerial purposes (see Figure 4).
Figure 3–The four types of visual tools
4
Figure 4–A visual workplace (adopted from Suzaki, 1993)
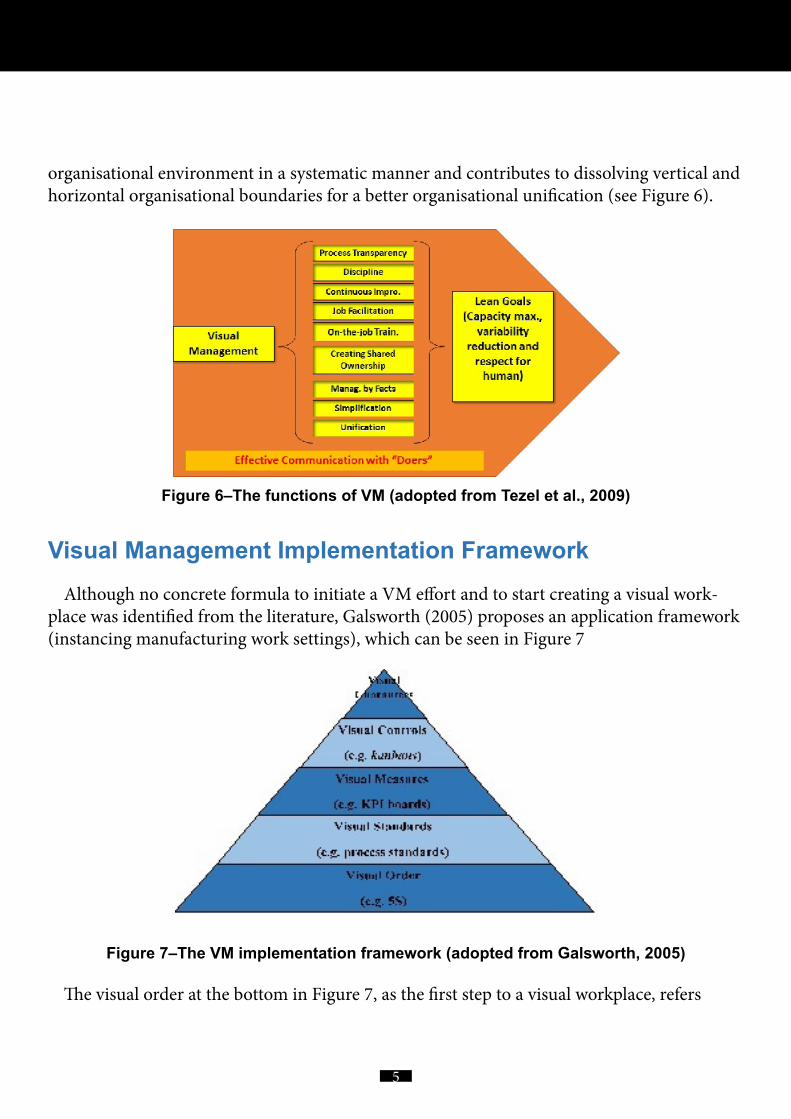
VM takes a supportive role in other managerial efforts through its visual tools (see Figure 5)
Figure 5–The supportive role of VM (adopted from Tezel et al., 2009)
On a more conceptual level, the VM strategy is adopted to attain some outcomes or func-tions. One of the most important outcomes is increased process transparency, which is the communication ability of process elements (Formoso et al., 2002). VM helps maintain pro-cess discipline as the habit of maintaining correct procedures (Hirano, 1995). VM fosters continuous improvement and provides job facilitation for operational work tasks. Its tools are also used for on-the-job training and internal/external marketing efforts (Liff and Posey, 2004). Displaying performance figures openly and making managerial decisions on objective figures (management-by-facts) are supported by VM. VM, as an information management system, also helps identify, filter and present complex organisational information from the
5
organisational environment in a systematic manner and contributes to dissolving vertical and horizontal organisational boundaries for a better organisational unification (see Figure 6).
Figure 6–The functions of VM (adopted from Tezel et al., 2009)
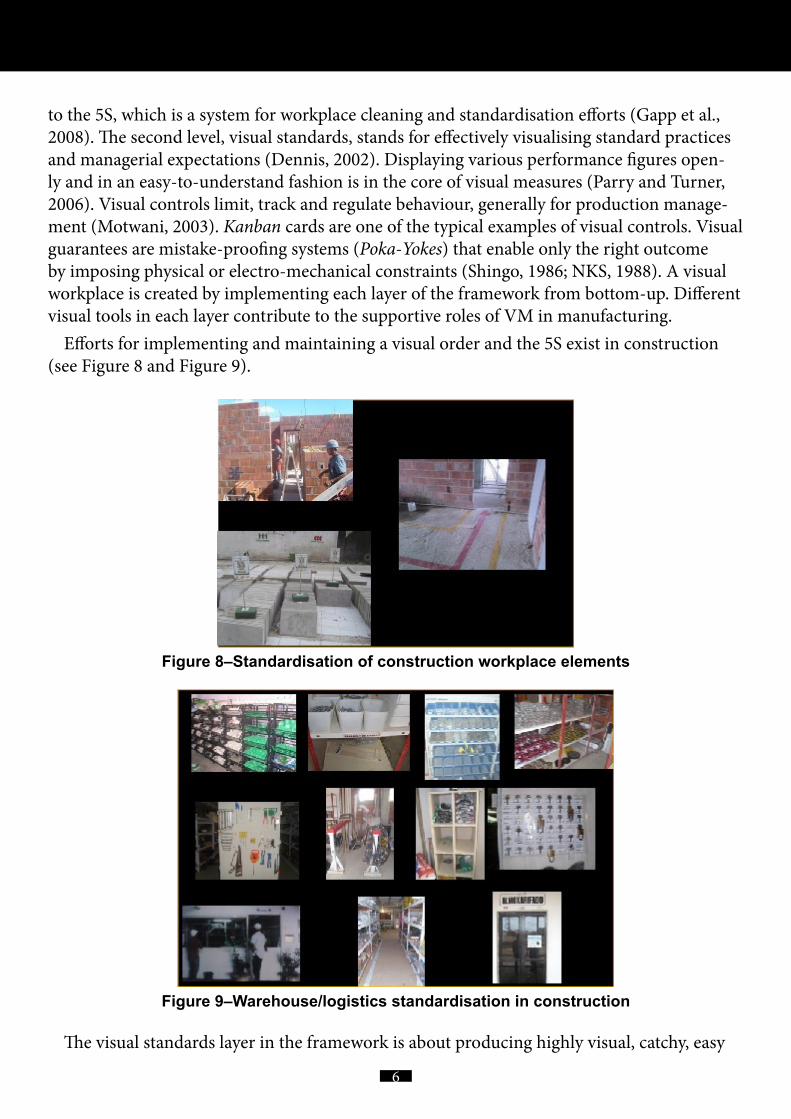
Visual Management Implementation FrameworkAlthough no concrete formula to initiate a VM effort and to start creating a visual work-
place was identified from the literature, Galsworth (2005) proposes an application framework (instancing manufacturing work settings), which can be seen in Figure 7
Figure 7–The VM implementation framework (adopted from Galsworth, 2005)
The visual order at the bottom in Figure 7, as the first step to a visual workplace, refers
6
to the 5S, which is a system for workplace cleaning and standardisation efforts (Gapp et al., 2008). The second level, visual standards, stands for effectively visualising standard practices and managerial expectations (Dennis, 2002). Displaying various performance figures open-ly and in an easy-to-understand fashion is in the core of visual measures (Parry and Turner, 2006). Visual controls limit, track and regulate behaviour, generally for production manage-ment (Motwani, 2003). Kanban cards are one of the typical examples of visual controls. Visual guarantees are mistake-proofing systems (Poka-Yokes) that enable only the right outcome by imposing physical or electro-mechanical constraints (Shingo, 1986; NKS, 1988). A visual workplace is created by implementing each layer of the framework from bottom-up. Different visual tools in each layer contribute to the supportive roles of VM in manufacturing.
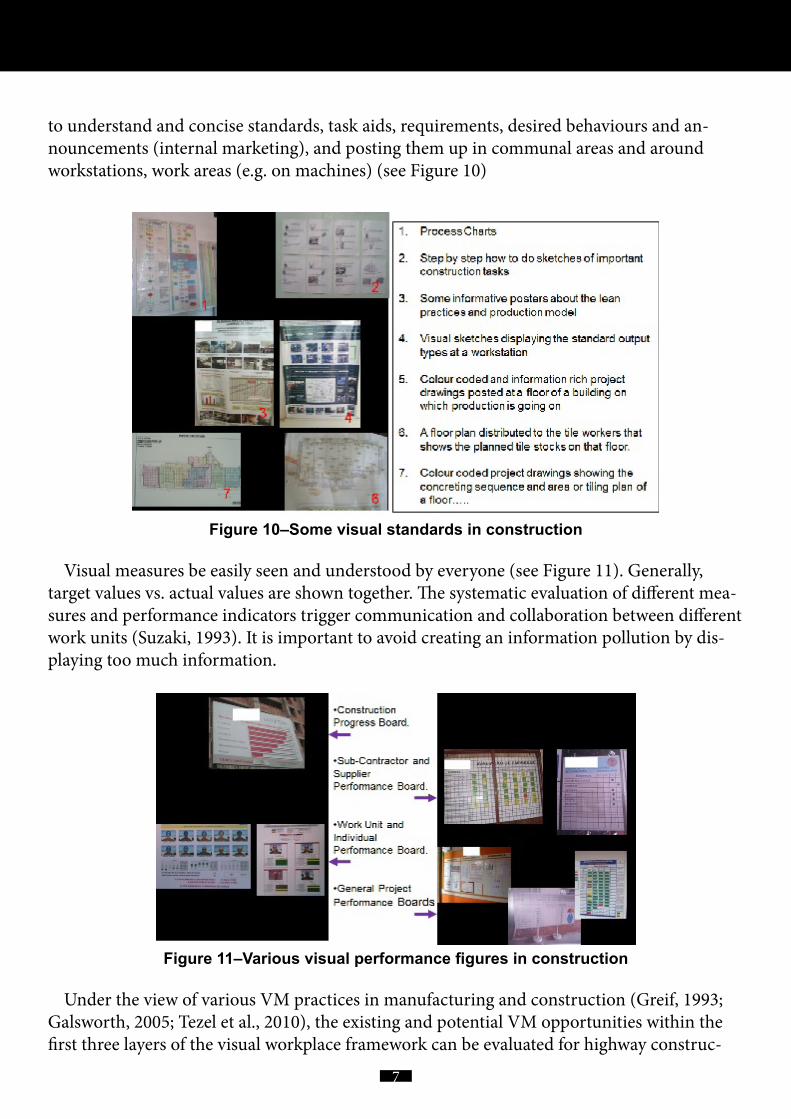
Efforts for implementing and maintaining a visual order and the 5S exist in construction (see Figure 8 and Figure 9).
Figure 8–Standardisation of construction workplace elements
Figure 9–Warehouse/logistics standardisation in construction
The visual standards layer in the framework is about producing highly visual, catchy, easy
7
to understand and concise standards, task aids, requirements, desired behaviours and an-nouncements (internal marketing), and posting them up in communal areas and around workstations, work areas (e.g. on machines) (see Figure 10)
Figure 10–Some visual standards in construction
Visual measures be easily seen and understood by everyone (see Figure 11). Generally, target values vs. actual values are shown together. The systematic evaluation of different mea-sures and performance indicators trigger communication and collaboration between different work units (Suzaki, 1993). It is important to avoid creating an information pollution by dis-playing too much information.
Figure 11–Various visual performance figures in construction
Under the view of various VM practices in manufacturing and construction (Greif, 1993; Galsworth, 2005; Tezel et al., 2010), the existing and potential VM opportunities within the first three layers of the visual workplace framework can be evaluated for highway construc-
8
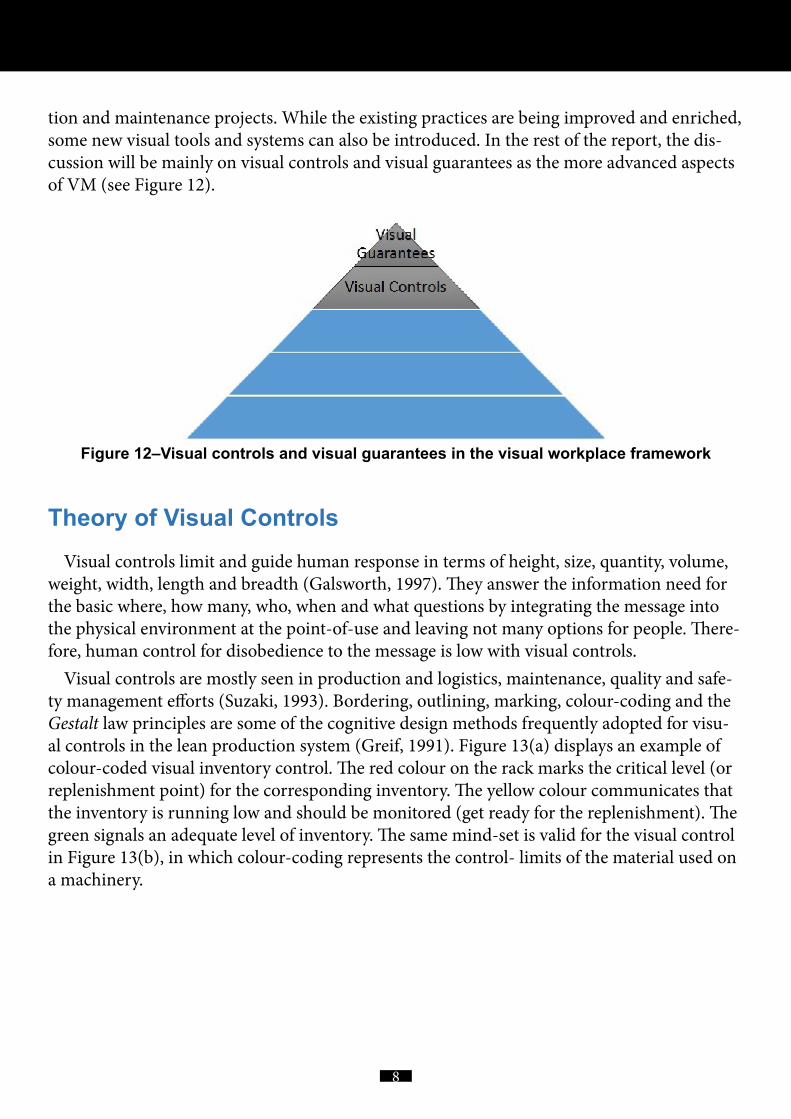
tion and maintenance projects. While the existing practices are being improved and enriched, some new visual tools and systems can also be introduced. In the rest of the report, the dis-cussion will be mainly on visual controls and visual guarantees as the more advanced aspects of VM (see Figure 12).
Figure 12–Visual controls and visual guarantees in the visual workplace framework
Theory of Visual ControlsVisual controls limit and guide human response in terms of height, size, quantity, volume,
weight, width, length and breadth (Galsworth, 1997). They answer the information need for the basic where, how many, who, when and what questions by integrating the message into the physical environment at the point-of-use and leaving not many options for people. There-fore, human control for disobedience to the message is low with visual controls.
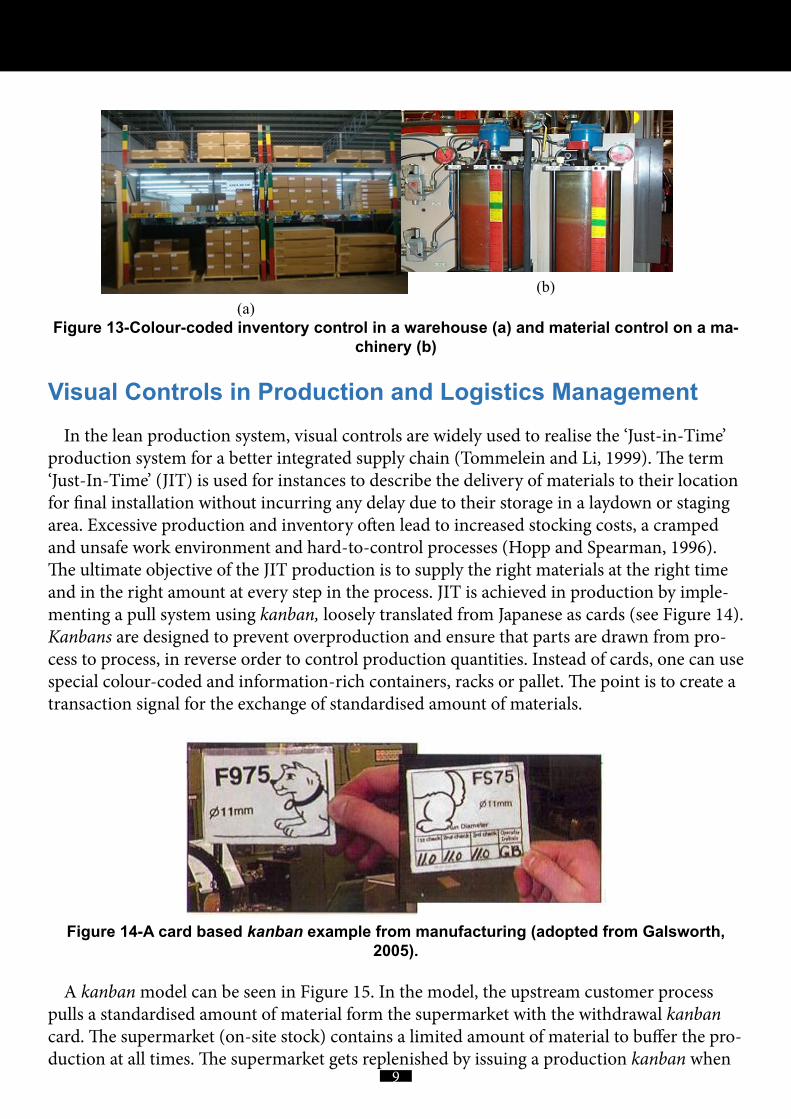
Visual controls are mostly seen in production and logistics, maintenance, quality and safe-ty management efforts (Suzaki, 1993). Bordering, outlining, marking, colour-coding and the Gestalt law principles are some of the cognitive design methods frequently adopted for visu-al controls in the lean production system (Greif, 1991). Figure 13(a) displays an example of colour-coded visual inventory control. The red colour on the rack marks the critical level (or replenishment point) for the corresponding inventory. The yellow colour communicates that the inventory is running low and should be monitored (get ready for the replenishment). The green signals an adequate level of inventory. The same mind-set is valid for the visual control in Figure 13(b), in which colour-coding represents the control- limits of the material used on a machinery.
9
(a)(b)
Figure 13-Colour-coded inventory control in a warehouse (a) and material control on a ma-chinery (b)
Visual Controls in Production and Logistics ManagementIn the lean production system, visual controls are widely used to realise the ‘Just-in-Time’
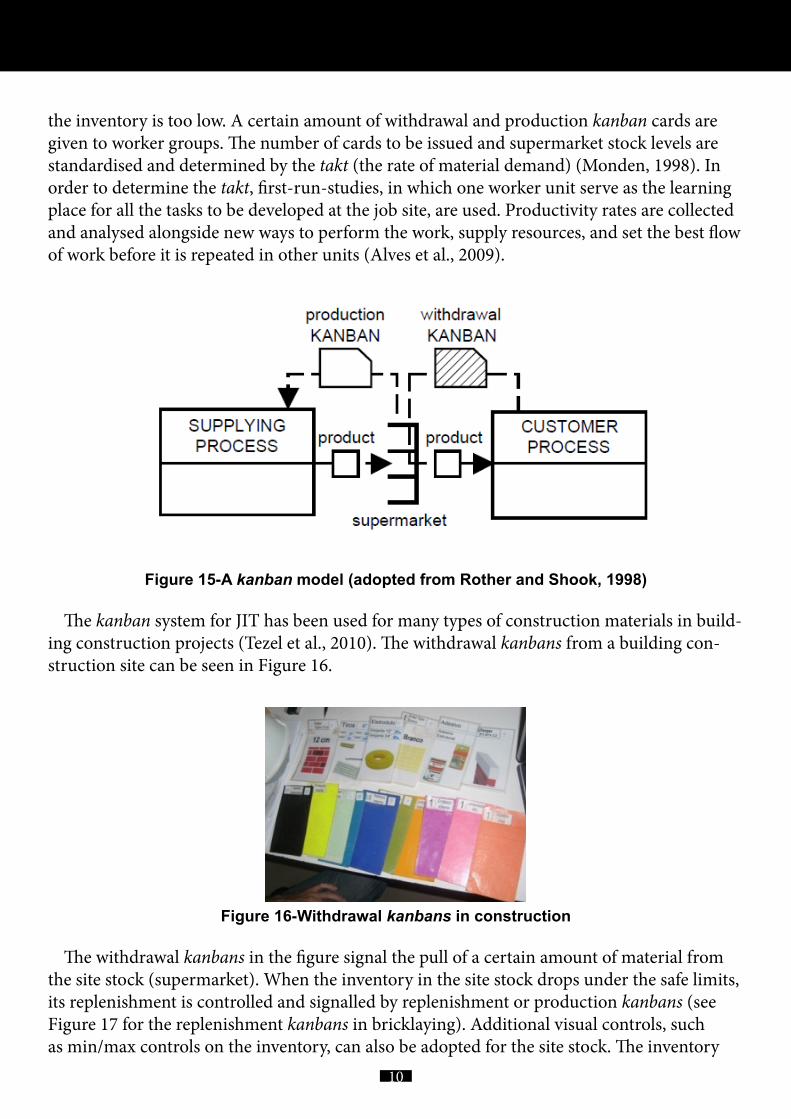
production system for a better integrated supply chain (Tommelein and Li, 1999). The term ‘Just-In-Time’ (JIT) is used for instances to describe the delivery of materials to their location for final installation without incurring any delay due to their storage in a laydown or staging area. Excessive production and inventory often lead to increased stocking costs, a cramped and unsafe work environment and hard-to-control processes (Hopp and Spearman, 1996). The ultimate objective of the JIT production is to supply the right materials at the right time and in the right amount at every step in the process. JIT is achieved in production by imple-menting a pull system using kanban, loosely translated from Japanese as cards (see Figure 14). Kanbans are designed to prevent overproduction and ensure that parts are drawn from pro-cess to process, in reverse order to control production quantities. Instead of cards, one can use special colour-coded and information-rich containers, racks or pallet. The point is to create a transaction signal for the exchange of standardised amount of materials.
Figure 14-A card based kanban example from manufacturing (adopted from Galsworth, 2005).
A kanban model can be seen in Figure 15. In the model, the upstream customer process pulls a standardised amount of material form the supermarket with the withdrawal kanban card. The supermarket (on-site stock) contains a limited amount of material to buffer the pro-duction at all times. The supermarket gets replenished by issuing a production kanban when
10
the inventory is too low. A certain amount of withdrawal and production kanban cards are given to worker groups. The number of cards to be issued and supermarket stock levels are standardised and determined by the takt (the rate of material demand) (Monden, 1998). In order to determine the takt, first-run-studies, in which one worker unit serve as the learning place for all the tasks to be developed at the job site, are used. Productivity rates are collected and analysed alongside new ways to perform the work, supply resources, and set the best flow of work before it is repeated in other units (Alves et al., 2009).
Figure 15-A kanban model (adopted from Rother and Shook, 1998)
The kanban system for JIT has been used for many types of construction materials in build-ing construction projects (Tezel et al., 2010). The withdrawal kanbans from a building con-struction site can be seen in Figure 16.
Figure 16-Withdrawal kanbans in construction
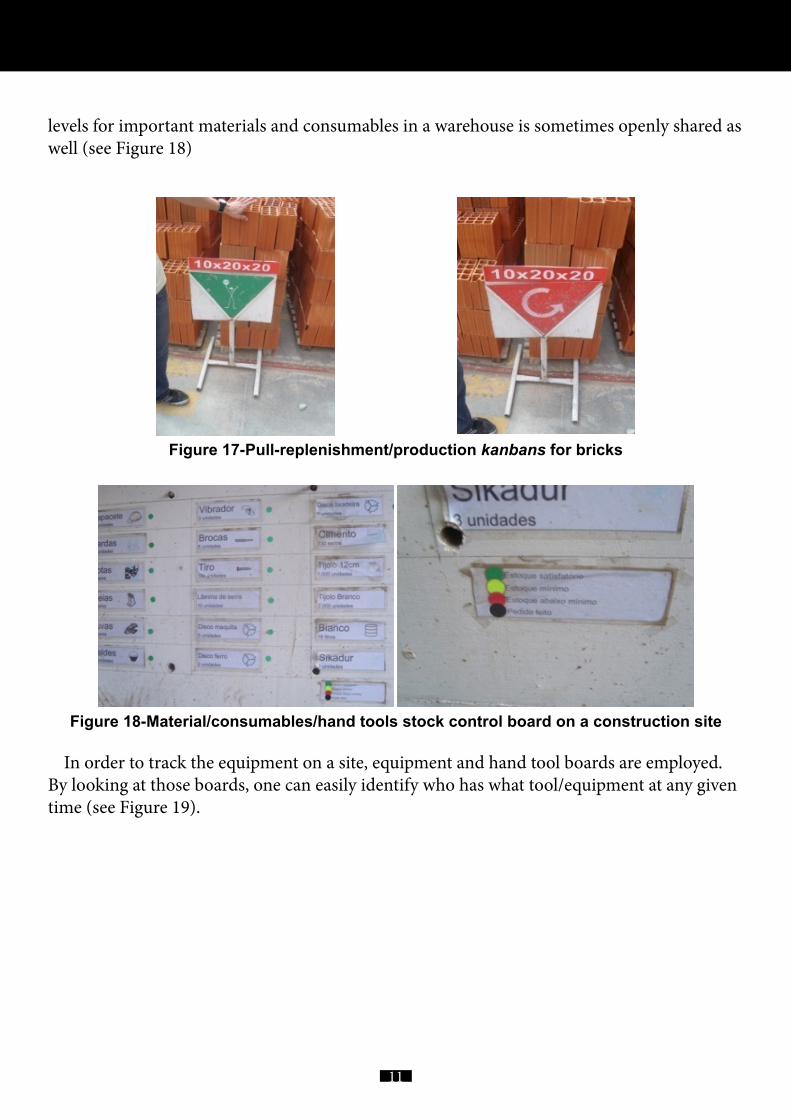
The withdrawal kanbans in the figure signal the pull of a certain amount of material from the site stock (supermarket). When the inventory in the site stock drops under the safe limits, its replenishment is controlled and signalled by replenishment or production kanbans (see Figure 17 for the replenishment kanbans in bricklaying). Additional visual controls, such as min/max controls on the inventory, can also be adopted for the site stock. The inventory
11
levels for important materials and consumables in a warehouse is sometimes openly shared as well (see Figure 18)
Figure 17-Pull-replenishment/production kanbans for bricks
Figure 18-Material/consumables/hand tools stock control board on a construction site
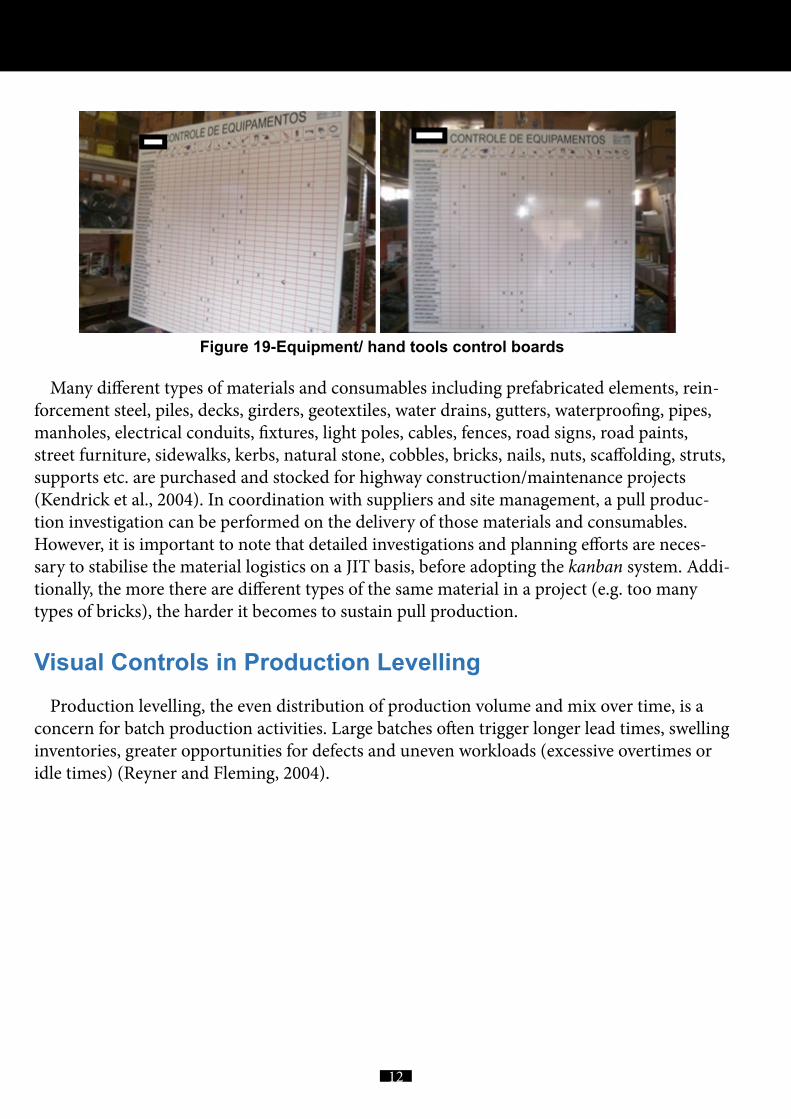
In order to track the equipment on a site, equipment and hand tool boards are employed. By looking at those boards, one can easily identify who has what tool/equipment at any given time (see Figure 19).
12
Figure 19-Equipment/ hand tools control boards
Many different types of materials and consumables including prefabricated elements, rein-forcement steel, piles, decks, girders, geotextiles, water drains, gutters, waterproofing, pipes, manholes, electrical conduits, fixtures, light poles, cables, fences, road signs, road paints, street furniture, sidewalks, kerbs, natural stone, cobbles, bricks, nails, nuts, scaffolding, struts, supports etc. are purchased and stocked for highway construction/maintenance projects (Kendrick et al., 2004). In coordination with suppliers and site management, a pull produc-tion investigation can be performed on the delivery of those materials and consumables. However, it is important to note that detailed investigations and planning efforts are neces-sary to stabilise the material logistics on a JIT basis, before adopting the kanban system. Addi-tionally, the more there are different types of the same material in a project (e.g. too many types of bricks), the harder it becomes to sustain pull production.
Visual Controls in Production LevellingProduction levelling, the even distribution of production volume and mix over time, is a
concern for batch production activities. Large batches often trigger longer lead times, swelling inventories, greater opportunities for defects and uneven workloads (excessive overtimes or idle times) (Reyner and Fleming, 2004).
13
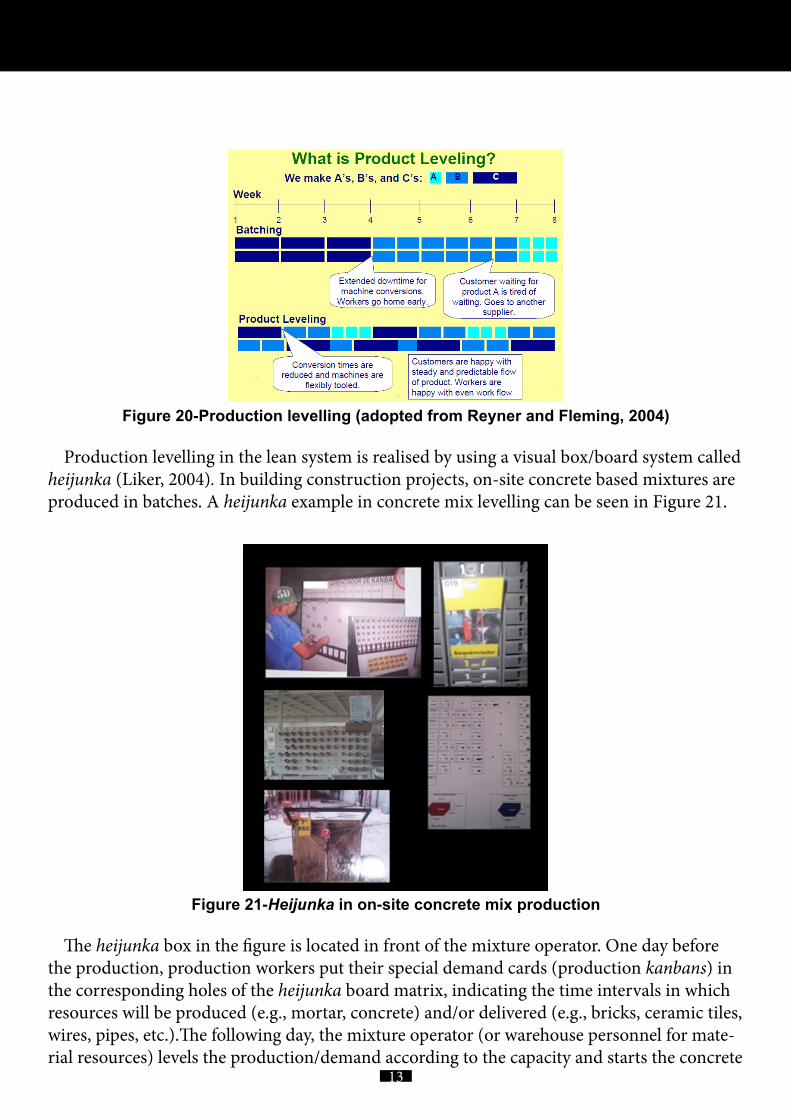
Figure 20-Production levelling (adopted from Reyner and Fleming, 2004)
Production levelling in the lean system is realised by using a visual box/board system called heijunka (Liker, 2004). In building construction projects, on-site concrete based mixtures are produced in batches. A heijunka example in concrete mix levelling can be seen in Figure 21.
Figure 21-Heijunka in on-site concrete mix production
The heijunka box in the figure is located in front of the mixture operator. One day before the production, production workers put their special demand cards (production kanbans) in the corresponding holes of the heijunka board matrix, indicating the time intervals in which resources will be produced (e.g., mortar, concrete) and/or delivered (e.g., bricks, ceramic tiles, wires, pipes, etc.).The following day, the mixture operator (or warehouse personnel for mate-rial resources) levels the production/demand according to the capacity and starts the concrete
14
mix production in accordance with the cards. When the production for a demand is finished, the operator flips the card corresponding to that order around to indicate a completed pro-duction (actual production can be monitored by counting the number of the turned cards on the board). Then the mixture is filled in a wheel with a standard volume, attaching to the wheel a tag indicating the floor number, to which the wheel should be transported and a bead symbolising the mixture type.
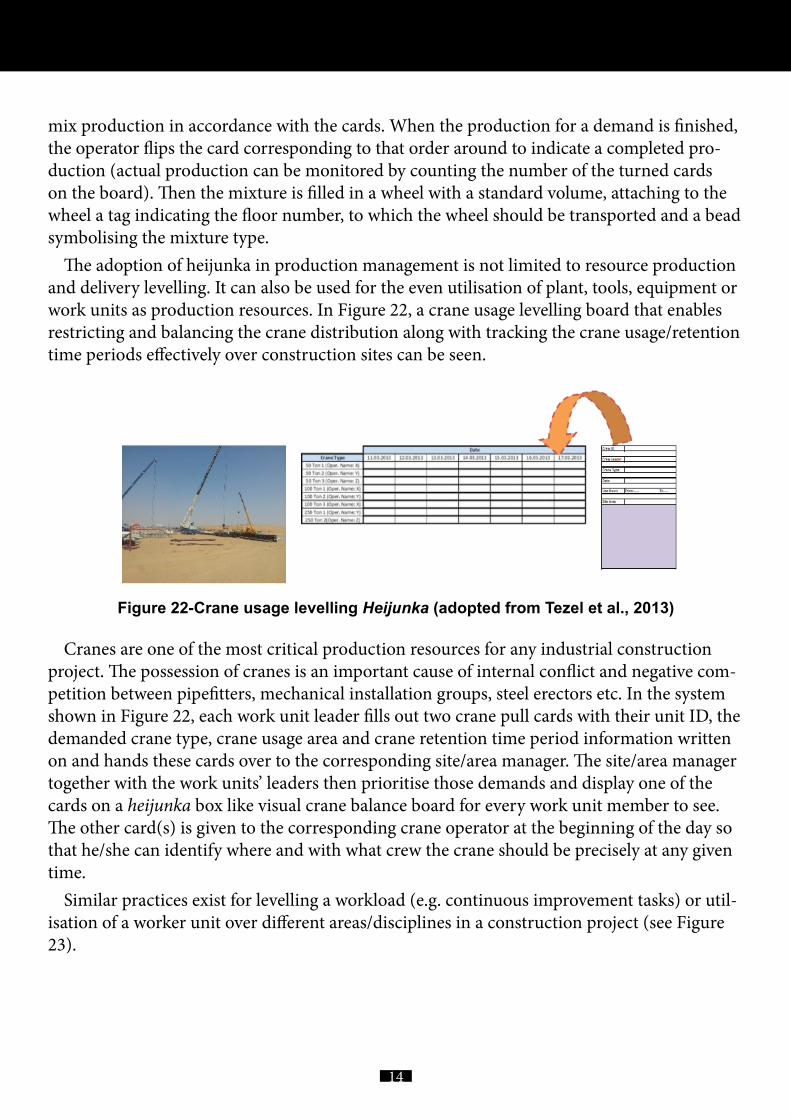
The adoption of heijunka in production management is not limited to resource production and delivery levelling. It can also be used for the even utilisation of plant, tools, equipment or work units as production resources. In Figure 22, a crane usage levelling board that enables restricting and balancing the crane distribution along with tracking the crane usage/retention time periods effectively over construction sites can be seen.
Figure 22-Crane usage levelling Heijunka (adopted from Tezel et al., 2013)
Cranes are one of the most critical production resources for any industrial construction project. The possession of cranes is an important cause of internal conflict and negative com-petition between pipefitters, mechanical installation groups, steel erectors etc. In the system shown in Figure 22, each work unit leader fills out two crane pull cards with their unit ID, the demanded crane type, crane usage area and crane retention time period information written on and hands these cards over to the corresponding site/area manager. The site/area manager together with the work units’ leaders then prioritise those demands and display one of the cards on a heijunka box like visual crane balance board for every work unit member to see. The other card(s) is given to the corresponding crane operator at the beginning of the day so that he/she can identify where and with what crew the crane should be precisely at any given time.
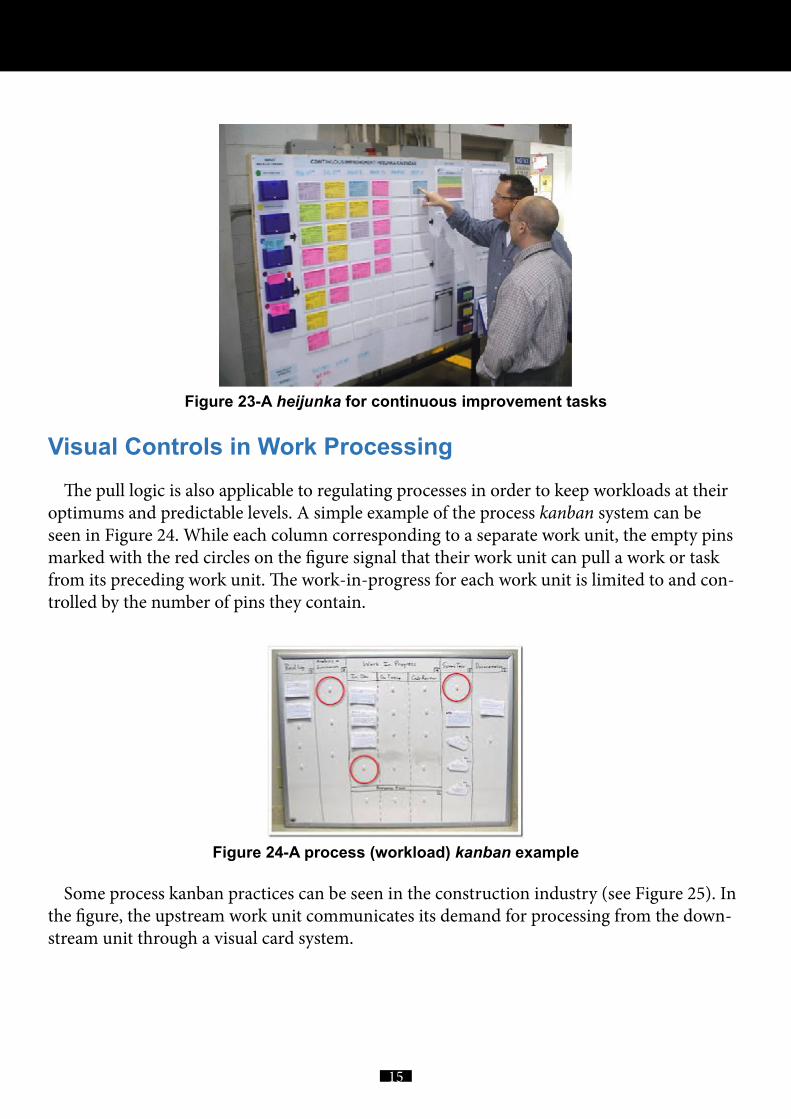
Similar practices exist for levelling a workload (e.g. continuous improvement tasks) or util-isation of a worker unit over different areas/disciplines in a construction project (see Figure 23).
15
Figure 23-A heijunka for continuous improvement tasks
Visual Controls in Work ProcessingThe pull logic is also applicable to regulating processes in order to keep workloads at their
optimums and predictable levels. A simple example of the process kanban system can be seen in Figure 24. While each column corresponding to a separate work unit, the empty pins marked with the red circles on the figure signal that their work unit can pull a work or task from its preceding work unit. The work-in-progress for each work unit is limited to and con-trolled by the number of pins they contain.
Figure 24-A process (workload) kanban example
Some process kanban practices can be seen in the construction industry (see Figure 25). In the figure, the upstream work unit communicates its demand for processing from the down-stream unit through a visual card system.
16
Figure 25-Process kanban in construction
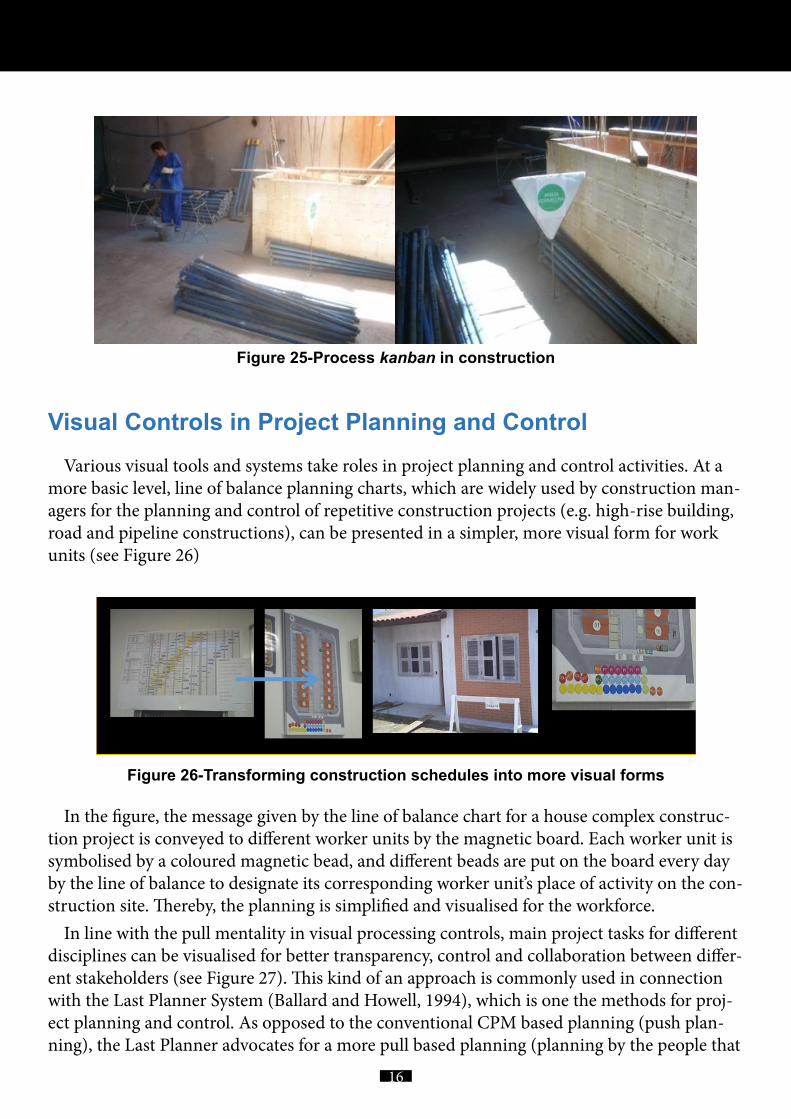
Visual Controls in Project Planning and ControlVarious visual tools and systems take roles in project planning and control activities. At a
more basic level, line of balance planning charts, which are widely used by construction man-agers for the planning and control of repetitive construction projects (e.g. high-rise building, road and pipeline constructions), can be presented in a simpler, more visual form for work units (see Figure 26)
Figure 26-Transforming construction schedules into more visual forms
In the figure, the message given by the line of balance chart for a house complex construc-tion project is conveyed to different worker units by the magnetic board. Each worker unit is symbolised by a coloured magnetic bead, and different beads are put on the board every day by the line of balance to designate its corresponding worker unit’s place of activity on the con-struction site. Thereby, the planning is simplified and visualised for the workforce.
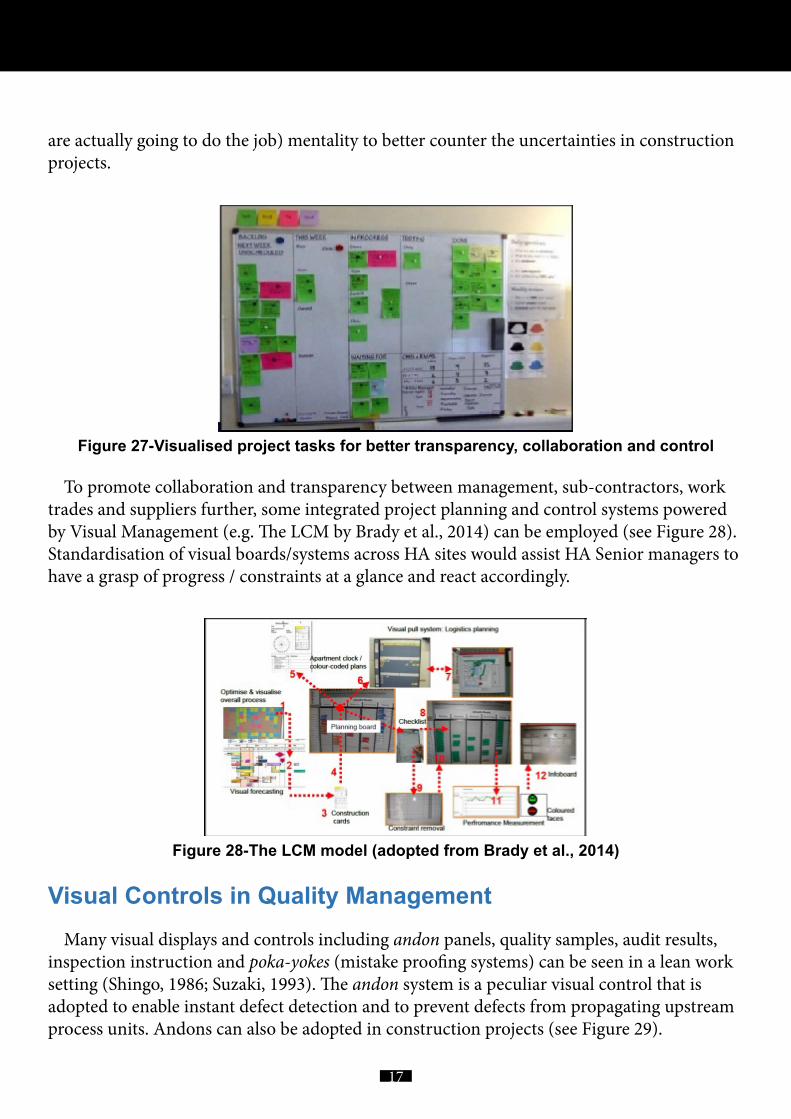
In line with the pull mentality in visual processing controls, main project tasks for different disciplines can be visualised for better transparency, control and collaboration between differ-ent stakeholders (see Figure 27). This kind of an approach is commonly used in connection with the Last Planner System (Ballard and Howell, 1994), which is one the methods for proj-ect planning and control. As opposed to the conventional CPM based planning (push plan-ning), the Last Planner advocates for a more pull based planning (planning by the people that
17
are actually going to do the job) mentality to better counter the uncertainties in construction projects.
Figure 27-Visualised project tasks for better transparency, collaboration and control
To promote collaboration and transparency between management, sub-contractors, work trades and suppliers further, some integrated project planning and control systems powered by Visual Management (e.g. The LCM by Brady et al., 2014) can be employed (see Figure 28). Standardisation of visual boards/systems across HA sites would assist HA Senior managers to have a grasp of progress / constraints at a glance and react accordingly.
Figure 28-The LCM model (adopted from Brady et al., 2014)
Visual Controls in Quality ManagementMany visual displays and controls including andon panels, quality samples, audit results,
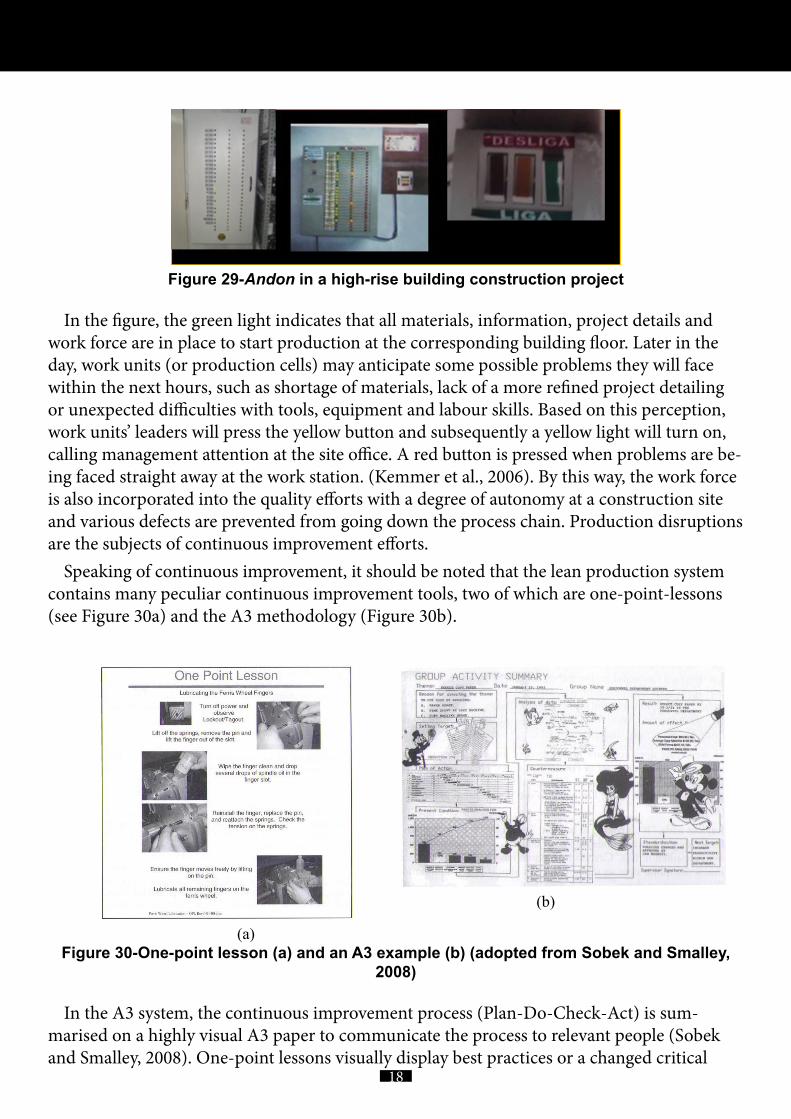
inspection instruction and poka-yokes (mistake proofing systems) can be seen in a lean work setting (Shingo, 1986; Suzaki, 1993). The andon system is a peculiar visual control that is adopted to enable instant defect detection and to prevent defects from propagating upstream process units. Andons can also be adopted in construction projects (see Figure 29).
18
Figure 29-Andon in a high-rise building construction project
In the figure, the green light indicates that all materials, information, project details and work force are in place to start production at the corresponding building floor. Later in the day, work units (or production cells) may anticipate some possible problems they will face within the next hours, such as shortage of materials, lack of a more refined project detailing or unexpected difficulties with tools, equipment and labour skills. Based on this perception, work units’ leaders will press the yellow button and subsequently a yellow light will turn on, calling management attention at the site office. A red button is pressed when problems are be-ing faced straight away at the work station. (Kemmer et al., 2006). By this way, the work force is also incorporated into the quality efforts with a degree of autonomy at a construction site and various defects are prevented from going down the process chain. Production disruptions are the subjects of continuous improvement efforts.
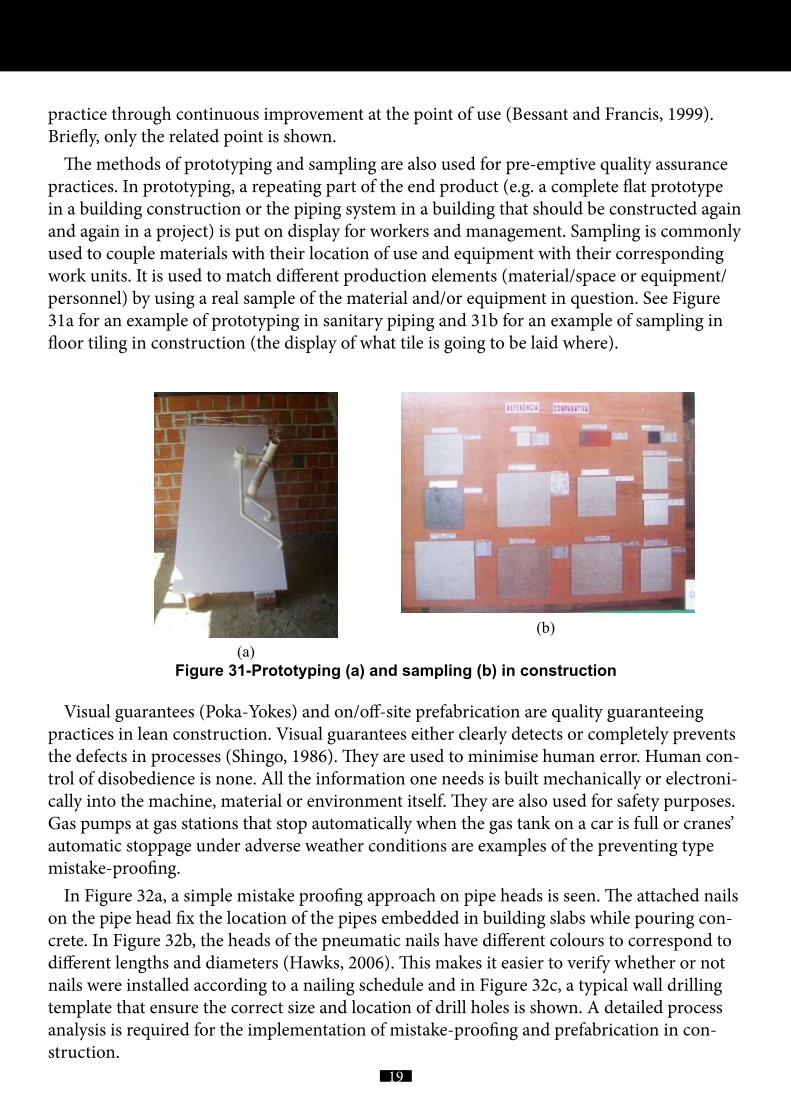
Speaking of continuous improvement, it should be noted that the lean production system contains many peculiar continuous improvement tools, two of which are one-point-lessons (see Figure 30a) and the A3 methodology (Figure 30b).
(a)
(b)
Figure 30-One-point lesson (a) and an A3 example (b) (adopted from Sobek and Smalley, 2008)
In the A3 system, the continuous improvement process (Plan-Do-Check-Act) is sum-marised on a highly visual A3 paper to communicate the process to relevant people (Sobek and Smalley, 2008). One-point lessons visually display best practices or a changed critical
19
practice through continuous improvement at the point of use (Bessant and Francis, 1999). Briefly, only the related point is shown.
The methods of prototyping and sampling are also used for pre-emptive quality assurance practices. In prototyping, a repeating part of the end product (e.g. a complete flat prototype in a building construction or the piping system in a building that should be constructed again and again in a project) is put on display for workers and management. Sampling is commonly used to couple materials with their location of use and equipment with their corresponding work units. It is used to match different production elements (material/space or equipment/personnel) by using a real sample of the material and/or equipment in question. See Figure 31a for an example of prototyping in sanitary piping and 31b for an example of sampling in floor tiling in construction (the display of what tile is going to be laid where).
(a)(b)
Figure 31-Prototyping (a) and sampling (b) in construction
Visual guarantees (Poka-Yokes) and on/off-site prefabrication are quality guaranteeing practices in lean construction. Visual guarantees either clearly detects or completely prevents the defects in processes (Shingo, 1986). They are used to minimise human error. Human con-trol of disobedience is none. All the information one needs is built mechanically or electroni-cally into the machine, material or environment itself. They are also used for safety purposes. Gas pumps at gas stations that stop automatically when the gas tank on a car is full or cranes’ automatic stoppage under adverse weather conditions are examples of the preventing type mistake-proofing.
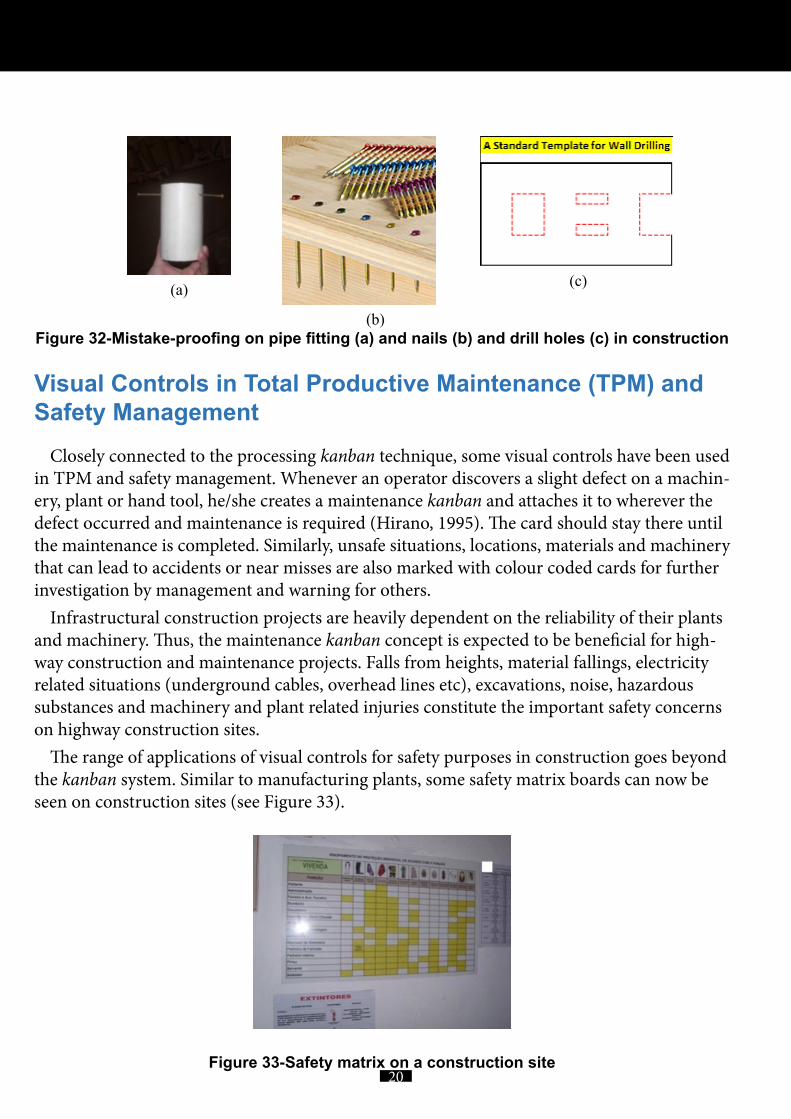
In Figure 32a, a simple mistake proofing approach on pipe heads is seen. The attached nails on the pipe head fix the location of the pipes embedded in building slabs while pouring con-crete. In Figure 32b, the heads of the pneumatic nails have different colours to correspond to different lengths and diameters (Hawks, 2006). This makes it easier to verify whether or not nails were installed according to a nailing schedule and in Figure 32c, a typical wall drilling template that ensure the correct size and location of drill holes is shown. A detailed process analysis is required for the implementation of mistake-proofing and prefabrication in con-struction.
20
(a)
(b)
(c)
Figure 32-Mistake-proofing on pipe fitting (a) and nails (b) and drill holes (c) in construction
Visual Controls in Total Productive Maintenance (TPM) and Safety Management
Closely connected to the processing kanban technique, some visual controls have been used in TPM and safety management. Whenever an operator discovers a slight defect on a machin-ery, plant or hand tool, he/she creates a maintenance kanban and attaches it to wherever the defect occurred and maintenance is required (Hirano, 1995). The card should stay there until the maintenance is completed. Similarly, unsafe situations, locations, materials and machinery that can lead to accidents or near misses are also marked with colour coded cards for further investigation by management and warning for others.
Infrastructural construction projects are heavily dependent on the reliability of their plants and machinery. Thus, the maintenance kanban concept is expected to be beneficial for high-way construction and maintenance projects. Falls from heights, material fallings, electricity related situations (underground cables, overhead lines etc), excavations, noise, hazardous substances and machinery and plant related injuries constitute the important safety concerns on highway construction sites.
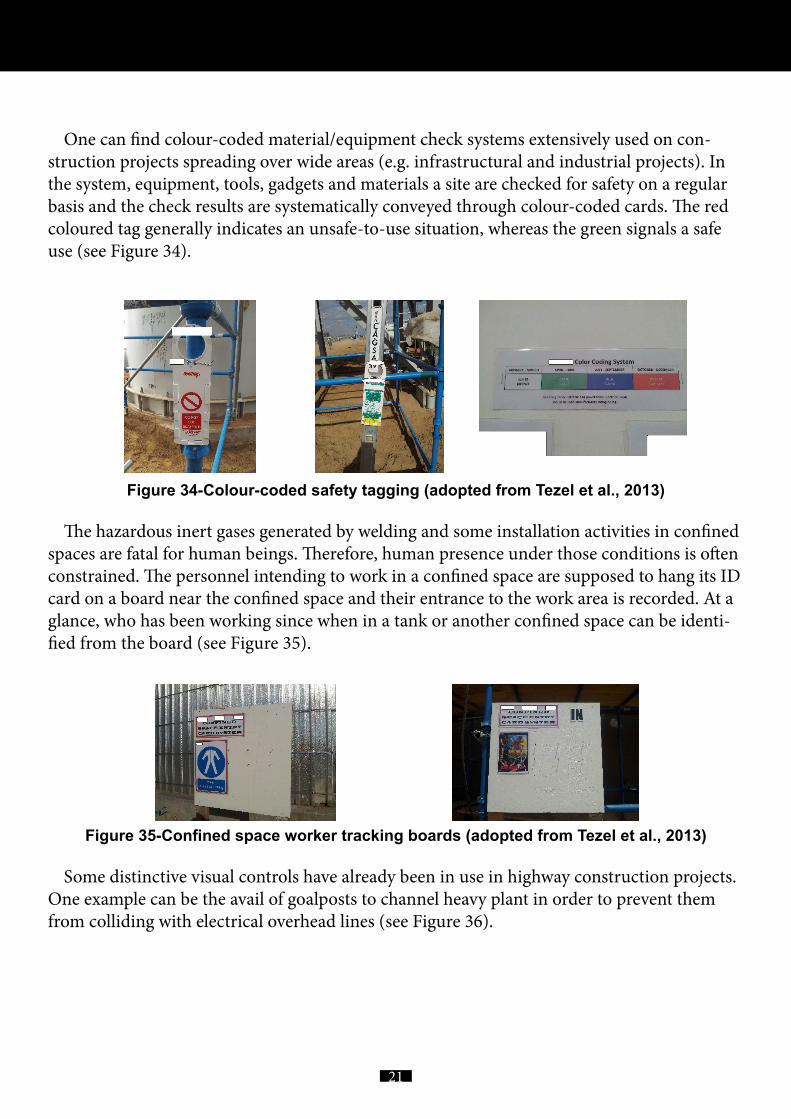
The range of applications of visual controls for safety purposes in construction goes beyond the kanban system. Similar to manufacturing plants, some safety matrix boards can now be seen on construction sites (see Figure 33).
Figure 33-Safety matrix on a construction site
21
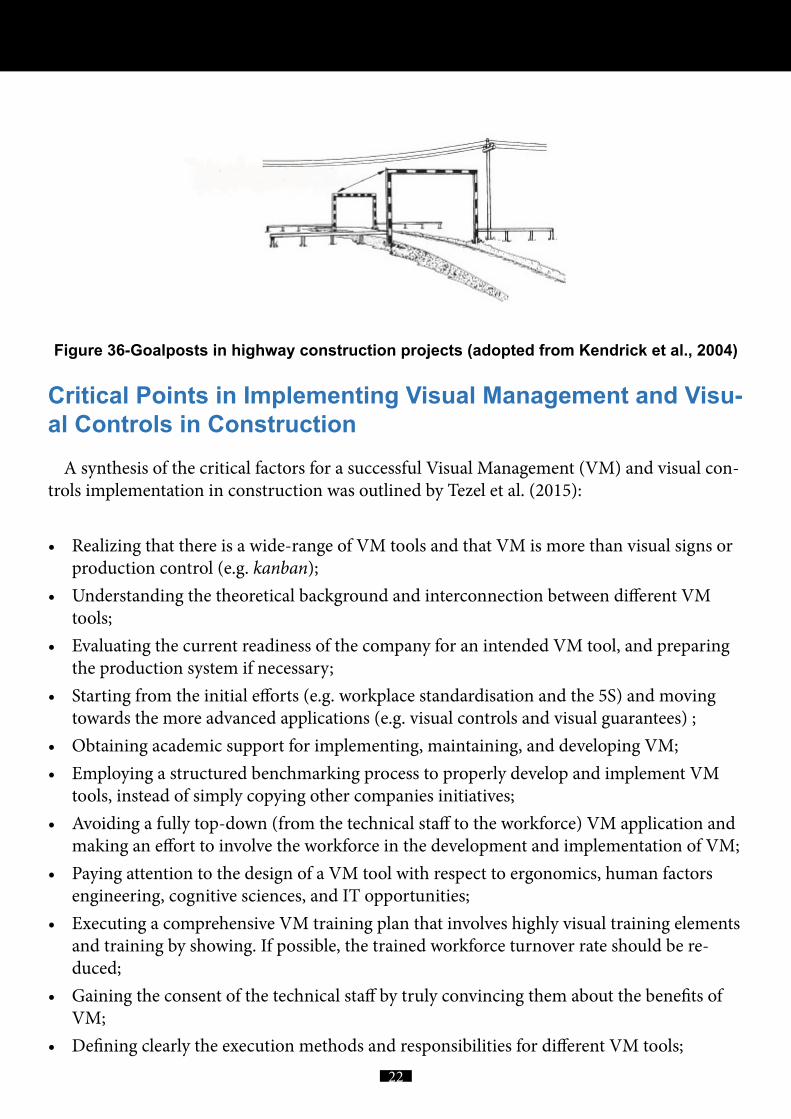
One can find colour-coded material/equipment check systems extensively used on con-struction projects spreading over wide areas (e.g. infrastructural and industrial projects). In the system, equipment, tools, gadgets and materials a site are checked for safety on a regular basis and the check results are systematically conveyed through colour-coded cards. The red coloured tag generally indicates an unsafe-to-use situation, whereas the green signals a safe use (see Figure 34).
Figure 34-Colour-coded safety tagging (adopted from Tezel et al., 2013)
The hazardous inert gases generated by welding and some installation activities in confined spaces are fatal for human beings. Therefore, human presence under those conditions is often constrained. The personnel intending to work in a confined space are supposed to hang its ID card on a board near the confined space and their entrance to the work area is recorded. At a glance, who has been working since when in a tank or another confined space can be identi-fied from the board (see Figure 35).
Figure 35-Confined space worker tracking boards (adopted from Tezel et al., 2013)
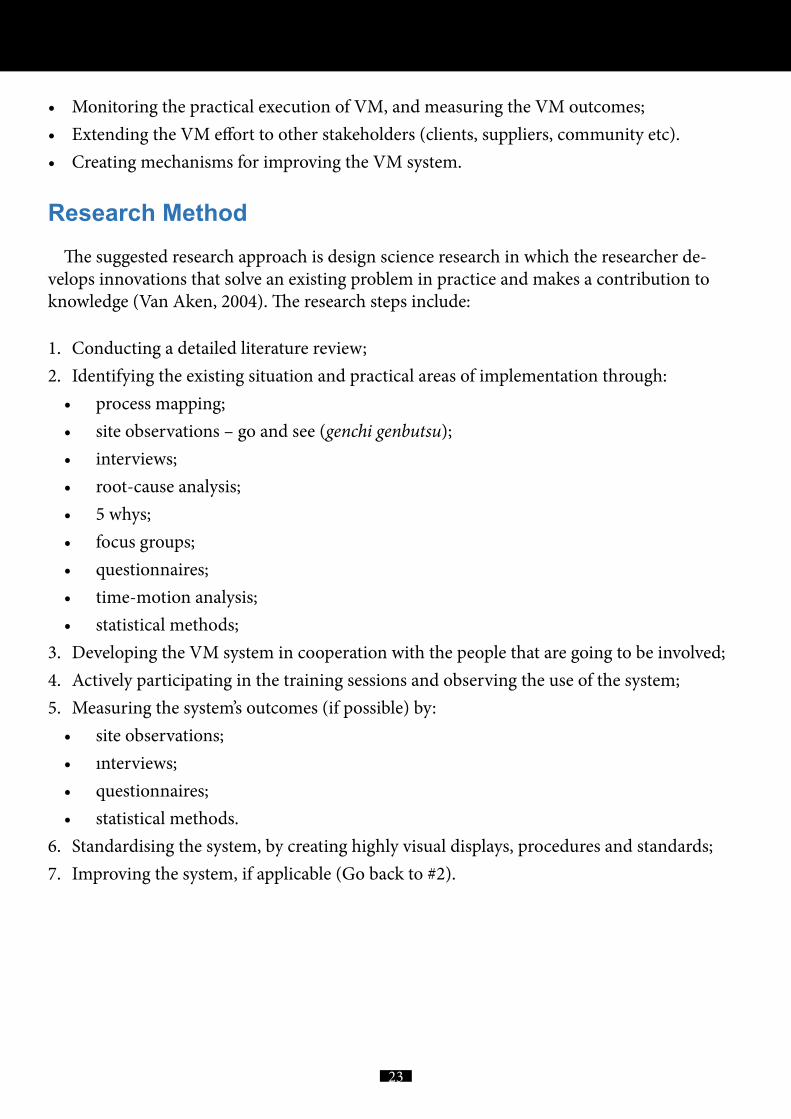
Some distinctive visual controls have already been in use in highway construction projects. One example can be the avail of goalposts to channel heavy plant in order to prevent them from colliding with electrical overhead lines (see Figure 36).
22
Figure 36-Goalposts in highway construction projects (adopted from Kendrick et al., 2004)
Critical Points in Implementing Visual Management and Visu-al Controls in Construction
A synthesis of the critical factors for a successful Visual Management (VM) and visual con-trols implementation in construction was outlined by Tezel et al. (2015):
• Realizing that there is a wide-range of VM tools and that VM is more than visual signs or production control (e.g. kanban);
• Understanding the theoretical background and interconnection between different VM tools;
• Evaluating the current readiness of the company for an intended VM tool, and preparing the production system if necessary;
• Starting from the initial efforts (e.g. workplace standardisation and the 5S) and moving towards the more advanced applications (e.g. visual controls and visual guarantees) ;
• Obtaining academic support for implementing, maintaining, and developing VM;• Employing a structured benchmarking process to properly develop and implement VM
tools, instead of simply copying other companies initiatives;• Avoiding a fully top-down (from the technical staff to the workforce) VM application and
making an effort to involve the workforce in the development and implementation of VM;• Paying attention to the design of a VM tool with respect to ergonomics, human factors
engineering, cognitive sciences, and IT opportunities;• Executing a comprehensive VM training plan that involves highly visual training elements
and training by showing. If possible, the trained workforce turnover rate should be re-duced;
• Gaining the consent of the technical staff by truly convincing them about the benefits of VM;
• Defining clearly the execution methods and responsibilities for different VM tools;
23
• Monitoring the practical execution of VM, and measuring the VM outcomes;• Extending the VM effort to other stakeholders (clients, suppliers, community etc).• Creating mechanisms for improving the VM system.
Research MethodThe suggested research approach is design science research in which the researcher de-
velops innovations that solve an existing problem in practice and makes a contribution to knowledge (Van Aken, 2004). The research steps include:
1. Conducting a detailed literature review;2. Identifying the existing situation and practical areas of implementation through:• process mapping;• site observations – go and see (genchi genbutsu);• interviews;• root-cause analysis;• 5 whys;• focus groups;• questionnaires;• time-motion analysis;• statistical methods;
3. Developing the VM system in cooperation with the people that are going to be involved;4. Actively participating in the training sessions and observing the use of the system;5. Measuring the system’s outcomes (if possible) by:• site observations;• ınterviews;• questionnaires;• statistical methods.
6. Standardising the system, by creating highly visual displays, procedures and standards;7. Improving the system, if applicable (Go back to #2).
24
Visual Management and Visual Controls Implementation Steps/Recommendations
A set of general recommendations for a successful VM and visual controls implementation effort can be given as such:
1. Designate a VM and visual controls champion, preferably from senior management within the organisation;
2. Form an implementation committee of people with a strong background in operations of the organisation. Strive to include people with a certain level of desire and enthusiasm for change;
3. Define the vision and responsibilities of the committee members. Determine a timeframe/schedule for the implementation;
4. Raise awareness on the wide-range of VM and visual control opportunities in construc-tion. Understand the theory behind the concepts. Bear in mind that the main goal is to increase process transparency;
5. Obtain academic support and consultancy throughout the implementation process;6. Roughly determine the principle areas of implementation (e.g. see the examples given in
this report) for further investigation. Existing practices can be improved and new concepts can be introduced as well;
7. VM and visual controls are realised and sustained mostly at the operational level. Properly introduce the concepts to operational people working at the targeted areas, whose own-ership and innovative ideas are important (e.g. site managers, foremen, subcontractors, suppliers etc). Give those people the opportunity for expressing their ideas, concerns and experimentation;
8. Further specify, refine and detail the area of implementation. Do not adopt anything for just the sake of adopting something. VM and visual controls should serve a definitive pur-pose; meet the requirements for an information need towards a clear vision. This can be achieved by using methods such as process mapping, forming focus groups, direct obser-vations etc;
9. Detail and communicate the implementation with visual training materials and process aids. Standardise the process carefully. Train people extensively. Maintain a certain level of patience in training. Training by showing or on-the-job training are important;
10. Clearly define the roles and responsibilities of operational people using the implemented visual controls;
11. Try to capture and measure the qualitative/quantitative benefits of the new VM tools and visual controls. Communicate and openly share those benefits within the organisation;
12. Make it an open ended process. Collect the ideas for continuous improvement. Adopt the PDCA cycle.
25
13. Extend the VM and visual controls effort to other operational areas/tools. Enrich your implementations;
14. Benchmark your efforts against others;15. Share your story through conferences, reports, presentations’ academic papers for the fu-
ture. Help disseminate the concepts.
Possible Areas of Implementation for Highways England• The possibilities for increasing process transparency should be closely investigated for HE;• An extensive 5S effort can be initiated or the current housekeeping practices can be im-
proved;• HE’s standards and specifications can be visualised as a part of the visual standardisation
initiative;• The format and use (presentation/process) of visual performance metrics/boards can be
standardised across HE sites;• Certain visual tools to support continuous improvement (e.g. the A3 or one point lessons)
can be implemented in HE’s offices and on their sites;• A possible transformation to a pull-based (JIT) material supply chain for certain highway
construction/maintenance materials (e.g. prefabricated parts, reinforcement steel, piles, decks, girders, geotextiles, water drains, gutters, waterproofing, pipes, manholes, electrical conduits, fixtures, light poles, cables, fences, road signs, road paints, street furniture, side-walks, kerbs, natural stone, cobbles, bricks, nails, nuts, scaffolding, struts, supports etc.) can be investigated;
• The opportunities for material production and demand levelling (e.g. batching different concrete, aggregate filler, bituminous mixture types – binder and surface course, bricks, pipes, wires etc.), equipment/ plant usage levelling (e.g. cranes, rollers, compactors, exca-vators, asphalters, trenchers, floor saws etc.) and work units’ levelling can be investigated for highway construction and maintenance projects.
• The use of visual controls (e.g. maintenance kanbans) in equipment/plant maintenance can be further studied;
• Work stabilising efforts through the pull mind-set can be adopted and realised for the work tasks in highway construction and maintenance projects;
• A visual system for project planning/control can be devised for HE (this may also include the introduction of the Last Planner System);
• The use of andon for defect detection in HE’s offices and on their sites can be further in-vestigated;
• The quality related visual practices and controls outlined above can be investigated for the implementation in the critical points of levelling and grading, sub-base construction, drainage system construction, flexible and rigid pavement laying, construction of engi-
26
neering works (bridges, overpasses etc.), electro-mechanical installation and installation of aux. equipment (e.g. street furniture) in highway construction and maintenance projects;
• The possibilities for the implementation of poka-yokes for HE can be further investigated;• The application of safety kanbans, safety tracking boards and colour coded tagging can be
further investigated.
ConclusionVisual Management and visual controls offer a wide-range of practices for different man-
agerial efforts. This report is a preliminary report that roughly presents and discusses those opportunities for highway construction and maintenance projects. It is envisioned that many of the practices presented in the report is also relevant to highway construction/maintenance. Further investigation and application of those practices present an opportunity for the HE to create a leaner construction setting in their projects. A detailed analysis of processes and close cooperation with academia will expectedly reveal other application areas and refine the out-lined application process. The possible implementation areas presented in the report can be used as the initial steps for investigation. The critical point here is to set a concrete vision and understand the theory behind Visual Management and visual controls with its implementa-tion opportunities.
27
ReferencesAlves, C. L. T., Neto, J. P. B., Heineck, L. F. M., Kemmer, S. L and Pereira, P. E (2009) Incen-
tives and Innovations to Sustain Lean Construction Implementation. In Proceedings of the 17th Annual Conference of the International Group for Lean Construction (IGLC), Taipei, Taiwan.
Ballard, G. and Howell, G. A. (1994) Implementing Lean Construction: Improving Down-stream Performance. In Proceedings of the 2nd Annual Conference of the International Group for Lean Construction (IGLC), Santiago, Chile.
Bessant, J. and Francis, D. (1999) Developing Strategic Continuous Improvement Capability. International Journal of Operations and Production Management, 19(11), 1106-19.
Brady, D. A., Tzortzopoulos, P., Rooke, J. and Formoso, C. T (2014) A Holistic Method of Applying Visual Management to Improve Planning and Control on Construction Sites. In Proceedings of the International Conference on Construction in a Changing World, http://www.irbnet.de/daten/iconda/CIB_DC27651.pdf
Dennis, P. (2002) Lean Production Simplified: A Plain Language Guide to the World’s Most Powerful Production System, Productivity Press, New York, USA.
Formoso, C. T., Dos Santos, A. and Powell, J. (2002) An Exploratory Study on the Applicabil-ity of Process Transparency in Construction Sites, Journal of Construction Research, 3(1), 35-54.
Galsworth, G. D. (1997) Visual Systems: Harnessing the Power of Visual Workplace, AMA-COM, New York, USA.
Galsworth, G. D. (2005) Visual Workplace: Visual Thinking, Visual-Lean Enterprise Press, Portland, USA.
Gapp, R., Fisher, R. and Kobayashi, K. (2008) Implementing 5S within a Japanese Context: An Integrated Management System. Management Decision, 46(4), 565-79.
Greif, M. (1991) The Visual Factory: Building Participation through Shared Information, Pro-ductivity Press, Portland, USA.
Hawks, J. (2006) Tool Review: Color-Coded Pneumatic Nails. Fine Homebuilding Magazine, http://www.taunton.com/finehomebuilding/pages/h00090.asp
Hirano, H. (1995) 5 Pillars of the Visual Workplace: The Sourcebook for 5S Implementation, Productivity Press, Portland, USA.
Hopp, W. and Spearman, M. (1996) Factory Physics, McGraw Hill, Boston, USA.Kemmer, S. L., Saraiva, M. A., Heineck, L. F. M., Pacheco, A. V. L., Novaes, M. D. V., Mourao,
C. A. M. A. and Moreira, L. C. R. (2006). The Use of Andon in High Rise Building, In Proceedings of the 14th Annual Conference of the International Group for Lean Construction (IGLC), Santiago, Chile.
Kendrick, P., Copson, M., Beresford S. and McCormick P. (2004) Roadwork:Theory and Prac-tice, 5th edn., Biddles Ltd., Norfolk, UK.
28
Liff, S. and Posey, P. A. (2004) Seeing Is Believing: How the New Art of Visual Management Can Boost Performance Throughout Your Organization, AMACOM, New York, USA.
Liker, J. K. (2004) The Toyota Way: 14 Management Principles from the World’s Greatest Manu-facturer, McGraw-Hill, New York, USA.
Monden, Y. (1998) Toyota Production System: An Integrated Approach to Just-in-Time, 3rd edn., Engineering and Management Press, Norcross, USA.
Motwani, J. (2003) A Business Process Change Framework for Examining Lean Manufactur-ing: A Case Study. Industrial Management and Data Systems, 103(5), 339-49.
NKS (1987) Poka Yoke: Improving Product Quality by Preventing Defects, Productivity Press, Cambridge, USA.
Parry, G. C. and Turner, C. E. (2006) Application of Lean Visual Process Management Tools. Production Planning and Control, 17(1), 77-86.
Reyner, A. and Fleming, K. (2004) Heijunka Product and Production Levelling. Presentation at MIT Leaders, http://ocw.mit.edu/courses/engineering-systems-division/esd-60-lean-six-sigma-processes-summer-2004/lecture-notes/9_3product_level.pdf
Shingo, S. (1986) Zero Quality Control: Source Inspection and the Poka-Yoke System, Produc-tivity Press, Portland, USA.
Sobek, D. K. and Smalley, A. (2008) Understanding A3 Thinking: A Critical Component of Toy-ota’s PDCA Management System, Taylor and Francis, Boca Raton, USA.
Suzaki, K. (1993) The New Shop Floor Management: Empowering People for Continuous Im-provement, The Free Press, New York, USA.
Tezel, B. A., Koskela L. J. and Tzortzopoulos, P. (2009) The Functions of Visual Management. 6th International Research Symposium, Salford, UK.
Tezel, A., Koskela L. and Tzortzopoulos, P. (2010) Visual Management in Construction: Study Report on Brazilian Cases, Technical Report, University of Salford, Salford, UK.
Tezel, A., Koskela, L. and Tzortzopoulos, P. (2013) Visual Management In Industrial Con-struction: A Case Study. In Proceedings of the 21st Annual Conference of the International Group for Lean Construction (IGLC), Fortaleza, Brazil.
Tezel, A., Koskela, L.,Tzortzopoulos, P.,Formoso, C. and Alves, T.(2015) Visual Manage-ment in Brazilian Construction Companies: Taxonomy and Guidelines for Implemen-tation. Journal of Management in Engineering, 10.1061/(ASCE)ME.1943-5479.0000354, 05015001.
Tommelein, I. D. and Li, A. E. Y. (1999) Just-in-Time Concrete Delivery: Mapping Alterna-tives for Vertical Supply Chain Integration. In Proceedings of the 7th Annual Conference of the International Group for Lean Construction (IGLC), Berkeley, USA.
Van Aken, J.E. (2004) Management Research Based on the Paradigm of the Design Sciences: The Quest for Field-Tested and Grounded Technological Rules. Journal of Management Studies, 41(2), 219-46.
ISBN 978-1-907842-68-9