how to search and display logs with kibana - zenoss zenoss enablement series : how to search and...
TRANSCRIPT

The Zenoss Enablement Series:
How to Search and Display Logs with Kibana
Document Version 500 - p1
Zenoss, Inc. www.zenoss.com

Zenoss, Inc.
Copyright © 2016 Zenoss, Inc 11305 Four Points Drive, Bldg 1 - Suite 300, Austin, Texas 78726, U.S.A. All rights reserved. Zenoss and the Zenoss logo are trademarks or registered trademarks of Zenoss, Inc. in the United States and other countries. All other trademarks, logos, and service marks are the property of Zenoss or other third parties. Use of these marks is prohibited without the express written consent of Zenoss, Inc. or the third-party owner.
Cisco, Cisco UCS, Cisco Unified Computing System, Cisco Catalyst, and Cisco Nexus are trademarks or registered trademarks of Cisco and/or its affiliates in the United States and certain other countries.
Flash is a registered trademark of Adobe Systems Incorporated.
Oracle, the Oracle logo, Java, and MySQL are registered trademarks of the Oracle Corporation and/or its affiliates. Linux is a registered trademark of Linus Torvalds.
SNMP Informant is a trademark of Garth K. Williams (Informant Systems, Inc.). Sybase is a registered trademark of Sybase, Inc.
Tomcat is a trademark of the Apache Software Foundation.
vSphere is a trademark of VMware, Inc. in the United States and/or other jurisdictions.
Windows is a registered trademark of Microsoft Corporation in the United States and other countries. All other companies and products mentioned are trademarks and property of their respective owners.

Table of Contents Applies To............................................................................................................................................................ 1
Kibana and Control Center ............................................................................................................................. 1 Accessing Kibana ...........................................................................................................................................................1 Log File Entries ...............................................................................................................................................................2
Action Icons ...................................................................................................................................................................................................... 3
Searching Logs with Kibana ........................................................................................................................... 4 Kibana Search Syntax ...................................................................................................................................................4 Kibana Time Range Search Filter ..............................................................................................................................4 Performing a Kibana Log Search ...............................................................................................................................5
Customizing the Search Results Fields ............................................................................................................................................... 5 Kibana Search Examples .............................................................................................................................................8

Zenoss, Inc.
Zenoss, Inc.
Search & Display Logs with Kabana 1
Applies To The procedure outlined in this document applies to Zenosss 5.x Control Center.
Kibana and Control Center Log files are an important part of the Control Center data. Control Center uses Logstash from Elastic (https://www.elastic.co/products/logstash) to monitor service daemon log files. It parses them and forwards them to Elasticsearch.
A browser-based user interface called Kibana enables you to display and search Elasticsearch databases, including the log files that Control Center monitors. For additional information about Kibana, see https://www.elastic.co/products/kibana.
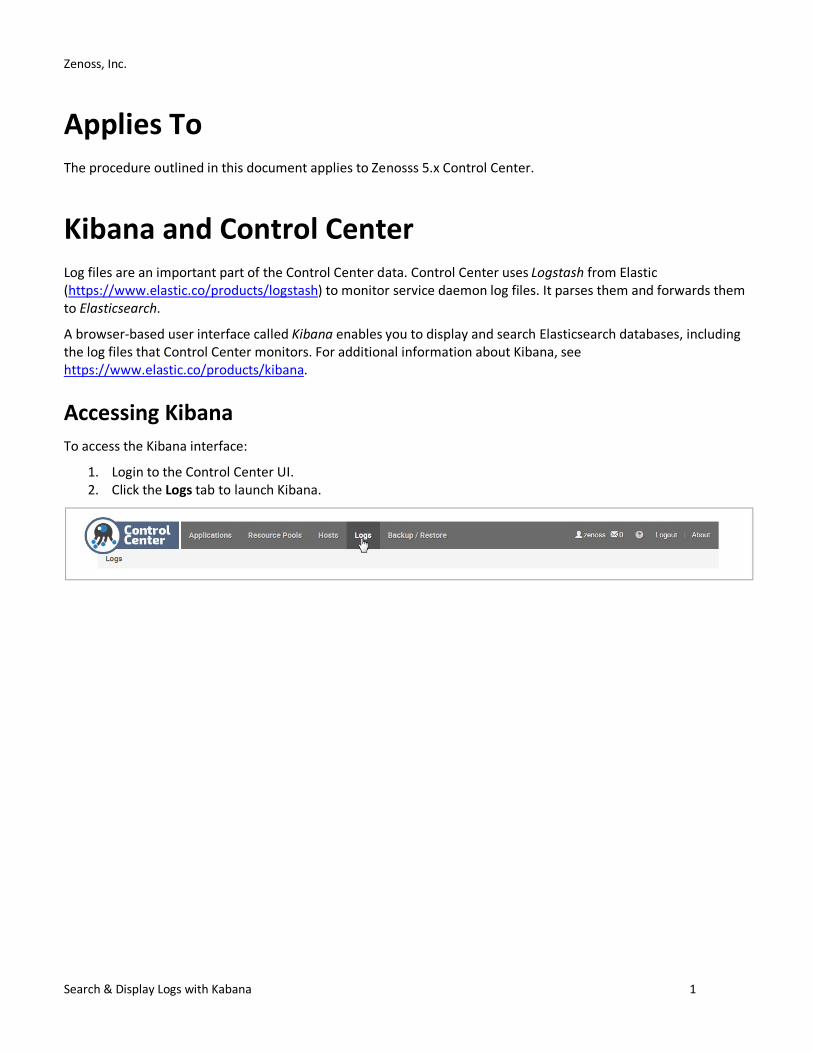
Accessing Kibana To access the Kibana interface:
1. Login to the Control Center UI. 2. Click the Logs tab to launch Kibana.

Zenoss, Inc.
2 Search & Display Logs with Kabana
The Logs pane displays, where by default, Kibana retrieves the 500 most recent log file entries and displays them in table form, 100 per page.
Log File Entries Logstash parses each log file entry into fields and adds fields about the source and the type of the entry. Note that different message types contain different fields.

Zenoss, Inc.
Search & Display Logs with Kabana 3
To display the fields within a message, click on the message row. For example:
Action Icons The field details include three action icons:

Zenoss, Inc.
4 Search & Display Logs with Kabana
The icons specify particular actions:
Add a filter to match the selected field and value.
Add a filter to not match (exclude messages with) the selected field and value.
Toggle the selected field display in the table.
Searching Logs with Kibana Kibana Search Syntax
Kibana enables you to search the various fields within the logs. You can specify various criteria to refine the search results, including the timeframe for the search. The basic Kibana query syntax includes the following:
String field:string field:"multi-word string" field:/regular-expression/
Notes:
An asterisk (*) in the query string matches any set of characters, including the empty string A question mark (?) matches any single character Supported Boolean operators include:
AND
OR
NOT
+ (plus; must include)
– (minus; cannot include)
Parenthesis can be used for grouping.
Kibana Time Range Search Filter To specify or update the Kibana built-in time range filter:
1. Click the current time range (with down chevron) located in the top of the Logs pane:
Zenoss, Inc.
Search & Display Logs with Kabana 5
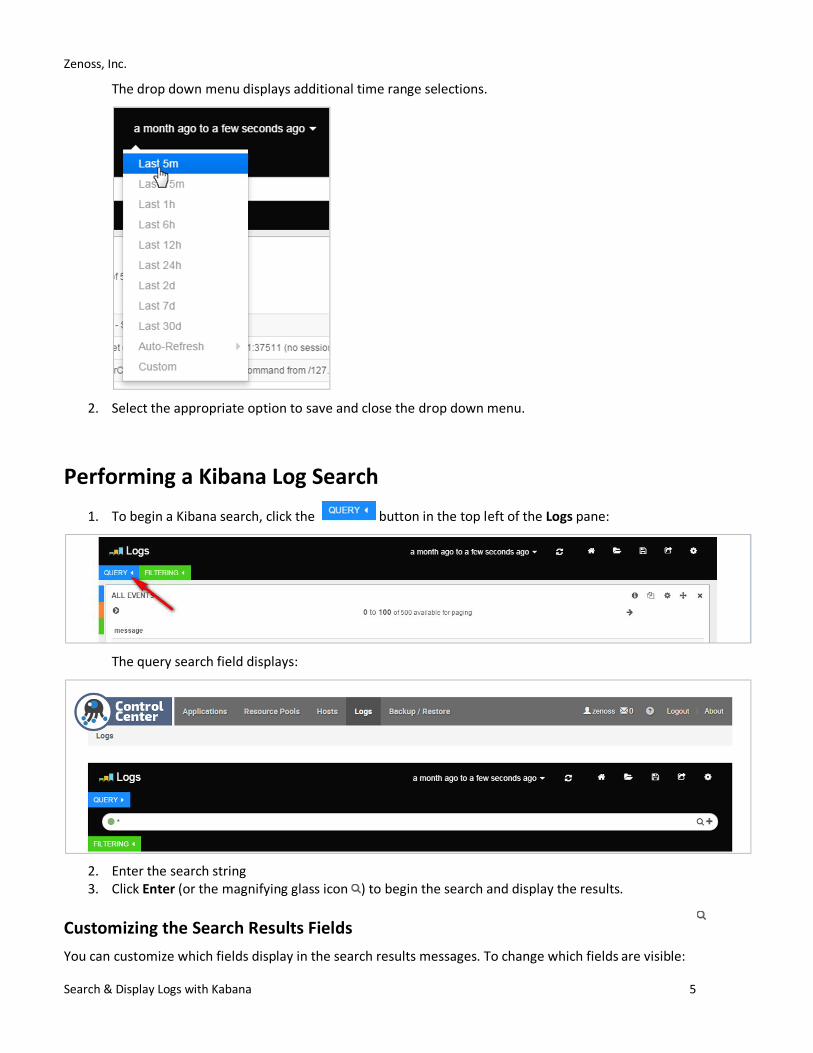
The drop down menu displays additional time range selections.
2. Select the appropriate option to save and close the drop down menu.
Performing a Kibana Log Search 1. To begin a Kibana search, click the button in the top left of the Logs pane:
The query search field displays:
2. Enter the search string 3. Click Enter (or the magnifying glass icon ) to begin the search and display the results.
Customizing the Search Results Fields You can customize which fields display in the search results messages. To change which fields are visible:

Zenoss, Inc.
6 Search & Display Logs with Kabana
1. Click the field list icon to open the Field list.
The Fields list:

Zenoss, Inc.
Search & Display Logs with Kabana 7
2. Select a field to include in the display, for example type:
3. To verify the new field displays, look at the Log message table. The new column, named type in this
example, now shows within the list:,

Zenoss, Inc.
8 Search & Display Logs with Kabana
Kibana Search Examples To effectively use the Kibana search engine, it is important to use appropriate search strings that return the information of interest. The following are examples of useful search strings.
Search Expression Returns
audit.log messages from the audit log
audit.log – “user=unknown” messages from the audit log involving known users
event.log event.log entries. Note: The event.log file is where Zope logs non-HTTP related messages.
Z2.log Z2.log entries Note: The Z2.log contains HTTP messages.
zenperfsnmp- INFO messages from the zenperfsnmp service omitting INFO level messages. Note: Although any service name can be used in place of zenperfsnmp, only some services specify a log level. The query will work even in the absence of a log level.