pcpc quality metrics benchmark survey...
TRANSCRIPT

1
PCPC QUALITY METRICS
BENCHMARK SURVEY
YEAR SEVEN

2
7th Year Quality Metric Survey
Business Success
Through
Continuous Quality Improvement

3
Background of PCPC Quality Metrics Survey
• Based on the Malcolm Baldridge Model for
Excellence
• How does your performance compare to your overall
industry performance?
• Includes Metrics used by member companies to
manage product quality and corporate performance
• Metrics:
• FDA survey focuses on drug products
• PCPC survey focuses on cosmetics and drugs

4
Baldrige Performance Excellence Program | 2016
Baldrige Excellence Framework
A systems approach
to improving your
organization

5
• Is your organization doing as well as it could?
• How do you know?
• What and how should your organization improve or change?
The Baldrige Approach in 3 Questions

6
• A systems perspective
• Core values and concepts
• Criteria for Performance Excellence
• Scoring system

7
A Systems Perspective

8
Category Point Values 1 Leadership 120
2 Strategy 85
3 Customers 85
4 Measurement, Analysis, and
Knowledge Management 90
5 Workforce 85
6 Operations 85
7 Results 450 (45%)
Total
1,000

9
Evaluating Results (45% of Scoring Criteria)
• Levels: What is your current performance?
• Trends: Are the results improving, staying the
same, or getting worse?
• Comparisons: How does your performance
compare with others in your industry?
• Integration: Are you tracking important
results? Are you using the results?

10 Baldrige Performance Excellence Program | www.nist.gov/baldrige
For more information • Baldrige Excellence Framework booklets and
free content
• Self-assessment tools
• Organizational assessments
• Training, conferences, executive education
• Award recipient profiles
• Case studies
• Connections to the Baldrige community
www.nist.gov/baldrige
301-975-2036

11
Survey Data Analysis
• While the final Metric report for 2016 will include
detailed analysis of each of survey question, a top
line historical summary is available now.
• Where appropriate, averages are shown and
improvement or declining trends are highlighted.
• Best in Class is defined as the best 20% of the
responding companies.

12
20 Metrics have been surveyed
• Company
Identification
• Business Model
• Company Size
• Business Type
• Drug Registration
• # Sites Registered
• Quality Metrics
• % QA Budget
• PPM FG Defects
• Complaints Per Million
• % 1st Pass Batch Approval
• % 1st FG Approval
• % FG Micro Rejects
• % QA FTE / Mfg. FTE
• % Batch Record Accuracy

13
20 Metrics have been surveyed
• Regulatory Data
• PPM Annual Adverse
Events
• PPM Annual Serious
Adverse Events
• # FDA Inspections
• # 483 Observations
• OTC Metrics (New in
2016
• Aware of OTC Qmetrics
program
• Readiness for OYC
Qmetrics Program
• Willingness to
Benchmark OTC
Qmetrics Program

14
Company Identification

15
#1 What is the size of your company? Size is defined by gross sales for the
latest reporting period. Calculate as annual $ amount.
2
0
4
12 12
0
2
4
6
8
10
12
14
<1 M 1 M - 10 M 10 M - 100 M 100 M - 1 B > 1 Billion
2016 Number of Companies Annual Sales (n=30)

16
#2 Please identify whether your data are based on global or North American markets.
21
9
2016
Global
North America

17
#3 Which of the following descriptions best fits your primary business?
24
5
1
0
0 5 10 15 20 25 30
Manufacturer of Finished Goods for Retail/OnlineDistribution
Contract Manufacturer
Supplier of Raw Materials
Supplier of Packaging Components
2016 Primary Business

18
#4 Does your company have any sites that are registered with FDA as drug establishments?
87%
13%
2016 Companies Registered as Drug Establishment
Yes
No

19
#5 How many sites do you have that are registered with the FDA (drug and/or cosmetic)?
4
7 7
3
1
0
1 1 1
0 0
3
1 1
0
1
2
3
4
5
6
7
8
0 1 2 3 4 5 6 7 8 9 10 11 ~ 15 16 ~ 20 >20
# C
om
pan
ies
# Sites Registered
# Sites Registered with FDA (2016) (n=30) Average = 4.5 Sites/Company

20
Quality Metrics

21
#6 What is your company's Total Quality Assurance Budget/Company Gross Sales? Total Quality Assurance Budget refers to total quality assurance/control spending and is defined as a
% of Gross Revenue. Calculate as: $ Annual QA budget/$ Gross Annual Sales expressed as a %
0.1 0.2 0.3 0.3 0.4 0.5 0.6 0.6 0.8 0.8 1.0 1.0 1.1 1.3 1.3 1.4 1.5 1.5 2.1
3.2 4.0
6.6
0
1
2
3
4
5
6
7
1 2 3 4 5 6 7 8 9 10 11 12 13 14 15 16 17 18 19 20 21 22 23 24
# C
om
pa
nie
s
2016 Percent QA Budget / Gross $Sales - All Responses
n = 23
Average = 1.3 %
1.5 0.8 1.0 1.0 1.3
0.9 1.3
0.2 0.3 0.1 0.0 0.2 0.0 0.1
7.0
3.7
5.0
4.0
3.0 3.2
6.6
0.0
1.0
2.0
3.0
4.0
5.0
6.0
7.0
8.0
2010 2011 2012 2013 2014 2015 2016
Pe
rce
nt
History Percent QA Budget / Gross $ Sales
Average
Min
Max

22
#7 What is your company's annual parts per million (ppm) Defective
Finished Goods (FG)? A finished good unit is defined as the final packaged product in the shipping
case. A defective FG unit has one or more defects. Calculate as: (# Defective FG units/# FG units produced) X 1,000,000
10 165 1,056
1,500 1,800 2,546 2,635 2,658
3,500 3,725 4,600
5,000 5,000 5,528
7,300
9,700
11,340
19,500
0
5,000
10,000
15,000
20,000
1 2 3 4 5 6 7 8 9 10 11 12 13 14 15 16 17 18
P
P
M
2016 Finished Goods PPM Defects By Company (n=18)
Industry Average 4,865 PPM
Best In Class
Lower
is
better

23
#8 What is your company's annual quality complaints per million units sold? Quality complaints are defined as product and/or package quality complaints Calculate as:
(Total # of product and package complaints / total units sold) X 1,000,000
1 1 1 16 45 52 60 61
85 86 100 104 106 108 115 117 141 162
214
279 296
1164
0
100
200
300
400
500
600
700
800
900
1000
1100
1200
1300
1 2 3 4 5 6 7 8 9 10 11 12 13 14 15 16 17 18 19 20 21 22
C
O
M
P
L
A
I
N
T
S
P
E
R
M
I
L
L
I
O
N
2016 Complaints Per Million Units Sold (n=22)
Industry Avg 151
Best In Class
1 - 45
# Companies
Lower is Better

24
#9 What is your company's annual % 1st pass batches? A batch is defined as the
final in-process product ready for filling. A reject is defined as a batch that does not meet specification and is reworked or scrapped. Calculate as: (Total batches manufactured – total batches rejected) X 100/Total batches manufactured
90
91
92
93
94
95
96
97
98
99
100
1 2 3 4 5 6 7 8 9 10 11 12 13 14 15 16 17 18 19 20 21 22 23
2016 % First Pass Batch Approval
(n=22)
Industry Avg
98.2 %
Higher
is
Best In Class
>99.2%

25
#10 What is your company's annual % 1st pass finished goods? 1st pass finished
goods is defined as the % finished goods that meet specification without any rework. Rework is defined as any additional labor expended to bring off-quality goods back into specification. Reject is defined as any product that does not meet specification and is scrapped. Calculate as: [Total units produced – (total units reworked + total units rejected)] X 100 / Total Units produced
92.0
93.0
94.0
95.0
96.0
97.0
98.0
99.0
100.0
1 2 3 4 5 6 7 8 9 10 11 12 13 14 15 16 17 18 19 20 21 22 23
% 1
st P
ass
FG
2016 % 1st Pass Finished Goods
(n=22)
Industry Avg
99.0%
Higher
is
Better
Best In Class
>99.6 %

26
#11 What is your company's annual % Finished Goods (FG) microbiological rejects? FG microbiological reject units are defined as the number of FG units that are out of
microbiological specification. Calculate as: (# FG micro reject units / # FG micro units produced) X 100
0 0 0 0 0 0.00
0.05
0.10
0.15
0.20
0.25
0.30
1 2 3 4 5 6 7 8 9 10 11 12 13 14 15 16 17 18 19 20 21 22 23
% M
icro
Re
jec
ts
2016 % Finished Goods Micro Rejects
(n=23)
Industry
Avg .03%
Lower
is
Better
BIC
= 0%

27
#12 What is your company's annual % for QA and QC Full Time Equivalent per Total Manufacturing Full Time Equivalent? QA and QC Full Time Equivalent or FTE is defined as total
personnel engaged in QC and QA activities vs. true product or process development work. Manufacturing (Mfg) FTE is defined as total personnel engaged in manufacturing and direct support of manufacturing (not development or distribution.) Calculate as QA FTE/Total Mfg FTE x 100
0
2
4
6
8
10
12
14
16
18
20
22
24
26
1 2 3 4 5 6 7 8 9 10 11 12 13 14 15 16 17 18 19 20 21 22 23
% Q
A F
TE/M
FG F
TE
2016 % QA FTE/Manufacturing FTE
(n=23)
Industry Avg 11%
# Companies

28
QA FTE History
9.5 8.6 8.7 12.1 12.3 12.8
11.0
0.0
10.0
20.0
30.0
40.0
50.0
60.0
2010 2011 2012 2013 2014 2015 2016
7 Year History % QA FTE/Manufacturing FTE
Average: Min: Max:
29
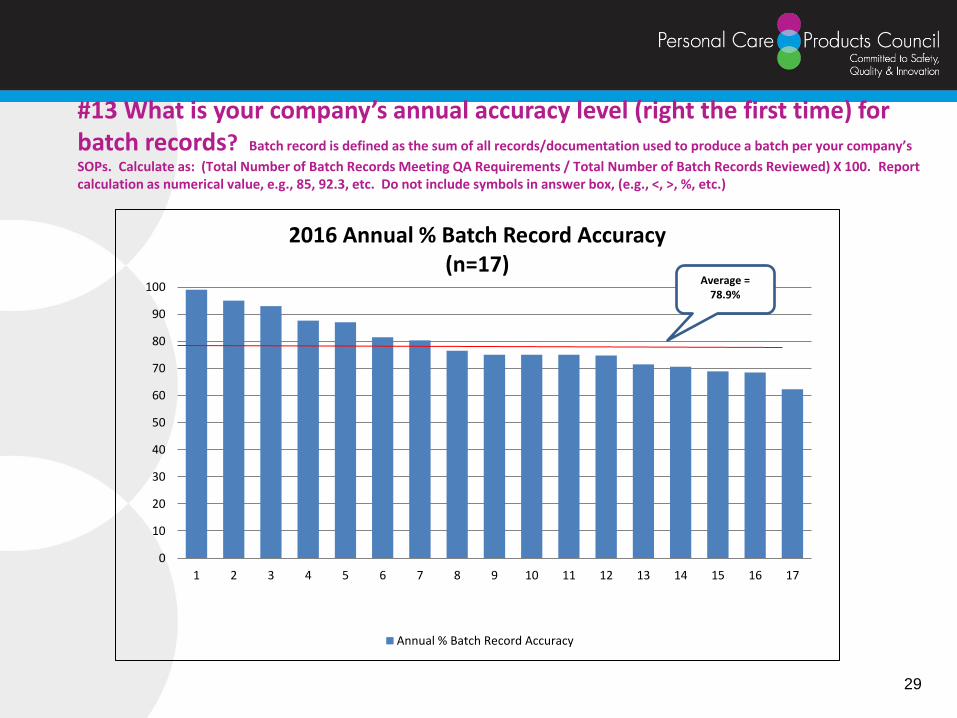
#13 What is your company’s annual accuracy level (right the first time) for batch records? Batch record is defined as the sum of all records/documentation used to produce a batch per your company’s
SOPs. Calculate as: (Total Number of Batch Records Meeting QA Requirements / Total Number of Batch Records Reviewed) X 100. Report calculation as numerical value, e.g., 85, 92.3, etc. Do not include symbols in answer box, (e.g., <, >, %, etc.)
0
10
20
30
40
50
60
70
80
90
100
1 2 3 4 5 6 7 8 9 10 11 12 13 14 15 16 17
2016 Annual % Batch Record Accuracy (n=17)
Annual % Batch Record Accuracy
Average = 78.9%

30
Regulatory Data

31
#14 For personal care products, what is your company’s annual Adverse Event (AE) rate per million units sold? An Adverse Event is any undesirable health related experience associated with the
use of a product. The event usually occurs within the normal and expected use of the product. Personal care products include makeup, hair care, skin care, fragrance, and related OTC products. Calculate a (Total AE / Total Products Sold) X 1,000,000. Report calculation as numerical value, e.g. 0.05. Do not include units or symbols in answer box (e.g., <, >, ppm.)
107
57
28 27
8.9 6.67 5.26 3 2 1.41 0.32 0.01 0 0
20
40
60
80
100
120
1 2 3 4 5 6 7 8 9 10 11 12 13
2016 Annual Adverse Events per Million Units Sold (n=13)
Annual Adverse Events per Million Sold
Average = 18.97 ppm
BIC = >3 ppm

32
#15 For personal care products, what is your company’s annual Serious Adverse Event (SAE) rate per million units sold? Personal care products include makeup, hair care, skin care,
fragrance, and related OTC products. SAE is defined in accordance with FDA’s definition for drugs in 21 CFR 314.80(a) and is any adverse experience that: Results in any of the following outcomes: death, a life-threatening experience, inpatient hospitalization or prolongation of existing hospitalization, a persistent or significant disability or incapacity, or a congenital anomaly/birth defect; Requires, based on reasonable medical judgment, a medical or surgical intervention to prevent an outcome described above . Calculate as: (Total SAE / Total Products Sold) X 1,000,000 Report calculation as numerical value, e.g., 0. Do not include units or symbols in answer box (e.g., <, >, ppm.)
0 0 0 0
0.5
1
1.5
2
2.5
3
3.5
1 2 3 4 5 6 7 8 9 10 11 12
2016 Serious Adverse Events per Million Units Sold (n=12)
Serous Adverse Events per Million Units Sold
Average = 0.4 ppm
33
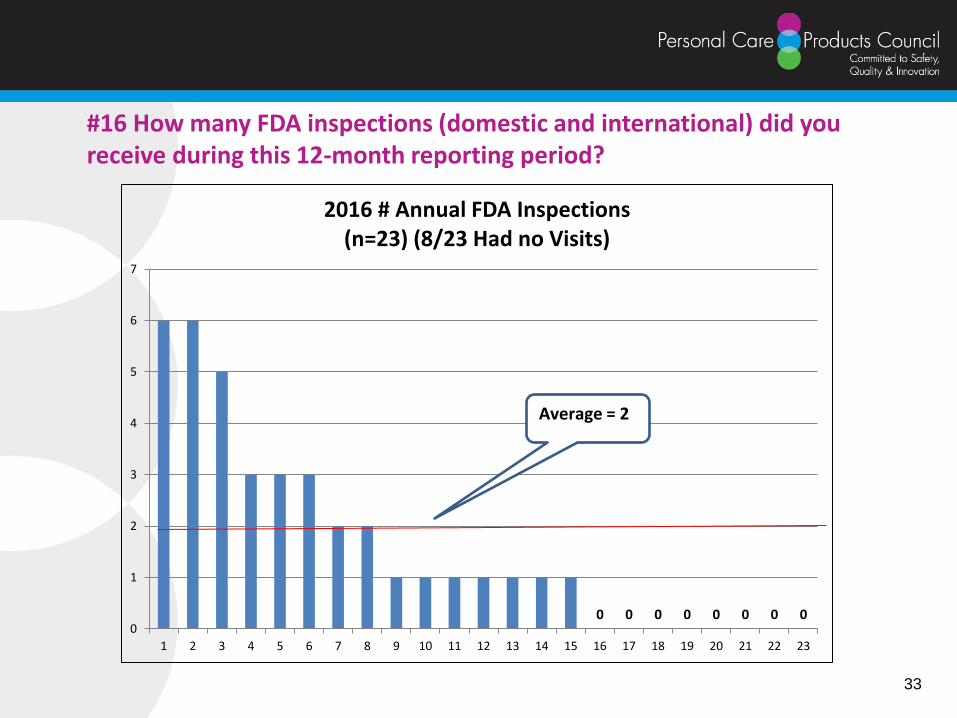
#16 How many FDA inspections (domestic and international) did you receive during this 12-month reporting period?
0 0 0 0 0 0 0 0 0
1
2
3
4
5
6
7
1 2 3 4 5 6 7 8 9 10 11 12 13 14 15 16 17 18 19 20 21 22 23
2016 # Annual FDA Inspections (n=23) (8/23 Had no Visits)
Average = 2

34
#17 How many 483 observations did you receive from these inspections?
23
16
10 9
8 7
5
3 2 2 2
1 0 0 0 0 0 0 0 0 0 0
0
5
10
15
20
25
1 2 3 4 5 6 7 8 9 10 11 12 13 14 15 16 17 18 19 20 21 22
2016 # 483's Issued (n=22)(10 companies had no 483 observations)
Average = 4

35
OTC Qmetrics

36
#18 Are you aware of FDA’s quality metrics program which will create
a reporting obligation for quality data related to drug products (including OTCs) produced in or for the US market?
60%
40%
2016 Awareness of FDA's Qmetrics program (n=25)
Yes
No

37
#19 On a scale of 1-5, what is your company’s level of readiness to report quality metrics data to FDA? (1=just getting started; 5=very prepared)
17
0
3
1 0
0
2
4
6
8
10
12
14
16
18
1 2 3 4 5
2016 Level of Readiness (n=24)(Average = 1.5)

38
#20 Would your company be interested in participating in an OTC industry quality metrics initiative to facilitate benchmarking via parallel analytics on the quality metrics data reported to FDA?
44%
56%
2016 Level of Interest Participating in OTC Qmetrics Benchmarking
(n=25)
Yes
No

39
Summary

40
Company Identification
S
U
M
M
A
R
Y
2010 2011 2012 2013 2014 2015 2016
Responses
North
American 10 9 12 14 17 13 9
Global 11 8 16 27 39 11 21
Total 21 17 28 41 56 24 30
Company Size
>$1B 10 10 12 18 24 13 12
$100M -
$1B 6 3 6 16 21 8 12
$10M -
$100M 4 3 8 5 9 2 4
$1M -
$10M 1 0 2 1 2 0 0
<$1M 0 1 0 1 0 1 2
Business Type
Finished
Goods 43 20 29
Supplier 13 4 1
Registered as
Drug
Manufacturer
Yes 22/92% 26/87%
No 2/8% 4/13%
# Sites
Registered # 82 135

41
Quality Metrics
S
U
M
M
A
R
Y
2010 2011 2012 2013 2014 2015 2016
% QA Budget /
Revenue Average 1.5% 0.8% 1.0% 1.0% 1.0% 0.9% 1.3%
PPM Finished
Goods Defects Average
3,759 ppm 2,563 ppm 13,358 ppm 24,581 ppm 22,555 ppm 11,743 ppm 4,865
ppm
BIC 20 – 50 BIC 0 - 1 BIC 10 - 1,214 BIC 0 – 1,057 BIC 217 -
3,200 BIC 25 - 452 BIC 10 - 1,500
Complaints per
Million Units Sold Average
156 cpm 140 cpm 264 cpm 165 cpm 166 cpm 189 cpm 151 cpm
BIC .3 – 12 BIC 4 - 20 BIC 0.2 - 95 BIC 0 - 51 BIC .05 - 50 BIC 1 - 50 BIC 1 - 45
% 1st Pass Batch
Approval Average
96.80% 98.40% 96.00% 98.40% 98.30% 98.50% 98.20%
BIC 99.2 –
99.8 BIC 99.9 - 100
BIC 99.4 -
99.9 BIC 99.5 - 100
BIC 99.5 -
99.8
BIC 99.5 -
99.8 BIC >99.2%
% 1st Pass Finished
Goods Average
98.4% 99.0% 98.8% 98.0% 98.3% 98.50% 99.00%
BIC 99.4 –
99.9
BIC 99.7 -
99.9
BIC 99.5 -
99.8 BIC 99.6 - 100 BIC 99.7 - 100
BIC 99.3 -
99.5 BIC >99.6%
% Finished Goods
Micro Rejects Average
0.06% 0.18% 0.17% 0.06% 0.04% 0.08% 0.03%
BIC 0 BIC 0 BIC 0 BIC 0 BIC 0 BIC 0 BIC 0
% QA FTE / Mfg.
FTE Average 9.50% 8.60% 8.50% 12.10% 12.30% 12.80% 11.00%
% Batch Record Accuracy
Average 79% 74% 79.00%
BIC >90% BIC >90% BIC >90%
42
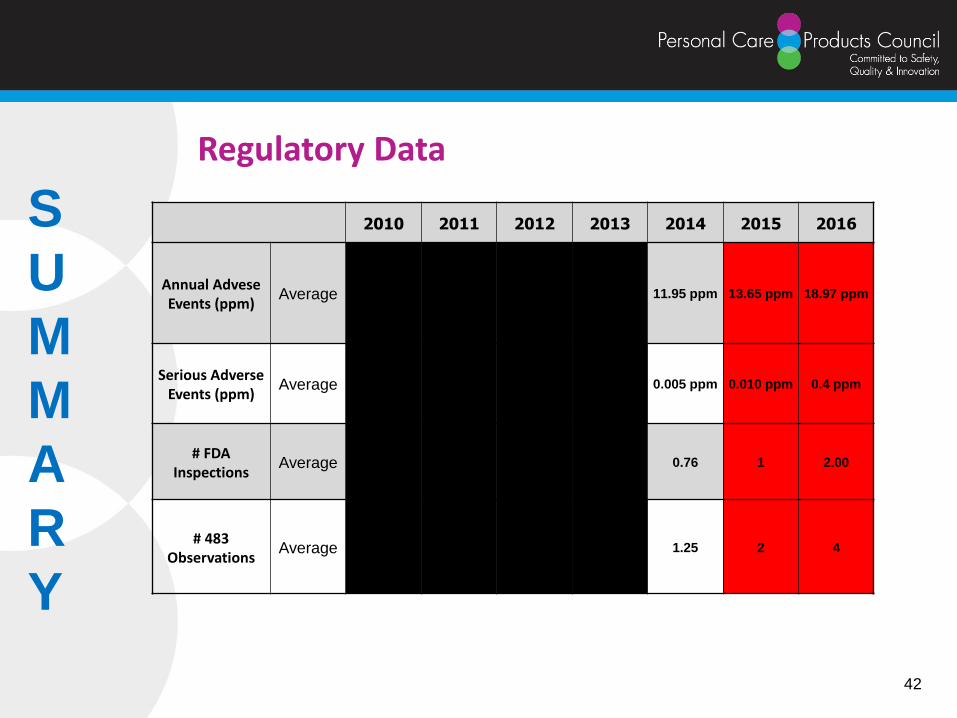
Regulatory Data
S
U
M
M
A
R
Y
2010 2011 2012 2013 2014 2015 2016
Annual Advese Events (ppm)
Average
11.95 ppm 13.65 ppm 18.97 ppm
Serious Adverse Events (ppm)
Average
0.005 ppm 0.010 ppm 0.4 ppm
# FDA Inspections
Average
0.76 1 2.00
# 483 Observations
Average
1.25 2 4

43
OTC Qmetrics
S
U
M
M
A
R
Y
2010 2011 2012 2013 2014 2015 2016
Aware of Qmetrics Program
Yes
60%
Readiness for Qmetric
Program (1-5)
1= Just Started
5= Very Prepared
1.5
Willing to Participate in OTC Industry
Metric Initiative
Yes
44%

44
QUESTIONS?
Thank You!!
Reminder --
The complete 2016 annual metrics report will shortly be
available on the PCPC website:
http://www.personalcarecouncil.org/