paypal mcommerce index - send money, pay … · at a glance continued mcommerce opportunity for...
TRANSCRIPT
PAYPAL MCOMMERCE INDEX AUSTRALIA 2017
© 2017 PayPal

CONTENTSIntroduction
Libby Roy, Managing Director, PayPal Australia
At a Glance
mCommerce in Australia
mCommerce State of Play
mCommerce Device Preference
mCommerce Frequency
Consumer mCommerce Spend
mCommerce Spend
mCommerce Purchasing by Category
mCommerce Situational Spending
mCommerce Drivers and Barriers
Social Commerce
Social Commerce State of Play
Social Commerce Drivers and Barriers
On Trend: The Australian App Story and Generation Z
App Landscape in Australia
Understanding the Impact of Gen Z
Methodology
3
4
5
6
8
10
12
13
14
15
16
18
19
20
21
22
24
26

INTRODUCTION
Libby Roy Managing Director PayPal Australia
Welcome to the PayPal mCommerce Index 2017, our review of the state of mobile commerce in Australia.
Launched in 2016, the Index aims to give readers a year-on-year (YoY) understanding of the evolving mobile commerce landscape and support Australian businesses to adapt to changing customer behaviour. This edition also includes special sections on app usage and the mCommerce behaviours of our youngest consumers, Gen Z.
Over the past year, we’ve seen the frequency of mobile purchases and mobile device preference grow significantly. According to our research, the number of Australian smartphone users who buy via mobile at least once a week has increased 12% (36% in 2016 vs. 48% in 2017) and a quarter of those surveyed now prefer smartphones over all other devices for making online purchases – a jump of almost 40% YoY (18% in 2016 vs 25% in 2017).
However, while mCommerce users are spending more frequently and preferring it more, the number of Australians using mCommerce has stayed relatively stable, moving from 71% in 2016 to 72% in 2017. Similarly, the large gap between the high
level of consumer mCommerce adoption (72%) and business readiness is also stable. Only 51% of online businesses are optimised to accept mobile payments – an increase of just 2% YoY.
Although mCommerce adoption is stable, we have seen significant growth in social commerce uptake by businesses. While consumer use of social commerce has remained steady (11% in 2016, 11% in 2017) there has been a 128% YoY growth in businesses accepting payments via social media platforms (7% in 2016, 16% in 2017).
Overall 2017 hasn’t been easy for Australian retail. Local retailers are feeling the pressure of international competition, which is likely to increase. Add into the mix a combination of low wage growth1, mortgage pressures and increasing cost of household basics2 and we’re looking at a tough environment for local businesses.
We hope that the PayPal mCommerce Index 2017 helps you to understand the Australian mobile commerce landscape, and where the opportunities for Australian businesses lie.
1 http://www.abs.gov.au/ausstats%[email protected]/mediareleasesbyCatalogue/955FBDF6A933C1FDCA2568A900136286?Opendocument 2 http://www.abs.gov.au/ausstats/[email protected]/0/97E70263E0B479CFCA257059007E19B6?OpenDocument 3PayPal mCommerce Index – Australia 2017

AT A GLANCECONTINUED MCOMMERCE OPPORTUNITY FORAUSTRALIAN BUSINESSES
SOCIAL COMMERCE
MCOMMERCE ADOPTION
CONSUMER REASONS FOR CHOOSING APP PAYMENTSBUSINESS APP ADOPTION
FREQUENCY OF MCOMMERCE AVERAGE MCOMMERCE SPEND
CONSUMER SOCIAL COMMERCE BUSINESSES GOING SOCIAL
of consumers purchase via social media(Flat vs. 2016) using mainly Facebook (86%)
of businesses now accept paymentsvia social platforms (vs. 7% vs. 2016)
of consumers use mobile devices for payments
(vs. 71% in 2016)
72%of businesses aremobile-optimised(vs. 49% in 2016)
51%of consumers make
payments via mobile at leastweekly (vs. 36% in 2016)
48%
of businesses accept or plan to acceptsocial payments in the next 6 months
30%16%11%
If easier and betterthan the website
of businesses have anapp, an 88% YoY increase
(vs. 8% in 2016)
15%
If they were o�ereddeals or promotion
40%have made a spontaneous
mobile purchase
58%
have abandoned a purchasevia mobile if too long or di�cult
of Gen Z smartphoneowners shop on mobile
55%82%
APPS GEN Z MOBILE SHOPPERS
is the average consumerspend per month(vs. $330 in 2016)
$331
56%

MCOMMERCE IN AUSTRALIA
PayPal Merchant
Consumers making mobile payments
2016 2017 2016 2017
MCOMMERCE ADOPTION
Businesses with mobile optimised sites
71%49% 51%
72%
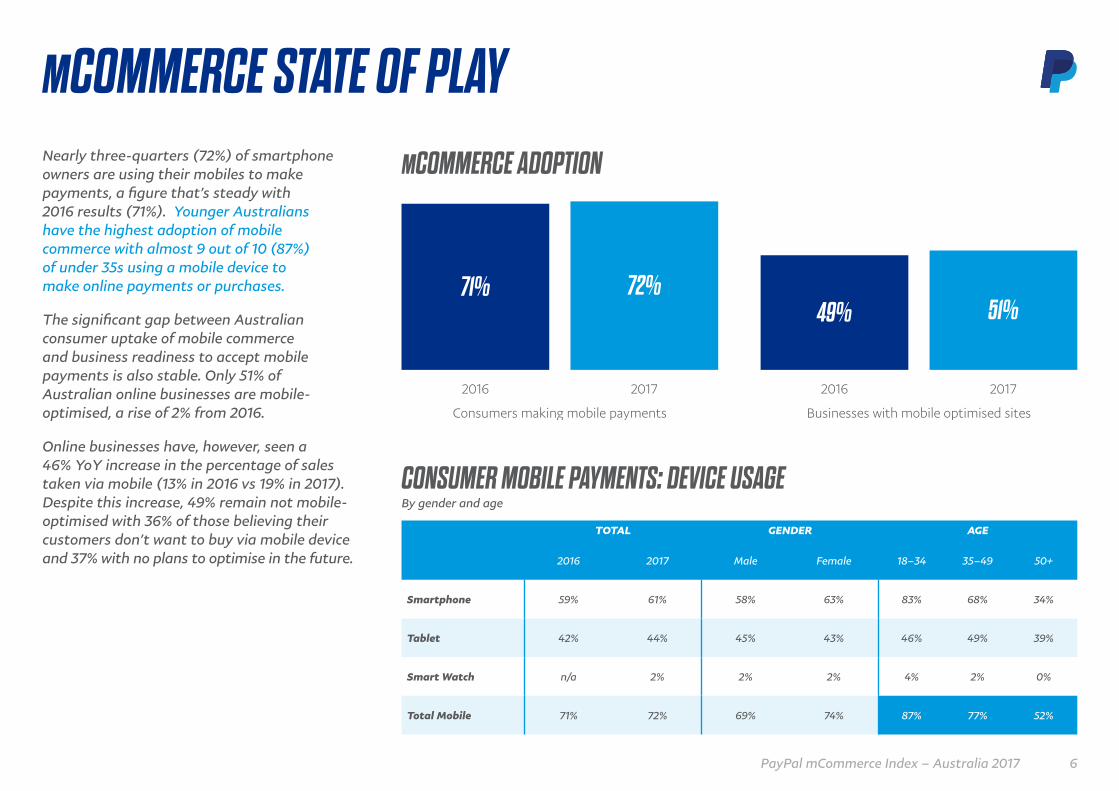
MCOMMERCE STATE OF PLAYNearly three-quarters (72%) of smartphone owners are using their mobiles to make payments, a figure that’s steady with 2016 results (71%). Younger Australians have the highest adoption of mobile commerce with almost 9 out of 10 (87%) of under 35s using a mobile device to make online payments or purchases.
The significant gap between Australian consumer uptake of mobile commerce and business readiness to accept mobile payments is also stable. Only 51% of Australian online businesses are mobile-optimised, a rise of 2% from 2016.
Online businesses have, however, seen a 46% YoY increase in the percentage of sales taken via mobile (13% in 2016 vs 19% in 2017). Despite this increase, 49% remain not mobile-optimised with 36% of those believing their customers don’t want to buy via mobile device and 37% with no plans to optimise in the future.
TOTAL GENDER AGE
2016 2017 Male Female 18–34 35–49 50+
Smartphone 59% 61% 58% 63% 83% 68% 34%
Tablet 42% 44% 45% 43% 46% 49% 39%
Smart Watch n/a 2% 2% 2% 4% 2% 0%
Total Mobile 71% 72% 69% 74% 87% 77% 52%
CONSUMER MOBILE PAYMENTS: DEVICE USAGEBy gender and age
6PayPal mCommerce Index – Australia 2017

BUSINESS MOBILE OPTIMISATIONBreakdown of mobile optimisation for Australian businesses
Total mobile-optimised
Total notoptimised
51%vs 49% in 2016
Don’t have a mobile- optimised site or app
& no plans to optimise
Currently developing or planning to develop
Don’t knowHave a responsive design site
37%
Have a mobile app
15%Have a mobile-
optimised site through a third party
14%37%
Have an m-site
7% 8% 4%
49%vs 51% in 2016
Mobile-optimised Not mobile-optimised
PERCENTAGE OF SALES VIA MOBILE
Don’t know
20% 17%
Average mobile sales 1–10%
30%
18%
None
26% 26%
11–20%
6% 9%
21%–30%
6% 10%
31%–50%
7%12%
51%–100%
6% 9%
2016 2017
13%19%
46%YoY Growth
MCOMMERCE STATE OF PLAY
Based on unique response count
7PayPal mCommerce Index – Australia 2017

39% OF 18-34 YEAR OLDSLISTED SMARTPHONE ASTHEIR PREFERRED DEVICEFOR SHOPPING ONLINE
31%
69% 63%
37%
Total Computer Total Mobile
2016 2017
MCOMMERCE DEVICE PREFERENCEDesktop and laptop computers remain the preferred devices for making online purchases (63% in 2017, 69% in 2016). However computers are rapidly losing ground to mobile devices, which at 37% have increased in preference by 6% (19% YoY growth) since 2016.
The shift away from using computers for online purchases has been driven by a decline in desktop and an equal rise in smartphone preference. A quarter of respondents (25%) now prefer transacting via their smartphones over any other device – a rise of 7% representing almost 40% YoY increase (18% in 2016 vs 25% in 2017). Comparatively, desktop preference for online payments dropped by 7% (34% in 2016 vs 27% in 2017).
The rise in smartphone preference is seen across all demographics, with Australians aged 18-34 showing the highest preference for smartphones at 39%, 14% above the average and 9% higher than last year. However, the largest increase in smartphone preference is in the 35-50 age bracket, increasing by 11% in 2017 from 15% to 26%.
This increase in preference for mobile purchases and payments reflects the ongoing drivers for consumers, including convenience and improvements in mobile technology.
CONSUMER DEVICE PREFERENCE
35%
34%
18%
14%
2016
35%
27%
25%
0.4%12%
2017
Laptop
Desktop
Smartphone
Tablet
Smart Watch
8PayPal mCommerce Index – Australia 2017

MCOMMERCE DEVICE PREFERENCE
ALMOST TWO IN FIVEAUSTRALIANS PREFERTO USE A MOBILE TOMAKE ONLINE PAYMENTSOR PURCHASES
TOTAL GENDER AGE
Male Female 18–34 35–49 50+
Laptop 35% 33% 37% 35% 36% 35%
Desktop computer 27% 33% 21% 16% 23% 40%
Smartphone (e.g. iPhone, Samsung Galaxy) 25% 22% 27% 39% 26% 10%
Tablet (e.g. iPad, Samsung Galaxy Tab) 12% 10% 14% 8% 15% 14%
Smart Watch (e.g. Apple watch) 0% 0% 1% 1% 0% 0%
TOTAL COMPUTER 63% 66% 58% 51% 59% 75%
TOTAL MOBILE DEVICE 37% 33% 42% 48% 41% 24%
PREFERENCE BY DEMOGRAPHIC
9PayPal mCommerce Index – Australia 2017

MCOMMERCE FREQUENCYIn line with increased preference to buy via mobile devices, Australians are also buying more often via mobile. Almost half our respondents (48%) now use their mobile device to make payments or purchases at least once a week, an increase of 12% from 2016.
An increase in frequency of mobile payments is evident across all age groups. However younger Australians are more frequent mCommerce users with two thirds of 18-34 year olds transacting on a mobile device at least weekly (66%), compared to 47% in 2016.
Also purchasing more often is the 35-50 year old cohort with 49% now using their mobile at least weekly for purchases, compared to 37% in 2016.
With uplifts across the board, the overarching increase in mobile payment frequency suggests consumers are becoming habituated to the convenience of mCommerce.
ALMOST ONE IN TWO AUSTRALIANS USETHEIR MOBILE DEVICE TO MAKE PURCHASESOR PAYMENTS AT LEAST ONCE A WEEK
10PayPal mCommerce Index – Australia 2017
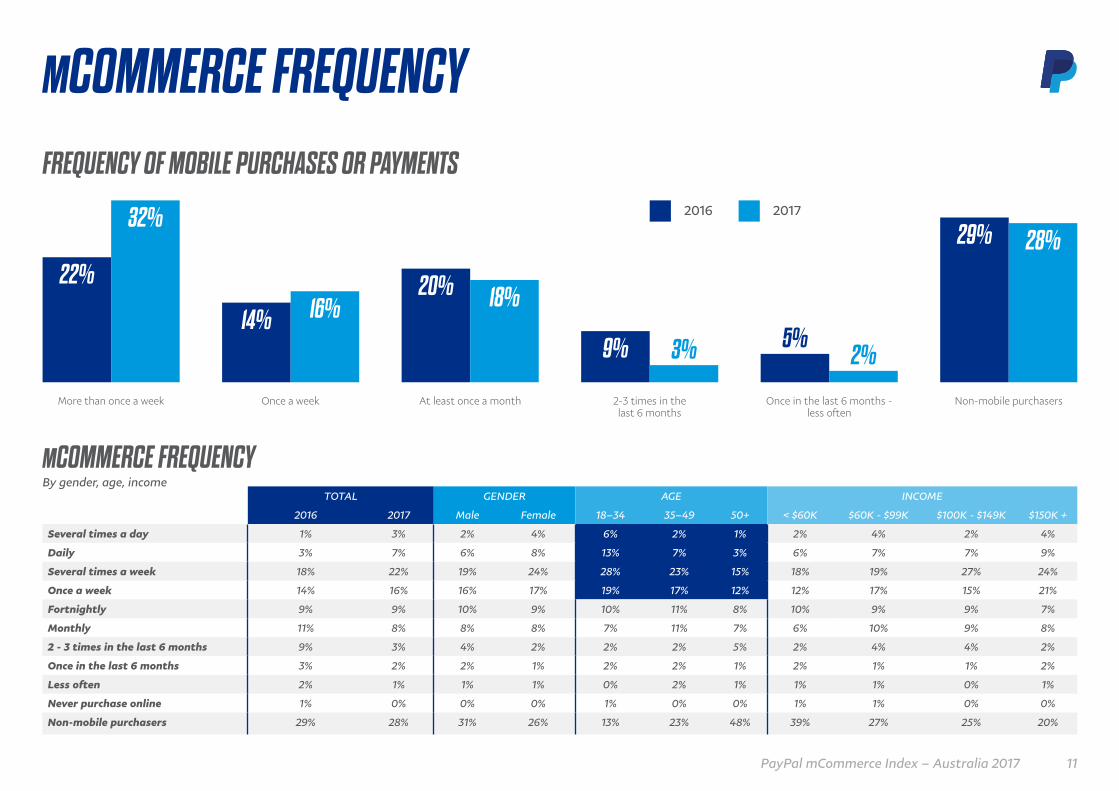
FREQUENCY OF MOBILE PURCHASES OR PAYMENTS
More than once a week Once a week At least once a month 2-3 times in thelast 6 months
Once in the last 6 months -less often
Non-mobile purchasers
2016 2017
22%
32%
14% 16%20% 18%
9%
29% 28%
5%3% 2%
MCOMMERCE FREQUENCY
TOTAL GENDER AGE INCOME
2016 2017 Male Female 18–34 35–49 50+ < $60K $60K - $99K $100K - $149K $150K +
Several times a day 1% 3% 2% 4% 6% 2% 1% 2% 4% 2% 4%
Daily 3% 7% 6% 8% 13% 7% 3% 6% 7% 7% 9%
Several times a week 18% 22% 19% 24% 28% 23% 15% 18% 19% 27% 24%
Once a week 14% 16% 16% 17% 19% 17% 12% 12% 17% 15% 21%
Fortnightly 9% 9% 10% 9% 10% 11% 8% 10% 9% 9% 7%
Monthly 11% 8% 8% 8% 7% 11% 7% 6% 10% 9% 8%
2 - 3 times in the last 6 months 9% 3% 4% 2% 2% 2% 5% 2% 4% 4% 2%
Once in the last 6 months 3% 2% 2% 1% 2% 2% 1% 2% 1% 1% 2%
Less often 2% 1% 1% 1% 0% 2% 1% 1% 1% 0% 1%
Never purchase online 1% 0% 0% 0% 1% 0% 0% 1% 1% 0% 0%
Non-mobile purchasers 29% 28% 31% 26% 13% 23% 48% 39% 27% 25% 20%
MCOMMERCE FREQUENCYBy gender, age, income
11PayPal mCommerce Index – Australia 2017

CONSUMER MCOMMERCE SPEND
PayPal Merchant
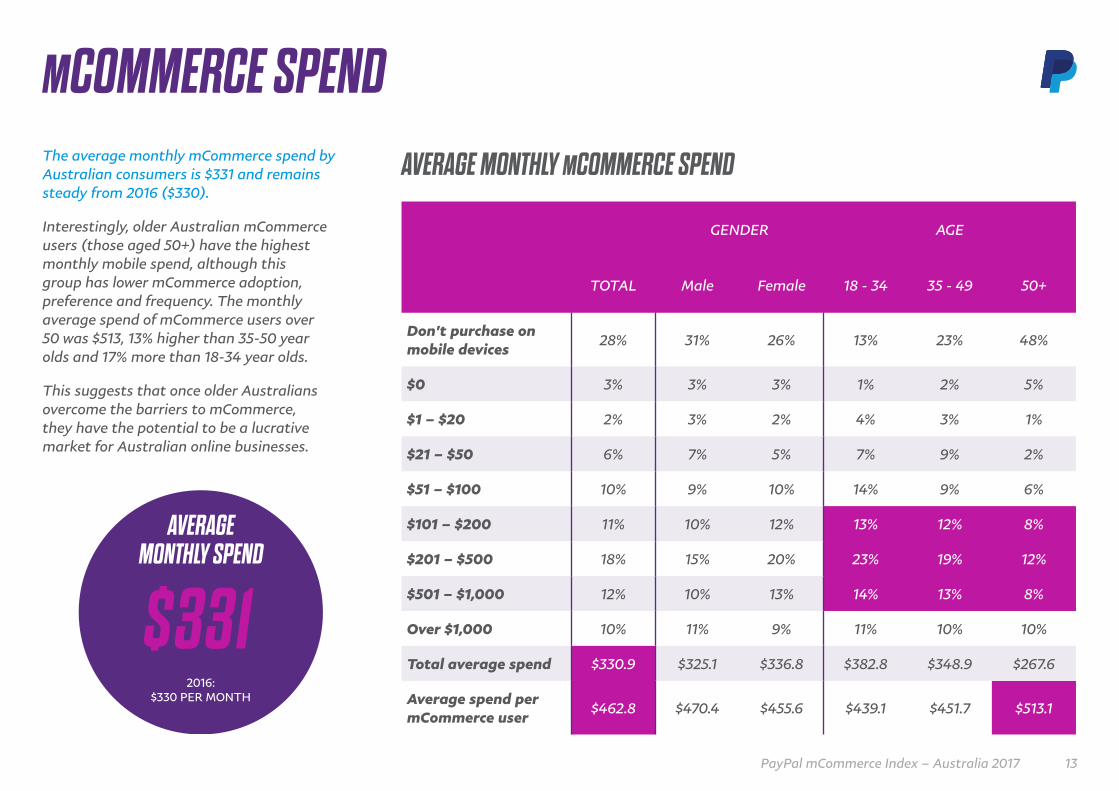
The average monthly mCommerce spend by Australian consumers is $331 and remains steady from 2016 ($330).
Interestingly, older Australian mCommerce users (those aged 50+) have the highest monthly mobile spend, although this group has lower mCommerce adoption, preference and frequency. The monthly average spend of mCommerce users over 50 was $513, 13% higher than 35-50 year olds and 17% more than 18-34 year olds.
This suggests that once older Australians overcome the barriers to mCommerce, they have the potential to be a lucrative market for Australian online businesses.
MCOMMERCE SPENDAVERAGE MONTHLY MCOMMERCE SPEND
AVERAGEMONTHLY SPEND
2016:$330 PER MONTH
GENDER AGE
TOTAL Male Female 18 - 34 35 - 49 50+
Don't purchase on mobile devices
28% 31% 26% 13% 23% 48%
$0 3% 3% 3% 1% 2% 5%
$1 – $20 2% 3% 2% 4% 3% 1%
$21 – $50 6% 7% 5% 7% 9% 2%
$51 – $100 10% 9% 10% 14% 9% 6%
$101 – $200 11% 10% 12% 13% 12% 8%
$201 – $500 18% 15% 20% 23% 19% 12%
$501 – $1,000 12% 10% 13% 14% 13% 8%
Over $1,000 10% 11% 9% 11% 10% 10%
Total average spend $330.9 $325.1 $336.8 $382.8 $348.9 $267.6
Average spend per mCommerce user
$462.8 $470.4 $455.6 $439.1 $451.7 $513.1
13PayPal mCommerce Index – Australia 2017

MCOMMERCE PURCHASING BY CATEGORYBill payments remained the most common mobile payment category in 2017 (70%), followed by tickets (51%) and clothing and accessories (46%).
Overall, groceries saw the largest increase in mobile purchasing from 2016, increasing 9% to 25%. The continued popularity of ride-sharing services, like Uber, and introduction of electronic ticketing for many of the country’s public transport systems has seen the entry of ‘transport’ as a category in 2017, which now accounts for over a third of mobile purchases (34%).
Similarly, the emergence of fuel apps which let consumers secure and pay for better fuel prices made a strong entrance to the Index, with 11% of Australians saying they pay for fuel via their mobile device. The ongoing development of mobile apps and technology will continue to influence the categories that lead in mobile payments.
PayPal was the most used and most preferred mCommerce payment method with 72% of mobile purchasers using PayPal and 60% preferring it to other payment methods.
Bill Payments
Clothing &Accessories
Food & Drink
Travel
Transport
Electronics &Computing
Grocery
Health & Beauty
Subscriptions
Books & Magazines
Toys & Games
Gambling/Betting
Home & Garden
Sporting Goods
Online Gaming
Charity
Fuel (eg.7 Eleven app)
Tickets (eg.movies, music, arts)
2016
2017
74%70%
53%51%
43%46%
37%39%
38%39%
34%
29%26%
16%25%
19%24%
22%21%
29%20%
21%19%
11%17%
17%15%
11%11%
12%11%
17%11%
11%
TRANSPORT
34%
25%GROCERIES
14PayPal mCommerce Index – Australia 2017

20% OF 18-34YEAR OLDS MAKEMOBILE PAYMENTSOR PURCHASESWHILE AT THE SHOPS
Three-quarters of mCommerce users prefer to shop and make payments on their mobile while in the comfort of their own home. Nearly half of respondents make mobile purchases or payments while watching TV (45%), continuing the ‘dual-screening’ trend seen in 2016.
Shopping or making mobile payments at work emerged as a key situation, with over a third of respondents admitting to shopping on-the-job (34%). The masters of multitasking, 18-34 year olds are the largest perpetrators, with 42% saying they make mCommerce payments while at work.
This year has also seen the emergence of new situational spending scenarios, including transacting on mobile while listening to audio. 18-34 year olds are most likely to make purchases while listening to a podcast or music (11%) compared to an average of 8% overall.
Younger respondents are also more likely to use their mobile for payments while on the go, with under 35s most likely to participate in mCommerce while travelling (29%).
MCOMMERCE SITUATIONAL SPENDING
76%of Australians make mobile
purchases or paymentswhile at home relaxing
42% OF 18-34YEAR OLDS SHOPON THEIR MOBILEWHILE AT WORK
45%of Australians make mobile
payments or purchaseswhile watching TV
15PayPal mCommerce Index – Australia 2017

CONSUMER DRIVERS OF MCOMMERCEConvenience
Ease of use
More online shopping options
More payment options
Technology is improving
Upgraded my technology
Improved online security
41%
30%
17%
12%
8%
7%
6%
I don’t know how toimplement mobile payments 20%
Don’t know what the costsare for mobile optimisation 24%
BUSINESS BARRIERS TO MCOMMERCEDon’t think consumers want
to buy via a mobile device 36%
My business doesn’t need it 8%
My business is too small 2%
Optimising for mobilepayments is too expensive 17%
I don’t understand howmobile purchasing works 11%
I am worried about safetyand information security 19%
Convenience and ease-of-use continue to be key drivers for mCommerce with over a quarter of respondents planning to make more mobile payments over the next year (27%).
For those aged 18-34, the growing choice of online retailers and products is also a driver for mobile transactions (18%), while other age demographics report that they will make more mobile payments after upgrading their device. 12% of all respondents have indicated they will make more mobile payments due to more payment options being available.
While nearly three quarters of consumers are shopping on their mobiles (72%), 36% of non-mobile-optimised businesses believe their customers don’t want to buy via mobile, with 17% believing optimising for mobile is too expensive.
MCOMMERCE DRIVERS AND BARRIERS
16PayPal mCommerce Index – Australia 2017

MCOMMERCE DRIVERS AND BARRIERSMCOMMERCE PAIN POINTSBusiness perception vs consumer reality
Slow page loading 16%21%
37%
Screen sizing 11%21%
31%
Checkout problems 7%12%
19%
Di�culties with navigation 6%16%
22%
Lack of product information 4%10%
14%
Apps not loading or crashing 4%13%
17%
Password recovery 3%12%
15%
Form filling 1%19%
21%
Registration problems 1%8%
9%
Payment problems -1%12%
11%
Security or trust issues -9%23%
14%
Business’ perceivedpain points
Consumer’s actualpain points
Gap between consumer realityand business perception
When it comes to mCommerce barriers, Australian consumers listed slow page loading (37%), screen sizing (31%) and difficulties with navigation (22%) as their main pain points.
In comparison, Australian businesses listed security or trust issues (23%), slow page loading (21%) and form filling (19%) as the top three barriers for consumers shopping via mobile.
This disconnect highlights the continued gap between consumer experience and business understanding in relation to mCommerce and helps pinpoint areas where businesses could better meet their customer needs.
17PayPal mCommerce Index – Australia 2017
SOCIAL COMMERCE
PayPal Merchant

Younger Australians are leading the charge on social commerce with 19% adoption. However the largest growth in adoption is on the business side with 16% of businesses now accepting payments via a social media site, a 128% YoY growth (7% in 2016).
While four in five Australian businesses still don’t sell via social platforms (83%), it’s encouraging to see that 30% of businesses have plans to accept social payments within the next six months – this compares to just 11% in 2016, a clear change in perception by Australian businesses.
Facebook continues to be the most popular platform for Australian consumers who purchase via social platforms (86%) with Instagram a distant second at 29%.
SOCIAL COMMERCE STATE OF PLAY
7%
SOCIAL COMMERCE ADOPTION
16%
BusinessCurrently accept paymentsvia social media sites/apps
2016 2017
11% 11%
ConsumerMade a purchase/
payment through anysocial media platform
CONSUMER SOCIAL COMMERCEBy channel
86% 29%8%14%
Facebook Instagram Snapchat Pinterest
CONSUMER SOCIAL COMMERCE ADOPTIONBy channel, gender and age
GENDER AGE
TOTAL Male Female 18 - 34 35 - 49 50+
Facebook (incl. Messenger) 10% 7% 12% 16% 10% 3%
Snapchat 2% 1% 2% 3% 1% 1%
Pinterest 1% 1% 1% 1% 1% 1%
Instagram 3% 2% 5% 7% 1% 1%
Other 0% 0% 0% 0% 0% 0%
Made a purchase through a social media platform in last 6 months 11% 8% 15% 19% 11% 4%
No purchases through social media platforms in the last 6 months 89% 92% 85% 81% 89% 96%
19PayPal mCommerce Index – Australia 2017

As social media increasingly becomes part of consumers’ lives and business operations, the data shows attitudinal barriers towards social commerce are in decline.
Consumers are becoming less concerned with linking their financial details to social media. 46% of mobile shoppers said they didn’t want their financial details linked (down from 59% in 2016).
While mCommerce users are more comfortable with linking their financial details to social media platforms, security remains a key consideration. Over a third (36%) are concerned about the safety of their personal details in relation to social commerce (38% in 2016) and a further 28% of respondents don’t trust social media.
Holding relatively steady YoY, 26% of businesses believe their customers do not want to buy through social media (28% in 2016). However with 11% of all Australian smartphone users having purchased via social platforms and 13% buying something they’d seen on social media, businesses may need to adapt their strategies to meet consumers where they are transacting and forming purchase decisions.
SOCIAL COMMERCE DRIVERS AND BARRIERSSOCIAL COMMERCE BARRIERSConsumer vs business
Worried aboutsafety and security ofpersonal information
Don’t trust social media
Lack of knowledge
24%
36%
15%
28%
17%
16%
Business
Consumer
20PayPal mCommerce Index – Australia 2017

ON TREND: THE AUSTRALIAN APP STORY AND GENERATION Z
AVERAGE NUMBER OF APPS INSTALLED
1–10
11–25
26–50
50–100
Over 100
30%
31%
23%
12%
3%
AVERAGENUMBER OF APPS
USED DAILY
5
29AVERAGE TOTALNUMBER OF APPS
INSTALLED
65%OF SMARTPHONE
USERS PAYVIA APPS
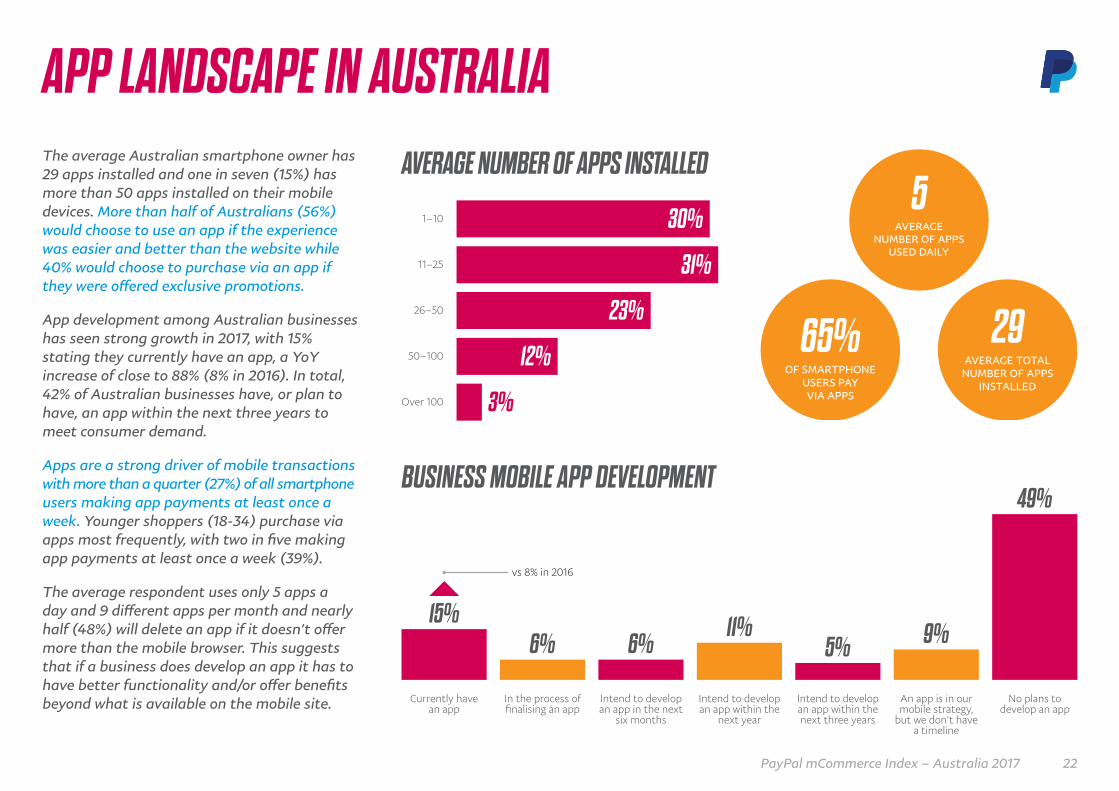
The average Australian smartphone owner has 29 apps installed and one in seven (15%) has more than 50 apps installed on their mobile devices. More than half of Australians (56%) would choose to use an app if the experience was easier and better than the website while 40% would choose to purchase via an app if they were offered exclusive promotions.
App development among Australian businesses has seen strong growth in 2017, with 15% stating they currently have an app, a YoY increase of close to 88% (8% in 2016). In total, 42% of Australian businesses have, or plan to have, an app within the next three years to meet consumer demand.
Apps are a strong driver of mobile transactions with more than a quarter (27%) of all smartphone users making app payments at least once a week. Younger shoppers (18-34) purchase via apps most frequently, with two in five making app payments at least once a week (39%).
The average respondent uses only 5 apps a day and 9 different apps per month and nearly half (48%) will delete an app if it doesn’t offer more than the mobile browser. This suggests that if a business does develop an app it has to have better functionality and/or offer benefits beyond what is available on the mobile site.
APP LANDSCAPE IN AUSTRALIA
BUSINESS MOBILE APP DEVELOPMENT
In the process of finalising an app
Currently havean app
Intend to develop an app in the next
six months
Intend to develop an app within the
next year
Intend to develop an app within the next three years
An app is in our mobile strategy,
but we don’t have a timeline
No plans to develop an app
15%6% 6%
11%5% 9%
49%
vs 8% in 2016
22PayPal mCommerce Index – Australia 2017

REASONS FOR CHOOSING APP PAYMENT
11%
56%
14%
Recommended byfriends or family
Easier/better thana website
It’s more secure
O�ered exclusive dealsor promotions 40%
APP LANDSCAPE IN AUSTRALIAFREQUENCY OF APP PAYMENTS
GENDER AGE
TOTAL Male Female 18 - 34 35 - 49 50+
Several times a day 1% 1% 1% 2% 1% 0%
Daily 3% 3% 4% 6% 3% 1%
Several times a week 11% 12% 11% 17% 11% 16%
Once a week 11% 10% 12% 14% 14% 6%
Fortnightly 10% 10% 11% 13% 11% 6%
Monthly 12% 12% 12% 11% 18% 8%
2 – 3 times in the last 6 months 8% 8% 7% 9% 5% 9%
Once in the last 6 months 2% 2% 2% 3% 1% 2%
Less often 7% 7% 7% 8% 6% 7%
Never purchase online 6% 6% 6% 5% 7% 8%
Non-mobile purchaser 28% 31% 26% 13% 23% 48%
23PayPal mCommerce Index – Australia 2017
of Gen Z mobile shoppersmake payments whilelistening to audio content(eg. podcasts or Spotify)
28%of Gen Z mobile shoppersmake purchases whensocialising with friends
33%of Gen Z mobile shoppershave abandoned a paymentif too long or di�cult
55%
GEN Z – 18-22MILLENNIALS – 23-34
GEN X – 35-49BABY BOOMER – 50-64
SILVER – 65+
of Gen Z mobileshoppers have made aspontaneous purchaseor payment
58%of Gen Z smartphoneowners shop on mobile
82%
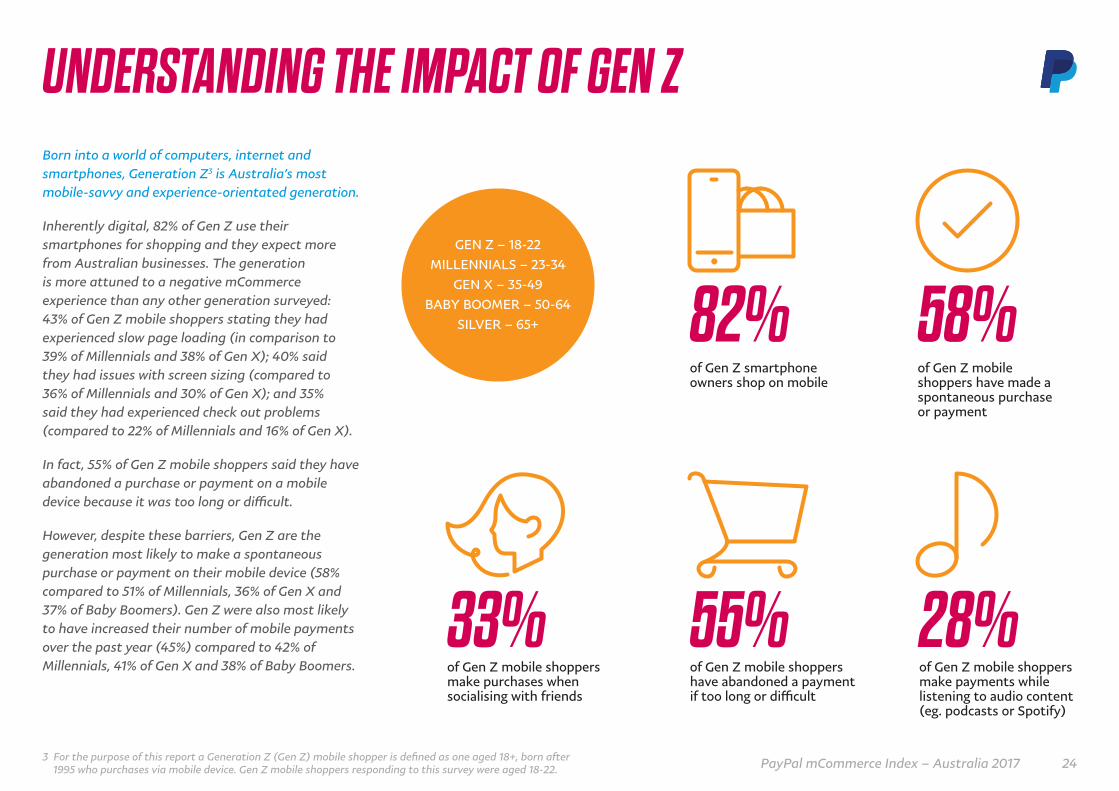
Born into a world of computers, internet and smartphones, Generation Z3 is Australia’s most mobile-savvy and experience-orientated generation.
Inherently digital, 82% of Gen Z use their smartphones for shopping and they expect more from Australian businesses. The generation is more attuned to a negative mCommerce experience than any other generation surveyed: 43% of Gen Z mobile shoppers stating they had experienced slow page loading (in comparison to 39% of Millennials and 38% of Gen X); 40% said they had issues with screen sizing (compared to 36% of Millennials and 30% of Gen X); and 35% said they had experienced check out problems (compared to 22% of Millennials and 16% of Gen X).
In fact, 55% of Gen Z mobile shoppers said they have abandoned a purchase or payment on a mobile device because it was too long or difficult.
However, despite these barriers, Gen Z are the generation most likely to make a spontaneous purchase or payment on their mobile device (58% compared to 51% of Millennials, 36% of Gen X and 37% of Baby Boomers). Gen Z were also most likely to have increased their number of mobile payments over the past year (45%) compared to 42% of Millennials, 41% of Gen X and 38% of Baby Boomers.
UNDERSTANDING THE IMPACT OF GEN Z
3 For the purpose of this report a Generation Z (Gen Z) mobile shopper is defined as one aged 18+, born after 1995 who purchases via mobile device. Gen Z mobile shoppers responding to this survey were aged 18-22. 24PayPal mCommerce Index – Australia 2017
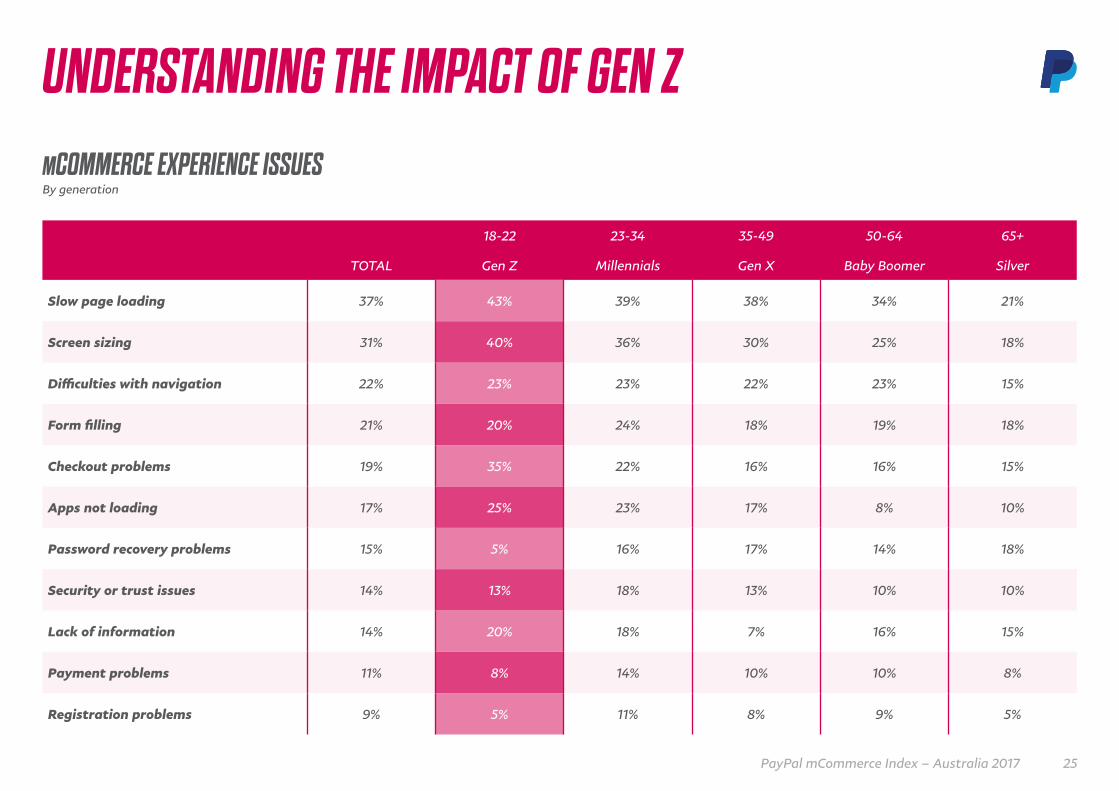
UNDERSTANDING THE IMPACT OF GEN Z
18-22 23-34 35-49 50-64 65+
TOTAL Gen Z Millennials Gen X Baby Boomer Silver
Slow page loading 37% 43% 39% 38% 34% 21%
Screen sizing 31% 40% 36% 30% 25% 18%
Difficulties with navigation 22% 23% 23% 22% 23% 15%
Form filling 21% 20% 24% 18% 19% 18%
Checkout problems 19% 35% 22% 16% 16% 15%
Apps not loading 17% 25% 23% 17% 8% 10%
Password recovery problems 15% 5% 16% 17% 14% 18%
Security or trust issues 14% 13% 18% 13% 10% 10%
Lack of information 14% 20% 18% 7% 16% 15%
Payment problems 11% 8% 14% 10% 10% 8%
Registration problems 9% 5% 11% 8% 9% 5%
MCOMMERCE EXPERIENCE ISSUESBy generation
25PayPal mCommerce Index – Australia 2017
RESEARCH OVERVIEWThis research report was produced by PayPal Australia Pty Limited ABN 93 111 195 389 AFSL 304962, based on a study conducted by ACA Research with n=1,011 consumers and n=408 businesses. It contains general observations about trends in mobile commerce, and does not take into account the objectives, situation or needs of any specific business or individual.
The consumer research conducted by ACA Research consisted of a 10 minute online survey of n=1,011 Australian smartphone users aged 18 and older, exploring adoption, usage and sentiment towards mobile and social commerce. In addition, ACA Research conducted a 5 minute online survey of n=408 business decision makers within Australian small and medium B2C retailers and merchants who sold or took orders online, exploring their attitudes and behaviours around mobile and social commerce.
Numbers may not add to 100% due to rounding.
SAMPLINGConsumer – The consumer research consisted of a sample of n = 1,011 Australian smartphone users aged 18+ (which represents approximately 82% of total Australian population 18+). Quotas were set on age, gender and location, to ensure data was nationally representative. Significance testing was conducted at a 95% confidence interval, with a potential sampling error of 3.08%.
Business – The business research consisted of a sample of n = 408 decision makers within Australian small and medium businesses. All businesses had to sell partially or wholly to consumers, and also sell or take payments online. Quotas were set on turnover and location, to ensure data was a reliable cross section of Australian businesses. Significance testing was conducted at a 95% confidence interval, with a potential sampling error of 4.85%.
PRESS CONTACTTo contact the PayPal Australia media team, please email [email protected]
METHODOLOGYOnline self-completion survey. The research was carried out in compliance with the AMSRS Guidelines and National Privacy Principles. Sample was sourced through consumer and business research panels, with participants incentivised for completing the survey.
TIMINGThe research was in field from Friday 11th to Monday 21st August 2017.
ABOUT PAYPALFueled by a fundamental belief that having access to financial services creates opportunity, PayPal (NASDAQ: PYPL) is committed to democratizing financial services and empowering people and businesses to join and thrive in the global economy. Our open digital payments platform gives PayPal’s 218 million active account holders the confidence to connect and transact in new and powerful ways, whether they are online, on a mobile device, in an app, or in person.
Through a combination of technological innovation and strategic partnerships, PayPal creates better ways to manage and move money, and offers choice and flexibility when sending payments, paying or getting paid. Available in more than 200 markets around the world, the PayPal platform, including Braintree, Venmo and Xoom, enables consumers and merchants to receive money in more than 100 currencies, withdraw funds in 56 currencies and hold balances in their PayPal accounts in 25 currencies.
BUSINESS CONTACTTo find out how to optimise your mobile or social payments contact PayPal Australia on 1800 729 725 or visit PayPal.com.au/business
The information in this report is provided as-is, and while we work to make sure information is accurate, PayPal takes no responsibility for users’ actions, inactions, or decisions based on the information presented.
METHODOLOGY
26PayPal mCommerce Index – Australia 2017

© 2017 PayPal