pay and productivity differences between male and female veterinarians
TRANSCRIPT
Pay and Productivity Differences between Male and Female VeterinariansAuthor(s): David M. SmithSource: Industrial and Labor Relations Review, Vol. 55, No. 3 (Apr., 2002), pp. 493-511Published by: Cornell University, School of Industrial & Labor RelationsStable URL: http://www.jstor.org/stable/2696053 .
Accessed: 28/06/2014 16:10
Your use of the JSTOR archive indicates your acceptance of the Terms & Conditions of Use, available at .http://www.jstor.org/page/info/about/policies/terms.jsp
.JSTOR is a not-for-profit service that helps scholars, researchers, and students discover, use, and build upon a wide range ofcontent in a trusted digital archive. We use information technology and tools to increase productivity and facilitate new formsof scholarship. For more information about JSTOR, please contact [email protected].
.
Cornell University, School of Industrial & Labor Relations is collaborating with JSTOR to digitize, preserveand extend access to Industrial and Labor Relations Review.
http://www.jstor.org
This content downloaded from 91.220.202.52 on Sat, 28 Jun 2014 16:10:03 PMAll use subject to JSTOR Terms and Conditions
PAY AND PRODUCTIVITY DIFFERENCES BETWEEN MALE AND FEMALE VETERINARIANS
DAVID M. SMITH*
The author uses data from annual wage surveys conducted in 1994 and 1995 by Medical Economics Research Group to study differences in pay and produc- tivity between male and female veterinarians in the wage-salary s-ector. The gender gap in average earnings was 15%. When controls for various observable characteristics are added to the analysis, the earnings gap narrows to 9%, based on the most conservative estimates. Using unique revenue production measures in an analysis holding other factors constant, the author finds that women's productivity was not statistically different from men's. Together, the findings of gender differences in earnings but not in productivity are consistent with the presence of wage discrimination, but the author explores other possible expla- nations as well.
N eo-classical economic theory predicts that workers are paid according to
their productivity. Thus, if men and women of equal productivity are paid unequal wages, a claim of wage discrimination may be made. A problem is that data on indi- vidual worker productivity are usually lack- ing in the empirical work on wage discrimi- nation. Most often, researchers must rely on comparing differences in characteris- tics that are correlated with productivity, such as experience, tenure, and educa- tion. However, it may always be claimed that differences in earnings unexplained by observed characteristics could be ex-
*The author is Assistant Professor of Economics at Pepperdine University in the Graziadio School of Business and Management. For valuable advice and comments, he thanksJeff Biddle, Harry Holzer, Rob- ert LaLonde, Mark Schreiner, David Neumark, John Strauss,JeffreyWooldridge, the members of the Michi- gan State University Labor Luncheon Group, and, especially, Stephen Woodbury.
plained by productivity-related characteris- tics unobserved by the researcher. For example, it is difficult to measure charac- teristics such as human capital or ability. Without controlling for these characteris- tics, a claim of wage discrimination is diffi- cult to establish.
One way to address the difficulty of inter- preting unexplained wage gaps is to study pay differences within a single occupation. Since men and women in a given field have made similar career choices and received similar training, they should be more alike in human capital and ability than men and women in the general population. This allows for more direct study of evidence for
The data set used in this paper was made available by VeterinaryEconomics; special thanks to Renee Ander- son, SandyJohnson, and Ray Glick for its provision. The data and copies of the computer programs used to generate the results presented in the paper are available from the author at david.smith@pepperdine. edu.
Industrial and Labor Relations Review, Vol. 55, No. 3 (April 2002). ? by Cornell University. 0019-7939/00/5503 $01.00
493
This content downloaded from 91.220.202.52 on Sat, 28 Jun 2014 16:10:03 PMAll use subject to JSTOR Terms and Conditions
494 INDUSTRIAL AND LABOR RELATIONS REVIEW
employer discrimination. Other re- searchers have studied lawyers, physi- cians, college teachers, and engineers with this approach in mind. In this pa- per, a unique new data set on veterinar- ians is used to study gender differences in earnings. A particular advantage of these data is that they contain valuable proxy measures of productivity-patients seen per hour and revenue generated per year. The ability to control for mea- surable productivity differences between men and women will significantly strengthen evidence of the presence or absence of wage discrimination.
There are also drawbacks to using a spe- cific occupation to study pay differences between men and women. The clear disad- vantage is that one cannot generalize from a single occupation to the entire popula- tion of working men and women. The mechanisms that determine pay and pro- ductivity among veterinarians are not likely to be the same as for the general popula- tion. Nevertheless, the results obtained can be suggestive of the role that gender plays in other labor markets. One addi- tional drawback of examining this issue with a specific occupation is that it may lead to an underestimate of labor market dis- crimination, since it ignores occupational segregation as a potential source of dis- crimination. Occupational segregation may play a significant role in explaining gender differences in earnings in the general popu- lation.
Other Studies and Approaches
The U.S. Department of Labor (2001) reports that in 2000, among all full-time wage-salary workers, women earned 24% less than men. Controlling for occupation narrows the pay gap, given that this variable explains a non-negligible portion of the gender difference in earnings. Blau and Kahn (1997), using data from the Panel Study ofIncome Dynamics (PSID), reported a gender wage gap of 11.8% after control- ling for occupation, along with industry, union status, and other human capital vari- ables.
Other researchers have studied pay dif- ferences within specific occupations, using detailed controls available at the occupa- tion level. Wood, Corcoran, and Courant (1993) conducted a study of the gender pay gap among lawyers, using a rich data set that contained information on variables such as law school performance, drop-outs from the labor force for childcare, and years of part-time work. Fifteen years re- moved from law school, female lawyers were found to earn 40% less than their male counterparts. After controlling for differ- ences in detailed work histories, the au- thors found a significant amount of the pay gap was explained by the greater childcare responsibilities borne by the women in their sample. Nevertheless, even after control- ling for job setting (which assumes away occupational segregation as a potential source of discrimination), the authors were leftwith an unexplained wage gap of 13.2%. They concluded that the remaining pay gap results from unmeasured differences in human capital, unmeasured compensat- ing differentials, or discrimination (direct employer or statistical).
Significant unexplained gender pay dif- ferences have also been found in studies of the physician labor market. Kehrer (1976), studying survey data collected by the Ameri- can Medical Association in 1973, found an unexplained earnings difference of 31% after controlling for experience, specialty, and board certification, along with other variables. Langwell (1982) updated Kehrer'swork with 1977 data, and found an unexplained gender gap in earnings of 26%. Hampton and Heywood (1993) used a de- tailed 1987 survey of young physicians to study gender pay differences. Depending on the specification, they estimated an un- explained wage gap of 18.9% to 22.5%. Consistent with their findings, it should be noted that pay gaps are generally estimated to be smaller with samples that have lower levels of work experience (see Light and Ureta 1995).
The issue of gender pay differences among academics has received consider- able attention in the literature. One advan- tage of studying college professors is the
This content downloaded from 91.220.202.52 on Sat, 28 Jun 2014 16:10:03 PMAll use subject to JSTOR Terms and Conditions
GENDER, PAY, AND PRODUCTIVITY AMONG VETERINARIANS 495
ability to control for productivity, using research output as a proxy. The findings from these studies vary widely; recent work (see McDowell, Singell, and Ziliak 1999; Ginther and Hayes 1999) suggests that gen- der differences in earnings can be explained by differences in academic rank. However, findings from these studies also suggest that there are important unexplained dif- ferences in promotion, and thus a discrimi- natory process may still be at work. Morgan (1998) studied the gender earnings gap among engineers, using longitudinal data from the Survey of Natural and Social Sci- entists. Her findings suggest that the earn- ings gap for younger cohorts, controlling for various observable characteristics, was near zero. Thus, studies of pay differences within specific occupations report varying unexplained wage gaps, from near zero to over 20%.
Ideally, in the search for evidence of wage discrimination, direct comparisons between wages and marginal products could be made. As mentioned, such an analysis is usually precluded by the quality of existing data sets, since most of them lack produc- tivity measures, and researchers must rely on variables thought to be correlated with productivity.
There are exceptions. Hellerstein, Neumark, and Troske (1999) used a rich data set that combined information on in- dividual workers and their firms to estimate production functions, along with relative marginal products, for different groups of workers. Within their sample of manufac- turing firms, the authors estimated some- what lower marginal productivity for women than for men. However, differences in wages were significantly greater, and the hypothesis of the equality of productivity and wage gaps was strongly rejected.
Lacking such specific firm-level detail, other studies have used proxies for produc- tivity. Holzer (1990) used a unique data set that included information on supervisory ratings to serve as a proxy for productivity. His findings suggested that the men and women in his sample were equally produc- tive. This finding, combined with persis- tent unexplained pay differentials, is evi-
dence consistent with the presence of wage discrimination.'
In the present study of veterinarians, I attempt to bring together the two basic approaches mentioned above: first, study- ing wage differences within a specific occu- pation, among individuals who are expected to be similar in human capital and ability; and second, using unique productivity measures to control for gender differences in productivity. This will allow for a fo- cused examination of whether there exists evidence of employer discrimination in the labor market for veterinarians.
Data
Veterinarians must train for a minimum of six years, including at least two years of study in a pre-veterinary program and four years in a college of veterinary medicine. After obtaining a Doctor of Veterinary Medicine (D.V.M.) degree and passing a national board examination, individuals in most states may apply for licensure without further training (U.S. Department of La- bor 1995). In 1993, according to the Ameri- can Veterinary Medical Association (1994), 81 % of veterinarians were employed in the private clinical sector and 19% in the pub- lic and corporate sectors. Of those in the private clinical sector, 69% were employed in small animal practices, 19% in large animal practices, and the remainder in "mixed" (small and large animal) practices. Most veterinarians begin their careers as wage-salary workers, and become partners or owners some time later.
The data come from annual wage surveys conducted in 1994 and 1995 by Medical Economics Research Group, at the direc- tion of Vetertnary Economics. Veterinary Eco- nomics is a practitioner management jour- nal sent monthly, free of charge, to all private practice veterinarians who request it. Among veterinary publications, Veteri-
'One additional study employing a proxy for pro- ductivity was Foster and Rosenzweig (1993). They used piece-rate wages as a measure of productivity in time-rate employment.
This content downloaded from 91.220.202.52 on Sat, 28 Jun 2014 16:10:03 PMAll use subject to JSTOR Terms and Conditions
496 INDUSTRIAL AND LABOR RELATIONS REVIEW
nary Economics has a relatively large circula- tion, as its readership includes more than two-thirds of all veterinarians in the United States. Stratified random samples2 of 4,319 veterinarians in 1994, and 4,322 in 1995, were mailed surveys, with a total of 3,187 usable surveys returned (37% usable re- turn rate) 3 The sample only includes vet- erinarians who identified themselves as full- time, private practice veterinarians with at least one year of experience. The appendix compares the data set with 1990 census data, and provides evidence that the sample is representative of the general population of veterinarians.
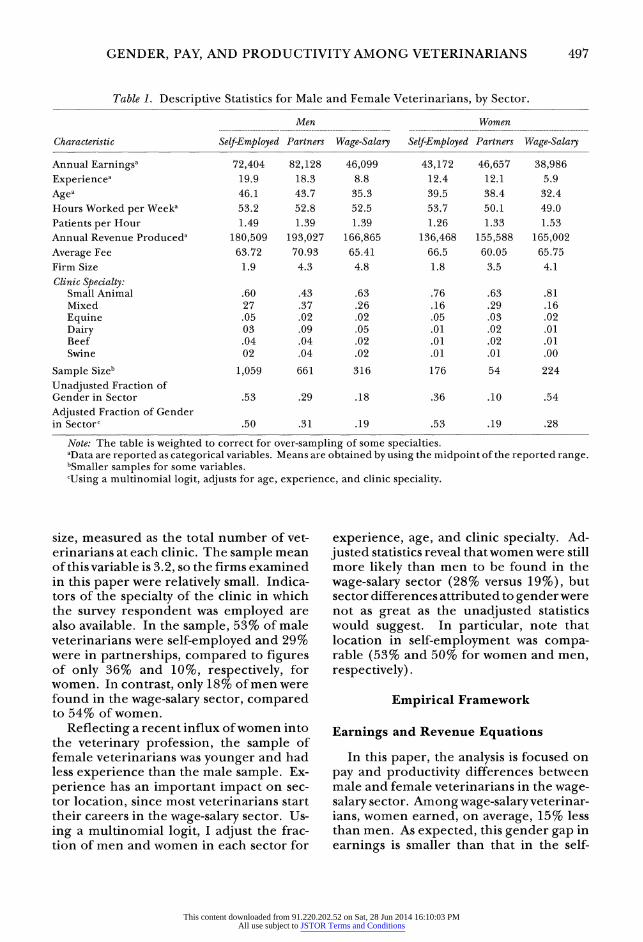
Table 1 reports descriptive statistics from the data. Note that the sample is parti- tioned into three sectors: the self-employed, partners, and wage-salary employees. Each sector is treated separately, since it is ex- pected that the mechanisms that determine earnings will differ among these groups. In addition, how "earnings" is interpreted may differ among sectors.4 Note from this table that male veterinarians earned consider- ably more on average than female veteri- narians within each sector, while differ- ences in hours worked per week were rela- tively small. However, the sample of male veterinarians had almost twice as much experience as the sample of female veteri- narians (an overall average of 17.4 years compared with 8.8 years). Also reported in Table 1 is a measure of patients seen per hour. Survey respondents reported total
2Some smaller veterinarian specialties were over- sampled. Descriptive statistics are weighted by spe- cialty to reflect the "true population" of veterinar- ians, which is Veterinary Economics' subscriber list.
3From the 1994 data, I dropped 145 observations that appeared as likely duplicates in the 1995 survey. In addition, I dropped four observations that ap- peared to be subject to coding errors. A data appen- dix, available on request, provides more details and copies of all surveys.
4All are asked the same survey question: "Which of the following best represents your personal 1993 (or 1994) compensation from the practice before taxes were withheld?" However, the interpretation of this question, especially for the self-employed, is expected to vary.
client visits per week. Using this measure, along with hours worked per week, I con- structed the patients-per-hour variable, which will serve to control for differences in productivity.
Respondents also reported annual rev- enue produced, which represents the an- nual dollar amount of goods and services billed out by each individual veterinarian for his or her practice. Most veterinarians keep track of this measure, since it typically figures into their compensation scheme (McCafferty 1992). For example, a veteri- narian in the wage-salary sector may be paid a base salary plus a percentage of his or her annual revenue produced. This measure of revenue generation will serve as an additional proxy measure of productiv- ity.5 The data reveal an interesting pattern of revenue by sector for men and women. While men had lower average revenue pro- duction in the wage-salary sector than in either the self-employment or partnership sector, the exact opposite was true for women. This suggests gender differences in sector selection patterns, an issue to which I return in a discussion of results.
Table 1 also reports a variable called average fee, which is a measure of the aver- age charge per client visit. Veterinarians also typically keep track of this measure, since it is thought to be a general indicator of clinic productivity (Bowman 1996).6 Gender differences in this variable, condi- tional on sector, are not statistically signifi- cant. Survey respondents also reported some firm-level data. Table 1 reports firm
5Patients per hour is a measure of average prod- uct, and annual revenue produced serves as an ap- proximation to a veterinarian's marginal revenue product. The latter is only an approximation both because the variable is measured on an annual basis rather than on the margin and also because, given traditional billing practices, it is affected by factors (such as medical supplies) besides an individual veterinarian's marginal product.
6In the veterinary industry, this is referred to as the ACT (Average Client Transaction charge). Clinics with higher ACTs are generally thought to be more profitable, since each client is spending, on average, more money on each visit to the veterinarian.
This content downloaded from 91.220.202.52 on Sat, 28 Jun 2014 16:10:03 PMAll use subject to JSTOR Terms and Conditions
GENDER, PAY, AND PRODUCTIVITY AMONG VETERINARIANS 497
Table 1. Descriptive Statistics for Male and Female Veterinarians, by Sector.
Men Women
Characteristic Self-Employed Partners Wage-Salary Self-Employed Partners Wage-Salary
Annual Earningsa 72,404 82,128 46,099 43,172 46,657 38,986 Experiencea 19.9 18.3 8.8 12.4 12.1 5.9 Agea 46.1 43.7 35.3 39.5 38.4 32.4 Hours Worked per Weeka 53.2 52.8 52.5 53.7 50.1 49.0 Patients per Hour 1.49 1.39 1.39 1.26 1.33 1.53 Annual Revenue Produceda 180,509 193,027 166,865 136,468 155,588 165,002 Average Fee 63.72 70.93 65.41 66.5 60.05 65.75 Firm Size 1.9 4.3 4.8 1.8 3.5 4.1 Clinic Specialty:
Small Animal .60 .43 .63 .76 .63 .81 Mixed 27 .37 .26 .16 .29 .16 Equine .05 .02 .02 .05 .03 .02 Dairy 03 .09 .05 .01 .02 .01 Beef .04 .04 .02 .01 .02 .01 Swine 02 .04 .02 .01 .01 .00
Sample Sizeb 1,059 661 316 176 54 224 Unadjusted Fraction of Gender in Sector .53 .29 .18 .36 .10 .54 Adjusted Fraction of Gender in Sectorc .50 .31 .19 .53 .19 .28
Note: The table is weighted to correct for over-sampling of some specialties. aData are reported as categorical variables. Means are obtained by using the midpoint of the reported range. bSmaller samples for some variables. cUsing a multinomial logit, adjusts for age, experience, and clinic speciality.
size, measured as the total number of vet- erinarians at each clinic. The sample mean of this variable is 3.2, so the firms examined in this paper were relatively small. Indica- tors of the specialty of the clinic in which the survey respondent was employed are also available. In the sample, 53% of male veterinarians were self-employed and 29% were in partnerships, compared to figures of only 36% and 10%, respectively, for women. In contrast, only 18% of men were found in the wage-salary sector, compared to 54% of women.
Reflecting a recent influx of women into the veterinary profession, the sample of female veterinarians was younger and had less experience than the male sample. Ex- perience has an important impact on sec- tor location, since most veterinarians start their careers in the wage-salary sector. Us- ing a multinomial logit, I adjust the frac- tion of men and women in each sector for
experience, age, and clinic specialty. Ad- justed statistics reveal that women were still more likely than men to be found in the wage-salary sector (28% versus 19%), but sector differences attributed to gender were not as great as the unadjusted statistics would suggest. In particular, note that location in self-employment was compa- rable (53% and 50% for women and men, respectively).
Empirical Framework
Earnings and Revenue Equations
In this paper, the analysis is focused on pay and productivity differences between male and female veterinarians in the wage- salary sector. Among wage-salary veterinar- ians, women earned, on average, 15% less than men. As expected, this gender gap in earnings is smaller than that in the self-
This content downloaded from 91.220.202.52 on Sat, 28 Jun 2014 16:10:03 PMAll use subject to JSTOR Terms and Conditions
498 INDUSTRIAL AND LABOR RELATIONS REVIEW
employed and partnership sectors, given the lower level of average experience at- tained by wage-salary veterinarians. In ad- dition, it is possible that this gender gap in earnings for veterinarians stems largely from differences in characteristics summarized in Table 1.
To explore this issue, a standard earn- ings decomposition is used (Oaxaca 1973). First, separate earnings equations are esti- mated for women and men:
(1) lnE = *B X f f f
(2) lnE =YEB X
The natural logarithm of Earnings, E, is used as the dependent variable. The X variables include controls for experience, hours worked per week, clinic specialty, and clinic size, along with region, metro- politan statistical area status, and year of survey indicators. Productivity measures will also be added to the set of independent variables.
If EBm X is added to both equations (1) and (2),an{then equation (1) is subtracted from equation (2), the following decompo- sition is obtained:
(3) lnEm-lnEf = XBM(XM-X) f B) + XX(B -Bf)
The first term on the right-hand side of equation (3) evaluates the difference in mean values of the Xvariables using male prices, or coefficients. This is generally referred to as the "explained portion" of the earnings gap. The second term on the right-hand side is the conventional mea- sure of wage discrimination, with 3m > k indicating a higher price received by a male worker than by a female worker for the same characteristic. Since there will always exist unobserved differences that cannot be controlled for, it is better to refer to this term as the "unexplained portion" of the earnings gap than as a direct measure of wage discrimination.
An alternative representation of the dif- ference in ln earnings may be expressed as follows:
(4) InE -InEf = Bf(X-X) m m X~~~~~f +X (B -B) m m f
This uses female coefficients to evaluate the differences in mean characteristics. Equation (3) implies that in the absence of discrimination, the male earnings structure would prevail, while equation (4) implies that the female earnings struc- ture would exist in a nondiscriminatory environment. The two assumptions do not yield the same result, and thus, esti- mates of both equations (3) and (4) are reported.
Unique to the data set is a measure of annual revenue produced, which permits study of the determinants of productivity, along with any gender differences in pro- ductivity that may exist. Corresponding to equations (3) and (4), the following equa- tions will be estimated with ln revenue as the dependent variable:
(5) InRm- InRf = IBM(XM - x
+2Xf(B -B)
(6) InR -InR = EB (X -X) + EXk(Bm -B)
Estimation of standard earnings de- compositions allows for examination of whether there exist unexplained differ- ences in earnings for the men and women in the sample. Adding productivity mea- sures to the earnings decompositions, in addition to estimating separate revenue decompositions, allows for focused study of whether there exist unexplained gen- der differences in productivity. Finding women on par with men in the ability to generate revenue, but not in earnings, would be suggestive of the presence of employer discrimination in the labor market for veterinarians.
Econometric Issues
Before I discuss the results, two econo- metric notes are in order. First, the earn- ings and revenue data are not reported as continuous variables, but are divided into
This content downloaded from 91.220.202.52 on Sat, 28 Jun 2014 16:10:03 PMAll use subject to JSTOR Terms and Conditions
GENDER, PAY, AND PRODUCTIVITY AMONG VETERINARIANS 499
14 unequal intervals.7 With data reported in intervals as the dependent variable, the appropriate estimation technique is an ex- tension of the Tobit model developed by Stewart (1983).8 The advantage of using an extension of the censored regression model, versus ordered probit, is that the cutpoints are known and do not need to be estimated. In addition, the estimated P's may be inter- preted directly as slope coefficients.
Second, it should be noted that there is no control for sample selection bias in the estimates. It is possible that veterinarians who select into the wage-salary sector differ in unobservable ways from veterinarians in the self-employment and partnership sec- tors. For example, veterinarians who choose the wage-salary sector may be those who are likely to have the highest earnings in that sector. Unfortunately, the available data do not allow for a convincing control for sample selection bias, since there is no variable that is thought to affect sector choice that does not also affect earnings.9
Since the analysis is focused on earnings differences within the wage-salary sector, selection may pose a problem only if there are gender differences in selection behav- ior (for example, women negatively select- ing into the wage-salary sector, with men positively selecting into the sector). Few empirical studies have examined gender differences in selection behavior, but some evidence from a small set of studies sug-
7For earnings, there are 14 intervals with a median range of $10,000. Top-coding is not a problem, because exact earnings are reported when they fall in the highest category (over $200,000). For revenue, there are 14 intervals with a median range of $20,000. Exact revenue is also reported when it falls in the highest category (over $300,000).
8This technique is also discussed in Long (1997). OLS, in which the midpoint of the relevant interval is used as the dependent variable, generally results in inconsistent estimates.
91n separate estimates, available from the author on request, a standard Heckman (1979) correction for sample-selection bias is implemented. Identifica- tion is achieved by the nonlinearity of the first-stage probit equation. Although results suggest no evi- dence of sample selection bias, identification that relies on functional form is not very convincing.
gests that women may negatively select into the wage-salary sector.10 Gender differences in ability should be reflected in gender differences in productivity. Thus, in the light of the potential sample selection prob- lem, the ability to control for gender differ- ences in productivity will be advantageous.
Estimation Results
Earnings Decompositions
The gender difference in mean ln an- nual earnings in the sample of wage-salary veterinarians is [.159], representing an unadjusted pay gap of 15%.1" Table 2 re- ports decompositions of this earnings dif- ference. Female and male coefficients, D
and P., are reported from the estimation of equations (1) and (2). The last two col- umns of Table 2 report the estimation of the "explained portion" of the earnings gap from equations (3) and (4), respec- tively.
The coefficients on the experience vari- ables are positive and jointly statistically significant for both women and men. The set of coefficients for both sexes suggests an upward-sloping experience-earnings pro- file. As expected, gender differences in experience explain a considerable portion
'0Macpherson (1988), using 1980 Census data, reported evidence of women negatively selecting into the wage-salary sector. Devine (1994a), using Cur- rent Population Survey (CPS) data from 1975-87, provided evidence that wage-salary women were less skilled than their self-employed counterparts, which would be consistent with negative selection for wage- salary women. On the other hand, Hampton and Heywood (1993), in their study of gender earnings differences among young physicians, concluded that there was little evidence of gender differences in selection, as controlling for selection did not qualita- tively change their estimates of unexplained differ- ences in earnings. In addition, results from Hundley (2000) suggest that wage-salary women may be more ambitious and work-intensive, on average, than self- employed women.
"Conversion of log differences to percentage dif- ferences is conducted throughout the paper using the formula Iexp(D) - 11, where D (which is negative) is the difference in log points in earnings between women and men.
This content downloaded from 91.220.202.52 on Sat, 28 Jun 2014 16:10:03 PMAll use subject to JSTOR Terms and Conditions
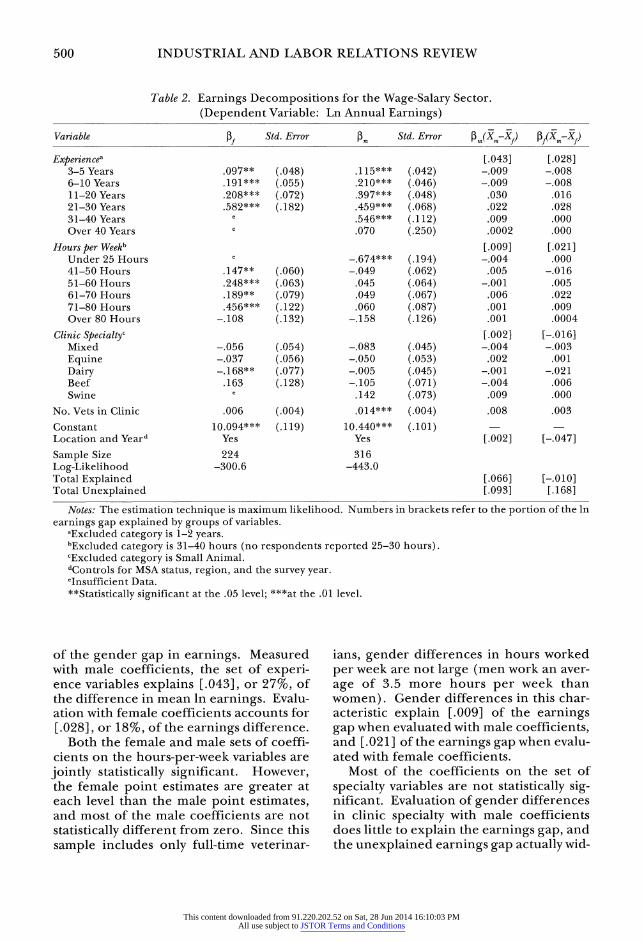
500 INDUSTRIAL AND LABOR RELATIONS REVIEW
Table 2. Earnings Decompositions for the Wage-Salary Sector. (Dependent Variable: Ln Annual Earnings)
Variable f Std. Error f3m Std. Error f3,(XmRXf) f(XmXf)
Experiencea [.043] [.028] 3-5 Years .097** (.048) .115*** (.042) -.009 -.008 6-10 Years .191*** (.055) .210*** (.046) -.009 -.008 11-20 Years .208*** (.072) .397*** (.048) .030 .016 21-30 Years .582*** (.182) .459*** (.068) .022 .028 31-40 Years e .546*** (.112) .009 .000 Over 40 Years e .070 (.250) .0002 .000
Hours per Weekb [.009] [.021] Under 25 Hours e -.674*** (.194) -.004 .000 41-50 Hours .147** (.060) -.049 (.062) .005 -.016 51-60 Hours .248*** (.063) .045 (.064) -.001 .005 61-70 Hours .189** (.079) .049 (.067) .006 .022 71-80 Hours .456*** (.122) .060 (.087) .001 .009 Over 80 Hours -.108 (.132) -.158 (.126) .001 .0004
Clinic Specialtyc [.002] [-.016] Mixed -.056 (.054) -.083 (.045) -.004 -.003 Equine -.037 (.056) -.050 (.053) .002 .001 Dairy -.168** (.077) -.005 (.045) -.001 -.021 Beef .163 (.128) -.105 (.071) -.004 .006 Swine e .142 (.073) .009 .000
No. Vets in Clinic .006 (.004) .014*** (.004) .008 .003 Constant 10.094*** (.119) 10.440*** (.101) - Location and Yeard Yes Yes [.002] [-.047] Sample Size 224 316 Log-Likelihood -300.6 -443.0 Total Explained [.066] [-.010] Total Unexplained [.093] [.168]
Notes: The estimation technique is maximum likelihood. Numbers in brackets refer to the portion of the ln earnings gap explained by groups of variables.
aExcluded category is 1-2 years. bExcluded category is 31-40 hours (no respondents reported 25-30 hours). cExcluded category is Small Animal. dControls for MSA status, region, and the survey year. eInsufficient Data. "*Statistically significant at the .05 level; ***at the .01 level.
of the gender gap in earnings. Measured with male coefficients, the set of experi- ence variables explains [.043], or 27%, of the difference in mean ln earnings. Evalu- ation with female coefficients accounts for [.028], or 18%, of the earnings difference.
Both the female and male sets of coeffi- cients on the hours-per-week variables are jointly statistically significant. However, the female point estimates are greater at each level than the male point estimates, and most of the male coefficients are not statistically different from zero. Since this sample includes only full-time veterinar-
ians, gender differences in hours worked per week are not large (men work an aver- age of 3.5 more hours per week than women). Gender differences in this char- acteristic explain [.009] of the earnings gap when evaluated with male coefficients, and [.021] of the earnings gap when evalu- ated with female coefficients.
Most of the coefficients on the set of specialty variables are not statistically sig- nificant. Evaluation of gender differences in clinic specialty with male coefficients does little to explain the earnings gap, and the unexplained earnings gap actually wid-
This content downloaded from 91.220.202.52 on Sat, 28 Jun 2014 16:10:03 PMAll use subject to JSTOR Terms and Conditions
GENDER, PAY, AND PRODUCTIVITY AMONG VETERINARIANS 501
ens by [.016] when evaluated with female coefficients. Estimates suggest an earnings increase of approximately 1 % for each ad- ditional veterinarian in the firm, and gen- der differences in this measure of firm size explain a small portion of the earnings gap. Differences in location, and a control for survey year, explain a small portion of the earnings gap when evaluated with male coefficients, but serve to widen the unex- plained portion of the earnings gap by [.047] when evaluated with female coeffi- cients.
Added together, differences in observed characteristics explain [.066], or 42%, of the gap in ln earnings when evaluated with male coefficients. When evaluated with female coefficients, differences in observed characteristics widen the unexplained por- tion of the pay gap by [.010] . This leaves an unexplained earnings difference of [.093] or [.168], depending on the specification of the earnings decomposition. Thus, the earnings gap adjusted for differences in observable characteristics is 9% or 15%, depending on the specification.
To try to control for productivity differ- ences between men and women, I augment the decomposition with the two productiv- ity variables, patients per hour and annual revenue produced. A priori, it is question- able whether these variables should be added as independent variables. In testing for evidence of wage discrimination, vari- ables that may be determined in the pro- cess of discrimination should not be con- sidered exogenous. For example, it may be as a result of segregation into less produc- tive clinics that women earn less than men. If so, women would see fewer patients per hour and produce less annual revenue, on average, than men. Unexplained differ- ences in earnings could fall to zero, mask- ing the discrimination that takes place through segregation.
Despite the danger of "over-controlling," and with the caveat that endogeneity is introduced into the model, the productiv- ity variables are added to the decomposi- tions reported in Table 3. The female coefficient on the patients-per-hour vari- able (in log form) is .096 and is statistically
significant, suggesting an increase of ap- proximately 1 % in earnings for seeing 10% more patients per hour. The male coeffi- cient is not statistically different from zero. The coefficients on ln annual revenue pro- duced are positive and highly statistically significant, reported as .275 for women and .265 for men. This suggests that for a 10% increase in revenue produced, earnings would be expected to rise by approximately 2.7%, holding other factors constant. Note, however, that for both decompositions, gender differences in the productivity vari- ables explain very little of the gender gap in earnings. This should not be surprising given that Table 1 reports small gender differences in the means of these variables.
Perhaps unexpected is the fact that most of the other coefficients retain their ex- planatory power, and remain qualitatively unchanged from the equations reported in Table 2. In particular, note that the sets of coefficients on the experience variables are still positive and jointly statistically signifi- cant. This may suggest that the productiv- ity measures are not capturing all aspects of an individual's marginal revenue product. Perhaps more experienced veterinarians do not require as many complementary inputs to produce a given level of output. If so, this could explain the positive impact of experience on pay, controlling for revenue production. Alternatively, this could sug- gest that experience has a non-productivity impact on earnings. Lazear's (1979) model predicts a earnings-tenure profile steeper than the corresponding productivity-ten- ure profile. Assuming tenure, unavailable in the data, is positively correlated with experience, the results presented here would be consistent with that model.
Table 3 reports a total unexplained gap in ln earnings of [.098] when measured with male coefficients, and [.180] when measured with female coefficients. Com- paring the results to those reported in Table 2, note that adding the productivity vari- ables actually widens the unexplained por- tion of the earnings gap. From both Tables 2 and 3, using male coefficients to evaluate gender differences in characteristics pro- vides the most conservative estimate of the
This content downloaded from 91.220.202.52 on Sat, 28 Jun 2014 16:10:03 PMAll use subject to JSTOR Terms and Conditions
502 INDUSTRIAL AND LABOR RELATIONS REVIEW
Table 3. Earnings Decompositions with Productivity Controls for the Wage-Salary Sector. (Dependent Variable: Ln Annual Earnings)
Variable f Std. Error 3m, Std. Error f3,(X, -Xf) f3f(X-Xf)
Experiencea [.033] [.018] 3-5 Years .028 (.047) .085** (.041) -.006 -.002 6-10 Years .148*** (.053) .192*** (.045) -.006 -.005 11-20 Years .130 (.069) .343*** (.048) .024 .009 21-30 Years .432*** (.153) .394*** (.072) .014 .015 31-40 Years f .514*** (.115) .007 .000 Over 40Years f .038 (.229) .0001 .000
Hours per Weekb [.002] [.021] Under 25 Hours f -.606*** (.184) -.004 .000 41-50 Hours .157*** (.055) -.090 (.059) .011 -.019 51-60 Hours .239*** (.060) -.017 (.061) -.001 .015 61-70 Hours .193*** (.070) -.028 (.064) -.003 .019 71-80 Hours .433*** (.114) -.006 (.087) -.0001 .006 Over 80 Hours -.326** (.142) -.148 (.126) -.0001 -.0003
Clinic Specialtyc [.012] [-.009] Mixed -.014 (.052) -.025 (.045) -.001 -.001 Equine .042 (.058) .021 (.053) -.001 -.001 Dairy -.101 (.070) .046 (.047) .006 -.013 Beef .194 (.117) -.065 (.073) -.002 .005 Swine f .154** (.074) .010 .000
No. Vets in Clinic .006 (.004) .014*** (.004) .007 .003 Ln Patients per Hour .096*** (.036) -.006 (.025) .001 -.024 Ln Revenue Producedd .275*** (.038) .265*** (.033) .001 .001 Constant 6.837*** (.449) 7.363*** (.397) Location and Yeare Yes Yes [.004] [-.030] Sample Size 177 281 Log-Likelihood -203.7 -365.8 Total Explained [.061] [-.021] Total Unexplained [.098] [.180]
Notes: The estimation technique is maximum likelihood. Numbers in brackets refer to the portion of the ln earnings gap explained by groups of variables.
aExcluded category is 1-2 years. bExcluded category is 31-40 hours (no respondents reported 25-30 hours). cExcluded category is Small Animal. dData are reported as categorical variables. The midpoint of the reported range is used as the independent
variable. eControls for MSA status, region, and the survey year. flnsufficient data. **Statistically significant at the .05 level; ***at the .01 level.
adjusted gender gap in earnings. In both decompositions, the gender gap in earnings, after controlling for observable characteris- tics, is estimated at approximately 9%.
Revenue Decompositions
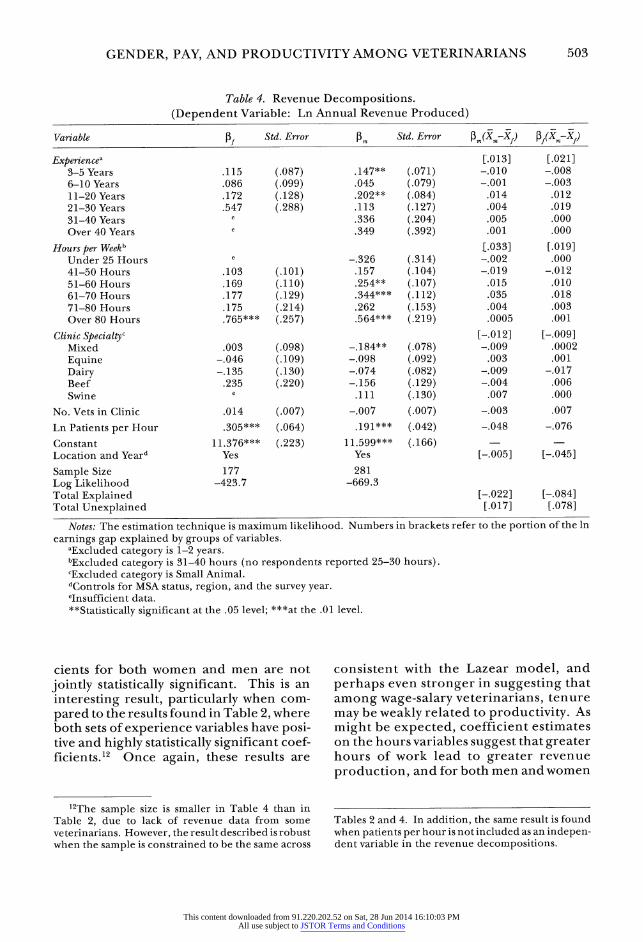
To further explore the issue of produc- tivity and the determinants thereof, I esti- mate revenue decompositions (Table 4). The set of independent variables in the
decompositions is the same as reported in Table 2, along with a control for patients per hour. Among the set of male and female veterinarians included in Table 4, average ln annual revenue production for women is actually [.005] greater than the average reported for men, suggesting rela- tive parity in productivity between the men and women in the wage-salary sector.
The coefficients on experience are esti- mated as positive, but the sets of coeffi-
This content downloaded from 91.220.202.52 on Sat, 28 Jun 2014 16:10:03 PMAll use subject to JSTOR Terms and Conditions
GENDER, PAY, AND PRODUCTIVITY AMONG VETERINARIANS 503
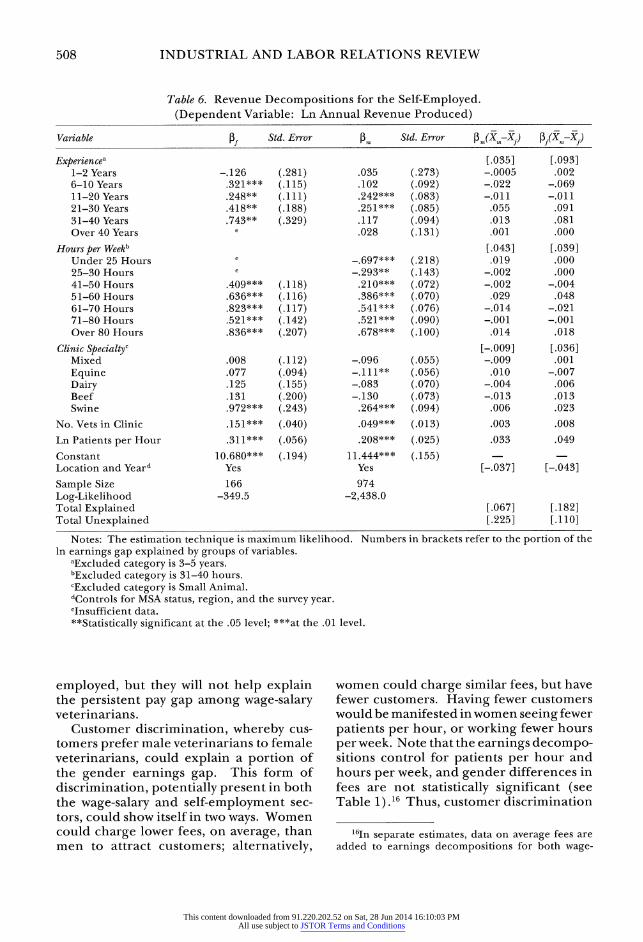
Table 4. Revenue Decompositions. (Dependent Variable: Ln Annual Revenue Produced)
Variable f Std. Error 3m Std. Error 13P(X-Xf) 13f(X1-Xf)
Experiencea [.013] [.021] 3-5 Years .115 (.087) .147** (.071) -.010 -.008 6-10 Years .086 (.099) .045 (.079) -.001 -.003 11-20 Years .172 (.128) .202** (.084) .014 .012 21-30 Years .547 (.288) .113 (.127) .004 .019 31-40 Years e .336 (.204) .005 .000 Over 40 Years e .349 (.392) .001 .000
Hours per Weekb [.033] [.019] Under 25 Hours e -.326 (.314) -.002 .000 41-50 Hours .103 (.101) .157 (.104) -.019 -.012 51-60 Hours .169 (.110) .254** (.107) .015 .010 61-70 Hours .177 (.129) .344*** (.112) .035 .018 71-80 Hours .175 (.214) .262 (.153) .004 .003 Over 80 Hours .765*** (.257) .564*** (.219) .0005 .001
Clinic Specialtyc [-.012] [-.009] Mixed .003 (.098) -.184** (.078) -.009 .0002 Equine -.046 (.109) -.098 (.092) .003 .001 Dairy -.135 (.130) -.074 (.082) -.009 -.017 Beef .235 (.220) -.156 (.129) -.004 .006 Swine e .111 (.130) .007 .000
No. Vets in Clinic .014 (.007) -.007 (.007) -.003 .007 Ln Patients per Hour .305*** (.064) .191*** (.042) -.048 -.076 Constant 11.376*** (.223) 11.599*** (.166) Location and Yeard Yes Yes [-.005] [-.045] Sample Size 177 281 Log Likelihood -423.7 -669.3 Total Explained [-.022] [-.084] Total Unexplained [.017] [.078]
Notes: The estimation technique is maximum likelihood. Numbers in brackets refer to the portion of the ln earnings gap explained by groups of variables.
aExcluded category is 1-2 years. bExcluded category is 31-40 hours (no respondents reported 25-30 hours). cExcluded category is Small Animal. dControls for MSA status, region, and the survey year. elnsufficient data. **Statistically significant at the .05 level; ***at the .01 level.
cients for both women and men are not jointly statistically significant. This is an interesting result, particularly when com- pared to the results found in Table 2, where both sets of experience variables have posi- tive and highly statistically significant coef- ficients. 12 Once again, these results are
12The sample size is smaller in Table 4 than in Table 2, due to lack of revenue data from some veterinarians. However, the result described is robust when the sample is constrained to be the same across
consistent with the Lazear model, and perhaps even stronger in suggesting that among wage-salary veterinarians, tenure may be weakly related to productivity. As might be expected, coefficient estimates on the hours variables suggest that greater hours of work lead to greater revenue production, and for both men and women
Tables 2 and 4. In addition, the same result is found when patients per hour is not included as an indepen- dent variable in the revenue decompositions.
This content downloaded from 91.220.202.52 on Sat, 28 Jun 2014 16:10:03 PMAll use subject to JSTOR Terms and Conditions
504 INDUSTRIAL AND LABOR RELATIONS REVIEW
these coefficient estimates are statistically significant.
Coefficients on the patients-per-hour variable suggest a strong positive and statis- tically significant relationship between pa- tients per hour and revenue production. The point estimates, .305 and .191 for women and men respectively, are statisti- cally different from each other. This sug- gests that women see a greater increase in revenue for each additional patient per hour than do the men in the sample. This difference may reflect gender differences in types of patient care, but the difference is the opposite of what would be necessary to explain the male-female wage gap among veterinarians.
Coefficient comparisons across the earn- ings and revenue decompositions provide additional insight into the determinants of pay and productivity. Assuming that the measure of annual revenue produced is a good approximation of marginal revenue product, the coefficient estimates in Table 4 should be comparable to those in Table 2 if individuals are paid according to their marginal product. However, ajoint test of the equality of coefficients across equa- tions by sex reveals that the coefficients are statistically different from each other, for men and women. 13 This suggests that other factors, beyond productivity, are at work in the determination of earnings.
An additional notable result from Table 4 is that the total explained is more nega- tive than the actual gender difference in ln revenue [.005], whether male or female coefficients are used to evaluate gender differences in characteristics. This sug- gests that the women's measured charac- teristics are more favorable to producing revenue than are the men's. This finding, coupled with the small reported gender differences in average revenue, lends sup- port to the claim that women earn revenue on par with men.
13In making this comparison, I constrained the sample to be the same across decompositions. In addition, In patients per hour was added to the earn- ings decomposition.
Unexplained Differences in Earnings
The findings thus far suggest female vet- erinarians are in parity with male veterinar- ians in productivity, but not in earnings. This is significant, because it contravenes some theories commonly used to account for unexplained earnings differences. I will briefly remark three of them.
First, differences in unobserved ability could be claimed as an explanation for gender differences in unexplained earn- ings. However, differences in unobserved ability should reflect themselves in differ- ences in revenue generation. Their failure to do so sheds doubt on the unobserved ability explanation.
Second, noted earlier was work by other researchers that found evidence of nega- tive selection on the part of women in the wage-salary sector. The results here sug- gest that among wage-salary veterinarians, there were not important differences in selection between men and women. The existence of such differences would be re- flected in gender differences in productiv- ity. 14
Finally, a third explanation used to ac- count for lower earnings for women than for men hinges on gender differences in labor force attachment. On average, women are likely to have more frequent and longer interruptions in their lifetime pattern of labor force participation than men do. In addition, their work histories are more likely to include periods of part-time work. Drop- outs (or periods of part-time work) are likely to lead to declines (or slowdowns in growth) of human capital, both general and specific. Thus, a loss of human capital would lead to lower earnings upon reentry into the labor force. Other researchers, using detailed work histories, have found
14Research from Hundley (2000) suggests that gender differences in selection behavior should be less pronounced among men and women in "estab- lished" professions with significant training costs, such as lawyers, doctors, and veterinarians. Thus, results found here are not likely to generalize to other occupations.
This content downloaded from 91.220.202.52 on Sat, 28 Jun 2014 16:10:03 PMAll use subject to JSTOR Terms and Conditions
GENDER, PAY, AND PRODUCTIVITY AMONG VETERINARIANS 505
this to be an important factor in account- ing for earnings differences between men and women (see Mincer and Polachek 1974; Wood, Corcoran, and Courant 1993). The lack of detailed work histories in the cur- rent sample should not, however, compro- mise the analysis, since, once again, this is an omitted variable that should affect an- nual revenue produced.15
An assumption of the above discussion is that annual revenue produced is a reliable measure of productivity. However, although it measures direct revenue production, it does not measure any indirect revenue pro- duction that may take place. For example, it could be that men are more involved than women in the management of the firm, since they have more average experience. Thus, they may be involved in generating revenue in indirect ways, not measured by the annual-revenue-produced variable. To test this possibility more directly, I used supplementary data from the 1995 survey. Survey respondents were asked to report the percentage of time they devoted to medicine and management duties. Men in the wage-salary sector reported an average of 9.1% time spent in managerial duties; women, 7.6%. This measure, serving as an additional productivity variable, is added to the earnings and revenue decomposi- tions. Only for men in the earnings decom- position is a statistically significant result obtained, suggesting less than a .1% in- crease in earnings for an additional 10% of time spent in management. Once again, gender differences in this characteristic are not great. Thus, adding this variable to the decompositions has a negligible impact on the explained portion of the earnings gap.
There are other factors that may contrib- ute to a portion of the earnings gap be- tween men and women. For example, if
15Note that the average experience of women in this sample is only 5.9 years. The impact of gender differences in work histories is likely to be more important among older samples.
providing benefits to women is more costly than providing them to men, women's total compensation relative to men's will be higher than I have estimated. However, as Cain (1986) points out, since high benefit levels are generally correlated with high salaries, adding fringe benefits to the analy- sis would likely widen the gender gap. Another possible explanation relies on gen- der differences injob duties. I noted above that annual revenue produced serves only as an approximation of marginal revenue product. If men enjoy greater complemen- tarities with certain forms of capital, gen- der differences in job duties could result, leading to a higher marginal revenue prod- uct for men than for women. If this were the case, in equilibrium men would enjoy higher earnings. Data on job duties are not available, but even if they were, it would be difficult to ascertain if any dif- ferences result from a specialization ef- fect, as hypothesized above, or a discrimi- natory process.
As other researchers have noted (for example, see Neumark 1999), in the face of persistent pay differentials, it is difficult to completely rule out the presence of statisti- cal discrimination. Aigner and Cain (1977) presented a model of statistical discrimina- tion that is able to explain pay differences even in the absence of average productivity differences. In the current context, statis- tical discrimination could occur if informa- tion on female productivity is less reliable, or has greater variance, than that on male productivity, and if, in addition, employers are risk-averse. This theory is partially test- able in the data, since information on pro- ductivity is available. If variance in revenue production is greater for women than for men, a consequence may be statistical dis- crimination. The data reveal at least some support for statistical discrimination, as the variance of annual revenue produced is greater for women than for men at each level of experience. However, a formal statistical test indicates we are unable to reject the hypothesis that the variances of annual revenue produced are the same for men and women, both conditional and unconditional on experience.
This content downloaded from 91.220.202.52 on Sat, 28 Jun 2014 16:10:03 PMAll use subject to JSTOR Terms and Conditions
506 INDUSTRIAL AND LABOR RELATIONS REVIEW
Evidence from the Self-Employed
Studying the self-employed may shed light on the gender pay gap among wage- salary workers. As noted earlier, most vet- erinarians move on to firm ownership after a period of wage-salary employment. The gender difference in mean ln annual earn- ings is relatively large, [.593], representing an unadjusted pay gap of 45%. However, the average experience among self-em- ployed men is much greater than that among self-employed women (19.9 years versus 12.4 years; see Table 1). In addition, considerable gender differences in the pro- ductivityvariables (shown in Table 1) could explain a substantial portion of the gender gap in earnings.
To study these differences more closely, I perform earnings decompositions for self- employed veterinarians, analogous to the decompositions for wage-salary veterinar- ians reported in Table 3. Controlling for patients per hour and personal revenue produced, Table 5 reports the earnings decompositions for the self-employed. There are several noteworthy results.
First, similar to the result obtained for wage-salary workers, the sets of coefficients on the experience variables are jointly sta- tistically significant for both women and men, even after controlling for the produc- tivity variables. In addition, the results suggest an upward-sloping experience-earn- ings profile similar to that found for the wage-salary sector. While I postulated that this could be the result of Lazear-type wage contracts among wage-salary workers, there is no reason to believe such contracts should exist among the self-employed. It should be noted that earnings in self-employment are more likely than earnings among wage- salary workers to be a function of firm profits. Assuming experience is correlated with tenure, an upward-sloping profile might indicate that self-employed workers with greater years of experience have greater entrepreneurial expertise, leading to higher clinic profitability, and thus higher earnings.
A large portion of the earnings gap is explained by gender differences in per-
sonal revenue produced. Measured with male coefficients, gender differences in revenue explain [.182], or 31%, of the dif- ference in mean ln earnings. Evaluation with female coefficients a-ccounts for [.206], or 35%, of the earnings gap. After account- ing for the contributions made from all other variables, there remains a large and persistent unexplained gap in earnings, approximately 30%.
Corresponding to the analysis conducted for the wage-salary sector, revenue decom- positions for self-employed veterinarians are reported in Table 6. The gender differ- ence in ln revenue produced is [.292], rep- resenting a gap of 25%. Coefficients on experience are jointly statistically signifi- cant for both sexes and, contrary to find- ings in the wage-salary sector, suggest a generally upward-sloping experience-pro- ductivity profile. It was suggested above that the results from the earnings decom- position for the self-employed might indi- cate that increased tenure in self-employ- ment increases firm profits, in ways that are not reflected in the measure of personal revenue produced. Results from the rev- enue decomposition suggest that increased expertise in self-employment may also have a positive impact on personal revenue pro- duced.
Coefficients on hours worked are posi- tive and jointly statistically significant. Gender differences in hours worked per week and experience explain a significant portion of the revenue gap in earnings. Added together, gender differences in all observed characteristics explain 23% of the gender gap in revenue when evaluated with male coefficients, and 79% of the revenue gap when evaluated with female coefficients. These results suggest that there are other characteristics, unobserved, that affect pro- ductivity for the self-employed veterinar- ians in the sample.
Key among the findings from the analy- sis of the self-employed is the 30% unex- plained gender earnings gap, which is strik- ing particularly when compared to the 9% earnings gap found for wage-salary work- ers. At the same time, this finding reflects what is found in other data sources on the
This content downloaded from 91.220.202.52 on Sat, 28 Jun 2014 16:10:03 PMAll use subject to JSTOR Terms and Conditions
GENDER, PAY, AND PRODUCTIVITY AMONG VETERINARIANS 507
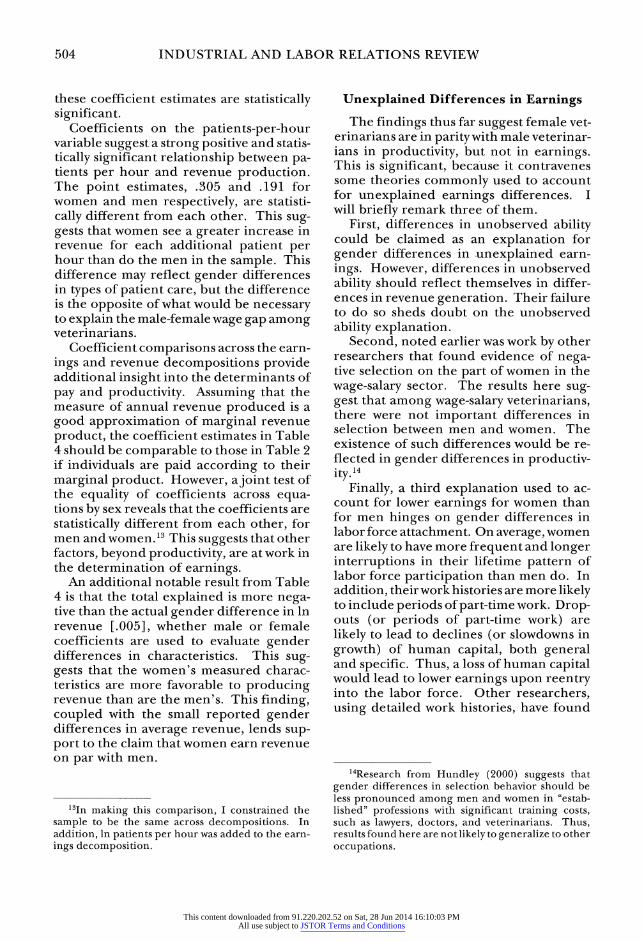
Table 5. Earnings Decompositions with Productivity Controls for the Self-Employed. (Dependent Variable: Ln Annual Earnings)
Variable f Std. Error P3 Std. Error 13(X-Xf) 13f(X(-Xf)
Experiencea [.056] [.083] 1-2 Years -1.129** (.449) -.120 (.233) .002 .016 6-10 Years .133 (.157) .056 (.078) -.012 -.029 11-20 Years .135 (.152) .192*** (.070) -.009 -.006 21-30 Years .145 (.256) .221*** (.072) .048 .032 31-40 Years .651 (.449) .241*** (.079) .026 .071 Over 40 Years f .010 (.111) .0003 .000
Hours per Weekb [.015] [-.002] Under 25 Hours f -.393** (.185) .011 .000 25-30 Hours .248 (.434) -.108 (.119) -.001 .002 41-50 Hours .299 (.165) .110 (.061) -.001 -.003 51-60 Hours .168 (.169) .131** (.060) .010 .013 61-70 Hours .314 (.175) .260*** (.066) -.007 -.008 71-80 Hours .051 (.198) .136 (.077) -.0003 -.0001 Over 80 Hours -.235 (.300) .147 (.087) .003 -.005
Clinic Specialtyc [-.007] [-.029] Mixed -.323** (.154) -.136*** (.047) -.012 -.029 Equine .047 (.125) -.136*** (.047) .012 -.004 Dairy .210 (.209) .095 (.059) .004 .010 Beef -.024 (.258) -.138** (.062) -.013 -.002 Swine -.113 (.337) .091 (.080) .002 -.003
No. Vets in Clinic -.017 (.056) .040*** (.011) .002 -.001 Ln Patients per Hour .115 (.080) .056*** (.022) .009 .018 Ln Revenue Producedd .691*** (.102) .611*** (.027) .182 .206 Constant 2.306** (1.133) 3.409*** (.339) Location and Yeare Yes Yes [-.018] [-.027] Sample Size 166 974 Log-Likelihood -308.8 -2,028.8 Total Explained [.239] [.248] Total Unexplained [.354] [.345]
Notes: The estimation technique is maximum likelihood. Numbers in brackets refer to the portion of the ln earnings gap explained by groups of variables.
aExcluded category is 3-5 years. bExcluded category is 31-40 hours. cExcluded category is Small Animal. dData are reported as categorical variables. The midpoint of the reported range is used as the independent
variable. eControls for MSA status, region, and the survey year. flnsufficient data. **Statistically significant at the .05 level; ***at the .01 level.
self-employed: a very low relative earnings position for self-employed women. Devine (1994b), using CPS data, reported that among full-time, full-year self-employed workers in 1990, the gender gap in earn- ings was 54%. When the analysis was fo- cused on the same group with incorpo- rated businesses, the estimated gender gap was 44%.
In the present analysis, particular inter-
est lies in what factor(s) might contribute to unexplained earnings differences both among the self-employed and among wage- salary workers. Clearly, employer discrimi- nation cannot account for the unexplained earnings gap among the self-employed. Possible credit market constraints, gender differences in entrepreneurial ability, or gender differences in profit reinvestment behavior are all issues relevant for the self-
This content downloaded from 91.220.202.52 on Sat, 28 Jun 2014 16:10:03 PMAll use subject to JSTOR Terms and Conditions
508 INDUSTRIAL AND LABOR RELATIONS REVIEW
Table 6. Revenue Decompositions for the Self-Employed. (Dependent Variable: Ln Annual Revenue Produced)
Variable f Std. Error f31, Std. Error P3,(Xj-Xf) B1f(X1lXf)
Experiencea [.035] [.093] 1-2 Years -.126 (.281) .035 (.273) -.0005 .002 6-10 Years .321*** (.115) .102 (.092) -.022 -.069 11-20 Years .248** (.111) .242*** (.083) -.011 -.011 21-30 Years .418** (.188) .251*** (.085) .055 .091 31-40 Years .743** (.329) .117 (.094) .013 .081 Over 40 Years e .028 (.131) .001 .000
Hours per Weekb [.043] [.039] Under 25 Hours e -.697*** (.218) .019 .000 25-30 Hours e -.293** (.143) -.002 .000 41-50 Hours .409*** (.118) .210*** (.072) -.002 -.004 51-60 Hours .636*** (.116) .386*** (.070) .029 .048 61-70 Hours .823*** (.117) .541*** (.076) -.014 -.021 71-80 Hours .521*** (.142) .521*** (.090) -.001 -.001 Over 80 Hours .836*** (.207) .678*** (.100) .014 .018
Clinic Specialtyc [-.009] [.036] Mixed .008 (.112) -.096 (.055) -.009 .001 Equine .077 (.094) -.111** (.056) .010 -.007 Dairy .125 (.155) -.083 (.070) -.004 .006 Beef .131 (.200) -.130 (.073) -.013 .013 Swine .972*** (.243) .264*** (.094) .006 .023
No. Vets in Clinic .151*** (.040) .049*** (.013) .003 .008 Ln Patients per Hour .311*** (.056) .208*** (.025) .033 .049 Constant 10.680*** (.194) 11.444*** (.155) Location and Yeard Yes Yes [-.037] [-.043]
Sample Size 166 974 Log-Likelihood -349.5 -2,438.0 Total Explained [.067] [.182] Total Unexplained [.225] [.110]
Notes: The estimation technique is maximum likelihood. Numbers in brackets refer to the portion of the ln earnings gap explained by groups of variables.
aExcluded category is 3-5 years. bExcluded category is 31-40 hours. cExcluded category is Small Animal. dControls for MSA status, region, and the survey year. eInsufficient data. "*Statistically significant at the .05 level; ***at the .01 level.
employed, but they will not help explain the persistent pay gap among wage-salary veterinarians.
Customer discrimination, whereby cus- tomers prefer male veterinarians to female veterinarians, could explain a portion of the gender earnings gap. This form of discrimination, potentially present in both the wage-salary and self-employment sec- tors, could show itself in two ways. Women could charge lower fees, on average, than men to attract customers; alternatively,
women could charge similar fees, but have fewer customers. Having fewer customers would be manifested in women seeing fewer patients per hour, or working fewer hours per week. Note that the earnings decompo- sitions control for patients per hour and hours per week, and gender differences in fees are not statistically significant (see Table 1 ) .16 Thus, customer discrimination
16in separate estimates, data on average fees are added to earnings decompositions for both wage-
This content downloaded from 91.220.202.52 on Sat, 28 Jun 2014 16:10:03 PMAll use subject to JSTOR Terms and Conditions
GENDER, PAY, AND PRODUCTIVITY AMONG VETERINARIANS 509
is implicitly controlled for in the analysis, and its primary impact should be captured in the explained portion of the earnings gap.
Very little empirical work has addressed gender earnings gaps among the self-em- ployed, but a recent study by Boden (1999) suggested that important nonpecuniary benefits, unobserved, may accrue to women in the self-employed sector. Thus, part of the unexplained gap in earnings could be accounted for by a compensating differen- tial. Boden, using data from the Contin- gent Work Survey of the February 1995 CPS, presented direct evidence that women are more likely than men to cite flexibility and family-related reasons for becoming self-employed."7 Similarly, Hundley (2000), using National Longitudinal Survey (NLS) and PSID data, found results suggesting that women choose self-employment be- cause of the sector's greater compatibility with household work. There may exist other nonpecuniary benefits beyond flex- ibility. For instance, female veterinarians could be employed in positions that are more personally rewarding, on average, than those held by the men in the sample. Thus, it seems plausible that a portion of the gender gap in earnings among the self- employed could be accounted for by non- pecuniary benefits.
Although the data do not allow for a formal test of this hypothesis, the summary statistics in Table 1 present a picture consis- tent with it. Whereas self-employed men had significantly greater revenue produc- tion than wage-salary men, the pattern is completely reversed for women. These statistics suggest that women who selected into self-employment may have enjoyed nonpecuniary benefits, but this does not
salary and self-employed veterinarians. Gender dif- ferences in this characteristic have a negligible im- pact on the explained portion of the earnings gap.
17Approximately 39% of the women in Boden's sample cited schedule flexibility, child-care prob- lems, or other family/personal obligations as primary reasons for their choice to become self-employed. This compares to a corresponding figure of 14% for men.
preclude the possibility that nonpecuniary benefits also account for some of the earn- ings gap among wage-salary workers.
Conclusion
I have examined pay differences between men and women using data on wage-salary workers within a narrowly defined occupa- tional group. Human capital and prefer- ences are likely to be similar for men and women within the same occupation; thus, analysis within this framework provides a strong test for gender differences in earn- ings. In addition, the data include two valuable measures of productivity, patients per hour and annual revenue produced. The ability to control for productivity sig- nificantly strengthens evidence that is con- sistent with the presence of wage discrimi- nation.
The gender gap in average earnings in this sample was 15%. A standard earnings decomposition is used to study this differ- ence. Controlling for various observed characteristics, including measures of pro- ductivity, the gender gap is narrowed to 9%, using the most conservative estimates. It should be noted that in many other stud- ies of wage discrimination, it is generally assumed that if better measures of produc- tivity were available, the gender gap in earn- ings would narrow. However, the produc- tivity measures used in this study did very little to explain the gender gap in earn- ings.18
Revenue estimates reveal statistically in- significant gender differences in revenue production. This provides evidence against human capital explanations for differences in earnings, for if gender differences in human capital exist, they should be re- flected in differences in revenue produc- tion.
18Wood, Corcoran, and Courant (1993) were left with a 13.2% gender earnings gap among lawyers after controlling for various productivity-related char- acteristics. Reporting the same basic result were Holzer (1990) and Hellerstein, Neumark, and Troske (1999), who found that gender differences in pay exceeded gender differences in productivity.
This content downloaded from 91.220.202.52 on Sat, 28 Jun 2014 16:10:03 PMAll use subject to JSTOR Terms and Conditions
510 INDUSTRIAL AND LABOR RELATIONS REVIEW
An examination of self-employed veteri- narians reveals a large unexplained earn- ings gap among this group. Complicating the effort to explain this gap is evidence reported by other research that there are gender differences in the reasons individu- als select into self-employment. However, and consistent with other research, these persistent gaps suggest that women in the self-employed sector take some of their compensation in the form of nonpecuniary benefits, such as greater flexibility. It is
possible that this could also explain some of the unexplained differences in earnings noted in the wage-salary sector. Thus, al- though the evidence suggests that men and women of equal productivity receive un- equal pay, this may not necessarily result from prejudice on the part of employers. At the same time, direct employer discrimi- nation remains a very plausible contributor to unexplained pay differences between male and female veterinarians in the wage- salary sector.
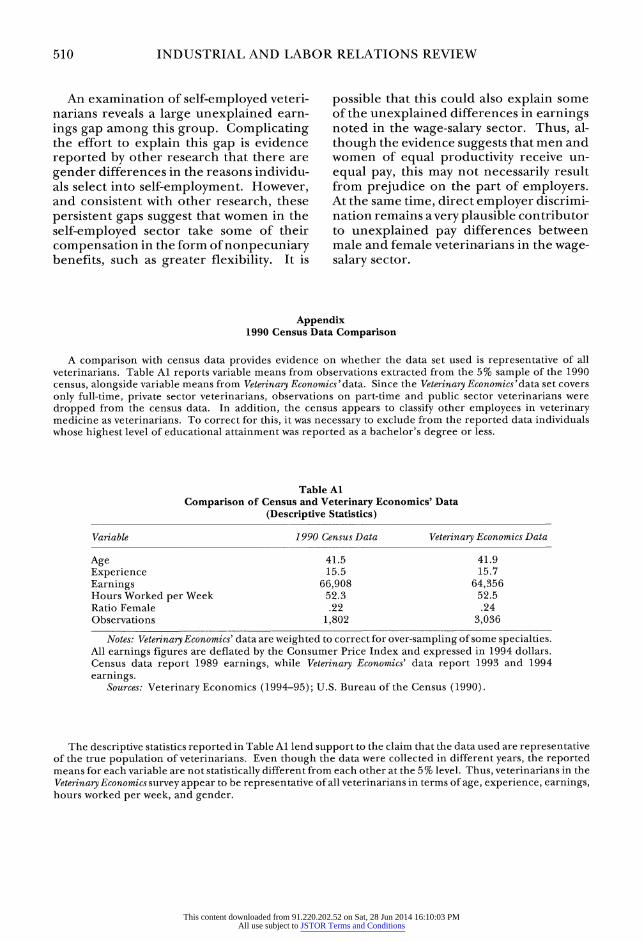
Appendix 1990 Census Data Comparison
A comparison with census data provides evidence on whether the data set used is representative of all veterinarians. Table Al reports variable means from observations extracted from the 5% sample of the 1990 census, alongside variable means from Veterinary Economics ' data. Since the Veterinary Economics 'data set covers only full-time, private sector veterinarians, observations on part-time and public sector veterinarians were dropped from the census data. In addition, the census appears to classify other employees in veterinary medicine as veterinarians. To correct for this, it was necessary to exclude from the reported data individuals whose highest level of educational attainment was reported as a bachelor's degree or less.
Table Al Comparison of Census and Veterinary Economics' Data
(Descriptive Statistics)
Variable 1990 Census Data Veterinary Economics Data
Age 41.5 41.9 Experience 15.5 15.7 Earnings 66,908 64,356 Hours Worked per Week 52.3 52.5 Ratio Female .22 .24 Observations 1,802 3,036
Notes: Veterinary Economics' data are weighted to correct for over-sampling of some specialties. All earnings figures are deflated by the Consumer Price Index and expressed in 1994 dollars. Census data report 1989 earnings, while Veterinary Economics' data report 1993 and 1994 earnings.
Sources: Veterinary Economics (1994-95); U.S. Bureau of the Census (1990).
The descriptive statistics reported in Table Al lend support to the claim that the data used are representative of the true population of veterinarians. Even though the data were collected in different years, the reported means for each variable are not statistically different from each other at the 5 % level. Thus, veterinarians in the Veterinary Economics survey appear to be representative of all veterinarians in terms of age, experience, earnings, hours worked per week, and gender.
This content downloaded from 91.220.202.52 on Sat, 28 Jun 2014 16:10:03 PMAll use subject to JSTOR Terms and Conditions
GENDER, PAY, AND PRODUCTIVITY AMONG VETERINARIANS 511
REFERENCES
Aigner, DennisJ., and Glen G. Cain. 1977. "Statisti- cal Theories of Discrimination in Labor Markets." Industrial and Labor Relations Review, Vol. 30, No. 2 (January), pp. 178-87.
American Veterinary Medical Association, Center for Information Management. 1994. Veterinary Demo- graphic Data Resource, Vol. 3. Schaumburg, Ill.
Blau, Francine D., and Lawrence M. Kahn. 1997. "Swimming Upstream: Trends in the Gender Wage Differential in the 1980s. " Journal ofLaborEconomics, Vol. 15, No. 1 (January), pp. 1-42.
Boden, RichardJ. 1999. "Flexible Working Hours, Family Responsibilities, and Female Self-Employ- ment: Gender Differences in Self-Employment Se- lection. " American Journal of Economics and Sociology, Vol. 58, No. 1 (January), pp. 71-83.
Bowman, Douglas L. 1996. "Do You Resist Fee Increases More Than Clients Do?" Veterinary Eco- nomics, Vol. 36, No. 10 (October), pp. 48-53.
Cain, Glen G. 1986. "The Economic Analysis of Labor Market Discrimination: A Survey." In Orley Ashenfelter and Richard Layard, eds., Handbook of Labor Economics, Vol. 1. Amsterdam: North-Hol- land, pp. 693-785.
Devine, Theresa J. 1994a. "Changes in Wage-and- Salary Returns to Skill and the Recent Rise in Fe- male Self-Employment." American Economic Review, Vol. 84, No. 2 (May), pp. 108-13.
____. 1994b. "Characteristics of Self-Employed Women in the United States." Monthly LaborReview, Vol. 117, No. 3 (March), pp. 20-34.
Foster, Andrew D., and Mark R. Rosenzweig. 1993. "Information, Learning, and Wage Rates in Low- Income Rural Areas." Journal of Human Resources, Vol. 28, No. 4 (Fall), pp. 759-90.
Ginther, Donna K., and KathyJ. Hayes. 1999. "Gen- der Differences in Salary and Promotion in the Humanities." American Economic Review, Vol. 89, No. 2 (May), pp. 397-402.
Hampton, Mary B., andJohn S. Heywood. 1993. "Do Workers Accurately Perceive Gender Wage Discrimi- nation?" Industrial and Labor Relations Review, Vol. 47, No. 1 (October), pp. 36-49.
Heckman,JamesJ. 1979. "Sample Selection Bias as a Specification Error." Econometrica, Vol. 47, No. 1 (January), pp. 153-61.
Hellerstein,Judith K., David Neumark, and Kenneth R. Troske. 1999. "Wages, Productivity, and Worker Characteristics: Evidence from Plant-Level Produc- tion Functions and Wage Equations." Journal of Labor Economics, Vol. 17, No. 3 (July), pp. 406-46.
Holzer, HarryJ. 1990. "The Determinants of Em- ployee Productivity and Earnings." Industrial Rela- tions, Vol. 29, No. 3 (Fall), pp. 403-22.
Hundley, Greg. 2000. "Male/Female Earnings Dif- ferences in Self-Employment: The Effects of Mar- riage, Children, and the Household Division of Labor." Industrial and Labor Relations Review, Vol. 54, No. 1 (October), pp. 95-114.
Kehrer, Barbara H. 1976. "Factors Affecting the Incomes of Men and Women Physicians: An Explor-
atory Analysis." Journal of Human Resources, Vol. 11, No. 4 (Fall), pp. 526-45.
Langwell, Kathyrn M. 1982. "Factors Affecting the Incomes of Men and Women Physicians: Further Explorations." Journal of Human Resources, Vol. 17, No. 2 (Spring), pp. 261-75.
Lazear, Edward P. 1979. "Why Is There Mandatory Retirement?" Journal of Political Economy, Vol. 87, No. 6 (December), pp. 1261-84.
Light, Audrey, and Manuelita Ureta. 1995. "Early Career-Work Experience and Gender Wage Differ- entials. " Journal of Labor Economics, Vol. 13, No. 1 (January), pp. 121-54.
Long, J. Scott. 1997. Regression Models for Categorical and Limited Dependent Variables. Thousand Oaks, Calif.: Sage.
Macpherson, David A. 1988. "Self-Employment and Married Women." Economic Letters, Vol. 28, No. 3, pp. 281-84.
McCafferty, Owen. 1992. "An Inside Look at Associ- ate Pay." VeterinaryEconomics, Vol. 33, No.4 (April), pp. 30-48.
McDowell,John M., Larry D. Singell,Jr., andJames P. Ziliak. 1999. "Cracks in the Glass Ceiling: Gender and Promotion in the Economics Profession." Ameri- can Economic Review, Vol. 89, No. 2 (May), pp. 392- 96.
Mincer,Jacob, and Solomon Polachek. 1974. "Fam- ily Investments in Human Capital: Earnings of Women." Journal of Political Economy, Vol. 82, No. 2 (March-April), pp. S76-S108.
Morgan, Laurie A. 1998. "Glass-Ceiling Effect or Cohort Effect? A Longitudinal Study of the Gender Earnings Gap for Engineers, 1982 to 1989." Ameri- can Sociological Review, Vol. 63, No. 4 (August), pp. 479-93.
Neumark, David. 1999. "Wage Differentials by Race and Sex: The Roles of Taste Discrimination and Labor Market Information." Industrial Relations, Vol. 38, No. 3 (July), pp. 414-45.
Oaxaca, Ronald L. 1973. "Male-Female Wage Differ- entials in Urban Labor Markets." International Eco- nomicReview, Vol. 14, No. 3 (October), pp. 693-709.
Stewart, Mark B. 1983. "On Least Squares Estimation When the Dependent Variable Is Grouped." Review of Economic Studies, Vol. 50, No. 4 (October), pp. 737-53.
U.S. Bureau of the Census. 1990. Decennial Census Public Use Microdata 5% Sample. Washington D.C.
U.S. Department of Labor. 1995. Occupational Out- look Handbook. Washington, D.C.: GPO.
. 2001. Employment and Earnings. Washington, D.C.: GPO.
Veterinary Economics. 1994-95. Continuing Wage Survey. Lenexa, Kans.: Veterinary Medicine Pub- lishing Company.
Wood, Robert G., Mary E. Corcoran, and Paul N. Courant. 1993. "Pay Differences among the Highly Paid: The Male-Female Earnings Gap in Lawyers' Salaries." Journal of Labor Economics, Vol. 11, No. 3 (July), pp. 417-41.
This content downloaded from 91.220.202.52 on Sat, 28 Jun 2014 16:10:03 PMAll use subject to JSTOR Terms and Conditions