patterns of preventive dental behavior
TRANSCRIPT

Patterns of PreventiveDental Behavior
MARIAN ELIZABETH SWANK, MPHSALLY W. VERNON, PhDDAVID R. LAIRSON, PhD
Ms. Swank is the Database Manager for Medication DeliverySystems, Intermedics, Inc. Dr. Vernon is an Assistant Professorand Dr. Lairson an Associate Professor, both with theUniversity of Texas Health Science Center at Houston, Schoolof Public Health.Data from the National Health and Nutrition Examination
Survey were provided by the National Center for HealthStatistics through the Health Services Data Library of theUniversity of Texas School of Public Health.An earlier version of the paper was presented at the annual
meeting of the Texas Public Health Association in Austin, TX,on February 27, 1984.
Tearsheet requests to Dr. Vernon, University of Texas HealthScience Center at Houston, School of Public Health, P. 0. Box20186, Houston, TX 77225.
Synopsis ....................................
Preventive dental behavior was examined usingdata from the National Health and NutritionExamination Survey of 1971-75 conducted by theNational Center for Health Statistics.
Most research to date has dealt with the use ofall types of dental services, with relatively few
studies focusing on utilization of dental servicesfor preventive purposes or on preventive dentalbehavior.
Economic theory on the demand for healthservices and the Andersen model of health servicesutilization were applied to examine predisposing,enabling, and need characteristics which may influ-ence use of preventive dental health services andpreventive dental behavior. The associations be-tween each of three measures of preventive dentalbehavior and the three sets of characteristics fromAndersen's model were analyzed using multipleregression analysis.
The enabling factors (income and a regularsource of care) were the most important determi-nants of use of preventive dental services. Needcharacteristics, measured by self-evaluated condi-tion of teeth, were also significant determinants ofuse, while the predisposing variables were the leastimportant of the three types. In contrast, for thehome care measure, frequency of brushing, thepredisposing variables were the most important,with gender and education ranking highest.
Consideration of these results may be useful tohealth educators and to those who formulatepolicies affecting the distribution of preventivedental services and dental insurance coverage.
THIS ANALYSIS WAS CONDUCTED TO EXAMINE thecharacteristics associated with preventive dentalbehavior (PDB). There have been numerous stud-ies of factors associated with the use of dentalservices in general, but few have focused on theiruse for prevention or on preventive dental behav-iors. This is an important distinction, becausedifferent factors may be associated with use forsymptoms as opposed to use for prevention. Whenneed is great, as in the case of a severe toothache,almost everyone tries to see a dentist. In contrast,other factors such as attitudes or financial re-sources may be more crucial in determining pre-ventive visits. Dental diseases constitute one of thefew categories of diseases for which effectivepreventive measures exist. An understanding of thefactors associated with use of the dentist for
prevention and with other preventive dental behav-iors would facilitate the development of healtheducation programs targeted to reduce dental dis-eases. Our research focuses on PDB entirely, andwe used three indicators. Two of these measuresrepresent use of services and one is a measure ofhome care.The Andersen model of health services use (1)
and economic theory on the demand for healthservices were applied to our data to evaluatefactors associated with PDB. Although Andersenused his model to examine factors associated withthe use of dental services in general, he did notfocus on use for preventive reasons alone. More-over, even though his model was developed tostudy the use of health services, the variablesincluded have been used by others in attempts to
March-April 1986, Vol. 101, No. 2 175

explain various preventive health behaviors (2).Thus, its application to behaviors other thanutilization seems appropriate.
Preventive Dental Behavior
With few exceptions (3-8), studies of PDB havebeen descriptive, lacking formal models and spe-cific tests of hypotheses. Moreover, few attemptshave been made to define explicitly PDB. Defini-tions of preventive health behavior, however, canbe readily applied to this area of research. Kasland Cobb's definition (9) seemed most relevant toour purposes, since it encompassed both utilizationand other behaviors. Following them, we definedPDB as behavior aimed either at the prevention ofdental disease or at the detection of dental diseasein an asymptomatic state. This definition led tothe selection of the 14 studies we have reviewed.Although the range and types of measures of
PDB vary widely, the most frequently used indica-tors are the reason for last dental visit and therecency of last visit (3-6, 8, 10, 11). Otherindicators have been used less often. These includefrequency of brushing, or flossing, or both (7, 10),visits to the dentist once a year for at least 3 years(12), an index of carious tooth salvage (13), andparent voting behavior in an election on fluorida-tion (14). In all but three studies, the dependentvariable was based on self-report by the respon-dent. Nikias (12) used medical records to ascertaindata on the use of dental services, while the dataanalyzed by Tyroler and co-workers (13) werebased on dental examinations. Moen and Poetsch(15) analyzed data based on dentists' reports.
Several investigators analyzed data from nationalcross-sectional surveys conducted by the NationalOpinion Research Center (NORC) in 1959, 1961,and 1965 (8, 11, 16, 17). In one recent study (10)the researchers analyzed data from a nationalsurvey in which families were the sampling unit,while in another (13) they sampled families fromNorth Carolina. Other researchers used employeepopulations, most of whom were enrolled inprepaid dental health plans (3, 5, 6, 12). Twostudy populations were drawn from school chil-dren in two northeastern cities (7, 14). Moen andPoetsch queried a sample of dentists in the UnitedStates (15). Only Kegeles in his 1963 study (6) useda longitudinal design and examined whether or notattitudes and practices at time one predictedbehavior at time two. In one other study (12)Nikias collected data over a 5-year period but didnot analyze it in this manner.
There is remarkable consistency in the findingsfor the demographic characteristics regardless ofstudy design or study population. All investigatorswho examined socioeconomic status (SES) indica-tors found them to be positively associated withPDB even under the circumstances of prepaiddental care. Moreover, these associations persistedin the few studies that introduced controls in anattempt to explain this association (4, 16). Womenmore than men, whites more than blacks, and'younger more than older respondents showedPDB.
Studies that used some variation of the HealthBelief Model and included psychological variablesshowed general agreement on the direction of theseassociations. Anxiety and fear of pain were in-versely associated with PDB in all studies thatlooked at these variables (3, 5, 6, 8, 16). Knowl-edge of prevention also was positively associatedwith PDB (3, 16). Studies showed inconsistentresults for perceived benefit, with two showing apositive association (3, 5) and one showing noassociation (8). In a followup study by Kegeles (6),benefit as measured at time one was not associatedwith PDB at time two. Similarly, seriousness (5, 8)and negative appraisal of the dentist were posi-tively associated with PDB in cross-sectional databut not longitudinally (6). Kegeles (5, 6) reported apositive association between susceptibility and PDBin both cross-sectional and longitudinal data whileTash and coworkers (8) found an unanticipatedinverse association. Perceived financial barriersshowed an inverse association with PDB in twostudies (3, 8) and no association in one study (16).Investigators in two studies that used the same
176 Public Heath Reports

data set (8, 16) reported different results, althoughthey operationalized the variable somewhat differ-ently. A shared limitation of all of these studies isthat the analyses consisted of two-way cross-tabulations and, in a few instances, three-waycomparisons between the dependent variables andeach of the0 independent variables. Thus, therelative importance of the predictors was notascertained.From the research conducted to date, it appears
that demographic and socioeconomic variables im-pact PDB. Psychological variables such as anxietyand fear of pain appear to impede visits to thedentist for preventive reasons, while findings forthe motivating variables of perceived susceptibility,seriousness, and benefit are less consistent. Othervariables, such as the enabling factors included inAndersen's model, have not been examined inrelation to PDB.Our study builds on previous studies by (a)
going beyond the simple analytical techniques usedby most previous investigators and assessing therelative importance of the independent variablesand their interaction, (b) including three measuresof PDB, one of which is a measure of home care,(c) using a conceptual model that specifies clearlydefined sets of independent variables, and (d)using a national sample. Thus, we were able toextend as well as replicate aspects of previousresearch. Despite these advantages over previousstudies, the analysis was limited in that we used asecondary data source. Because of this, we did nothave available attitudinal and psychological vari-ables that have been considered in some previousstudies on this subject.
Conceptual Model
The explanatory components of the Andersenmodel are labeled predisposing (the predispositionof the individual to use services), enabling (theability to secure services), and need (the need forservices). While this model of the determinants ofhealth services use will guide our selection ofvariables, it must be adapted for the analysis ofPDB. In particular, recent theoretical work in thehealth economics literature (18) on the demand forhealth will provide alternate interpretations of therole of some variables. These two approaches havepreviously been combined in a study of the use ofmedical care (19). The direction of association formany of the Andersen explanatory variables wasdetermined using economic theory, which assertsthat individuals combine medical care services and
their own time and effort to produce health andother commodities in an effort to maximize overallpersonal utility or satisfaction. People are limitedby both monetary and time constraints and, tosome extent, make tradeoffs between good healthand other commodities which may simply requiretime and resources that are not then available forinvestment in health or possibly pose a threat tohealth, such as smoking. Our analysis is limited bythe availability of data on the variables defined inthe theoretical model. Table 1 lists the availablevariables by category, how they were measured,the frequency distributions, and their expectedeffects on the dependent variables.
Predisposing. The Andersen model asserts thatsome individuals are predisposed to use care, andthis attitude can be predicted by demographic,social, structural, and health belief characteristicsthat exist prior to onset of illness. Demographicgroups, characterized by age and sex, experiencedifferent illnesses and, therefore, different patternsof medical care use. Social structural variables,such as education and ethnicity, are associatedwith lifestyle and with the physical and socialenvironment of the individual, which may affectbehavior patterns, including medical care utiliza-tion. Belief in the efficacy of medical care is alsoexpected to influence the pattern and amount ofmedical care used.The available predisposing variables include edu-
cation, gender, family size, race, marital status,and age. Except for marital status, each variablehas a predicted relationship with the indicators ofPDB: reason for last dental visit, length of timesince last cleaning, and frequency of brushing(table 1).
March-April 1986, Vol. 101, No. 2 177

Age. Older persons have different patterns ofdental illness than do younger persons, which mayresult in different use of preventive dental servicesand behavior. However, it is difficult to predictthe effect of age from this perspective. Accordingto the economic theory of the demand for health(18), age is directly associated with an increasingrate of depreciation of health and, therefore, anincreasing cost of obtaining health improvementsthrough investment in prevention. Thus, olderpersons are expected to demand less prevention.
Gender and race. While neither economic theorynor the Andersen model generates clear predictionsfor these factors, they have long been empiricallyassociated with medical care utilization and pre-ventive behavior as discussed. Women and whitestend to use more preventive services and engage inmore self-directed preventive behavior comparedwith men and nonwhites. We expect to obtainsimilar results, based on the past empirical find-ings.
Education. Lifestyle varies with educationallevel, and it may influence dental behavior towardmore prevention due to knowledge of the efficacyof prevention and concern about status and ap-pearance of the teeth. Similarly, an economicinterpretation would predict a positive relationship.Education improves the ability of the individual toguard his or her dental health through "proper"combination of self-care and preventive dental careutilization.
Family size. As the number of persons in-creases, income per capita and discretionary timeavailable in the household declines. Thus, use ofpreventive dental services is expected to declinealong with home preventive measures, such asfrequency of brushing. These are strictly economic
rationales, which would ordinarily fit under theenabling category in the Andersen model, eventhough family size is listed as a predisposingvariable.
Enabling. Resources "enable" the individual toobtain the health services or engage in the behav-ior that he feels is needed. These include familyresources such as income, insurance, and theexistence of a regular source of care. Communityavailability of health resources can also enableutilization by reducing travel and waiting time.The available enabling variables include family
income and a regular dentist. Both economictheory and the Andersen model would predict adirect relationship between these factors and theuse of preventive dental care because of the timeand cost associated with these activities. Whilebrushing also requires time and money, the quan-tity is so low that enabling factors are not expectedto be strongly associated with brushing behavior.
Need. Individuals with poor health, either per-ceived or professionally evaluated, are expected touse more curative health care services. In contrast,those who practice more prevention should haveless illness and, therefore, exhibit an inverserelationship between need and preventive behaviorthrough reverse causality. Thus, we expect to findour two measures of need, condition of teeth andconditions of gums, to be directly associated withPDB.The dependent variables which were used to
represent PDB were reason for last visit, length oftime since last cleaning, and frequency of brush-ing. Reason for last visit to the dentist was codedto represent PDB by comparing the category"regular checkup and cleaning" with all othercategories combined (table 1 shows original catego-ries). Length of time since last cleaning was codedfor preventive behavior by contrasting the category"within the past year" with the category "morethan 1 year ago." Frequency of brushing wascoded by contrasting the category "two times aday or more often" with the category "less thantwice a day."
Data Source and Methods
The data source for this analysis was the U. S.National Health and Nutrition Examination Surveyof 1971-75 (NHANES 1). NHANES 1 is a multi-stage, stratified, probability sample of persons inselected geographic clusters of households (about
178 Public Health Reports
6) and was designed to obtain information on thehealth and nutritional status of the United Statespopulation through standardized interviews andphysical and physiological measurements (20). Thedata analyzed in this study were from theNHANES 1 Medical History Supplement whichcollected data from 6,913 respondents 25 to 74years of age.
These were the questions asked of respondents tothe Health Needs Questionnaire (Part B, SamplePerson Supplement):
1. How many times a day do you usually brushyour teeth?
2. When was the last time your teeth werecleaned?
3. What was the main reason for your last visitor talk with a dentist at either his office or at aclinic?Asking these questions was conditional on a
response of "no" to the questions, Have you lostall your teeth in your upper jaw? Have you lostall your teeth in your lower jaw?
Not all respondents were asked the questionsabout PDB. If respondents were edentulous, ques-tions about frequency of brushing and aboutrecency of last visit for cleaning were skipped.Approximately 1,300 respondents had no teeth andwere omitted from our analysis. An additional 300respondents did not answer the question on in-come, and there were missing values on severalother variables. The number of respondents forwhom information on all of the independentvariables was available differed somewhat for thethree dependent measures. The frequency distribu-tions of the independent variables for each of thedependent measures were very similar, so we useda deletion procedure which maximized the use ofthe available data. Table 1 shows the frequencydistributions of the independent variables for therespondents who answered the question on fre-quency of brushing. The PDB for that categoryhad the maximum number of respondents(N= 5,046) Table 1 also shows the numbers ofrespondents for the dependent variables and theresponse categories for these variables.
Ordinary least squares (OLS) multiple regressionwas employed to examine the interrelationshipsbetween the explanatory variables and each of thedependent variables. Because the dependent vari-
ables were dichotomous, the usual assumptions ofnormality and homogeneity of variances of OLSmultiple regression analysis do not hold (21). OLSmultiple regression analysis has been demonstrated,however, to yield the same results as logisticregression when values of the dichotomous vari-able are not extreme, that is, less than 10 percentor greater than 90 percent, according to anunpublished manuscript, "Binary Regression-Al-ternative to Logistic Regression?" by R.Forthofer, et al. The principal author was previ-ously with the University of Texas School ofPublic Health. The ratio of each estimated regres-sion coefficient and its estimated standard error(Beta divided by standard error), was used to rankthe relative statistical significance of the factors.This ratio is commonly used to judge the relativestatistical significance of each variable and wasemployed in the following discussion. Due to thelarge sample size, the distribution of the ratiosprobably resembles a normal distribution. Valuesof 2.576 and greater were considered significant atthe .01 level. Because of the large sample size,small differences were statistically significant; thus,some of these differences may not be of practicalimportance.
Prior to testing for the main effects of theindependent variables, we evaluated the two-wayinteractions for the following pairs of vari-ables: race and education, race and income, edu-cation and income, income and condition of teeth,income and condition of gums, age and conditionof teeth, and age and condition of gums. The onlyinteraction term that was statistically significantwas race and income and only for the twoutilization measures. An examination of the cross-tabulations of race and income for these twodependent variables showed that for whites therewas a marked positive association of income withboth utilization measures, while for blacks therewas no clear linear trend. Thus, in most of theanalyses only the main effects are considered.
Results
Table 2 summarizes the results of the analysis ofthe three dependent variables. For the reason forthe last visit to the dentist, the need dimension ofthe model (as represented by self-perceived evalua-tion of teeth) was the most significant variable.Those rating the condition of their teeth asexcellent or good were more likely to visit thedentist for preventive reasons. One unexpectedresult was the negative effect of the need variable
March-April 1986, Vol. 101, No. 2 179

Table 1. Frequency distributions of dependent and independent variables in the study of preventive dental behavior ofrespondents to the National Health and Nutrition Examination Survey I Medical History Supplement, 1971-75
Variable
Dependent variablesReason for last visit:Regular checkup &
cleaning ............DentureToothache ..........Fillings
Length of time since lastcleaning:Within the past year ...More than 1 year ago..
Frequency of tooth-brushing:1 time per day ........2 times per day .......3 times per day .......Independent variables,
predisposingAge (in years):25-3435-4445-54 .............
55-6465-74)
Gender:Male .................Female ...............
Race:White ................Black ................
Education (in years):0-89-11 ....
12Greater than 12
Frequency
Predictedeffect on
Measure Number Percent PDB
1 2,079' 453
0 1,292913
43.99.6
27.319.3
1 2,076 45.30 2,509 54.7
0 1,9951 2,5251 526
1,6341,207
Actual 1,117712376
1 2,3460 2,700
1 4,5110 535
' 672Actual 709
2,010>1,655
39.550.010.4
32.423.922.114.17.5
46.553.5
89.410.6
13.314.139.832.8
Negative.......
Female.......
White.......
.......
.......
Positive.......
Frequency
Variable Measure Number
Marital status1:Married -4,030Widowed 260Never married ...... Dummy 332Divorced (0,1) 285Separated (reference) ( 139
Family size:1 person 4742-3 persons 2,2304-5 persons.Actual 1,6826 or more persons 660
EnablingRegular dentist:Yes .1 3,860
No.0 1,186Income2:Less than $4,000. ....... 520$4,000-6,999 .......... 659$7,000-9,999 ........... 1,005$10,000-14,999 .......... 1,328$15,000 or more ... ....... 1,534
NeedCondition of teeth:
Excellent or good... 1 2,800Fair or poor... 0 2,246
Condition of gums:Excellent or good... 1 3,937Fair or poor... 0 1,109
Predictedeffect on
Percent PDB
79.9 .......
5.2 .......
6.6 .......
5.6 .......
2.8 .......
9.4 .......
44.2 .......
33.3 .......
13.1 Negative
76.523.5
10.313.119.926.330.4
55.544.5
78.022.0
Positive.......
.P......Positive
.......
Positive
1 Separate F tests were done for each marital status category, using'separated" as the referent. This procedure was chosen because it wouldindicate where the differences in marital status existed.
2 Income was recorded-from the original continuous categories. The midpoint ofeach original category was chosen with actual values used in the regressionequation: 11=1,000, 12=1,500, 13=2,500, 14=3,500, 15=4,500, 16=5,500,17=6,500, 18=8,500, 19= 12,500, 20= 17,500, 21=22,500, 22=30,000.
condition of gums, which showed that personswho evaluated their gums as fair or poor weremore likely to go to the dentist to have their teethcleaned.Of the enabling factors, both income and a
regular source of care were statistically significant.Income showed a positive association and was thesecond most important factor in the model, withregular source of care ranked third. As expected,the enabling factors were less strongly related tofrequency of brushing than to the other measuresof PDB.Four of the six predisposing factors were statisti-
cally associated with visiting a dentist for preven-tive reasons. Their rank order of importance waseducation, race, gender, family size, marital status,and age. Consistent with other research, maleswere less likely to seek preventive care than were
females, and blacks were less likely to visit thedentist for preventive reasons than were whites.Education was positively associated with preventivebehavior. As family size increased, the likelihoodof a preventive dental visit decreased. Maritalstatus and age were not significant, although ageshowed a negative association, which is consistentwith the findings of others.
Table 2 also shows the results of the regressionanalysis for length of time since last cleaning. Theenabling factor of a regular source of care was themost important variable in predicting a visit to thedentist in the past year for a cleaning. Income, theother enabling factor, also had a strong positiveeffect on PDB, ranking third among all variables.Condition of teeth, a need variable, ranked secondin importance; those rating their teeth as "excel-lent or good" were more likely to have gone
180 Public Health Reports
i-L
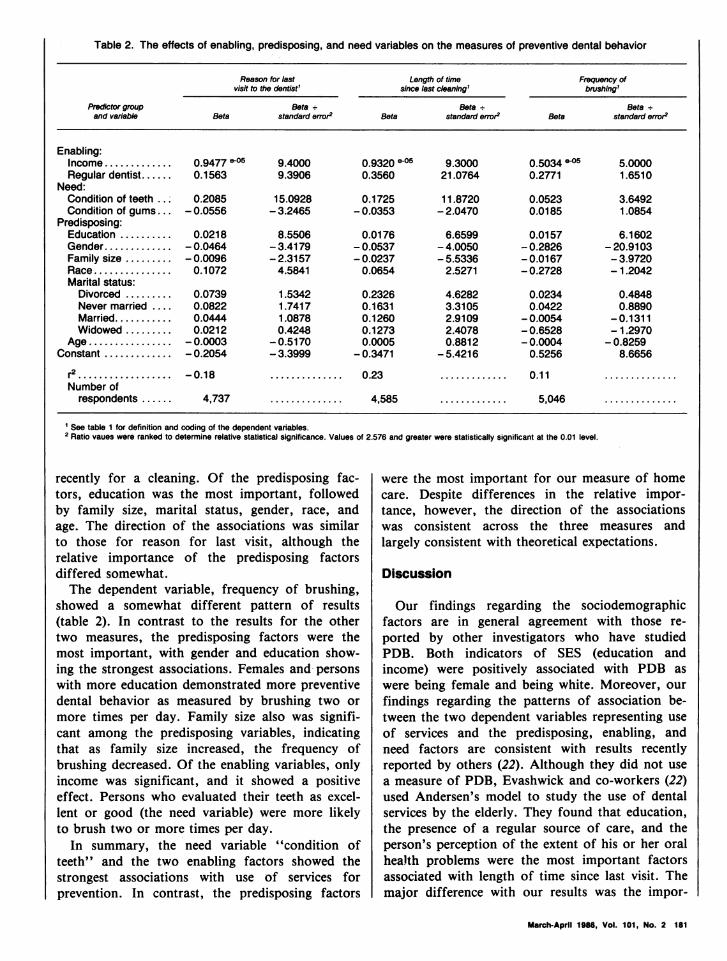
Table 2. The effects of enabling, predisposing, and need variables on the measures of preventive dental behavior
Reason for last Length of time Frequency ofvisit to the dentist' since last cleaning' brshing'
Predictor group Beta - Beta - Beta -and variable Beta standard error2 Beta standard error2 Beta standard error2
Enabling:Income ............. 0.9477 *059.4000 0.9320 eO59.3000 0.5034 * o 5.0000Regular dentist...... 0.1563 9.3906 0.3560 21.0764 0.2771 1.6510
Need:Condition of teeth .. 0.2085 15.0928 0.1725 11.8720 0.0523 3.6492Condition of gums... - 0.0556 - 3.2465 - 0.0353 - 2.0470 0.0185 1.0854
Predisposing:Education .......... 0.0218 8.5506 0.0176 6.6599 0.0157 6.1602Gender ............. -0.0464 -3.4179 -0.0537 -4.0050 -0.2826 -20.9103Family size ......... -0.0096 -2.3157 -0.0237 -5.5336 -0.0167 -3.9720Race ............... 0.1072 4.5841 0.0654 2.5271 -0.2728 -1.2042Marital status:
Divorced ......... 0.0739 1.5342 0.2326 4.6282 0.0234 0.4848Never married .... 0.0822 1.7417 0.1631 3.3105 0.0422 0.8890Married........... 0.0444 1.0878 0.1260 2.9109 -0.0054 -0.1311Widowed ......... 0.0212 0.4248 0.1273 2.4078 -0.6528 -1.2970
Age ................ - 0.0003 -0.5170 0.0005 0.8812 - 0.0004 - 0.8259Constant ............. -0.2054 -3.3999 -0.3471 -5.4216 0.5256 8.6656
r ................. .............. 0.23 ............. 0.11 ..............
Number ofrespondents ...... 4,737 .............. 4,585 ............. 5,046 ..............
' See table 1 for definition and coding of the dependent variables.2 Ratio vaues were ranked to determine relative statistical significance. Values of 2.
recently for a cleaning. Of the predisposing fac-tors, education was the most important, followedby family size, marital status, gender, race, andage. The direction of the associations was similarto those for reason for last visit, although therelative importance of the predisposing factorsdiffered somewhat.The dependent variable, frequency of brushing,
showed a somewhat different pattern of results(table 2). In contrast to the results for the othertwo measures, the predisposing factors were themost important, with gender and education show-ing the strongest associations. Females and personswith more education demonstrated more preventivedental behavior as measured by brushing two ormore times per day. Family size also was signifi-cant among the predisposing variables, indicatingthat as family size increased, the frequency ofbrushing decreased. Of the enabling variables, onlyincome was significant, and it showed a positiveeffect. Persons who evaluated their teeth as excel-lent or good (the need variable) were more likelyto brush two or more times per day.
In summary, the need variable "condition ofteeth" and the two enabling factors showed thestrongest associations with use of services forprevention. In contrast, the predisposing factors
were statistically significant at the 0.01 level.
were the most important for our measure of homecare. Despite differences in the relative impor-tance, however, the direction of the associationswas consistent across the three measures andlargely consistent with theoretical expectations.
Discussion
Our findings regarding the sociodemographicfactors are in general agreement with those re-
ported by other investigators who have studiedPDB. Both indicators of SES (education andincome) were positively associated with PDB as
were being female and being white. Moreover, our
findings regarding the patterns of association be-tween the two dependent variables representing use
of services and the predisposing, enabling, andneed factors are consistent with results recentlyreported by others (22). Although they did not use
a measure of PDB, Evashwick and co-workers (22)used Andersen's model to study the use of dentalservices by the elderly. They found that education,the presence of a regular source of care, and theperson's perception of the extent of his or her oralhealth problems were the most important factorsassociated with length of time since last visit. Themajor difference with our results was the impor-
March-April 1986, Vol. 101, No. 2 181

tance of income in our study-a difference thatmay be explained by the limited range of incomein their sample.Andersen and co-workers (23) found that tooth-
ache (a need variable) was the most importantfactor predicting both number of dental visits (forany reason) and percentage of people seeing adentist. The predisposing factors of age, educa-tion, and race also were important predictors forseeing a dentist, while family income, an enablingfactor, was the second most important variable fornumber of visits. In contrast, Andersen (1) foundthat need was relatively unimportant in explainingexpenditures for dental services; however, the needvariables in his early study were not specific todental problems. Although most of their analysisdid not focus on PDB, Andersen and co-workers(23) did examine racial and income differences inreasons for seeing a dentist. More whites thanblacks visited a dentist only for preventive care,with income making little difference in this pat-tern. Even though our dependent measures dif-fered from those used by Andersen and co-workers(23) in that we focused on preventive behavior,our findings with respect to the relative importanceof the predisposing, enabling, and need factors arein general agreement. It appears that use ofservices for prevention does not show a verydifferent pattern of association compared with usein general; however, use in general includes use forprevention. It would be preferable to compareconstellations of independent variables separatelyby specific reason for visits.Of particular interest were our findings regard-
ing the associations between frequency of brushingand the three types of independent variables. Forthis measure of PDB the rank order of the threetypes of independent variables differed, with thepredisposing factors of gender and education beingthe most important. Antonovsky and Kats (3)noted that, in their attempt to form a compositemeasure of PDB, the questions dealing with homecare did not correlate well with checkup behavior.Similarly, we found a higher correlation betweenthe two utilization measures (.32) than between thehome care measure and either utilization measure(.12 for the correlation between home care andlength of time since last cleaning and .13 for homecare and reason for last visit). Thus, our finding isconsistent with the results of other studies (3, 24,25) which support the view that each preventivebehavior may be influenced by different variablesand that each variable may not be of equalimportance.
Although there was consistency in the directionof associations between all three dependent mea-sures and the independent variables, the differencein the rank order of importance among theindependent variables has implications for programplanning and health education efforts. The strongassociation between having a regular source of careand the utilization measures is consistent with aninterpretation that the dentist is important inmaintaining the utilization behavior of the con-sumer, as Kriesberg and Treiman (16) found. It ispossible, although we could not evaluate it in thisstudy, that the dentist plays a major role indetermining whether his patients come in forpreventive visits, since most dentists use recallsystems to remind patients to come in for check-ups. In contrast, having a regular source of carewas not a major predictor for frequency ofbrushing, an indication that dental health educa-tion may be obtained away from the professionaldental office. Toothbrushing is a convenient andrelatively inexpensive prophylactic process that hasbeen advocated for years by health professionalsand is easily taught by nonprofessionals (10).The strength of the association of income both
with utilization for prevention and with home careis notable, although the interpretation of its effectmay differ for the utilization and the home caremeasures. Clearly, income may be viewed as anenabling factor in the use of health services, whilefor frequency of brushing this conceptualizationseems less applicable.Lowering this barrier with insurance coverage of
preventive dental services might increase utilizationby certain subgroups. Data analyzed by Manningand Phelps (26) comparing the use of dentalservices by a sample of elderly persons in theGroup Health Insurance with the United Statespopulation in the same age group suggests that thismight be the case. However, the strong associationbetween education and all three measures ofpreventive dental behavior, especially frequency ofbrushing, leads us to suggest that financial con-straints may not be the only barrier to engaging inPDB. Others (4,11) who have observed similarpatterns have suggested that persons of lowersocioeconomic status may view dental problems asless important or believe that dental visits areineffective in preventing disease. If this is the case,programs designed to increase knowledge of theimportance and effectiveness of preventive dentalbehavior may have some impact on these groups.We caution against this effort as a panacea,however, because it has been noted that the
182 Public Health Reports

correlation between knowledge or attitudes andactual behavior is modest (11, 14).
Self-evaluated condition of teeth, a need varia-able, was significant in all models. Our datashowed that persons who considered their teeth tobe in excellent or good condition demonstratedmore PDB than those rating the condition of theirteeth as fair or poor. In contrast, the need variable"condition of gums" showed the opposite patternfor the utilization measures. It may be that thecondition of one's gums is associated with seriousdental problems such as bleeding and pain whichmotivate one to visit the dentist for remedial care.In contrast, a person's perception of his teeth asexcellent or good may reflect a behavioral patternof preventive care. We would thus expect thatvisits to the dentist for preventive reasons andother preventive behavior such as home care wouldbe related to the perception of one's teeth as ingood condition. It would be useful to attemptreplication of these findings in a prospective studyusing a more objective measure of need, such as adentist's evaluation.
It is important to note some limitations of ourmeasures of PDB. Appropriate PDB differs fordifferent dental diseases. The available data indi-cate that toothbrushing is not particularly effectiveagainst dental caries but is recommended to con-trol periodontal diseases (27,30). Dental cariesoccur primarily during childhood and adolescenceand are most effectively controlled through waterfluoridation, use of self-applied fluoride tablets,and reduced consumption of sugar (28,30).Periodontal diseases, which primarily afflict adults,can be controlled to some extent through effectivepersonal oral hygiene such as toothbrushing andthe use of dental floss, augmented by professionalprophylaxes (28,30). The efficacy of toothbrushingin controlling periodontal diseases, however, de-pends on the removal of plaque from the teeth,which is not necessarily related to the frequency ofbrushing. Leske and colleagues (28) note thatplaque can be removed by physical or chemicalmeans. Physical methods include toothbrushing,flossing, and the use of water irrigating devices,while chemical methods include the use of antibiot-ics, antimicrobial agents, and enzymes. We hadonly one of these measures, toothbrushing, avail-able in our data set.Length of time since last cleaning also is limited
as a dependent variable in that it is difficult todetermine an ideal cutoff point. Once a year maybe no better than once every year and a half.Moreover, Leske and colleagues (28) note that
there is no evidence that cleaning twice a yearresults in a significant improvement in oral health(31). Thus, our measures relate imperfectly to whatis known about the prevention of dental diseases.The low proportion of variation explained in our
study and in those of others may be due tolimitations in the theoretical frameworks used. Themodels we used clearly demonstrate the importanceof certain characteristics, but they omit othervariables which undoubtedly play a part. In addi-tion to including more of the standard variablesfrom the Andersen model, future research shouldexamine the role of the family and other socialgroups in promoting the oral health behaviors ofindividuals. In addition, the use of prospectivestudy designs would permit us to examine whichfactors were related to changes in PDB over time.
References ................................
1. Andersen, R. M.: A behavioral model of families' use ofhealth services. Research Series 25. University of ChicagoCenter for Health Administration Studies, Chicago, 1968.
2. Cummings, K. M., Becker, M. H., and Maile, M. C.:Bringing the models together: an empirical approach tocombining variables used to explain health actions. JBehav Med 3: 123-145, June 1980.
3. Antonovsky, A. and Kats, R.: The model dental patient-An empirical study of preventive health behavior. Soc SciMed 4: 367-380, November 1970.
4. Coburn, D. and Pope, C. R.: Socioeconomic status andpreventive health behavior. J Health Soc Behav 15: 67-77,June 1974.
5. Kegeles, S. S.: Some motives for seeking preventive dentalcare. J Am Dent Assoc 67: 90-98 (1963).
6. Kegeles, S. S.: Why people seek dental care: A test ofconceptual formulation. J Health Human Behav 4:166-173, July 1963.
7. Rayner, J. F.: Socioeconomic status and factors influenc-ing the dental health practices of mothers. Am J PublicHealth 60: 1250-1258, July 1970.
8. Tash, R. H., O'Shea, R. M., and Cohen, L. K.: Testing apreventive-symptomatic theory of dental health behavior.Am J Public Health 59: 514-521, March 1969.
9. Kasl, S. V., and Cobb, S.: Health behavior, illnessbehavior and sick role behavior. Arch Environ Health 12:246-267, February 1966.
10. Chen, M. and Rubinson, L.: Preventive dental behavior infamilies: A national study. J Am Dent Assoc 105: 43-46,July 1982.
11. O'Shea, R. M., and Gray, S. B.: Dental patients' atti-tudes and behavior concerning prevention: national sur-vey. Public Health Rep 83: 405-410, May 1968.
12. Nikias, M. K.: Social class and the use of dental careunder prepayment. Med Care 6:381-393, September-October 1968.
13. Tyroler, H. A.:, Johnson, A. L., and Fulton, J. T.:Patterns of preventive health behavior in populations. JHealth Human Behav 6: 128-140, fall 1965.
14. Freeman, H. E., and Lambert, C., Jr.: Preventive dental
March-April 1986, Vol. 101, No. 2 183

behavior of urban mothers. J Health Human Behav 6:141-147, fall 1965.
15. Moen, B. D., and Poetsch, W. E.: More preventive care,less tooth repair. J Am Dent Assoc 81: 25-36, July 1970.
16. Kriesberg, L. and Treiman, B. R.: Socio-economic statusand the utilization of dentists' services. J Am Coll Dent27: 147-165, September 1960.
17. Kriesberg, L. and Treiman, B. R.: Preventive utilizationof dentists' services among teenagers. J Am Coll Dent 29:28-45, March 1962.
18. Grossman, M.: The demand for health: A theoretical andempirical investigation. National Bureau of EconomicResearch, New York, 1972.
19. Phelps, C. E.: Effects of insurance on demand formedical care. In Equity in health services, edited by R.Andersen, J. Kravits, and 0. W. Andersen. Ballinger,Cambridge, MA, 1975, pp. 105-130.
20. Hadden, W. C.: Basic data of health care needs of adultsages 25-74 years, United States, 1971-75. DHHS Publica-tion No. (PHS) 81-1668. Hyattsville, MD. December 1980.
21. Knoke, D.: A comparison of log-linear and regressionmodels for systems of dichotomous variables. SociologicalMethods and Research 3: 416-434, May 1975.
22. Evashwick, C., Conrad, D., and Lee, F.: Factors relatedto utilization of dental services by the elderly. Am JPublic Health 72: 1129-1135, October 1982.
23. Andersen, R. M., Kravits, J., and Anderson, 0. W.: Equ-ity in health services. Ballinger, Cambridge, MA, 1975.
24. Nikias, M. K.: Prevention in oral health problems: Social
behavioral aspects. Prev Med 5: 149-164, March 1976.25. Williams, A. F., and Wechsler, H.: Interrelationship of
preventive actions in health and other areas. Health ServRep 87: 969-976, December 1972.
26. Manning, W. G., and Phelps, C. E.: The demand fordental care. Bell Journal of Economics 10: 503-525 (1979).
27. Cohen, L. K., O'Shea, R. M., and Putnam, W. J.:Toothbrushing: Public opinion and dental research. Jour-nal of Oral Therapeutics and Pharmacology 4: 229-246(1968).
28. Leske, G. S., Ripa, L. W., and Leske, M. C.: Dentalpublic health. In Maxcy-Rosenau public health and pre-ventive medicine, Ed. 11, edited by J. M. Last, Appleton-Century-Crofts, New York 1980, pp. 1423-1468.
29. Rothman, K. J.: Diseases of the mouth. In Preventionand community medicine, Ed. 2, edited by D. W. Clarkand B. MacMahon, Little, Brown and Co., Boston, 1981,pp. 167-174.
30. Silversin, J. B., and Kornacki, M. J.: Controlling dentaldisease through prevention: Individual, institutional andcommunity dimensions. In Social science and dentistry,edited by L. K. Cohen and P. S. Bryant, FederationDentaire Internationale-Quintessence Publishing Co., Ltd.,London, 1984, vol. 2, pp. 145-201.
31. Ripa, L. W., Barenie, J. T., and Leske, G. S.: The effectof professionally administered bi-annual prophylaxes overa two-year period on the oral hygiene, gingival health, andcaries scores of school children. J Prev Dent 3: 22-26,January-February 1976.
Model System of Ongoing Carefor Native Americans-a 5-Year Followup
ALLEN J. DIETRICH, MDARDIS L. OLSON, MD
Dr. Dietrich is with the Department of Community andFamily Medicine and Dr. Olson with the Department ofMaternal and Child Health, both at Dartmouth MedicalSchool.
Tearsheet requests to Dr. Dietrich at Dartmouth MedicalSchool, Hanover, NH 03756.
Synopsis....................................
In 1979, continuing care from a personal physi-cian was identified as a priority at the IndianHealth Service site in Zuni, NM, a rural hospitaland ambulatory care center serving 7,000 Zunipeople. To encourage such care, a system wasestablished that assigned each patient to a regularphysician and organized physicians into teams.Three teams, each consisting of three cliniciansand other support personnel, served specific geo-graphic regions of the village.
Five years later, the ongoing care provided foractive randomly selected prenatal, diabetic, andgeneral clinic patients was evaluated. The physicianstaff of the site had gone through a completeturnover during the previous five years. Based ona chart review for the year prior to patientidentification, patients saw their regular physicianfrom 48 to 61 percent of the time in all theirvisits, and their regular physician or his or herteam colleague from 71 to 82 percent of the timein all their visits.
Ongoing care from a personal physician or closecolleague can be achieved in the Indian HealthService. Organization of physicians into teamsappeared to be the critical element in promotingongoing care at this site where physician turnoveris high. Team physicians seldom all leave at once,and ongoing care as a priority is passed on by theattitude of other team physicians, by transfer ofspecific patients, and by patient expectation. Giventhe established benefits, ongoing care from apersonal provider should be encouraged in theIndian Health Service as in other primary caresettings.
184 Public Health Reports