patent trolls: evidence from targeted firms · keywords: patent trolls, npes, paes, innovation,...
TRANSCRIPT
Patent Trolls: Evidence from Targeted Firms
Lauren Cohen Umit G. Gurun Scott Duke Kominers
Working Paper 15-002
Working Paper 15-002
Copyright © 2014, 2015, 2016 by Lauren Cohen, Umit G. Gurun, and Scott Duke Kominers
Working papers are in draft form. This working paper is distributed for purposes of comment and discussion only. It may not be reproduced without permission of the copyright holder. Copies of working papers are available from the author.
Patent Trolls: Evidence from Targeted Firms
Lauren Cohen Harvard Business School
Umit G. Gurun University of Texas at Dallas
Scott Duke Kominers Harvard University
Patent Trolls: Evidence from Targeted Firms∗
Lauren CohenHarvard Business School and NBER
Umit G. GurunUniversity of Texas at Dallas
Scott Duke KominersHarvard University
First Version: March 10, 2014This Version: February 2, 2017
∗We greatly appreciate the helpful comments of David Abrams, Ufuk Akcigit, David Autor, Pierre Azoulay,James Bessen, Nick Bloom, Jorn Boehnke, Daniel Bradley, Eric Budish, Pierre-Andre Chiappori, Raj Chetty,Colleen Chien, Wesley Cohen, Chris Cotropia, Sidney Dickstein, Maryann Feldman, Noah Feldman, RobinFeldman, Ken Felter, Amy Finkelstein, Richard Freeman, Drew Fudenberg, Alberto Galasso, BernhardGanglmair, Joshua Gans, Mariassunta Giannetti, Wally Gilbert, Daniel Gottlieb, John Golden, StuartGraham, Mark Greenstein, Joseph Ha, Oliver Hart, Cam Harvey, Stephen Hawking, Paul Po-Hsuan Hsu,John Eric Humphries, Bob Hunt, Sonia Jaffe, Beata Javorcik, Louis Kaplow, Jay Kesan, Julian Kolev,Ellen Dickstein Kominers, Paul Kominers, William Kominers, Mark Lemley, Josh Lerner, Stan Liebowitz,Olivia Luk, Chris Malloy, Alan Marco, Michael Meurer, Shawn Miller, Adair Morse, Petra Moser, KevinMurphy, Marina Niessner, Jillian Popadak, Jim Poterba, Arti Rai, David Robinson, Assaf Romm, Fiona ScottMorton, David Schwartz, Victoria Schwartz, Amit Seru, Andrei Shleifer, Ted Sichelman, Danny Sokol, KathySpier, Scott Stern, Lars Stole, Balazs Szentes, Alex Teytelboym, Bob Topel, Catherine Tucker, SaurabhVishnubhakat, Annette Vissing-Jorgensen, Martin Watzinger, Heidi Williams, and seminar participants atthe 2015 American Finance Association Meeting, the 2014 Brandeis Entrepreneurship Conference, the 2014Berkeley CELS Conference, the 2015 Harvard/MIT/INET/CIGI Workshop on Innovation, the 2015 LundUniversity Conference on Entrepreneurship and Finance, the 2014 NBER Summer Institute Workshop onInnovation, the 2015 NBER Law and Economics Meeting, the 2014 Red Rock Finance Conference, the2015 Works in Progress Intellectual Property Colloquium (WIPIP), the Robert F. Lanzillotti Public PolicyResearch Center and University of Florida Conference on The Economics of Innovation, Bentley, Brandeis,Chicago Booth, DePaul, Duke, Facebook, Harvard, HKU, HKUST, MIT, Nanyang Technological University,Ozyegin University, the Society of Fellows, Texas Christian University, the University of Texas at Dallas,and the USPTO. We are grateful to Daniel McCurdy, Christopher Reohr, and Shashank Tiwari of RPX
Patent Trolls: Evidence from Targeted Firms
Abstract
We develop a theoretical model of, and provide the first large-sample evidence on,the behavior and impact of non-practicing entities (NPEs) in the intellectual propertyspace. Our model shows that NPE litigation can reduce infringement and supportsmall inventors. However, the model also shows that as NPEs become effective atbringing frivolous lawsuits, the resulting defense costs inefficiently crowd out firmsthat, absent NPEs, would produce welfare-enhancing innovations without engaging ininfringement. Our empirical analysis shows that on average, NPEs appear to behave asopportunistic “patent trolls.” NPEs sue cash-rich firms—and target cash in businesssegments unrelated to alleged infringement at essentially the same frequency as theytarget cash in segments related to alleged infringement. By contrast, cash is neither akey driver of intellectual property lawsuits by practicing entities (e.g., IBM and Intel),nor of any other type of litigation against firms. We find further suggestive evidence ofNPE opportunism: forum shopping, the targeting of firms that have reduced ability todefend themselves, and repeated assertions of low-quality patents. We find moreoverthat NPE litigation has a real negative impact on innovation at targeted firms: firmssubstantially reduce their innovative activity after settling with NPEs (or losing to themin court). Meanwhile, we neither find any markers of significant NPE pass-through toend innovators, nor of a positive impact of NPEs on innovation in the industries inwhich they are most prevalent.
JEL Classification: D2, K1, O31.
Keywords: Patent trolls, NPEs, PAEs, Innovation, Patents.
Corporation and Mike Lloyd and Doris Spielthenner of Ambercite for graciously providing data. We thankRobbie Minton for fantastic research assistance. Finally, we gratefully acknowledge funding from the NationalScience Foundation (grants CCF-1216095, SciSIP-1535813, and SES-{0847395, 1459912}). Kominers alsogratefully acknowledges the hospitality of Microsoft Research New England and the support of the HarvardMilton Fund and the Ng Fund of the Harvard Center of Mathematical Sciences and Applications.
Clearly defined property rights are essential for well-functioning markets. In the case of
intellectual property (IP), however, property rights are complex to define, as unlike ownership
of physical assets, the space of ideas is difficult to delineate. The United States and many
other countries protect inventors’ IP through patents, property rights granting inventions’
owners sole rights of commercialization or exclusion—the right to block the use or sale of
equivalent inventions by others—for a period of time. In the United States, the legal system
is the arbiter of patent infringement; hence, legal action (or the threat of legal action) is the
main lever by which patent holders challenge alleged intellectual property infringers.
A new organizational form, the non-practicing entity (hereafter, NPE ), has recently
emerged as a major driver of patent litigation. NPEs amass patents not for the sake of
producing commercial products, but in order to claim license fees and/or litigate against
infringement. The rise of NPEs has sparked a debate regarding NPEs’ value and impact on
innovation: Proponents of NPEs argue that NPEs serve a key financial intermediary role,
policing infringement by well-funded firms that could otherwise infringe upon small inventors’
IP without consequence. Opponents argue that NPEs simply raise the costs of innovation by
exploiting the fact that the costs of legal process, together with the risks that imperfect courts
may rule in NPEs’ favor even if no infringement has actually occurred (or if the asserted
patents would not survive a validity test), mean that the credible threat of legal process can
yield rents from producing, innovative firms.1 In part reflecting the debate on NPEs, in the
last few years there have been over a dozen bills introduced in Congress proposing to regulate
the licensing and assertion of patents.2
1Bessen and Meurer (2014) estimate that from 2007 to 2010, litigation (and settlement) losses due toNPEs averaged over $83 billion per year in 2010 dollars (just summing over the losses to publicly tradedfirms). In magnitude, this corresponds to over 25% of annual United States industrial R&D investment.
2In the last four years, Congress has considered the Innovation Act (H.R. 9 and H.R. 3309), the TargetingRogue and Opaque Letters (TROL) Act (H.R. 2045), the Patent Transparency and Improvements Act (S.1720), the Patent Quality Improvement Act (S. 866), the Patent Abuse Reduction Act (S. 1013), the PatentLitigation Integrity Act (S. 1612), the Innovation Protection Act (H.R. 3309), the Patent Litigation andInnovation Act (H.R. 2639), the Saving High-tech Innovators from Egregious Legal Disputes (SHIELD) Act(H.R. 845), the Stopping the Offensive Use of Patents (STOP) Act (H.R. 2766), and the End AnonymousPatents Act (H.R. 2024). Meanwhile, the United States Patent and Trademark Office (2015) has undertakenan initiative on “Enhancing Patent Quality.”
1
In this paper, we provide the first large-sample evidence on precisely which corporations
NPEs target in litigation, when NPE litigation occurs, and how NPE litigation impacts
targeted firms’ innovative activity.
We begin with a parsimonious model of an innovative economy in which a large firm must
decide whether to innovate, and—conditional on innovating—must also decide whether to
reduce the costs of innovation by infringing upon a small inventor’s IP. NPEs help small
inventors litigate in response to infringement by the large firm, but can also bring nuisance
lawsuits when no infringement has occurred.
Our theoretical model supports both sides of the NPE debate: NPE litigation can both
reduce infringement and promote a transfer to inventors when infringement occurs, although
the value of NPEs to inventors—both in terms of license fees and awards through litigation—is
only as large as the fraction of the damage award that NPEs pass through. As NPEs become
effective at bringing nuisance lawsuits, however, the resulting defense costs inefficiently crowd
out some firms that, absent NPEs, would prefer to engage in innovation without infringing.
Somewhat paradoxically, we also find that the possibility of nuisance lawsuits can lead some
innovating firms to infringe more because avoiding infringement may not deter suit.
The theory illustrates that the key question for assessing NPEs’ welfare impact concerns
lawsuit targeting behavior: Do NPEs on average police against true infringement, or do they
primarily behave opportunistically, bringing lawsuits irrespective of whether infringement has
occurred? It is impossible for us to directly measure whether targeted firms were actually
infringing, especially given that most NPE lawsuits are settled before even early stages of pre-
trial discovery occur. However, we can—and do—look for empirical evidence of opportunistic
behavior.
We work with two independent sources of data on NPE litigation activity: proprietary
data from RPX Corporation and hand-coded, finely classified public data assembled by
Cotropia et al. (2014). Together, these data sources cover the complete universe of NPE
lawsuits from 2005 to 2015; we combine this data on NPE lawsuits with external data on
2
publicly traded firms.
Using our linked data, we show that NPEs appear to behave opportunistically: they target
firms that are flush with cash (controlling for all other characteristics) and firms that have
had recent, positive cash shocks. NPEs even target firms that earn their profits from business
segments having nothing to do with the allegedly infringing segments. Our findings suggest,
for example, that an NPE would likely sue a firm regarding alleged information technology
infringement even if the firm is earning all its revenue from a lumber division entirely unrelated
to the information technology division—and even if the information technology division is
unprofitable. Indeed, a one standard-deviation increase in cash level increases the probability
of being sued by an NPE by 7.40% (t = 4.25)—a twofold increase, and cash holdings in
unrelated business segments are almost as predictive of NPE litigation as are cash holdings
in segments related to the alleged infringement.
Meanwhile, we find evidence that NPEs may not be policing infringement. The cash-
targeting we observe is mostly the behavior of large “patent aggregator” firms; small inventors’
lawsuits show a different targeting pattern, in which defendants’ cash holdings are not a
significant factor. There is also evidence that NPEs bring lower-quality lawsuits, and evidence
that NPEs are actively forum shopping.
In theory, our finding that cash/profitability is a first-order determinant of NPE litigation
could simply be picking up a general characteristic of IP litigation, or of litigation more
generally. However, our results show otherwise: Practicing entities (PEs), such as IBM and
Intel, who also sue each other for patent infringement, do not behave in the same way as
NPEs. We hand-collected the universe of patent infringement cases brought by PEs against
PEs in our sample period, and find that, if anything, PEs are slightly less likely to sue firms
with high cash balances.3 Similarly, we found that cash is not a significant determinant of
other (non-IP) forms of litigation—tort, contract, securities, environmental, or labor. This
3All of the other key determinants of NPE targeting have (statistically and economically) no impact onPE litigation behavior, with the exception of ongoing, non-IP-related cases, which has a positive impact ontargeting for NPEs, but a negative impact for PEs.
3
comparison suggests that our results on NPE litigation behavior do not just reflect general
characteristics of litigation. Rather, our findings are consistent with agent-specific motivations
for NPEs in targeting firms flush with cash.
Using several different empirical measures, we also find that NPEs target firms against
which they have a higher ex ante likelihood of winning. First, we show that NPEs are
significantly more likely to target firms that are busy dealing with other, non-IP-related
litigation. Being tied up with outside litigation increases the probability of being sued by
an NPE by roughly 19% (t = 2.38). Moreover, we show that, controlling for all other
characteristics, firms with smaller legal teams have a significantly higher probability of being
targeted by NPEs. Additionally, echoing and amplifying findings of prior work, we find
evidence that NPEs frequently forum-shop, and assert patents that appear to be broader,
wordier, and closer to expiry than those asserted by PEs.
Lastly, we examine the real impacts of NPE litigation on targeted firms’ innovative activity.
Using a differences-in-differences approach, we find that firms that lose to NPEs (either in
court or through settlement) reduce their research and development investment by roughly
20% going forward, relative to ex ante identical firms.4 Thus, our evidence suggests that NPE
litigation causes a real decrease in innovation at targeted firms. Of course, when NPEs win
lawsuits, some of the losses to the targeted firms—part of the settlement or damage award,
but not the legal costs—should eventually flow back to end inventors. The best available
estimates suggest, however, that only a small fraction of the damages won by NPEs are
actually paid back to innovators (Bessen et al. (2011); Bessen and Meurer (2014)). As our
theoretical model illustrates, when only small transfers reach end inventors, NPEs’ value in
encouraging invention - both directly and indirectly - is significantly dampened. Moreover,
we show empirical evidence consistent with this lack of pass-through impact from NPEs on
innovation.
Taken as a whole, our evidence appears most consistent with the view that NPEs on
4To control for selection of firms targeted by NPEs, we compare firms that are sued by NPEs and “win”to those are sued by NPEs and “lose.”
4
average behave as patent trolls. NPEs chase cash, and have a real negative impact on targeted
firms’ innovative activity. Alternative interpretations simply do not seem to explain the entire
body of evidence. For instance, NPEs’ empirically documented level of cash-targeting—which
does appear in PE patent litigation, or in other types of litigation—suggests that the scope and
implementation of cash-targeting we see is unique to the NPE organizational form in the IP
space. Furthermore, our results on cash-targeting might be consistent with the possibility that
targeted firms are knowingly infringing and are stockpiling cash in anticipation of litigation;
however, this alternate explanation is at odds with our finding that NPEs are especially
likely to target firms that have had cash shocks, and/or are embroiled in non-IP-related
lawsuits. Meanwhile, the idea that NPEs solely target firms that profitability infringe on
NPEs’ intellectual property is inconsistent with our finding that cash holdings in related and
unrelated operating segments are almost equally predictive of suit.
The remainder of the paper is organized as follows. Section 1 provides background and a
literature review. Section 2 develops our model of the economics of innovation and intellectual
property litigation. Section 3 describes our data sources. Section 4 presents our empirical
results on NPE targeting. Section 5 shows evidence on the real impacts of NPE litigation
behavior on innovation. Section 6 provides a discussion, and Section 7 concludes.
1 Background
A United States inventor’s patenting process begins with an application to the United States
Patent and Trademark Office (USPTO), which assigns the application to a patent examiner.
The examiner’s job is to compare the filed patent’s claims to prior art, in order to determine
whether the claimed invention is patentable, novel, and nonobvious.5 If the examiner decides
to grant the claims in an application, then the USPTO issues a patent to the applicant.6 The
5Prior art refers to other patents, publications, and publicly disclosed but unpatented inventions thatpredate the patent application’s filing date.
6In 2015, the average time between application and initial examiner report was 17.3 months and, onaverage, it took 26.6 months for the USPTO to issue a patent. The USPTO granted 325,979 patents in 2015.
5
patentability of a patent’s claims can be challenged in administrative proceedings. Patent
validity can be challenged in one of the 94 federal district courts by presenting prior art that
may have been overlooked by USPTO examiners. Since 2012, it has also been possible to
challenge patent validity via administrative proceeding at the Patent Trial and Appeal Board
(PTAB).
Since a patent confers the right to exclude others from “practicing” an invention, patent
owners can sue anyone who uses, makes, sells, offers to sell, or imports their inventions
without legal permission. If a patent infringement lawsuit is not dismissed in its initial stages,
it proceeds to the discovery phase, in which both the accused infringer (defendant) and the
patent owner (plaintiff) supply documents and depositions intended to demonstrate how the
allegedly infringing product is made. If a party does not make or sell products or provide
services based on the patented invention, then it is likely to have far fewer documents to
disclose. Consequently, as NPEs do not produce products, the discovery phase can be far less
costly for NPE plaintiffs than for defendants.
If an infringement suit is not settled or dismissed, then a court interprets the parties’
claims, making determinations both as to whether the patent is valid and whether infringement
occurred. A judge or jury who rules in favor of the patent owner can award monetary damages
and/or issue an injunction to prohibit further infringement. 7
The amount of patent-related litigation has increased threefold since 2005 (see Figure 1).8
According to a recent United States Government Accountability Office (2013) report, three
factors contributed to the rise in IP litigation: (1) the number of patents (especially software-
related patents) with unclear scope has increased; (2) courts have been granted large monetary
awards in infringement lawsuits, even for ideas that make only small contributions to a product;
For other USPTO-related statistics, see http://www.uspto.gov/about/stats/.7Following the eBay Inc. v. MercExchange, L.L.C., 547 U.S. 388 Supreme Court ruling in 2006, injunctions
became much harder to acquire, and thus monetary damages became the far more prevalent remedy.8In 2012, the America Invents Act forced the “disjoining” lawsuits based on unrelated infringement claims.
Thus, the increase in NPE litigation around 2012 is not quite as sharp as Figure 1 suggests, especially becausemany NPEs file suits against multiple parties. Even adjusting for this issue, the rise in NPE litigation is stillstriking.
6
and (3) markets place a larger valuation on patents than they did before.
Large-scale NPE patent litigation is a recent development; consequently, the systematic
empirical literature on NPEs is limited.9 Our paper contributes to this literature by providing
the first large-sample evidence about which public corporations NPEs choose to litigate, when
NPEs bring litigation, and how NPE litigation impacts innovative activity at targeted firms.
Our paper is also related to a literature in economics that examines innovation and patents,
suggesting that the impact of patent rights on innovation is highly heterogeneous (Galasso et al.
(2015)); in particular, patents may discourage valuable follow-on innovation (Williams (2013);
see also Sakakibara and Branstetter (2001); Lerner (2009); Williams (2015)).10 Consequently,
the law and policy literatures have begun to sort out potential deficiencies in the patent
system more broadly (see, e.g., Lemley and Melamed (2013); Budish et al. (2015); United
States Patent and Trademark Office (2015)), while proposing potential reforms (see Lemley
and Shapiro (2006); Schwartz and Kesan (2014); and especially the work of Helmers et al.
(2013), which hints at how policy lessons from the United Kingdom could be used to reduce
patent trolling in the United States).
Lastly, our work is also related to the literature that examines the choice between
settlement and the pursuit of a court decision. Spier (2005) provides an excellent review of
the economics of litigation.11 While we focus solely on intellectual property, our paper is also
related to the well-developed literature on the effect of litigation risk on firm activities.12
9Surveys, clinical, and anecdotal work—finding evidence both in favor of and against NPEs—include thework of Lemley and Shapiro (2005), Bessen and Meurer (2006), Leychkis (2007), Ball and Kesan (2009),Galasso and Schankerman (2010), Bessen et al. (2011), Chien (2013a, 2014), Galasso et al. (2013), Bessenand Meurer (2014), Choi and Gerlach (2014), Cotropia et al. (2014), Feldman (2014), Scott Morton andShapiro (2014), Tucker (2014), Feldman and Lemley (2015), Smeets (2015), Kiebzak et al. (2016), Feng andJaravel (2015), Haber and Werfel (2016), and Allison et al. (forthcoming). Sokol, ed (2017) presents recentanalysis of the economic impact of NPEs.
10Using data obtained from an NPE (but not studying NPEs, per se), Abrams et al. (2013) found aninverted-U relationship between patent citations and patent value (as measured in terms of associatedrevenue).
11Previous surveys include those of Cooter and Rubinfeld (1989), Hay and Spier (1998), and Daughety andReinganum (2000).
12Prior research has investigated the impact of litigation risk on several characteristics, including cashholdings (Arena and Julio (2011)), equity-based compensation (Jayaraman and Milbourn (2009)), IPOunderpricing (Lowry and Shu (2002); Hanley and Hoberg (2012)), institutional monitoring and board discipline(Cheng et al. (2010)), conservatism in debt contracting (Beatty et al. (2008)), audit fees (Seetharaman et
7
2 Model
We now introduce a model of innovation and litigation: A firm decides whether to invest in
innovation, which has payoff v and cost k < v, for net return u ≡ v − k > 0. If the firm does
not innovate, then it produces a “safe” product, which has net return normalized to 0. If the
firm does innovate, then it may simplify its innovation process by infringing upon intellectual
property that has been developed and patented by an outside inventor. (For now, we assume
that there is no possibility that the firm can license the inventor’s intellectual property; we
later add licensing to the model, and investigate the impact of NPEs on licensing rates.)
Infringement reduces the costs of innovation by π > 0, so that innovation with infringement
yields net return
v − (k − π) = u+ π;
π represents the cost of “designing around” the invention, which is not spent if the firm
infringes.13
Once the firm has made its production decisions, the inventor may choose to litigate—
either on her own, or through an NPE.14 For plaintiff e, bringing a lawsuit has fixed-cost
ce and per-unit effort cost we. We assume that lawsuits against firms producing the “safe”
product are never profitable—for instance, because that product is clearly unrelated to the
invention in question—so litigation will only occur if the firm chooses to innovate. However,
we do not assume that litigation is only profitable in the presence of infringement—that is, we
allow for the possibility of nuisance lawsuits that occur even in the absence of infringement
(or when the asserted patents are invalid).
al. (2002)), and auditors’ resignation decisions (Shu (2000)). Papers have also investigated the relationshipbetween managers’ financial reporting and disclosure decisions and firms’ litigation risk (see, e.g., Skinner(1994, 1997); Francis et al. (1994); Johnson et al. (2000); Rogers and Van Buskirk (2009)).
13Note that with this setup, the inventor’s IP has real social/technical value (even if it has no outsidecommercial value), as using the IP reduces the firm’s cost of innovation.
14In practice, litigating through an NPE means that the inventor would transfer ownership of her patent tothe NPE (in exchange for the inventor payoffs described in the sequel). The inventor would not typicallyprefer to license the patent to the NPE in exchange for a constant fraction of future returns, as that wouldact like a tax on the NPE’s returns to litigation, and distort the NPE away from optimal litigation effort.
8
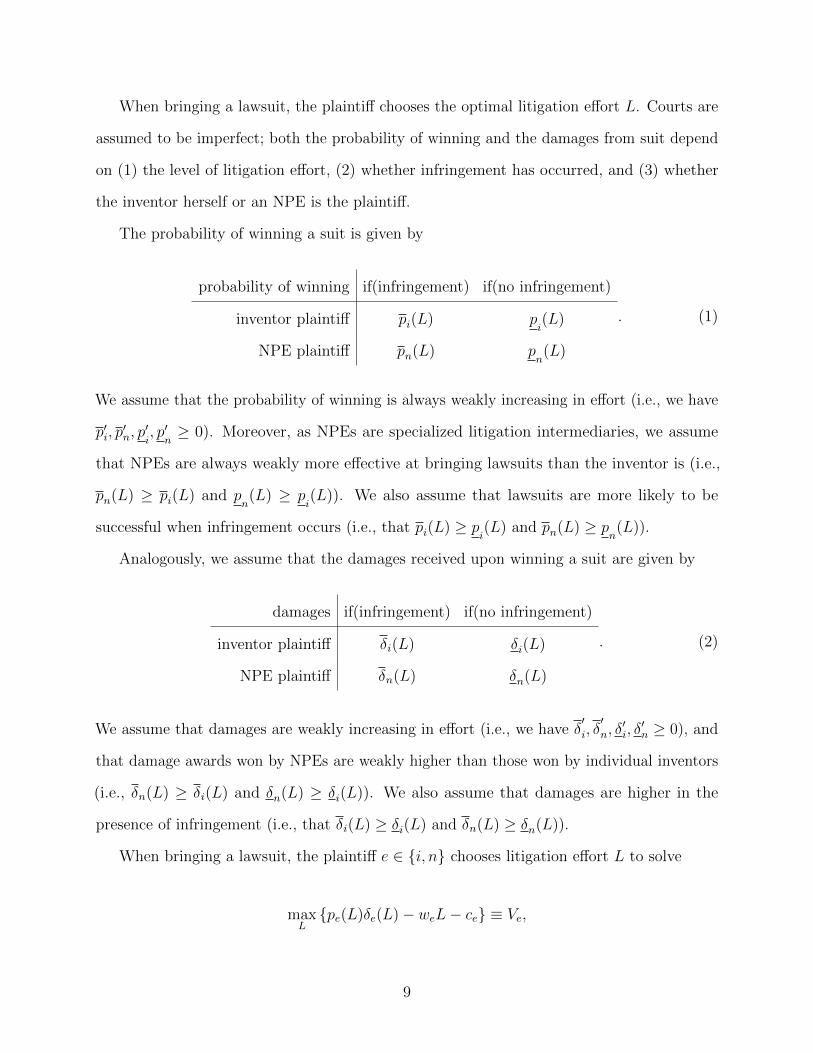
When bringing a lawsuit, the plaintiff chooses the optimal litigation effort L. Courts are
assumed to be imperfect; both the probability of winning and the damages from suit depend
on (1) the level of litigation effort, (2) whether infringement has occurred, and (3) whether
the inventor herself or an NPE is the plaintiff.
The probability of winning a suit is given by
probability of winning if(infringement) if(no infringement)
inventor plaintiff pi(L) pi(L)
NPE plaintiff pn(L) pn(L)
. (1)
We assume that the probability of winning is always weakly increasing in effort (i.e., we have
p′i, p′n, p′i, p′
n≥ 0). Moreover, as NPEs are specialized litigation intermediaries, we assume
that NPEs are always weakly more effective at bringing lawsuits than the inventor is (i.e.,
pn(L) ≥ pi(L) and pn(L) ≥ p
i(L)). We also assume that lawsuits are more likely to be
successful when infringement occurs (i.e., that pi(L) ≥ pi(L) and pn(L) ≥ p
n(L)).
Analogously, we assume that the damages received upon winning a suit are given by
damages if(infringement) if(no infringement)
inventor plaintiff δi(L) δi(L)
NPE plaintiff δn(L) δn(L)
. (2)
We assume that damages are weakly increasing in effort (i.e., we have δ′i, δ′n, δ′i, δ′n ≥ 0), and
that damage awards won by NPEs are weakly higher than those won by individual inventors
(i.e., δn(L) ≥ δi(L) and δn(L) ≥ δi(L)). We also assume that damages are higher in the
presence of infringement (i.e., that δi(L) ≥ δi(L) and δn(L) ≥ δn(L)).
When bringing a lawsuit, the plaintiff e ∈ {i, n} chooses litigation effort L to solve
maxL{pe(L)δe(L)− weL− ce} ≡ Ve,
9
where pe and δe are the appropriate functions in (1) and (2), respectively.15 The first-order
condition
p′e(L)δe(L) + pe(L)δ′e(L) = we (3)
determines e’s optimal level of effort, L∗; this in turn determines the payoffs from suit, which
we denote V ∗e . Each of the four possible litigation scenarios (inventor or NPE plaintiff, and
presence or lack of infringement) has a different payoff from optimal effort, which we notate
as follows:
returns to litigation if(infringement) if(no infringement)
inventor plaintiff V∗i V ∗i
NPE plaintiff V∗n V ∗n
. (4)
Some features of the returns to litigation are apparent immediately from the first-order
condition (3). First, shifting either the probability of winning or the damages function
upwards increases the optimal effort, as well as the returns to litigation. Moreover, we observe
a direct substitution between damages and probability of winning (holding the plaintiff type
and firm production decisions constant); this is natural, as the expected returns to suit are
exactly the product of the probability of winning and the size of the damage award.
We assume that the NPE shares fraction λ of its litigation surplus with the inventor.
That is, if the inventor sues via an NPE, then she receives (expected) payoffs
λ(V∗n − V
∗i ) + V
∗i and λ(V ∗n − V ∗i ) + V ∗i
in the cases of infringement and no infringement, respectively. Thus, in the case of infringement,
the inventor sues if and only if
max{V ∗i , λ(V∗n − V
∗i ) + V
∗i } ≥ 0; (5)
15For this maximization, we need to assume δ′′e (L) ≤ 0, p′′e (L) ≤ 0, and ce ≥ 0—with at least one strictinequality—so that the relevant second-order conditions hold.
10
in the case of no infringement, the inventor sues if and only if
max{V ∗i , λ(V ∗n − V ∗i ) + V ∗i } ≥ 0; (6)
We recall that NPEs are more effective at litigation than inventors are per unit effort (both
in terms of success probability and damages). Thus, examining (3), we see that V∗n ≤ V
∗i and
V ∗n ≤ V ∗i only when the inventor faces far lower costs of litigation effort than the NPE does
(i.e., unless the unit litigation effort cost of the inventor, wi, is much lower than that for the
NPE, wn). If anything, the opposite appears to be true in real markets (see, e.g., Ball and
Kesan (2009); Haber and Werfel (2016)): NPEs are sophisticated and specialized in litigation,
whereas individual inventors are under-resourced, and rarely skilled at litigation. Thus, (5)
and (6) suggest that V∗n ≥ V
∗i and V ∗n ≥ V ∗i , and when inventors choose to sue, they will
typically work through NPEs. Moreover, as inventors are often unable to bring lawsuits on
their own (due to capability or resource constraints; again, see Ball and Kesan (2009) and
Haber and Werfel (2016)), their bargaining power with individual NPEs (embodied in λ)
may be low.16
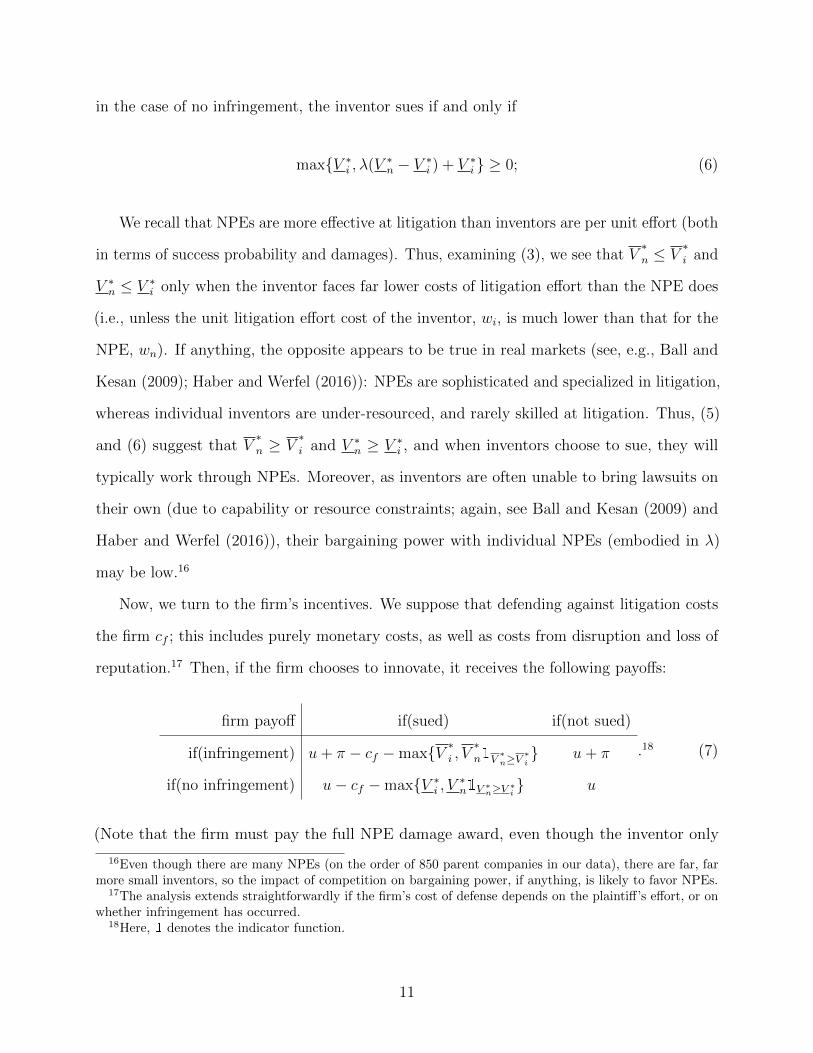
Now, we turn to the firm’s incentives. We suppose that defending against litigation costs
the firm cf ; this includes purely monetary costs, as well as costs from disruption and loss of
reputation.17 Then, if the firm chooses to innovate, it receives the following payoffs:
firm payoff if(sued) if(not sued)
if(infringement) u+ π − cf −max{V ∗i , V∗n1V
∗n≥V
∗i} u+ π
if(no infringement) u− cf −max{V ∗i , V ∗n1V ∗n≥V ∗
i} u
.18 (7)
(Note that the firm must pay the full NPE damage award, even though the inventor only
16Even though there are many NPEs (on the order of 850 parent companies in our data), there are far, farmore small inventors, so the impact of competition on bargaining power, if anything, is likely to favor NPEs.
17The analysis extends straightforwardly if the firm’s cost of defense depends on the plaintiff’s effort, or onwhether infringement has occurred.
18Here, 1 denotes the indicator function.
11
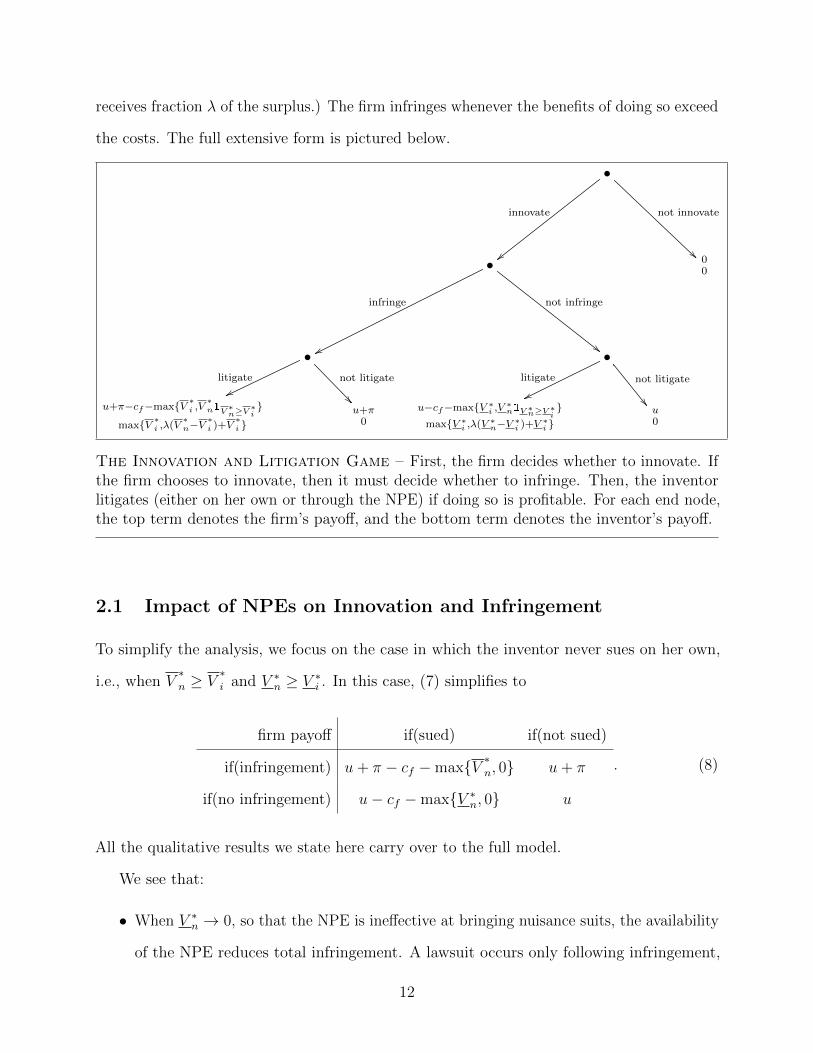
receives fraction λ of the surplus.) The firm infringes whenever the benefits of doing so exceed
the costs. The full extensive form is pictured below.
•
innovate
||
not innovate
•
infringe
ww
not infringe
""
00
•litigate
wwnot litigate
��
•litigate
wwnot litigate
��u+π−cf−max{V ∗i ,V
∗n1V
∗n≥V
∗i}
max{V ∗i ,λ(V
∗n−V
∗i )+V
∗i }
u+π0
u−cf−max{V ∗i ,V
∗n1V ∗
n≥V ∗i}
max{V ∗i ,λ(V
∗n−V ∗
i )+V∗i }
u0
The Innovation and Litigation Game – First, the firm decides whether to innovate. Ifthe firm chooses to innovate, then it must decide whether to infringe. Then, the inventorlitigates (either on her own or through the NPE) if doing so is profitable. For each end node,the top term denotes the firm’s payoff, and the bottom term denotes the inventor’s payoff.
2.1 Impact of NPEs on Innovation and Infringement
To simplify the analysis, we focus on the case in which the inventor never sues on her own,
i.e., when V∗n ≥ V
∗i and V ∗n ≥ V ∗i . In this case, (7) simplifies to
firm payoff if(sued) if(not sued)
if(infringement) u+ π − cf −max{V ∗n, 0} u+ π
if(no infringement) u− cf −max{V ∗n, 0} u
. (8)
All the qualitative results we state here carry over to the full model.
We see that:
• When V ∗n → 0, so that the NPE is ineffective at bringing nuisance suits, the availability
of the NPE reduces total infringement. A lawsuit occurs only following infringement,
12
and the firm infringes if and only if
u+ π > cf + V∗n. (9)
Importantly, as V ∗n → 0, infringement is strictly lower than if the NPE were absent,
as (9) is tighter than u + π > cf + V∗i , which is the condition that would determine
infringement absent the NPE.
• However, as the NPE becomes better at bringing nuisance suits, that is, as V ∗n → V∗n,
lawsuits occur whenever the firm innovates (so long as suits are ever profitable),
irrespective of whether the firm infringes. In that case, all innovating firms will
infringe—even if the benefits of infringement are small.
• Moreover, as V ∗n → V∗n, if either the defense costs cf or the payment V
∗n are sufficiently
large, then we have
u+ π − cf − V∗n < 0,
so that the firm will choose not to innovate. Consequently, when V∗n is high enough
and V ∗n → V∗n, the firm always chooses not to innovate even if, absent the NPE, the
firm would choose to innovate without infringing.
Specifically, the firm chooses not to innovate when u+π−cf−V∗n < 0. If u+π−cf−V
∗i <
u, then the firm would innovate without infringing if there were no chance of nuisance suit.
Thus, if V ∗n is sufficiently high and the benefits of infringement are low (π < cf + V∗i ),
the presence of the NPE results in mid-value range innovations (those having values
u < cf + V∗i − π) being crowded out of the market.
2.2 Impact of NPEs on IP Licensing
Next, we suppose that the firm uses the inventor’s invention (for return π) if it innovates,
but the inventor and firm can agree to license terms ex ante in exchange for committing not
13
to litigate.
If the firm innovates and infringes, then the inventor stands to earn
max{V ∗i , λ(V∗n − V
∗i ) + V
∗i , 0}
through litigation (recall (5)). Thus, if the firm has all the bargaining power, then it can
license the invention for
max{V ∗i , λ(V∗n − V
∗i ) + V
∗i , 0}.19 (10)
Examining (10), we see that the NPE only improves the terms of licensing for the inventor
when V∗n > V
∗i , that is, when the inventor would prefer to sue through the NPE instead
of litigating on her own. But then the value of the license to the inventor is mediated by
the rate at which the NPE passes surplus through to the inventor. No inventor gains more
through licensing than she would earn through bringing suit (although licensing is more
efficient because it saves court costs). In particular, if λ is small, then the availability of the
NPE has little impact on the inventor’s licensing revenues.
2.3 Welfare Impact of NPEs
Our model illustrates that the welfare impact of NPEs is ambiguous. When NPEs are more
effective at bringing lawsuits than individual inventors are, the threat of NPE litigation can
reduce infringement and promote a transfer to inventors when infringement occurs. However,
the value of NPEs to inventors is mediated by the fraction λ of the surplus that NPEs pass
through. NPE-backed lawsuits may help inventors extract licensing fees from firms, but again
this effect is mediated by λ; if λ is small, then the inventor cannot extract a significantly
higher licensing fee than he would obtain absent the NPE.
19If the firm splits fraction α of the surplus with the inventor, then (10) is increased by an additionalterm α(cf + π)—but this term is independent of whether the NPE is available, so our qualitative results areunhanged. (The presence of the NPE would not affect α, as the full effect of the NPE on the firm’s payoff isalready internalized in the maximization term of (5).)
14
Meanwhile, if NPEs become effective at bringing nuisance lawsuits, then in equilibrium
NPEs bring lawsuits even absent infringement. Somewhat paradoxically, this leads innovating
firms to infringe more, as they know that avoiding infringement will not deter suit.20 Addi-
tionally, the cost of nuisance lawsuits inefficiently crowds out welfare-increasing innovation
by some firms that, absent NPEs, would prefer to innovate without infringing.
Our results here shed new light on the impacts of “patent reform” legislation targeted at
reducing low-quality NPE lawsuits. Reigning in frivolous lawsuits could both reduce crowd-
out of innovative firms and (again, almost paradoxically) reduce infringement.21 Meanwhile,
reducing NPE litigation would only significantly affect the licensing revenues and innovation
incentives of those inventors who are receiving a very large share of NPE revenues.22
In the sequel, we assess the extent to which NPE litigation appears to be opportunistic.
We cannot measure the quality of all NPE lawsuits directly, as most never even make it
to pre-trial discovery.23 Hence, we look to see whether NPE lawsuits exhibit patterns that
suggest potential opportunism, such as indiscriminate cash-targeting, forum shopping, or
assertion of low-quality patents. Then, to get a small look at the inventor side of the equation,
we review the evidence on pass-through of NPE proceeds to end inventors, and assess the
extent to which NPE litigation appears to have increased small inventor innovation.
20This finding echoes the classical insight of Polinsky and Shavell (1989) that when court error is possible,if plaintiffs’ costs are low (or if the gains from suit are sufficiently high), then potential defendants will chooseto disobey the law, as they will be sued irrespective of whether they obey the law.
21While concerns about crowd-out are frequently cited as a reason for reducing NPE litigation, to ourknowledge, the observation that patent reform could in principle reduce infringement is novel to the presentwork.
22There is not much evidence on the degree to which NPE proceeds are passed back to end inventors, butall available estimates suggest that the pass-through is small (see Bessen et al. (2011); Bessen and Meurer(2014)).
23Although in practice, the NPE lawsuits that do reach court decisions appear to be lower-quality, onaverage, than the PE lawsuits that reach court decisions (see Allison et al. (forthcoming)).
15
3 Data
We obtain information on NPEs from RPX Corporation, a company that tabulates information
on NPE behavior, including data on patent litigation.24 RPX Corporation has collected data
going back to 1977, capturing from Public Access to Court Electronic Records (PACER)
every lawsuit filed by more than 4000 NPEs (approximately 850 parent companies, and 3300
affiliates); the data is thus systematic, and not based on self-reporting.25,26 We replicate all
of our analysis—and find nearly identical results in magnitude and significance—using the
hand-coded, publicly available NPE activity data collected by Cotropia et al. (2014) for the
years 2010 and 2012 (see Section 4.9.1 and Appendix Table A4).
Demand letters and other informal patent assertions by NPEs do occur. Informal patent
assertions are unreported by nature, so there is unfortunately no comprehensive dataset of
these actions. However, it is widely believed that informal patent assertions have been in
decline recently, and are projected to decline further. The two biggest factors driving this
decline are the decreasing credibility of patent assertions (given the availability of the formal
legal channel),27 and the rise of legislation (both state and federal) to hold entities liable
for unsubstantiated demand letters.28 Furthermore, as many more NPEs are now suing (see
Table I, Panel B), non-legally binding letters simply alleging infringement (and asking for
money) are becoming less credible signals. The equilibrium result is that the economically
large alleged IP infringements appear to be addressed through lawsuits (all of which are in our
data), and this is becoming increasingly true over time. We thus feel that RPX Corporation’s
systematic and exhaustive collection of NPE lawsuit data likely captures the economically
24RPX Corporation defines an NPE as “A firm that derives the majority of its revenue from licensing andenforcement of patents.” Under this definition, traditional legal entities established to license and enforcepatents comprise the majority of NPEs. Additionally, individual inventors may be counted, while universitieswill not be counted (unless they have patent enforcement subsidiaries).
25Chien (2013b) compared a subsample of about 1000 of RPX’s codings to her own hand-codings, findingno more than 7% disagreement.
26RPX Corporation cleans its raw filing data (for instance, removing some “administrative duplicates”representing the same case, but transferred across districts).
27One company executive relayed to us his reply to NPEs that send demand letters: “If you have a trulyviable case you will sue; otherwise don’t waste my time with this letter(!).”
28See, e.g., the Executive Office of the President (2013) report on “Patent Assertion and U.S. Innovation.”
16
important (and increasingly dominant) component of NPE behavior, even though it does not
fully capture patent assertions not backed by litigation (see also Feldman and Lemley (2015)
for supporting survey evidence). In Table I (Panel A), we present summary statistics on the
firms included in our analysis.29
According to RPX Corporation, roughly 69% of NPEs’ patents were acquired externally
(purchased) by NPEs and their subsidiaries, whereas 19% were originally assigned to NPEs.30
Panel B of Table I shows the time-series of NPE litigation data through our sample period,
2005–2015. The data clearly indicates that there has been a sharp rise in NPE lawsuits over
the past decade.
In total, the data provide detailed information on 21300 litigation actions by NPEs (i.e.,
where an NPE is the plaintiff) and 19621 litigation actions by PEs. RPX’s definition of
an NPE includes the following organizational forms: (1) patent asserters, entities that earn
revenue predominantly through asserting patents, (2) small inventors, (3) non-competing
entities (NCEs), operating companies asserting patents outside their areas of products or
services, and (4) universities (and research institutions). In our study, we exclude NCEs
and universities, which make up less than 3% of the sample. In the last column of Panel
B of Table I, as a further data check, we compare RPX’s data on NPEs to that of another
frequently used independent data provider, Lex Machina. A comparison of cases in the
RPX and Lex Machina datasets indicates that there is little difference between the two data
sources, with the correlation between RPX and Lex Machina annual data series in the final
two columns of Panel B of Table I being 99.95%.
We focus on the cases in which the defendant firm is publicly traded, as for these defendants
we can obtain rich, detailed characteristic data for which reporting is required by the Securities
and Exchange Commission (SEC). In Figure 1, we graph the number of NPE and PE case
dockets in which the at least one of the defendants is a public firm. By 2015, 11.25% of
all publicly traded firms were sued by an NPE. This rise in IP litigation is also depicted in
29Appendix Table A1 presents detailed descriptions of the specific data fields used in our study.30The remaining 12% are a blend of originally assigned and acquired patents.
17
Figure 1, which first shows the total rise in patent litigation over our sample period, and
then separates the rise into the cases brought by NPEs and the cases brought by PEs. From
Figure 1, it is apparent that the rise in overall IP litigation is entirely driven by NPE lawsuits.
PEs’ patent litigation has remained constant over the sample period. We revisit and examine
more systematically the differences between NPEs’ and PEs’ patent litigation behaviors in
Section 4.2.
We obtain firm-level patent information from the database used by Kogan et al. (2012).31
This database contains utility patents issued by the USPTO between January 1, 1926 and
November 2, 2010, along with citation data on those patents.32 We obtain information
on the in-house legal counsels and law firm associations of public firms from ALM Legal
Intelligence, which searches public records to find outside counsel used by companies for
corporate, contract, labor, tort, and IP litigation.
To identify involvement in litigation events not related to IP, we use the Audit Analytics
Litigation database, which covers the period from 2005 to 2013 and reports information on
litigation for Russell 1000 firms from legal disclosures filed with the SEC. Audit Analytics
collects details related to specific litigation, including the original dates of filing and locations
of litigation; information on plaintiffs, defendants, and judges; and, if available, the original
claim amounts and the settlement amounts.
31We thank Leonid Kogan, Amit Seru, Noah Stoffman, and Dimitris Papanikolaou for providing bothpatent and citation data.
32The USPTO defines utility patents as patents issued for the invention of new and useful processes,machines, manufactures, or compositions of matter, or new and useful improvements thereof. A utility patentgenerally permits its owner to exclude others from making, using, or selling the patented invention for aperiod of up to twenty years from the date of patent application filing. Approximately 90% of the patentdocuments issued by the USPTO in recent years have been utility patents.
18
4 Results
4.1 Cash-Targeting
We begin by examining the determinants of NPE litigation behavior. As a start, we param-
eterize a central concern of opponents to NPEs; namely, that NPEs bring nuisance suits,
and that their prime driver is the ability of targeted firms to pay large damages or royalties.
We use both levels of cash balances on the balance sheet (CashLevel) and changes in cash
holdings (CashShock) as proxies for the potential proceeds of a suit. We include several firm-
and time-level control variables, such as the firm’s market value, book-to-market ratio,33 the
prior year’s stock market performance, and the number of recent patents issued to the firm,
R&D , along with time and firm fixed effects. In Table II, we report OLS regression results of
the following specification:
SuedByNPE = f(CashLevel ,TotalAssets ,MVE ,BM ,R&D ,PastReturn,PatentStock ,CashShock).
The outcome variable, SuedByNPE , is a dummy equal to 1 if the firm was litigated by an NPE
in a particular year. CashLevel is the total amount of cash reported on the balance sheet as
of the beginning of the previous fiscal year. CashShock is a dummy variable equal to 1 if the
change in cash in the past current fiscal year, compared to the previous fiscal year’s cash level,
is among the top 95% of cash changes in the firm’s industry cross-section. We include industry
or firm fixed effects to capture unobserved industry- or firm-level time-invariant factors that
are correlated with NPE targeting. Likewise, we include time fixed effects to control for
variation in litigation activity specific to a given year and for any time trends in litigation
propensity. We report various specifications to show the incremental value of each covariate
on overall model fit. Column 4 of Table II represents our preferred specification, which
includes firm-level characteristics (market value, book-to-market ratio, asset size, research
and development expense, prior stock performance of equity), time and firm fixed effects,
33We use Tobin’s Q to proxy for investment opportunities.
19
and our cash variables. We use a log transformation of all variables to minimize the effect of
outliers.34 We cluster our standard errors at the firm level in order to broadly allow for any
time-series dependency in the probability of being sued over the course of the sample period.
Table II uncovers a strong and consistent pattern: Firms with larger cash balances and
firms with positive shocks to their cash holdings are more likely to be targeted by NPEs.
Controlling for other determinants and for firm and time fixed effects, the CashLevel coefficient
in Column 4, is 0.0565 (t = 4.25), is large and significant, as is the CashShock coefficient,
0.0167 (t = 2.06). To get an idea of the magnitudes, we use the coefficient estimates in the
full specification in Column 4. With the average firm-level cash holding of $579 million, the
0.0565 coefficient on CashLevel implies that a one standard-deviation increase in cash balance
increases the chances of being sued by 7.40%. Given that the unconditional probability of
being sued for patent infringement is approximately 8.60%, this is nearly a twofold higher
probability of being targeted (16.00% vs. 8.60%). This estimate shows the large economic
impact of cash on NPE targeting.
In sum, Table II reveals the strong impact of cash on NPEs’ targeting decisions. In
particular, in Column 4, both of these effects are estimated including firm and time fixed
effects, along with fine controls for firm size, past returns, R&D spending, and patent portfolio
size. Thus, the large coefficients can be interpreted as showing that a firm is likely to be
targeted by NPEs when it has an abnormally high cash level (or a shock to that cash level)
relative to all other firms’ cash levels (and shocks).
We have run a number of robustness checks exploring the relationship between cash
and NPE litigation. First, in Panel B of Table VIII, we consider specifications identical to
those of Table II, but using logit and probit estimation as opposed to OLS. The coefficients
on cash remain large and significant, with the implied magnitudes even slightly larger in
point estimate. Furthermore, we replace the dummy dependent variable SuedByNPE with
its continuous counterpart TimesSued , measuring the number of times a given firm is sued
34Neither the magnitudes nor the significance levels of our coefficients change appreciably when we do notuse the log transformation.
20
by NPEs in any given year. We estimate the model in OLS (and Tobit) in the table,
and find that both CashLevel and CashShock are large and significant predictors of the
intensity with which firms are sued by NPEs. Next, in Appendix Table A3, we test for
any impact of multicollinearity on the estimates. From Appendix Table A3, we see that
multicollinearity is clearly not an issue. The coefficients on CashLevel and CashShock remain
large, significant, and—importantly—stable irrespective of the addition or deletion of any
given control variable.35 Lastly, we cluster standard errors by year (instead of by firm), and
estimate specifications with industry (as opposed to firm) fixed effects in Appendix Table A3.
Both of these adjustments have nearly no impact on the magnitude or significance on the
CashLevel and CashShock coefficients.
4.2 Patent Litigation Behavior of Practicing Entities (PEs) & Lit-
igation Behavior against Firms more Generally
A reasonable response to the results in Table II is to expect that cash-targeting should be
the behavior of any profit-maximizing litigant. It makes little sense to sue a firm—incurring
potentially sizable legal costs, along with the opportunity costs of foregone suits—if the target
firm has no ex ante ability to pay. However, as it turns out, cash targeting is not generally a
first-order determinant of litigation outside NPE IP lawsuits. To see this, we compare the
determinants of NPE IP litigation to those of PE IP litigation, and to the determinants of
litigation activity more broadly.
4.2.1 Patent Lawsuits Brought by PEs
NPEs do not have a monopoly on Intellectual Property litigation. PEs like Apple, General
Electric, and Intel also sue each other for patent infringement. If our results were simply
picking up general characteristics of IP litigation, then we might expect to see PEs behaving in
much the same way as NPEs. In order to compare PE and NPE behavior, we hand-collected
35The coefficients are essentially unchanged in magnitude and significance across specifications.
21
the universe of patent infringement cases brought by PEs against other PEs in the same
period. As we already observed in Figure 1, the rise in IP litigation is driven by NPEs. While
NPEs have an exponential-type rise in IP litigation over the sample period, PEs’ IP litigation
has remained essentially constant. Thus, in an aggregate time-series sense, we see a difference
between the litigation behavior of the two groups.
We run a more formal analysis of the determinants of PE lawsuits, using a set-up identical
to that used for NPEs in Section 4.1. We replicate the specifications used in Table II, but
this time we use SuedByPE as the dependent variable.36 The results of this analysis are
in Column 1 of Table III. We see that PEs behave very differently from NPEs. Nearly all
of the predictors of NPE litigation behavior have a small and insignificant impact on PE
litigation behavior. Moreover, the impact of cash goes mildly in the opposite direction (in
point estimate).
Of course PEs likely have motivations for IP litigation beyond those of NPEs (e.g.,
competitive responses, defensive tactics, retaliative litigation). However, this comparison does
suggest that the results on NPE litigation behavior do not simply reflect general characteristics
of IP litigation over time or within the cross-section. Rather, they are consistent with agent-
specific motivations for NPEs in targeting firms flush with cash.37
4.2.2 Other Litigation Behavior
We next move on to a more general setting, considering all lawsuits filed against publicly
traded firms. If the cash-targeting in NPE IP litigation is a general feature of litigation—as we
might think—then cash-targeting should show up in other litigation categories. From Audit
36SuedByPE is a dummy variable equal to 1 if a firm faces IP lawsuits from PEs in a given year.37The eBay Inc. v. MercExchange, L.L.C. supreme court case made it more difficult for NPEs to seek
injunctive relief in patent lawsuits, while leaving PEs’ injunctive relief options effectively unchanged. Atleast in theory, this could somehow contribute to the difference between PEs’ and NPEs’ targeting behaviors.(That said, given that NPEs do not produce commercial products—and thus are not in product-marketcompetition with their targets—it is unclear why NPEs would value injunctive relief other than for its abilityto pressure cash settlement.) We have re-done our analysis for the pre- and post-eBay samples, and findsimilar results in both, so it seems unlikely that the eBay-induced changes in injunctive relief opportunitiesare driving our findings.
22
Analytics, we collected the entire slate of material legal actions taken against publicly traded
firms. Audit Analytics covers the 2005–2013 period and reports information on litigation
against Russell 1000 firms, recording legal disclosures filed with the SEC.38
We run specifications identical to those of Table II, for all other litigation categories. The
results are shown in Table III. From Column 2 to 5 of Table III, we see that large amounts
of cash are not positively related to non-IP litigation actions (tort, contract, securities,
environment, and labor).
So what drives non-IP litigation? The results suggest that the main determinant of non-IP
cases is the infraction itself (e.g., polluting a local waterway in the case of an environmental
suit). Importantly, these other cases often have more concrete and provable actions taken
by the defendant, as opposed to IP infringement, in which the property right is itself more
amorphously defined (and so infringement is more subjectively determined). This extra scope
given in IP cases makes IP a potentially good candidate for opportunistic, purely profit-driven
legal activity.
The sum of the evidence in Tables II and III shows that NPE IP litigation is unique in its
cash-targeting nature, in comparison to other forms of litigation, and even within the fine
space of IP litigation. In the following sections we explore more closely the behavior of NPEs,
and examine whether NPE behavior appears to be—on average—opportunistic legal action.
4.3 Targeting Unrelated Profits
In this section we examine whether NPEs go after profits unrelated to alleged infringement.
Using finely reported business segment-level disclosures, we are able to extract and separate
profits in the business segments related to the alleged infringement from those profits in
unrelated segments.
As of 1976, all firms are required by Statement of Financial Accounting Standards (SFAS)
38Audit Analytics collects details related to specific litigation, including the original dates of filing andlocations of litigation; information on plaintiffs, defendants, and judges; and, if available, the original claimand final settlement amounts.
23
14 (Financial reporting for segments of a business enterprise, 1976) and SFAS 131 (Reporting
desegregated information about a business enterprise, 1998) to report financial information
for any industry segment that accounts for more than 10% of total annual sales. Using these
segment-level filings, we extract information on industry classification, sales, and cost of
goods sold for each segment of each conglomerate between 2005 and 2015. We then use the
concordance between international patent classification (IPC) codes and four-digit United
States Standard Industrial Classifications (SIC) to identify the conglomerates’ segments
associated with the NPE-litigated patents.39
After identifying segments related to allegedly infringed patents, we split each NPE-
targeted firm’s segments into related segments and unrelated segments. A firm’s related
segments are those segments that could potentially use the litigated patent in regular
operations; its unrelated segments are those that could not. We compute each segment
group’s gross profits by subtracting cost of goods sold from segment group sales.40
We note that not all conglomerates report segment-level information in the same format.
For example, a conglomerate may report information on one segment only, or it may report
cost of goods sold for only one of the segments in which it operates. Therefore, our final
sample contains only conglomerates for which we have both cost and revenue data on at least
one related segment and one unrelated segment.
We estimate a model to test whether the probability of being sued by an NPE is correlated
with profits obtained from unrelated segments, even after controlling for the profitability
of related segments. In this model, we include conglomerate fixed effects to control for
conglomerate-level unobserved litigation probability. We also control for industry-wide shocks
to profitability, by including a variable measuring the average profitability of the segment’s
industry.
39The concordance file we use was developed by Silverman (2003) and later improved by Kerr (2008). Thisconcordance has been used in several other studies, including those of McGahan and Silverman (2001) andMowery and Ziedonis (2001).
40While we would ideally prefer to measure cash at the segment level in order to make our segment-levelanalysis completely analogous to the tests in Tables II and III, segment-level cash variables are not reported.Thus, we use profitability (revenues net of costs) at the segment level to proxy for profitability of suit.
24
The results of our segment-level analysis are shown in Table IV. Column 1 of Table IV
shows the basic model, while Column 2 includes conglomerate fixed effects. Both columns tell
the same story. Consistent with the results in Table II, RelatedSegmentProfitability is a large
and significant predictor of NPE targeting. But so is UnrelatedSegmentProfitability . In other
words, NPEs seem not to care where their proceeds come from; an NPE’s probability of suing a
firm increases with the firm’s profits even if those profits are derived from segments unrelated
to the patent under litigation. In Column 2 of Table IV, we see that the coefficient on
UnrelatedSegmentProfitability , 0.0265 (t = 1.99), implies that, controlling for the profitability
of a segment related to the patent allegedly being infringed, a one standard-deviation increase
in a completely unrelated segment’s profitability increases the chance of being sued by 0.58%
(relative to a mean of 3.18%). This compares to an increase in probability of 0.71% for the
same size increase in a related segment’s profitability (t = 2.18). In contrast, when we run
the analogue of Column 1 and 2 for PE firms, we see that UnrelatedSegmentProfitability is
not related to PE litigation activity.
In sum, the results in Table IV provide additional, finely measured evidence that NPEs
behave opportunistically by targeting cash indiscriminately—NPEs target related cash and
unrelated cash at essentially the same rate.
4.4 Which NPEs are Driving Cash-Targeting? Patent Assertion
Entities vs. Small Inventors
NPEs take many organizational forms. We next explore whether the cash-targeting behavior
seen in Tables II and IV varies by NPE type. As mentioned in Section 3, we exclude
universities and NCEs from the sample. This leaves essentially two main categories of patent
asserters in our data: patent assertion entities (PAEs) and small inventors. In our sample,
87.98% of the 21,300 cases have a patent assertion entity as a plaintiff, while small inventors
25
bring 9.63% of cases.41 Detailed information on plaintiff types, as well as comparison to other
samples, is provided in Appendix Table A4.
In Table V, we decompose the results shown in Table II by NPE type. In Column 1 of
Table V, the regressand takes a value of 1 if the firm is sued by a patent assertion entity
(PAE). In Column 2, we reestimate the same specification with the regressand defined as 1
when a firm is sued by a small inventor.
From Table V, we see that the entire cash-targeting effect is driven by patent assertion
entities. Columns 1 of Table V show that in cases where a patent assertion entity is involved,
CashLevel and CashShock are large and significant predictors of litigation action. In contrast,
in cases involving small innovators, neither CashLevel nor CashShock are significant predictors
of targeting, and both have coefficients that are close to 0. Consequently, we see that patent
assertion entities are responsible for nearly the entire magnitude of the coefficients on both
cash variables shown in Table II.42
4.5 Comparing the Types of Patents Asserted by NPEs and PEs
Allison et al. (forthcoming) compared the NPE and PE lawsuits that reach decisions, finding
that NPEs are significantly more likely than PEs to have their patents invalidated
• through summary judgment,
• based on prior art, and
• for inadequate disclosure.43
41The remaining 2.38% of cases are not included in the analysis presented in this section, as those casescould not be clearly assigned to either group.
42We might worry about selection here—in principle, those lawsuits brought by small inventors could beprecisely the lawsuits that NPEs are unwilling to take because they are unlikely to yield large cash payoffs.However, if anything, given the significant costs and difficulties small inventors face when bringing lawsuitson their own (Ball and Kesan (2009); Haber and Werfel (2016)), it seems more likely that selection effects (ifany) would go in the opposite direction: All else equal, the lawsuits small inventors bring directly would bethe ones of higher direct return to the invetors; this matches up with what our model suggests (see Section 2).In any event, we have confirmed empirically that the characteristics of firms targeted by PAEs are similar tothose of firms targeted by small inventors.
43More generally, NPEs lose in court significantly more often than PEs do; however, all these results varysignificantly by technology, industry, court, and NPE entity type (see Allison et al. (forthcoming)).
26
Unfortunately, we cannot directly assess the validity of the full universe of patents that
NPEs (or PEs) assert, as validity determinations are not made for cases that are settled prior
to judgment.44 However, we can follow Allison et al. (forthcoming) in looking for systematic
differences between the patents NPEs and PEs assert, and attempting to understand how
those differences relate to patent quality.45
There are many ways to parametrize patent similarity; we use a number of different
metrics and measures of patent quality in comparing the patents asserted by NPEs to those
asserted by PEs. First, following Love (2014), we examine whether NPEs disproportionately
assert patents just before those patents’ expiration dates. We show the breakdown of patent
age between NPEs and PEs in Table VI. From this table, we first see that NPE-asserted
patents are significantly older than PE-asserted patents. From the first row of Table VI,
we see that NPEs assert patents that are 25% older than those PEs assert (t = 20.91);
since proximity to patent expiration should be orthogonal to patent quality, we take this as
indicating a quality difference between NPE and PE patent assertions.46
NPEs not only appear to be asserting patents closer to expiration than PEs, but relative
to PEs, NPEs are much more likely to sue many times on any given asserted patent. In the
second row of Table VI, for instance, we see that NPEs litigate each patent they assert 4.5
times as frequently as PEs do (13.02 times for NPEs vs. 2.84 times for PEs (t = 59.76)).
Using a recently assembled dataset which contains information on the number of issued,
pending, abandoned patents by NBER technology group for each month (Marco et al. (2015)),
we see that patents asserted in NPE cases are more likely to be issued at times when
44Risch (2015) followed the ten most-litigious NPEs over time, finding that many of their patents werenever tested on their merits.
45A number of other scholars have attempted to assess the quality of NPEs’ patents. An early literature(e.g., Shrestha (2010); Fischer and Henkel (2012); Risch (2012)) suggested that NPEs’ patents are equalin quality to PEs’ (or even higher-quality); however, that literature was based on extremely small, highlyselected samples (see Cohen et al. (2017)). More recent, large-sample evidence suggests, by contrast, thatNPEs in fact hold and assert seemingly low-quality patents (see, e.g., Miller (2013); Love (2014); Feng andJaravel (2015)).
46Plaintiffs might choose to litigate older patents rather than newer ones, as damages may be higher (ormore targets may be available) once there has been more time for ongoing infringement, or for technology tobuild upon the patented invention. However, if this were the only driving effect, then we would not see anydifference between the ages of patent asserted by NPEs and PEs.
27
the USPTO issues more patents compared to total pending and abandoned applications
(t = 13.74)—that is, at times when the USPTO is especially busy. Furthermore, and
consistent with NPEs asserting broad patents, we also find that patents asserted by NPEs
have a significantly higher number of associated technology classes.47
When we compare the linguistic content of the claims in patents asserted by NPEs and
PEs, we find striking differences. Consistent with the previous finding that NPE patents
are broader than PE patents, evidence suggests NPE patents contain significantly more
independent claims than PE patents do (4.86 vs. 3.80 (t = 21.11)) and more dependent claims
(29.98 vs. 21.19 (t = 22.92)). Moreover, the descriptions of patents asserted by NPEs contain
more words, both in dependent and independent claims, than are found in patents asserted by
PEs. For instance, an average patent asserted by NPEs contains 802 words in its independent
claims, whereas an average patent asserted by PE contains 531 words (with the difference of
271 words highly significant (t = 26.54). The same holds true for lengthier-worded dependent
claims, with a difference of 361 words (t = 26.54)—802 for NPEs vs. 531 for PEs.
Collectively, our results suggest NPEs assert patents that are significantly different from
those of PEs. In particular, NPEs assert patents that are broader in scope and wordier. In
addition, they assert these broader patents significantly more aggressively, and closer to the
expiration of patent rights.
4.6 Geography of NPE Litigation
Even if NPEs target lawsuits opportunistically, this need not show up in outcomes, as
courts remain the ultimate arbiters of patent infringement. Thus, for NPEs to target cash
successfully, they would—at minimum—need a credible threat of having courts rule in their
favor sufficiently often.
Figure 2 shows the geography of NPE patent litigation in the United States. Unsurprisingly,
some well-known innovation hubs (e.g., Silicon Valley) have large amounts of NPE IP litigation.
47Patents asserted by NPEs (resp. PEs) on average have 5.86 (resp. 4.83) associated technology classes(t = 21.50).
28
However, validating common anecdotal accounts, we see that the preponderance of NPE
patent litigation (43% of all cases) takes place in the Eastern District of Texas (Marshall,
TX). Eastern Texas is not a major innovation center; rather, its courts are favored by NPEs
because they are perceived to be plaintiff-friendly (both anecdotally and because of specific
rules regarding judgment (Leychkis (2007))).
The practice of “forum shopping” (i.e., “choosing the most favorable jurisdiction or court
in which a claim might be heard” (Garner and Black (2004))) is not unique to IP litigation.
However, again, even within the space of IP litigation, we see that NPEs seem to “forum
shop” a uniquely large amount. NPE cases and PE cases have very different geographic
patterns. As noted above, NPEs litigate 43% of their cases in the Eastern District of Texas,
while only 7% of PE cases are litigated there. When we run a Wilcoxon test comparing the
geographic distributions of NPE and PE litigation, we see a significant difference between
the two (z = 3.91, p < 0.001).48
4.7 Probability of Paying
In this section, we test whether proxies for firm’s readiness (and ability) to stave off NPE
litigation impact firms’ probabilities of being targeted. We create two measures: one measure
counting the number of lawyers firms have at their disposal, and the second counting how
busy firms are with non-IP litigation actions.
The idea of the first measure—number of lawyers—is that large legal teams may serve to
deter NPEs because they could to prolong the court (or settlement) process. The second
measure—how busy the firm is with outside litigation—is meant capture the within-firm
resource constraint on time and costs spent battling litigation. We expect that if NPEs
opportunistically target firms that are unlikely to be able to defend themselves, then (1)
having many lawyers should deter suits (so there should be a negative coefficient on the
number of lawyers), and (2) being involved in extraneous, non-IP cases should draw more
48Our findings here are corroborated by empirical evidence assembled by Allison et al. (forthcoming).
29
suits (so the associated coefficient should be positive).
In order to measure firms’ legal teams, we extract data from the ALM Legal Intelligence
Database. We obtain a list of all law firms and their clients from ALM Legal Intelligence
between 2005 and 2012. Then, we follow the procedure outlined in Appendix Table 2 to
define a dummy variable IPLegalTeamSize which takes a value of 1 if the firm employs more
IP focused law firms than a comparable firm with similar characteristics. Our second measure,
OngoingCases, measures the existence and number of reported, ongoing non-IP-related
litigation actions. From Table VII, we see that controlling for all other characteristics, NPEs
are less likely to sue a firm with more legal representation. The coefficient on IPLegalTeamSize
in Column 1 implies that a one standard deviation increase in IP legal team size decreases
the likelihood of suit by 7.2% (t = 2.13). NPEs are also more likely to target firms that are
busy with ongoing, non-IP litigation. The Column 2 coefficient on OngoingCases of 0.0171
(t = 2.38) implies that firms that are occupied with large number of non-IP litigation cases
are 19% more likely to be targeted by NPEs.
The empirical specification considered in this section also provides evidence against a
precautionary savings interpretation of the cash-targeting results shown in Table II. If pre-
cautionary savings were driving the relationship seen in Table II, then we would expect the
coefficient on LegalTeamSize to be positive—firms saving cash to stave off infringement litiga-
tion should also be growing their legal teams(!). (At the very least, under the precautionary
savings hypothesis, we would not expect the negative and significant relationship observed in
the data.) To believe the precautionary savings hypothesis, we would need to believe that
firms are raising cash to preempt litigation at the same time as they are actively decreasing
their legal representation; this seems unlikely. Instead, the findings as a whole appear more
consistent with NPEs acting opportunistically—targeting cash-rich firms that are more likely
to settle, either because they have recently reduced their legal teams or because they are
embroiled in outside litigation.
30
4.8 Sum of Evidence
In summary, our empirical evidence shows that:
1. NPEs specifically target litigation against firms that are flush with cash.
2. Cash-targeting appears to be unique to NPE IP litigation.
• Cash is neither a significant positive predictor of PE IP lawsuit targeting, nor of
non-IP lawsuit targeting (rather, these other classes of lawsuits appear to have
most of the R2 driven by infractions themselves).
• More generally, NPE behavior is different from PE behavior even conditioning on
the same type of infraction (alleged IP infringement).
3. NPEs target cash unrelated to the alleged infringement with essentially the same
frequency that they target cash related to the alleged infringement.
4. The cash-targeting behavior we observe is driven by large aggregator NPEs, and is not
the behavior of small innovators.
5. The patents NPEs assert are seemingly different in quality from those asserted by
PEs (in particular, on average NPEs assert patents that broader and closer to expiry).
Moreover, NPEs assert patents more aggressively than PEs do.
6. NPEs appear to forum shop, trying the preponderance of their cases in a single district
in Texas.
7. NPEs target firms that may have reduced ability to defend themselves against litigation.
While none of our results alone proves opportunistic legal behavior (patent trolling) on
the part of NPEs, the mass of the evidence to this point appears most consistent with NPEs
behaving as patent trolls.
31
In line with our evidence, there have been increasingly frequent high-profile anecdotal
accounts of trolling by NPEs (nearly always litigated in Marshall, Texas). For instance,
Lumen View Technology LLC sued numerous online dating companies for alleged infringement
on a patent on computerized matchmaking that United States District Judge Denise Cote
later pronounced to be obviously invalid. “There is no inventive idea here,” Judge Cote
declared, pointing out that “matchmaking” is literally ancient (Mullin (November 23, 2013)).
Meanwhile, MPHJ Technology Investments sued over sixteen thousand small businesses
(along with a number of branches of the United States Government) alleging infringement
on a patent covering “scan-to-email” functionality. Many of MPHJ’s cases were not only
dismissed, but prompted countersuits for deceptive practices (Mullin (January 14, 2014)).
We conduct several robustness checks on our analysis in Section 4.9, and then assess the
impact of NPEs on real outcomes in Section 5. We tie back to the theory and discuss welfare
implications in Section 6.
4.9 Robustness Tests
In this section, we provide a number of robustness tests, including an out-of-sample test and
a number of additional specifications.
4.9.1 Out-of-Sample Test
As mentioned in Section 3, the analyses discussed in the text use data from RPX Corporation,
a company that tabulates information on NPE behavior. While the data is all sourced
from public documents (namely the USPTO and public court records), RPX retains the
dataset itself as proprietary. Cotropia et al. (2014) recently hand-coded and classified NPE
IP litigation events for a two-year sample (2010 and 2012), and made this data publicly
available at www.npedata.com.
We have re-run all of our analyses on the Cotropia et al. (2014) data; the results of this
out-of-sample test are shown in Appendix Table A4. We find the same results using the
32
Cotropia et al. (2014) data as with the RPX data: cash is a large and significant predictor of
NPE targeting, and this behavior is driven by PAEs.49
4.9.2 Thicket Industries and Additional Specifications
Patent thickets are dense, overlapping webs of patents that make it difficult to commercialize
because products may overlap with large numbers of patented technologies. Certain industries
are known to be more prone to patent thickets, and those industries themselves have been
linked to strategic patenting behavior (Bessen and Meurer (2013)). We test whether the cash-
targeting behavior of NPEs differs between thicket- and non-thicket industries.50 Columns 1-2
of Table VIII, Panel A show the results.
Column 3 runs the same analysis excluding IT firms (SIC Code 35 (e.g., Apple and IBM)
and SIC Code 73 (e.g., Yahoo! and Ebay)); again, cash a strong determinant of targeting,
nearly identical in magnitude and significance. Column 4 uses a cash measure that incorporates
marketable securities of the firm. The economic magnitude implied by the coefficient of
CashLevel in this specification is similar to our baseline specification. Column 5 allows
additional non-linearities in cash (cash level squared and cubed); neither loads significantly,
and allowing non-linearity does not appear to have a impact on the estimated magnitude
or significance of the CashLevel and CashShock coefficients. In this specification, we also
include a new variable (FinancialConstraints) that measures how financially constrained
firms are, and find that it is not a statistically significant predictor of NPE targeting.51
Panel B of Table VIII shows a number of additional specifications. First, throughout the
paper we have used whether or not a firm is sued by an NPE in a given year (SuedByNPE ).
49The estimated magnitudes on cash are actually a bit larger in the Cotropia et al. (2014) sub-sample (giventhe larger standard deviation of cash in later 2010-2012 period), with the coefficient on large aggregatorsbeing roughly triple the size of small innovators, and statistically significantly larger. We also calculate theoverlap rate between the RPX and Cotropia et al. (2014) samples for the two years available (2010 and 2012)and find a roughly 90% overlap.
50We define thicket industries as those having two-digit SIC codes of 35, 36, 38 and 73, following Bessenand Meurer (2014). These industries encompass software, semiconductors, and electronics, and include firmssuch as Apple, Google, and Intel.
51Here, we use the Hadlock and Pierce (2010) financial constraints index of firms’ constraints on accessingthe external funds.
33
However, a number of firms are sued multiple times by different (or even the same) NPEs
within a single year. In Table VIII, Panel B we replace the dependent variable with the
the number of times a firm is sued by an NPE in a given year. We find similar results to
those presented in Table II: CashLevel and CashShock are large and significant predictors of
the number of times a firm is sued in a given year (both in OLS and Tobit specifications).
For instance, Column 1 of Table VIII, Panel B shows a coefficient on CashLevel of 0.4439
(t = 2.71), implying that a one standard-deviation increase in cash doubles the number of
times a firm is targeted by NPEs. Additionally, Columns 3 and 4 of Table VIII, Panel B show
the base categorical variable specification of the dependent variable (SuedByNPE ), but in
Probit and Logit regression estimations. Again cash remains a large and significant predictor
of NPE targeting behavior.
5 Impact of NPE Litigation on Real Outcomes
Up to this point, we have examined which firms NPEs target, and when. We now examine
the real impacts of NPE litigation on the firms being targeted. Of course the difficulty in
obtaining any causal estimates here is that we have a clear selection problem (that is, it
might be the case that the firms that NPEs target experience some outcome not because
of NPE litigation, but because they share some common unobservable characteristic). We
attempt to alleviate selection concerns somewhat by conditioning on being targeted—we
compare two groups of firms, both selected to be sued by NPEs. Specifically, we compare all
firms targeted by NPEs, separating targeted firms specifically according to whether (1) they
were forced to pay out to NPEs (they either lost in court or settled) or (2) the cases against
them were dismissed (including when the court ruled against the NPE).52,53,54
52We find analogous results if we exclude Settlements from the analysis.53Following Allison et al. (2010), we exclude case outcomes such as “stay,” “transfer,” and “procedural
disposition.”54Some firms settle for de minimus amounts (e.g., for tax purposes), so our Settled + Won by NPE
category may include some targeted firms that did not really lose much money to NPEs in practice. However,including too many firms in the Settled + Won by NPE category would bias against our result, leading us to
34
We test whether losing to an NPE and having an NPE lawsuit dismissed lead in dif-
ferent directions in terms of future R&D productivity. Specifically, we focus on how R&D
expenditures on projects differ (pre- and post-litigation) among the two classes of targeted
firms.
Table IX reports the difference-in-differences results. From Panel A of Table IX, we see
that losing to an NPE has a large and negative impact on future R&D activities—again, even
conditioning on being selected for litigation. We compare average annual R&D expense two
years following the litigation to average annual R&D expense two years before the litigation.
To get an idea of the effect magnitude, the results shown in Panel A imply that firms that
lose to a large aggregator NPE (Settled + Won by NPE) invest significantly less in R&D
in the years following the loss ($163 million less, t = 7.18) relative to firms that were also
targeted by NPEs but won (Dismissed + Lost by NPE).
Panel A also shows that we see no such patterns for PE vs. PE cases—unlike firms that
lose to NPEs, firms that lose to PEs show no reduction in R&D investment.55 Panel B of
Table IX runs parallel trends analysis, showing that the firms in our comparison groups had
similarly-moving R&D expenditures prior to the NPE lawsuits.
Lastly, Panel C of Table IX shows an analysis of the same firms pre- and post-difference-
in-differences analysis, but in a regression framework where more firm-level determinants of
R&D can be included. From Panel C, we see that losing to a large aggregator NPE (again,
selecting on being targeted) leads to 1.73% reduction in future R&D expense (scaled by
assets).56 Considering the mean of dependent variable is 8.7%, this magnitude is economically
large and statistically significant, representing a roughly 20% reduction (t = 2.43) in R&D
underestimate the costs of losing to NPEs. Similarly, our Dismissed + Lost by NPE category may includesome firms that make confidential settlements, but this would again bias against our findings.
55We are unsure why PE litigation does not appear to cause a reduction in R&D investment—it hasbeen suggested to us that this effect has something to do with the presence of PE vs. PE product marketcompetition, but we are not certain what the mechanism would be. (Indeed, we might have supposed thatthe relatively higher availability of injunctive relief in PE vs. PE lawsuits would lead to more significant R&Dreduction than in NPE vs. PE lawsuits.)
56In these tests we control for CitationCommonality , a pairwise patent similarity measure provided to usby Ambercite (see Appendix Table A1).
35
investment. Again, from Column 3 of Table IX, Panel C, we see that there is no resultant
reduction in R&D expenditure following losses in PE vs. PE cases.
In all, the evidence in this section strongly supports the idea that NPEs have a real and
negative impact on innovation of United States firms, and that within the IP space—like the
cash-targeting behavior we have observed—the negative impact on R&D is unique to NPE
lawsuits.
6 Discussion
Our results show that NPEs on average sue firms that have substantial cash holdings. While
we cannot observe directly whether infringement has occurred in a given case, our results
suggest that cash—rather than policing infringement—drives NPE targeting. Cash is a
first-order determinant of NPE IP litigation even when that cash is unrelated to the alleged
infringement, and even though cash is neither a key driver of PE patent lawsuits nor of
non-IP litigation. Meanwhile, NPEs appear to bring lower-quality lawsuits, and there is
evidence that NPEs are actively forum shopping.
NPE litigation has a real negative impact on innovation at targeted firms: PEs substan-
tively reduce their innovative activity after settling with NPEs (or losing to them in court).
Measuring NPEs’ net impact on innovation, however, requires accounting for the potential of
NPE litigation to positively incentivize innovation by individual inventors. Unfortunately,
because most settlement values are not disclosed, we cannot measure the full size of the
transfer from PEs to NPEs (much less the transfer from NPEs to end inventors). Furthermore,
we cannot measure the increase in innovation incentives that might come from PEs being less
likely to infringe (given NPE behavior). Thus, we cannot explicitly measure the potential
welfare gains from NPE litigation. Nevertheless, we note that as our theoretical model
suggests, the benefits of NPEs in terms of increased innovation incentives for end inventors
(both the direct benefits through lawsuits, and the indirect benefits in terms of enhanced
36
licensing potential) depend on the fraction of NPE profits passed through to end inventors.
There are three pieces of empirical evidence that speak to the impact of NPEs on inventors’
innovation incentives. First, Bessen et al. (2011) directly estimate the pass-through parameter
that our theory highlights as the key mediator of NPEs’ benefits for end inventors. Bessen
et al. (2011) find very low pass-through, estimating that only five cents of every dollar in
damages paid by PEs to NPEs makes it back to end innovators. Thus, one would need to
believe in a large multiplier (summing both direct and indirect spillover effects) to justify,
from a social-welfare perspective, NPE litigation practices as an efficient mechanism to
transfer the marginal dollar of innovative capital—even if all NPE lawsuits were well-founded.
Second, Feldman and Lemley (2015) find evidence that patent licensing does little or nothing
to increase innovation—irrespective of whether NPEs or PEs are the licensors. Lastly, we
conduct a simple empirical analysis, presented in Table X, in which we measure changes in
innovation outcomes in the exact technology areas in which NPE litigation is most frequent.
In NPE-heavy areas, both the direct and indirect (incentive) benefits of NPE litigation should
be largest, but Table X shows that there has been no observable increase in innovation by
small innovators.57
The marginal welfare impact of NPEs is also largely determined by the frequency with
which NPEs successfully bring “nuisance” cases instead of meritorious ones. As our model
suggests, NPE nuisance suits stand to crowd out socially valuable innovation (and possibly
to induce socially inefficient infringement), without any measurable social gains.58
57Even if small inventors primarily benefit from NPEs via improved licensing opportunities, we would expectthis to improve inventors’ innovation incentives—and thus lead to an increase in small inventor innovation.As we see no impact of NPE litigation on small inventor innovation, we infer that the licensing pathway isnot providing significant new innovation incentives to small inventors.
58In a companion policy piece, we propose a framework for advance screening aimed at abating patenttrolling—particularly nuisance suits—while encouraging well-grounded lawsuits (Cohen et al. (2016)).
37
7 Conclusion
We provide the first large-sample evidence on the behavior and impact of NPEs. Our
theoretical model illustrates that while NPE litigation can reduce infringement and support
small inventors, as NPEs become effective at bringing opportunistic lawsuits, they can
inefficiently crowd out firms that would otherwise produce welfare-enhancing innovations
without engaging in infringement. Our complementary empirical analysis shows that on
average, NPEs appear to behave as opportunistic patent trolls. They sue cash-rich firms—a
one standard deviation increase in cash holdings doubles a firm’s chance of being targeted
by NPE litigation. By contrast, cash is neither a key driver of IP lawsuits by PEs, nor
of any other type of litigation against firms. The cash-targeting behavior we observe is
driven by large aggregator NPEs, and is not the behavior of small innovators. NPEs even
target conglomerate firms that earn their cash from segments having nothing to do with their
allegedly infringing patents (profitability in unrelated businesses is nearly as predictive of NPE
lawsuits as is profitability in business segments related to NPE-alleged patent infringement).
We find further suggestive evidence of NPE opportunism, such as forum shopping, litigation
of lower quality patents, as well as targeting of firms that may have reduced ability to defend
themselves against litigation. We find moreover that this NPE litigation has a real negative
impact on innovation at targeted firms: firms substantively reduce their innovative activity
after settling with NPEs (or losing to them in court). Meanwhile, we neither find any markers
of significant NPE pass-through to end innovators, nor of a positive impact of NPEs on
innovation in the industries in which they are most prevalent.
Setting intellectual property policy regarding patent assertion is first-order. If widespread
opportunistic patent litigation makes the United States a less desirable place to innovate, then
innovation and human capital—and the returns to that innovation and human capital—will
respond accordingly. That said, innovators will also leave if they feel they are not are protected
from large, well-funded interests that might infringe on innovative capital without recompense.
Our results provide evidence that NPEs—in particular, large patent aggregators—on average
38
do not appear to protect innovation. Rather, our results are consistent with NPEs, on average,
behaving as patent trolls that target cash and negatively impact innovative activities at
targeted firms. Given our findings, the marginal policy response should be to more carefully
limit the power of NPEs or, in the framework of our model, introduce cost-shifting or screening
measures that reduce the incentive to bring nuisance suits (see Helmers et al. (2013); Cohen
et al. (2016); Love et al. (2017)).
39
References
Abrams, David S., Ufuk Akcigit, and Jillian Popadak, “Patent Value and Citations:
Creative Destruction or Strategic Disruption?,” 2013. NBER Working Paper No. 19647.
Allison, John R., Mark A. Lemley, and David L. Schwartz, “How Often Do Patent
Assertion Entities Win Patent Suits?,” Berkeley Technology Law Journal, forthcoming.
, , and Joshua Walker, “Patent quality and settlement among repeat patent litigants,”
Georgetown Law Journal, 2010, 99, 677–712.
Arena, Matteo and Brandon Julio, “Litigation Risk, Cash Holdings, and Corporate
Investment,” 2011. Marquette University and London Business School Working Paper.
Ball, Gwendolyn G. and Jay P. Kesan, “Transaction Costs and Trolls: Strategic
Behavior by Individual Inventors, Small Firms and Entrepreneurs in Patent Litigation,”
2009. University of Illinois Law & Economics Research Paper No. LE09-005.
Beatty, Anne, Joseph Weber, and Jeff Jiewei Yu, “Conservatism and debt,” Journal
of Accounting and Economics, 2008, 45 (2), 154–174.
Bessen, James E. and Michael J. Meurer, “Patent Litigation with Endogenous Disputes,”
American Economic Review, 2006, 96 (2), 77–81.
and , “The Direct Costs from NPE Disputes,” Cornell Law Review, 2014, 99 (2),
387–424.
, Jennifer Ford, and Michael J. Meurer, “The Private and Social Costs of Patent
Trolls,” Regulation, 2011, 34 (4), 26–35.
Budish, Eric B., Benjamin N. Roin, and Heidi L. Williams, “Do Firms Underinvest
in Long-Term Research? Evidence from Cancer Clinical Trials,” American Economic
Review, 2015, 105 (7), 2044–2085.
40
Cheng, Agnes, Henry He Huang, Yinghua Li, and Gerald Lobo, “Institutional
monitoring through shareholder litigation,” Journal of Financial Economics, 2010, 95 (3),
356–383.
Chien, Colleen V., “Patent Assertion and Startup Innovation,” 2013. Report of the New
America Foundation’s Open Technology Institute.
, “Patent Trolls by the Numbers,” 2013. Santa Clara University Legal Studies Research
Paper No. 08-13.
, “Startups and Patent Trolls,” Stanford Technology Law Review, 2014, 17, 461–506.
Choi, Jay Pil and Heiko Gerlach, “A Model of Patent Trolls,” 2014. Michigan State
University Working Paper.
Cohen, Lauren, Umit G. Gurun, and Scott Duke Kominers, “The growing problem
of patent trolling,” Science, 2016, 352 (6285), 521–522.
, , and , “Empirical Evidence on the Behavior and Impact of Patent Trolls: A Survey,”
in D. Daniel Sokol, ed., Patent Assertion Entities and Competition Policy, Cambridge
University Press, 2017, pp. 27–59.
Cooter, Robert D. and Daniel L. Rubinfeld, “Economic analysis of legal disputes and
their resolution,” Journal of Economic Literature, 1989, 27 (3), 1067–1097.
Cotropia, Christopher A., Jay P. Kesan, and David L. Schwartz, “Unpacking patent
assertion entities (PAEs),” Minnesota Law Review, 2014, 99, 649–703.
Daughety, Andrew F. and Jennifer F. Reinganum, “On the economics of trials:
Adversarial process, evidence, and equilibrium bias,” Journal of Law, Economics, and
Organization, 2000, 16 (2), 365–394.
Executive Office of the President, “Patent Assertion and U.S. Innovation,” 2013. https:
//www.whitehouse.gov/sites/default/files/docs/patent_report.pdf.
41
Feldman, Robin, “Patent Demands & Startup Companies: The View from the Venture
Capital Community,” Yale Journal of Law & Technology, 2014, 16, 236–284.
and Mark A. Lemley, “Do Patent Licensing Demands Mean Innovation?,” Iowa Law
Review, 2015, 101, 137–189.
Feng, Josh and Xavier Jaravel, “Patent trolls and the patent examination process,” 2015.
Harvard University Working Paper.
Fischer, Timo and Joachim Henkel, “Patent trolls on markets for technology – An
empirical analysis of NPEs’ patent acquisitions,” Research Policy, 2012, 41 (9), 1519–1533.
Francis, Jennifer, Donna Philbrick, and Katherine Schipper, “Shareholder litigation
and corporate disclosures,” Journal of Accounting Research, 1994, 32 (2), 137–164.
Galasso, Alberto and Mark Schankerman, “Patent thickets, courts, and the market for
innovation,” RAND Journal of Economics, 2010, 41 (3), 472–503.
, , and Carlos J. Serrano, “Trading and enforcing patent rights,” RAND Journal of
Economics, 2013, 44 (2), 275–312.
, et al., “Patents and Cumulative Innovation: Causal Evidence from the Courts,”
Quarterly Journal of Economics, 2015, 130 (1), 317–369.
Garner, Bryan A. and Henry Campbell Black, Black’s Law Dictionary, Thomson/West,
2004.
Haber, Stephen H. and Seth H. Werfel, “Why Do Inventors Sell to Patent Trolls?
Experimental Evidence for the Asymmetry Hypothesis,” Economics Letters, 2016, 149,
64–66.
Hadlock, Charles J. and Joshua R. Pierce, “New evidence on measuring financial
constraints: Moving beyond the KZ index,” Review of Financial studies, 2010, 23 (5),
1909–1940.
42
Hanley, Kathleen Weiss and Gerard Hoberg, “Litigation risk, strategic disclosure and
the underpricing of initial public offerings,” Journal of Financial Economics, 2012, 103 (2),
235–254.
Hay, Bruce and Kathryn E. Spier, “Settlement of litigation,” in Peter Newman, ed.,
The New Palgrave Dictionary of Economics and the Law, Vol. 3, Palgrave Macmillan, 1998,
pp. 442–451.
Helmers, Christian, Brian Love, and Luke McDonagh, “Is there a patent troll problem
in the UK,” Fordham Intellectual Property Media & Entertainment Law Journal, 2013, 24,
509–553.
Jayaraman, Sudarshan and Todd Milbourn, “Does equity-based CEO compensation
really increase litigation risk?,” 2009. Working paper, Washington University.
Johnson, Marilyn F., Ron Kasznik, and Karen K. Nelson, “Shareholder wealth
effects of the private securities litigation reform act of 1995,” Review of Accounting Studies,
2000, 5 (3), 217–233.
Kerr, William R., “Ethnic scientific communities and international technology diffusion,”
Review of Economics and Statistics, 2008, 90 (3), 518–537.
Kiebzak, Stephen, Greg Rafert, and Catherine E. Tucker, “The effect of patent
litigation and patent assertion entities on entrepreneurial activity,” Research Policy, 2016,
45 (1), 218–231.
Kogan, Leonid, Dimitris Papanikolaou, Amit Seru, and Noah Stoffman, “Tech-
nological innovation, resource allocation, and growth,” 2012. NBER Working Paper
No. 17769.
Lemley, Mark A. and A. Douglas Melamed, “Missing the Forest for the Trolls,”
Columbia Law Review, 2013, 113 (8), 2117–2189.
43
and Carl Shapiro, “Probabilistic Patents,” Journal of Economic Perspectives, 2005, 19
(2), 75–98.
and , “Patent Holdup and Royalty Stacking,” Texas Law Review, 2006, 85, 1991–2163.
Lerner, Josh, “The Empirical Impact of Intellectual Property Rights on Innovation: Puzzles
and Clues,” American Economic Review, 2009, 99 (2), 343–348.
Leychkis, Yan, “Of Fire Ants and Claim Construction: An Empirical Study of the Meteoric
Rise of the Eastern District of Texas as a Preeminent Forum for Patent Litigation,” Yale
Journal of Law & Technology, 2007, 9, 193–232.
Love, Brian, Christian Helmers, Fabian Gaessler, and Max Ernicke, “Patent Asser-
tion Entities in Europe,” in D. Daniel Sokol, ed., Patent Assertion Entities and Competition
Policy, Cambridge University Press, 2017, pp. 104–129.
Love, Brian J., “An Empirical Study of Patent Litigation Timing: Could a Patent Term
Reduction Decimate Trolls Without Harming Innovators?,” University of Pennsylvania
Law Review, 2014, 161, 1309–1359.
Lowry, Michelle and Susan Shu, “Litigation risk and IPO underpricing,” Journal of
Financial Economics, 2002, 65 (3), 309–335.
Marco, Alan C., Michael Carley, Steven Jackson, and Amanda F. Myers, “The
USPTO Historical Patent Data Files: Two Centuries of Innovation,” 2015. Working Paper,
United States Patent and Trademark Office.
McGahan, Anita M. and Brian S. Silverman, “How does innovative activity change
as industries mature?,” International Journal of Industrial Organization, 2001, 19 (7),
1141–1160.
44
Miller, Shawn P., “Where’s the Innovation: An Analysis of the Quantity and Qualities of
Anticipated and Obvious Patents,” Virginia Journal of Law and Technology, 2013, 18 (1),
1–58.
Mowery, David C. and Arvids A. Ziedonis, “The geographic reach of market and
non-market channels of technology transfer: Comparing citations and licenses of university
patents,” 2001. NBER Working Paper No. 8568.
Mullin, Joe, “Patent stunner: Under attack, nation’s most notorious “troll” sues federal
gov’t,” Ars Technica, January 14, 2014.
, “FindTheBest destroys “matchmaking” patent, pushes RICO case against troll,” Ars
Technica, November 23, 2013.
Polinsky, A. Mitchell and Steven Shavell, “Legal Error, Litigation, and the Incentive
to Obey the Law,” Journal of Law, Economics and Organization, 1989, 5 (1), 99–108.
Risch, Michael, “Patent Troll Myths,” Seton Hall Law Review, 2012, 42, 457–497.
, “A Generation of Patent Litigation: Outcomes and Patent Quality,” San Diego Law
Review, 2015, 52, 67–132.
Rogers, Jonathan L. and Andrew Van Buskirk, “Shareholder litigation and changes
in disclosure behavior,” Journal of Accounting and Economics, 2009, 47 (1), 136–156.
Sakakibara, Mariko and Lee Branstetter, “Do Stronger Patents Induce More Innova-
tion? Evidence from the 1988 Japanese Patent Law Reforms,” RAND Journal of Economics,
2001, 32 (1), 77–100.
Schwartz, David L. and Jay P. Kesan, “Analyzing the role of non-practicing entities in
the patent system,” Cornell Law Review, 2014, 99 (2), 425–456.
Scott Morton, Fiona M. and Carl Shapiro, “Strategic Patent Acquisitions,” Antitrust
Law Journal, 2014, 79 (2), 463–500.
45
Seetharaman, Ananth, Ferdinand A. Gul, and Stephen G. Lynn, “Litigation risk
and audit fees: Evidence from UK firms cross-listed on US markets,” Journal of Accounting
and Economics, 2002, 33 (1), 91–115.
Shrestha, Sannu K., “Trolls or Market-makers? An empirical analysis of nonpracticing
entities,” Columbia Law Review, 2010, 110, 114–160.
Shu, Susan Zhan, “Auditor resignations: Clientele effects and legal liability,” Journal of
Accounting and Economics, 2000, 29 (2), 173–205.
Silverman, Brian S., Technological Resources and the Logic of Corporate Diversification,
Routledge, 2003.
Skinner, Douglas J., “Why firms voluntarily disclose bad news,” Journal of Accounting
Research, 1994, 32 (1), 38–60.
, “Earnings disclosures and stockholder lawsuits,” Journal of Accounting and Economics,
1997, 23 (3), 249–282.
Smeets, Roger, “Does Patent Litigation Reduce Corporate R&D? An Analysis of US Public
Firms,” 2015. Working Paper, Rutgers University.
Sokol, D. Daniel, ed., Patent Assertion Entities and Competition Policy, Cambridge
University Press, 2017.
Spier, Kathryn, “Economics of Litigation,” in S. Durlauf and L. Blume, eds., The New
Palgrave Dictionary of Economics, Macmillan, 2005.
Tucker, Catherine E., “Patent Trolls and Technology Diffusion: The Case of Medical
Imaging,” 2014. Working Paper, Massachusetts Institute of Technology.
United States Government Accountability Office, “Assessing Factors That Affect
Patent Infringement Litigation Could Help Improve Patent Quality,” 2013. GAO-13-465.
46
United States Patent and Trademark Office, “Request for Comments on Enhancing
Patent Quality,” Federal Register, 2015, 80, 6475–6481.
Williams, Heidi L., “Intellectual Property Rights and Innovation: Evidence from the
Human Genome,” Journal of Political Economy, 2013, 121 (1), 1–27.
, “Intellectual Property Rights and Innovation: Evidence from Health Care Markets,” in
Josh Lerner and Scott Stern, eds., Innovation Policy and the Economy, Vol. 16, University
of Chicago Press, 2015.
47
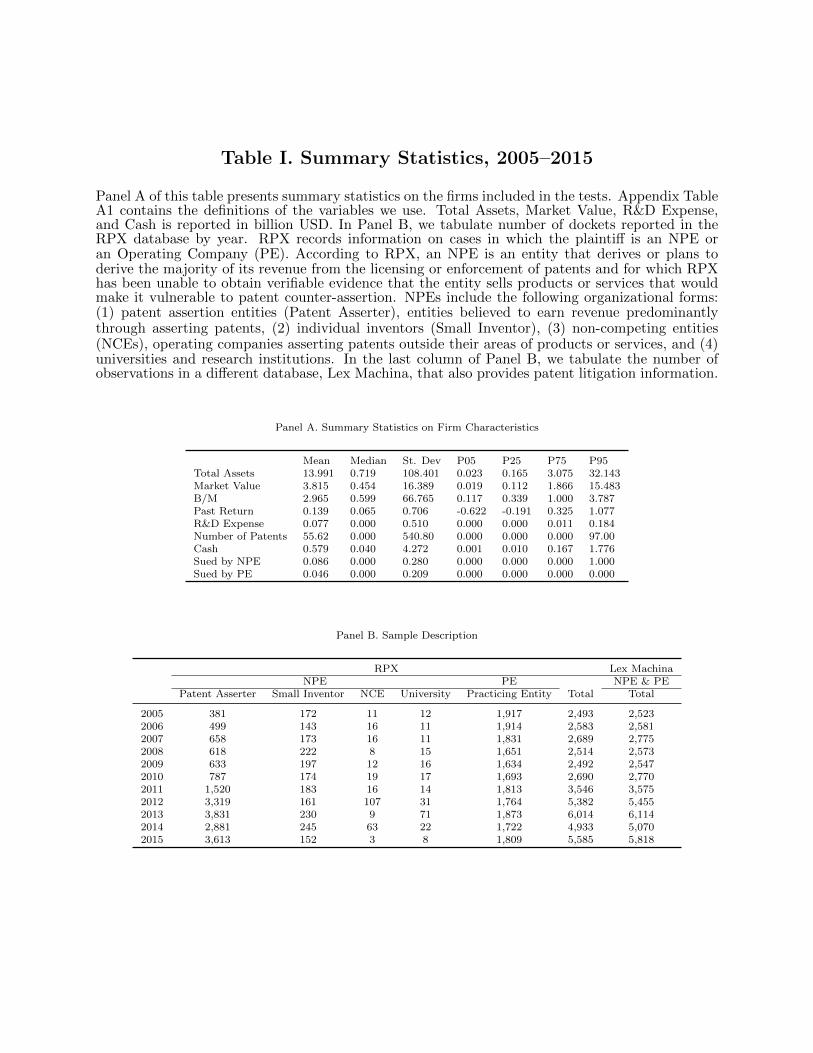
Table I. Summary Statistics, 2005–2015
Panel A of this table presents summary statistics on the firms included in the tests. Appendix TableA1 contains the definitions of the variables we use. Total Assets, Market Value, R&D Expense,and Cash is reported in billion USD. In Panel B, we tabulate number of dockets reported in theRPX database by year. RPX records information on cases in which the plaintiff is an NPE oran Operating Company (PE). According to RPX, an NPE is an entity that derives or plans toderive the majority of its revenue from the licensing or enforcement of patents and for which RPXhas been unable to obtain verifiable evidence that the entity sells products or services that wouldmake it vulnerable to patent counter-assertion. NPEs include the following organizational forms:(1) patent assertion entities (Patent Asserter), entities believed to earn revenue predominantlythrough asserting patents, (2) individual inventors (Small Inventor), (3) non-competing entities(NCEs), operating companies asserting patents outside their areas of products or services, and (4)universities and research institutions. In the last column of Panel B, we tabulate the number ofobservations in a different database, Lex Machina, that also provides patent litigation information.
Panel A. Summary Statistics on Firm Characteristics
Mean Median St. Dev P05 P25 P75 P95Total Assets 13.991 0.719 108.401 0.023 0.165 3.075 32.143Market Value 3.815 0.454 16.389 0.019 0.112 1.866 15.483B/M 2.965 0.599 66.765 0.117 0.339 1.000 3.787Past Return 0.139 0.065 0.706 -0.622 -0.191 0.325 1.077R&D Expense 0.077 0.000 0.510 0.000 0.000 0.011 0.184Number of Patents 55.62 0.000 540.80 0.000 0.000 0.000 97.00Cash 0.579 0.040 4.272 0.001 0.010 0.167 1.776Sued by NPE 0.086 0.000 0.280 0.000 0.000 0.000 1.000Sued by PE 0.046 0.000 0.209 0.000 0.000 0.000 0.000
Panel B. Sample Description
RPX Lex MachinaNPE PE NPE & PE
Patent Asserter Small Inventor NCE University Practicing Entity Total Total
2005 381 172 11 12 1,917 2,493 2,5232006 499 143 16 11 1,914 2,583 2,5812007 658 173 16 11 1,831 2,689 2,7752008 618 222 8 15 1,651 2,514 2,5732009 633 197 12 16 1,634 2,492 2,5472010 787 174 19 17 1,693 2,690 2,7702011 1,520 183 16 14 1,813 3,546 3,5752012 3,319 161 107 31 1,764 5,382 5,4552013 3,831 230 9 71 1,873 6,014 6,1142014 2,881 245 63 22 1,722 4,933 5,0702015 3,613 152 3 8 1,809 5,585 5,818
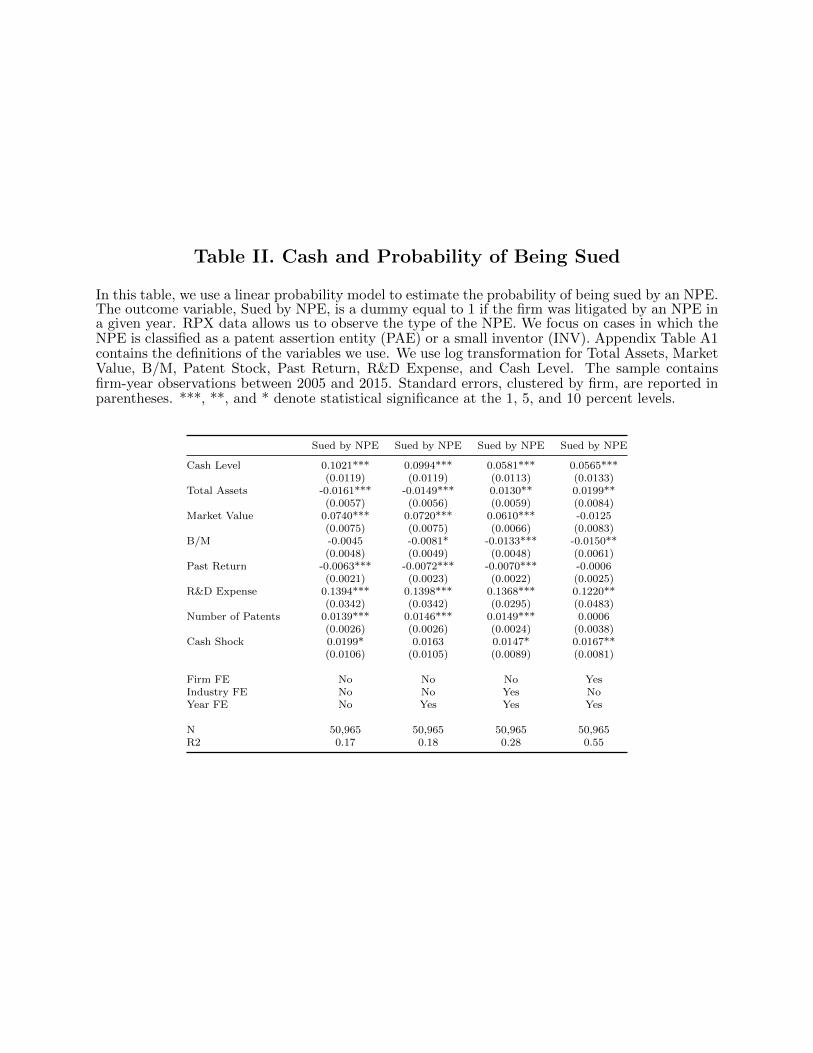
Table II. Cash and Probability of Being Sued
In this table, we use a linear probability model to estimate the probability of being sued by an NPE.The outcome variable, Sued by NPE, is a dummy equal to 1 if the firm was litigated by an NPE ina given year. RPX data allows us to observe the type of the NPE. We focus on cases in which theNPE is classified as a patent assertion entity (PAE) or a small inventor (INV). Appendix Table A1contains the definitions of the variables we use. We use log transformation for Total Assets, MarketValue, B/M, Patent Stock, Past Return, R&D Expense, and Cash Level. The sample containsfirm-year observations between 2005 and 2015. Standard errors, clustered by firm, are reported inparentheses. ***, **, and * denote statistical significance at the 1, 5, and 10 percent levels.
Sued by NPE Sued by NPE Sued by NPE Sued by NPE
Cash Level 0.1021*** 0.0994*** 0.0581*** 0.0565***(0.0119) (0.0119) (0.0113) (0.0133)
Total Assets -0.0161*** -0.0149*** 0.0130** 0.0199**(0.0057) (0.0056) (0.0059) (0.0084)
Market Value 0.0740*** 0.0720*** 0.0610*** -0.0125(0.0075) (0.0075) (0.0066) (0.0083)
B/M -0.0045 -0.0081* -0.0133*** -0.0150**(0.0048) (0.0049) (0.0048) (0.0061)
Past Return -0.0063*** -0.0072*** -0.0070*** -0.0006(0.0021) (0.0023) (0.0022) (0.0025)
R&D Expense 0.1394*** 0.1398*** 0.1368*** 0.1220**(0.0342) (0.0342) (0.0295) (0.0483)
Number of Patents 0.0139*** 0.0146*** 0.0149*** 0.0006(0.0026) (0.0026) (0.0024) (0.0038)
Cash Shock 0.0199* 0.0163 0.0147* 0.0167**(0.0106) (0.0105) (0.0089) (0.0081)
Firm FE No No No YesIndustry FE No No Yes NoYear FE No Yes Yes Yes
N 50,965 50,965 50,965 50,965R2 0.17 0.18 0.28 0.55
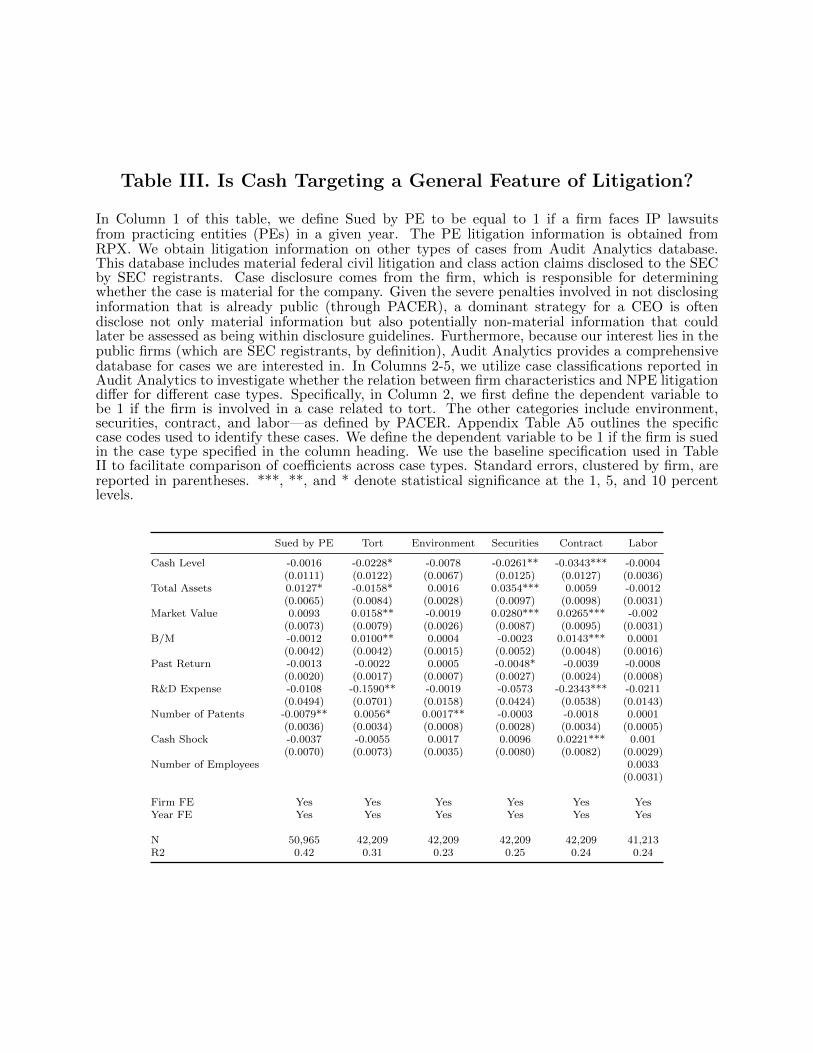
Table III. Is Cash Targeting a General Feature of Litigation?
In Column 1 of this table, we define Sued by PE to be equal to 1 if a firm faces IP lawsuitsfrom practicing entities (PEs) in a given year. The PE litigation information is obtained fromRPX. We obtain litigation information on other types of cases from Audit Analytics database.This database includes material federal civil litigation and class action claims disclosed to the SECby SEC registrants. Case disclosure comes from the firm, which is responsible for determiningwhether the case is material for the company. Given the severe penalties involved in not disclosinginformation that is already public (through PACER), a dominant strategy for a CEO is oftendisclose not only material information but also potentially non-material information that couldlater be assessed as being within disclosure guidelines. Furthermore, because our interest lies in thepublic firms (which are SEC registrants, by definition), Audit Analytics provides a comprehensivedatabase for cases we are interested in. In Columns 2-5, we utilize case classifications reported inAudit Analytics to investigate whether the relation between firm characteristics and NPE litigationdiffer for different case types. Specifically, in Column 2, we first define the dependent variable tobe 1 if the firm is involved in a case related to tort. The other categories include environment,securities, contract, and labor—as defined by PACER. Appendix Table A5 outlines the specificcase codes used to identify these cases. We define the dependent variable to be 1 if the firm is suedin the case type specified in the column heading. We use the baseline specification used in TableII to facilitate comparison of coefficients across case types. Standard errors, clustered by firm, arereported in parentheses. ***, **, and * denote statistical significance at the 1, 5, and 10 percentlevels.
Sued by PE Tort Environment Securities Contract Labor
Cash Level -0.0016 -0.0228* -0.0078 -0.0261** -0.0343*** -0.0004(0.0111) (0.0122) (0.0067) (0.0125) (0.0127) (0.0036)
Total Assets 0.0127* -0.0158* 0.0016 0.0354*** 0.0059 -0.0012(0.0065) (0.0084) (0.0028) (0.0097) (0.0098) (0.0031)
Market Value 0.0093 0.0158** -0.0019 0.0280*** 0.0265*** -0.002(0.0073) (0.0079) (0.0026) (0.0087) (0.0095) (0.0031)
B/M -0.0012 0.0100** 0.0004 -0.0023 0.0143*** 0.0001(0.0042) (0.0042) (0.0015) (0.0052) (0.0048) (0.0016)
Past Return -0.0013 -0.0022 0.0005 -0.0048* -0.0039 -0.0008(0.0020) (0.0017) (0.0007) (0.0027) (0.0024) (0.0008)
R&D Expense -0.0108 -0.1590** -0.0019 -0.0573 -0.2343*** -0.0211(0.0494) (0.0701) (0.0158) (0.0424) (0.0538) (0.0143)
Number of Patents -0.0079** 0.0056* 0.0017** -0.0003 -0.0018 0.0001(0.0036) (0.0034) (0.0008) (0.0028) (0.0034) (0.0005)
Cash Shock -0.0037 -0.0055 0.0017 0.0096 0.0221*** 0.001(0.0070) (0.0073) (0.0035) (0.0080) (0.0082) (0.0029)
Number of Employees 0.0033(0.0031)
Firm FE Yes Yes Yes Yes Yes YesYear FE Yes Yes Yes Yes Yes Yes
N 50,965 42,209 42,209 42,209 42,209 41,213R2 0.42 0.31 0.23 0.25 0.24 0.24
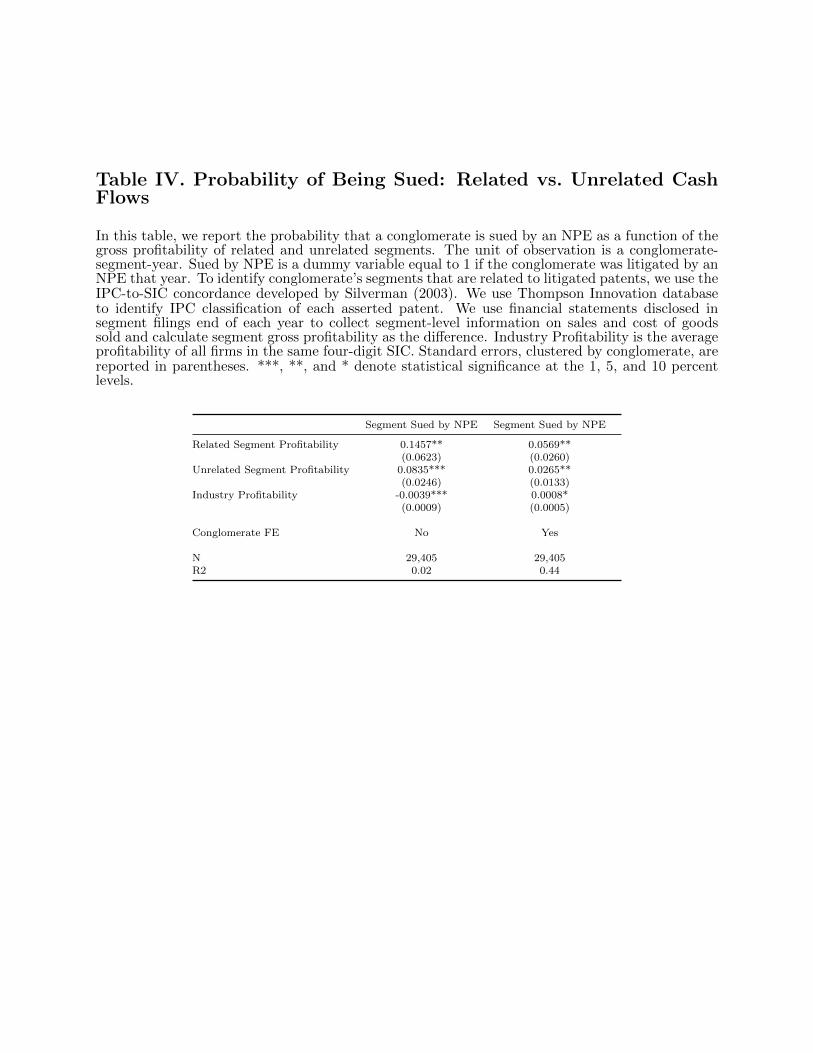
Table IV. Probability of Being Sued: Related vs. Unrelated CashFlows
In this table, we report the probability that a conglomerate is sued by an NPE as a function of thegross profitability of related and unrelated segments. The unit of observation is a conglomerate-segment-year. Sued by NPE is a dummy variable equal to 1 if the conglomerate was litigated by anNPE that year. To identify conglomerate’s segments that are related to litigated patents, we use theIPC-to-SIC concordance developed by Silverman (2003). We use Thompson Innovation databaseto identify IPC classification of each asserted patent. We use financial statements disclosed insegment filings end of each year to collect segment-level information on sales and cost of goodssold and calculate segment gross profitability as the difference. Industry Profitability is the averageprofitability of all firms in the same four-digit SIC. Standard errors, clustered by conglomerate, arereported in parentheses. ***, **, and * denote statistical significance at the 1, 5, and 10 percentlevels.
Segment Sued by NPE Segment Sued by NPE
Related Segment Profitability 0.1457** 0.0569**(0.0623) (0.0260)
Unrelated Segment Profitability 0.0835*** 0.0265**(0.0246) (0.0133)
Industry Profitability -0.0039*** 0.0008*(0.0009) (0.0005)
Conglomerate FE No Yes
N 29,405 29,405R2 0.02 0.44
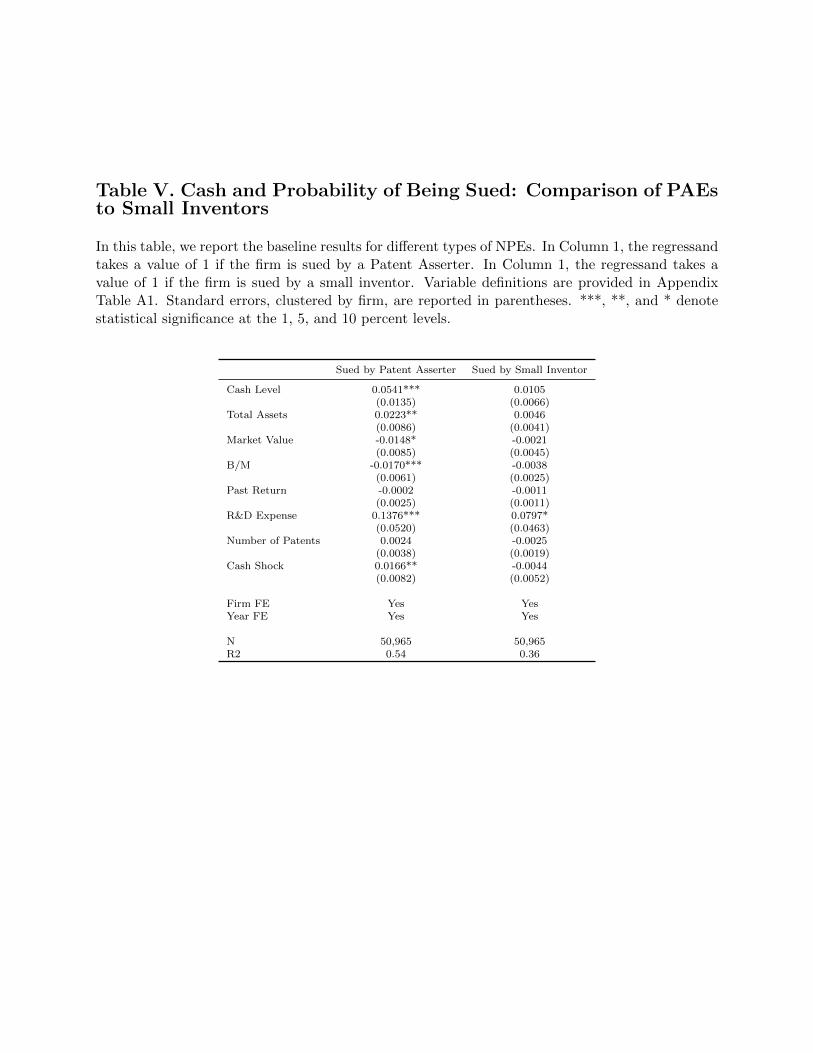
Table V. Cash and Probability of Being Sued: Comparison of PAEsto Small Inventors
In this table, we report the baseline results for different types of NPEs. In Column 1, the regressandtakes a value of 1 if the firm is sued by a Patent Asserter. In Column 1, the regressand takes avalue of 1 if the firm is sued by a small inventor. Variable definitions are provided in AppendixTable A1. Standard errors, clustered by firm, are reported in parentheses. ***, **, and * denotestatistical significance at the 1, 5, and 10 percent levels.
Sued by Patent Asserter Sued by Small Inventor
Cash Level 0.0541*** 0.0105(0.0135) (0.0066)
Total Assets 0.0223** 0.0046(0.0086) (0.0041)
Market Value -0.0148* -0.0021(0.0085) (0.0045)
B/M -0.0170*** -0.0038(0.0061) (0.0025)
Past Return -0.0002 -0.0011(0.0025) (0.0011)
R&D Expense 0.1376*** 0.0797*(0.0520) (0.0463)
Number of Patents 0.0024 -0.0025(0.0038) (0.0019)
Cash Shock 0.0166** -0.0044(0.0082) (0.0052)
Firm FE Yes YesYear FE Yes Yes
N 50,965 50,965R2 0.54 0.36
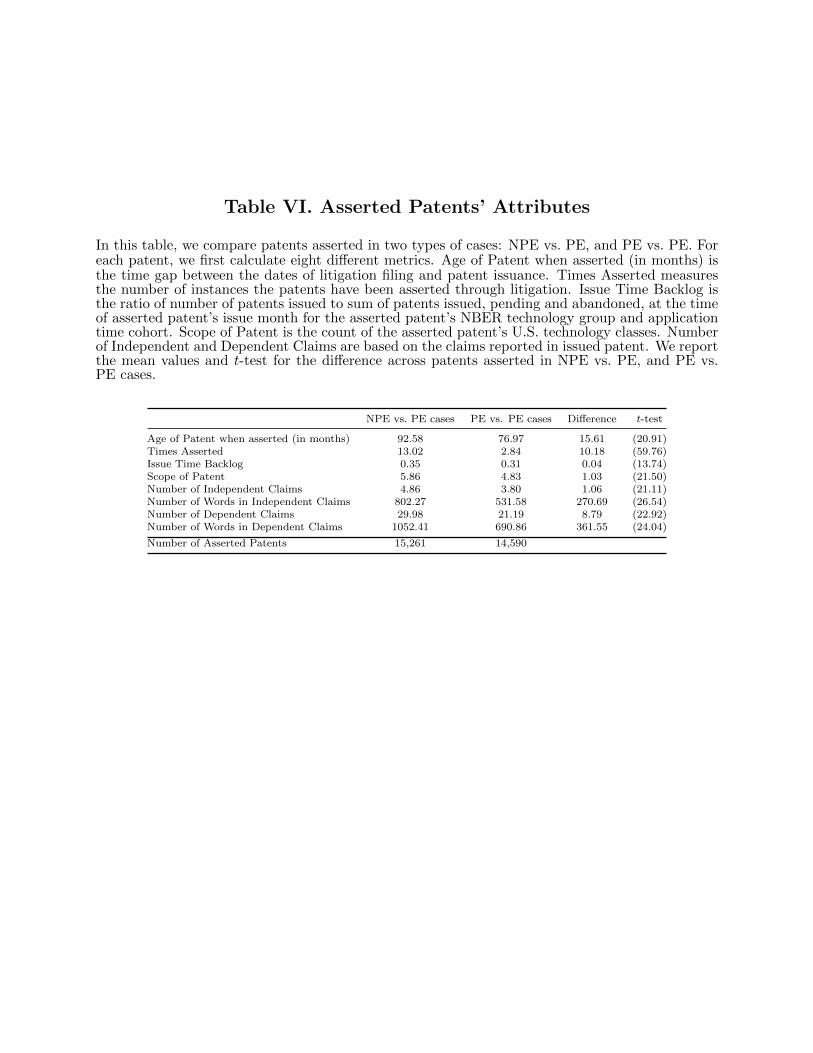
Table VI. Asserted Patents’ Attributes
In this table, we compare patents asserted in two types of cases: NPE vs. PE, and PE vs. PE. Foreach patent, we first calculate eight different metrics. Age of Patent when asserted (in months) isthe time gap between the dates of litigation filing and patent issuance. Times Asserted measuresthe number of instances the patents have been asserted through litigation. Issue Time Backlog isthe ratio of number of patents issued to sum of patents issued, pending and abandoned, at the timeof asserted patent’s issue month for the asserted patent’s NBER technology group and applicationtime cohort. Scope of Patent is the count of the asserted patent’s U.S. technology classes. Numberof Independent and Dependent Claims are based on the claims reported in issued patent. We reportthe mean values and t-test for the difference across patents asserted in NPE vs. PE, and PE vs.PE cases.
NPE vs. PE cases PE vs. PE cases Difference t-test
Age of Patent when asserted (in months) 92.58 76.97 15.61 (20.91)Times Asserted 13.02 2.84 10.18 (59.76)Issue Time Backlog 0.35 0.31 0.04 (13.74)Scope of Patent 5.86 4.83 1.03 (21.50)Number of Independent Claims 4.86 3.80 1.06 (21.11)Number of Words in Independent Claims 802.27 531.58 270.69 (26.54)Number of Dependent Claims 29.98 21.19 8.79 (22.92)Number of Words in Dependent Claims 1052.41 690.86 361.55 (24.04)
Number of Asserted Patents 15,261 14,590
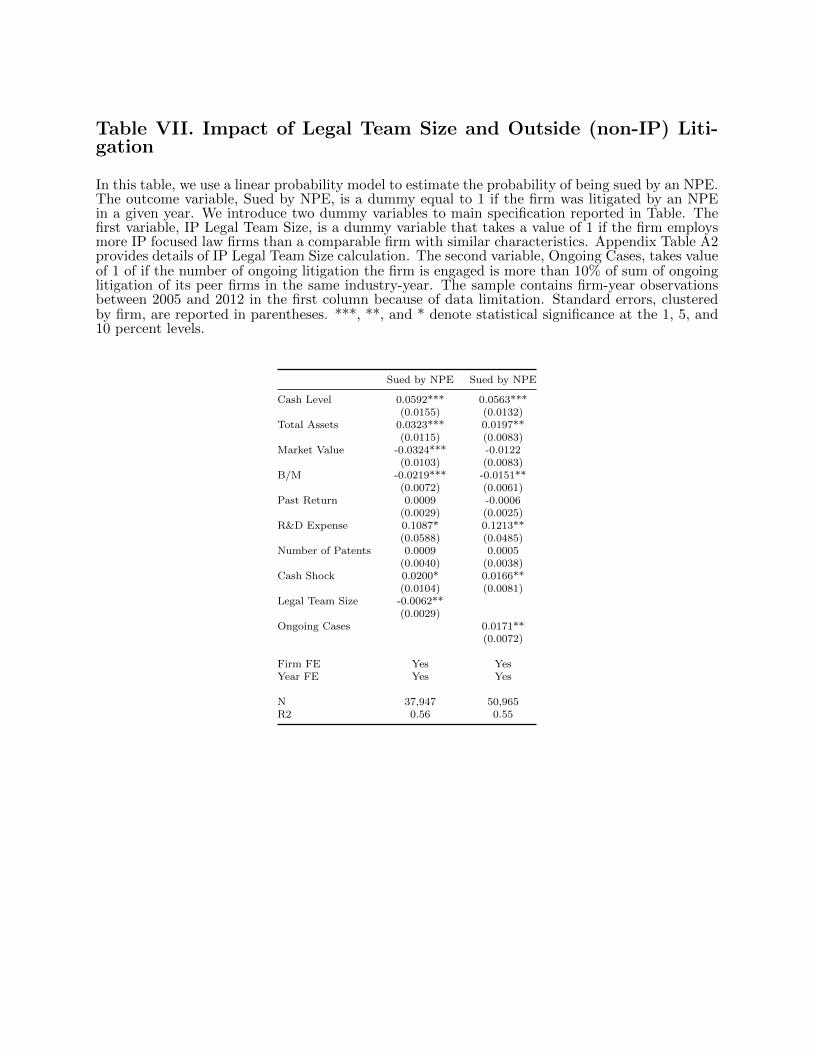
Table VII. Impact of Legal Team Size and Outside (non-IP) Liti-gation
In this table, we use a linear probability model to estimate the probability of being sued by an NPE.The outcome variable, Sued by NPE, is a dummy equal to 1 if the firm was litigated by an NPEin a given year. We introduce two dummy variables to main specification reported in Table. Thefirst variable, IP Legal Team Size, is a dummy variable that takes a value of 1 if the firm employsmore IP focused law firms than a comparable firm with similar characteristics. Appendix Table A2provides details of IP Legal Team Size calculation. The second variable, Ongoing Cases, takes valueof 1 of if the number of ongoing litigation the firm is engaged is more than 10% of sum of ongoinglitigation of its peer firms in the same industry-year. The sample contains firm-year observationsbetween 2005 and 2012 in the first column because of data limitation. Standard errors, clusteredby firm, are reported in parentheses. ***, **, and * denote statistical significance at the 1, 5, and10 percent levels.
Sued by NPE Sued by NPE
Cash Level 0.0592*** 0.0563***(0.0155) (0.0132)
Total Assets 0.0323*** 0.0197**(0.0115) (0.0083)
Market Value -0.0324*** -0.0122(0.0103) (0.0083)
B/M -0.0219*** -0.0151**(0.0072) (0.0061)
Past Return 0.0009 -0.0006(0.0029) (0.0025)
R&D Expense 0.1087* 0.1213**(0.0588) (0.0485)
Number of Patents 0.0009 0.0005(0.0040) (0.0038)
Cash Shock 0.0200* 0.0166**(0.0104) (0.0081)
Legal Team Size -0.0062**(0.0029)
Ongoing Cases 0.0171**(0.0072)
Firm FE Yes YesYear FE Yes Yes
N 37,947 50,965R2 0.56 0.55
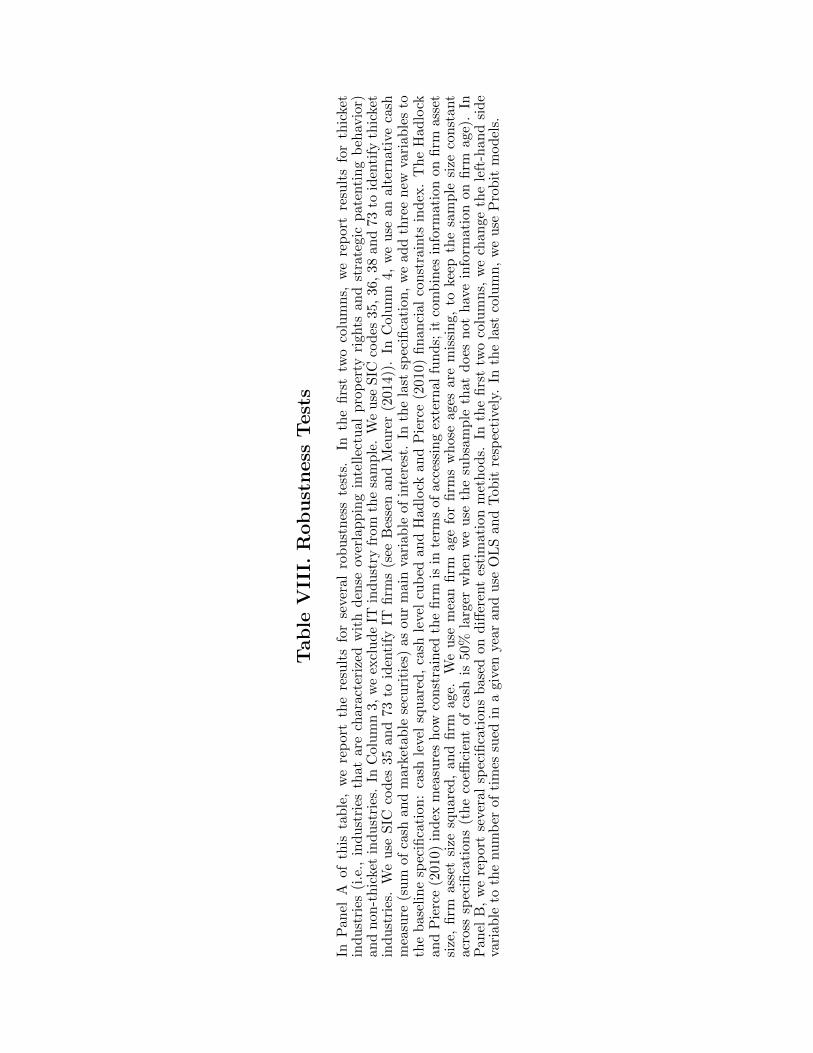
Tab
leV
III.
Rob
ust
ness
Test
s
InP
anel
Aof
this
tab
le,
we
rep
ort
the
resu
lts
for
seve
ral
rob
ust
nes
ste
sts.
Inth
efi
rst
two
colu
mn
s,w
ere
port
resu
lts
for
thic
ket
ind
ust
ries
(i.e
.,in
du
stri
esth
atar
ech
arac
teri
zed
wit
hd
ense
over
lap
pin
gin
tell
ectu
alp
rop
erty
righ
tsan
dst
rate
gic
pate
nti
ng
beh
avio
r)an
dn
on-t
hic
ket
ind
ust
ries
.In
Col
um
n3,
we
excl
ud
eIT
ind
ust
ryfr
omth
esa
mp
le.
We
use
SIC
cod
es35
,36,
38
an
d73
toid
enti
fyth
icke
tin
du
stri
es.
We
use
SIC
cod
es35
and
73to
iden
tify
ITfi
rms
(see
Bes
sen
and
Meu
rer
(201
4)).
InC
olu
mn
4,
we
use
an
alt
ern
ati
veca
shm
easu
re(s
um
ofca
shan
dm
arke
tab
lese
curi
ties
)as
our
mai
nva
riab
leof
inte
rest
.In
the
last
spec
ifica
tion
,w
eadd
thre
en
ewva
riab
les
toth
eb
asel
ine
spec
ifica
tion
:ca
shle
vel
squ
ared
,ca
shle
vel
cub
edan
dH
adlo
ckan
dP
ierc
e(2
010)
fin
anci
al
con
stra
ints
ind
ex.
Th
eH
ad
lock
and
Pie
rce
(201
0)in
dex
mea
sure
sh
owco
nst
rain
edth
efi
rmis
inte
rms
ofac
cess
ing
exte
rnal
fun
ds;
itco
mb
ines
info
rmati
on
on
firm
ass
etsi
ze,
firm
asse
tsi
zesq
uar
ed,
and
firm
age.
We
use
mea
nfi
rmag
efo
rfi
rms
wh
ose
ages
are
mis
sin
g,to
keep
the
sam
ple
size
con
stant
acro
sssp
ecifi
cati
ons
(th
eco
effici
ent
ofca
shis
50%
larg
erw
hen
we
use
the
sub
sam
ple
that
does
not
hav
ein
form
ati
on
on
firm
age)
.In
Pan
elB
,w
ere
por
tse
vera
lsp
ecifi
cati
ons
bas
edon
diff
eren
tes
tim
atio
nm
eth
od
s.In
the
firs
ttw
oco
lum
ns,
we
chan
ge
the
left
-han
dsi
de
vari
able
toth
enum
ber
ofti
mes
sued
ina
given
year
and
use
OL
San
dT
obit
resp
ecti
vel
y.In
the
last
colu
mn
,w
eu
seP
rob
itm
od
els.
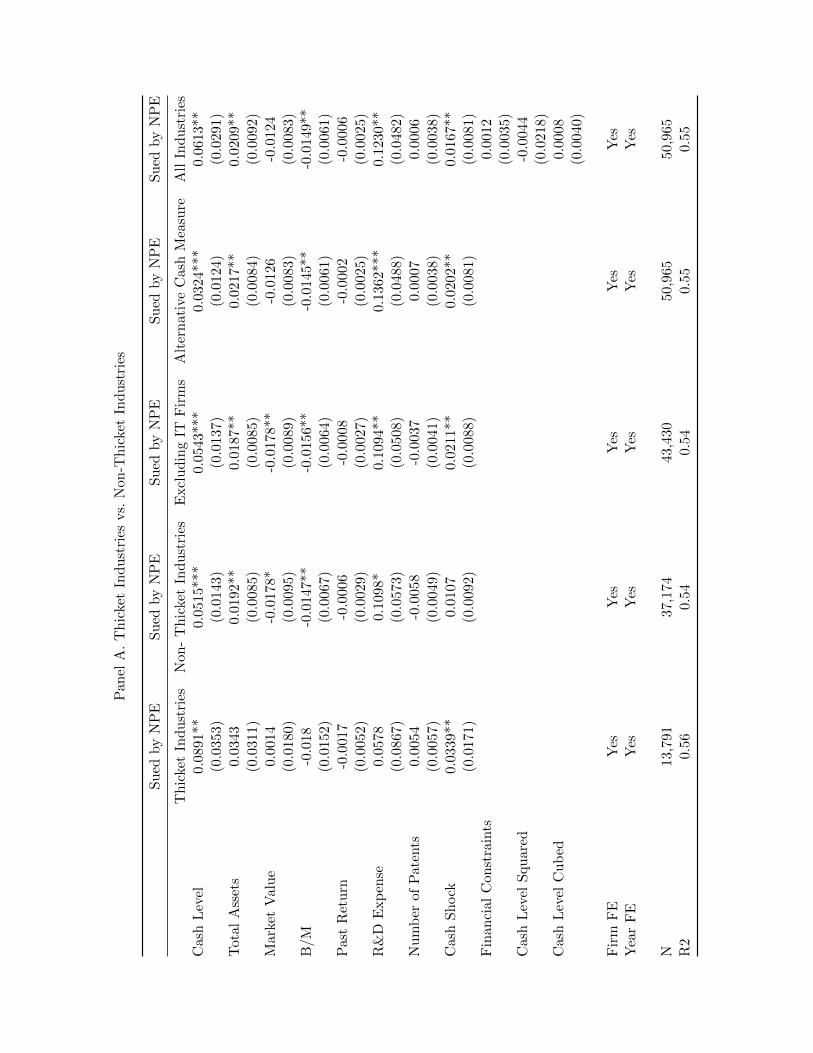
Pan
elA
.T
hic
ket
Ind
ust
ries
vs.
Non
-Th
icket
Ind
ust
ries
Su
edby
NP
ES
ued
by
NP
ES
ued
by
NP
ES
ued
by
NP
ES
ued
by
NP
E
Th
icke
tIn
du
stri
esN
on-
Th
icke
tIn
du
stri
esE
xcl
udin
gIT
Fir
ms
Alt
ern
ativ
eC
ash
Mea
sure
All
Ind
ust
ries
Cas
hL
evel
0.08
91**
0.05
15**
*0.
0543
***
0.0
324***
0.0
613**
(0.0
353)
(0.0
143)
(0.0
137)
(0.0
124)
(0.0
291)
Tot
alA
sset
s0.
0343
0.01
92**
0.01
87**
0.0
217**
0.0
209**
(0.0
311)
(0.0
085)
(0.0
085)
(0.0
084)
(0.0
092)
Mar
ket
Val
ue
0.00
14-0
.017
8*-0
.017
8**
-0.0
126
-0.0
124
(0.0
180)
(0.0
095)
(0.0
089)
(0.0
083)
(0.0
083)
B/M
-0.0
18-0
.014
7**
-0.0
156*
*-0
.0145**
-0.0
149**
(0.0
152)
(0.0
067)
(0.0
064)
(0.0
061)
(0.0
061)
Pas
tR
etu
rn-0
.001
7-0
.000
6-0
.000
8-0
.0002
-0.0
006
(0.0
052)
(0.0
029)
(0.0
027)
(0.0
025)
(0.0
025)
R&
DE
xp
ense
0.05
780.
1098
*0.
1094
**0.1
362***
0.1
230**
(0.0
867)
(0.0
573)
(0.0
508)
(0.0
488)
(0.0
482)
Nu
mb
erof
Pat
ents
0.00
54-0
.005
8-0
.003
70.0
007
0.0
006
(0.0
057)
(0.0
049)
(0.0
041)
(0.0
038)
(0.0
038)
Cas
hS
hock
0.03
39**
0.01
070.
0211
**0.0
202**
0.0
167**
(0.0
171)
(0.0
092)
(0.0
088)
(0.0
081)
(0.0
081)
Fin
anci
alC
onst
rain
ts0.0
012
(0.0
035)
Cas
hL
evel
Squ
ared
-0.0
044
(0.0
218)
Cas
hL
evel
Cu
bed
0.0
008
(0.0
040)
Fir
mF
EY
esY
esY
esY
esY
esY
ear
FE
Yes
Yes
Yes
Yes
Yes
N13
,791
37,1
7443
,430
50,9
65
50,9
65
R2
0.56
0.54
0.54
0.5
50.5
5
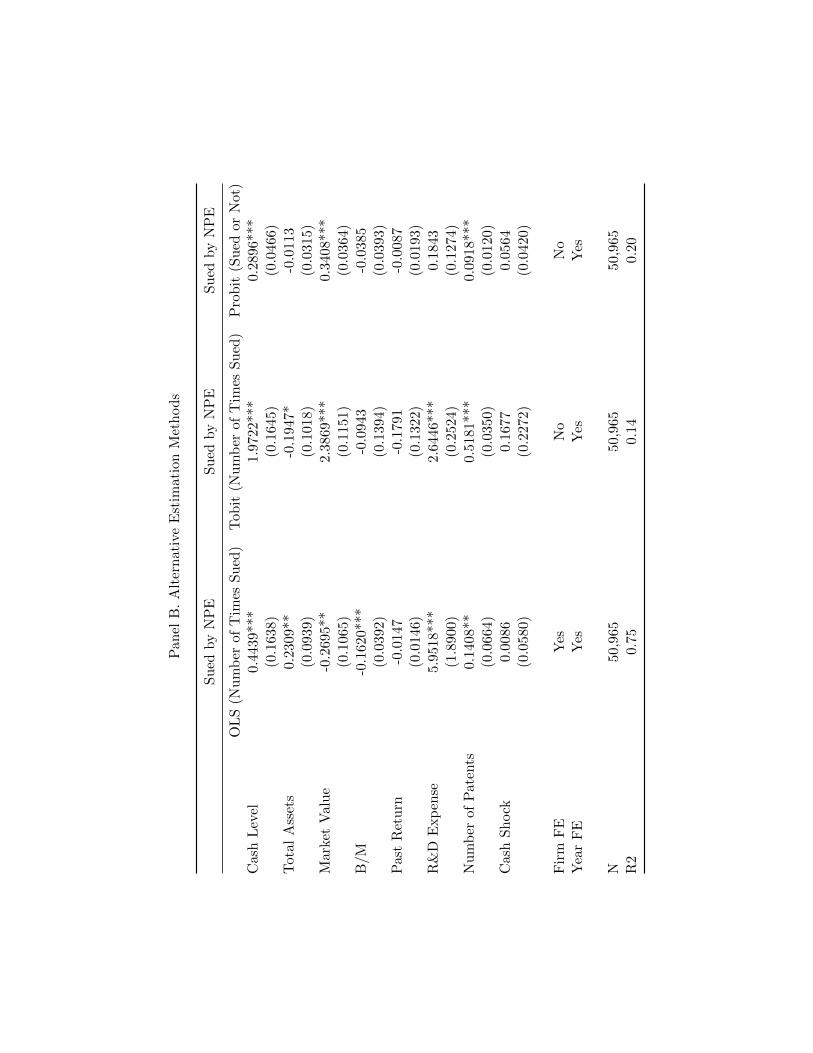
Pan
elB
.A
lter
nat
ive
Est
imat
ion
Met
hod
s
Su
edby
NP
ES
ued
by
NP
ES
ued
by
NP
E
OL
S(N
um
ber
ofT
imes
Su
ed)
Tob
it(N
um
ber
ofT
imes
Su
ed)
Pro
bit
(Su
edor
Not)
Cas
hL
evel
0.44
39**
*1.
9722
***
0.2
896***
(0.1
638)
(0.1
645)
(0.0
466)
Tot
alA
sset
s0.
2309
**-0
.194
7*-0
.0113
(0.0
939)
(0.1
018)
(0.0
315)
Mar
ket
Val
ue
-0.2
695*
*2.
3869
***
0.3
408***
(0.1
065)
(0.1
151)
(0.0
364)
B/M
-0.1
620*
**-0
.094
3-0
.0385
(0.0
392)
(0.1
394)
(0.0
393)
Pas
tR
etu
rn-0
.014
7-0
.179
1-0
.0087
(0.0
146)
(0.1
322)
(0.0
193)
R&
DE
xp
ense
5.95
18**
*2.
6446
***
0.1
843
(1.8
900)
(0.2
524)
(0.1
274)
Nu
mb
erof
Pat
ents
0.14
08**
0.51
81**
*0.0
918***
(0.0
664)
(0.0
350)
(0.0
120)
Cas
hS
hock
0.00
860.
1677
0.0
564
(0.0
580)
(0.2
272)
(0.0
420)
Fir
mF
EY
esN
oN
oY
ear
FE
Yes
Yes
Yes
N50
,965
50,9
6550,9
65
R2
0.75
0.14
0.2
0
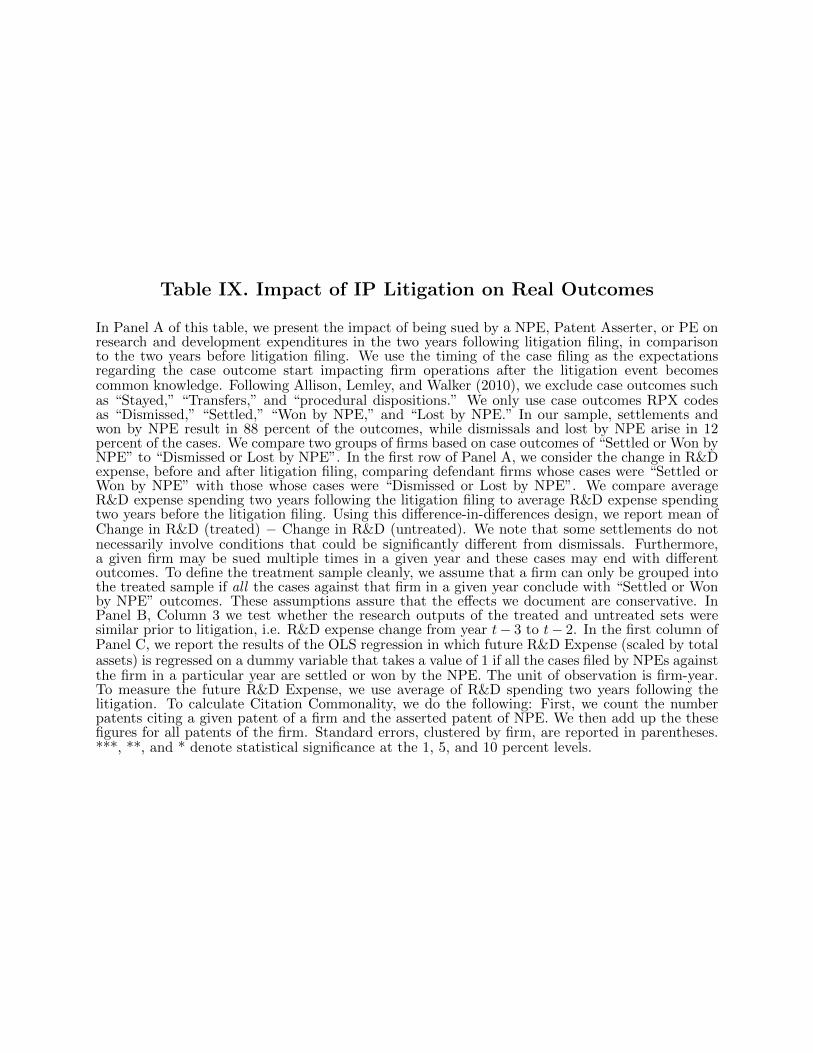
Table IX. Impact of IP Litigation on Real Outcomes
In Panel A of this table, we present the impact of being sued by a NPE, Patent Asserter, or PE onresearch and development expenditures in the two years following litigation filing, in comparisonto the two years before litigation filing. We use the timing of the case filing as the expectationsregarding the case outcome start impacting firm operations after the litigation event becomescommon knowledge. Following Allison, Lemley, and Walker (2010), we exclude case outcomes suchas “Stayed,” “Transfers,” and “procedural dispositions.” We only use case outcomes RPX codesas “Dismissed,” “Settled,” “Won by NPE,” and “Lost by NPE.” In our sample, settlements andwon by NPE result in 88 percent of the outcomes, while dismissals and lost by NPE arise in 12percent of the cases. We compare two groups of firms based on case outcomes of “Settled or Won byNPE” to “Dismissed or Lost by NPE”. In the first row of Panel A, we consider the change in R&Dexpense, before and after litigation filing, comparing defendant firms whose cases were “Settled orWon by NPE” with those whose cases were “Dismissed or Lost by NPE”. We compare averageR&D expense spending two years following the litigation filing to average R&D expense spendingtwo years before the litigation filing. Using this difference-in-differences design, we report mean ofChange in R&D (treated) − Change in R&D (untreated). We note that some settlements do notnecessarily involve conditions that could be significantly different from dismissals. Furthermore,a given firm may be sued multiple times in a given year and these cases may end with differentoutcomes. To define the treatment sample cleanly, we assume that a firm can only be grouped intothe treated sample if all the cases against that firm in a given year conclude with “Settled or Wonby NPE” outcomes. These assumptions assure that the effects we document are conservative. InPanel B, Column 3 we test whether the research outputs of the treated and untreated sets weresimilar prior to litigation, i.e. R&D expense change from year t− 3 to t− 2. In the first column ofPanel C, we report the results of the OLS regression in which future R&D Expense (scaled by totalassets) is regressed on a dummy variable that takes a value of 1 if all the cases filed by NPEs againstthe firm in a particular year are settled or won by the NPE. The unit of observation is firm-year.To measure the future R&D Expense, we use average of R&D spending two years following thelitigation. To calculate Citation Commonality, we do the following: First, we count the numberpatents citing a given patent of a firm and the asserted patent of NPE. We then add up the thesefigures for all patents of the firm. Standard errors, clustered by firm, are reported in parentheses.***, **, and * denote statistical significance at the 1, 5, and 10 percent levels.
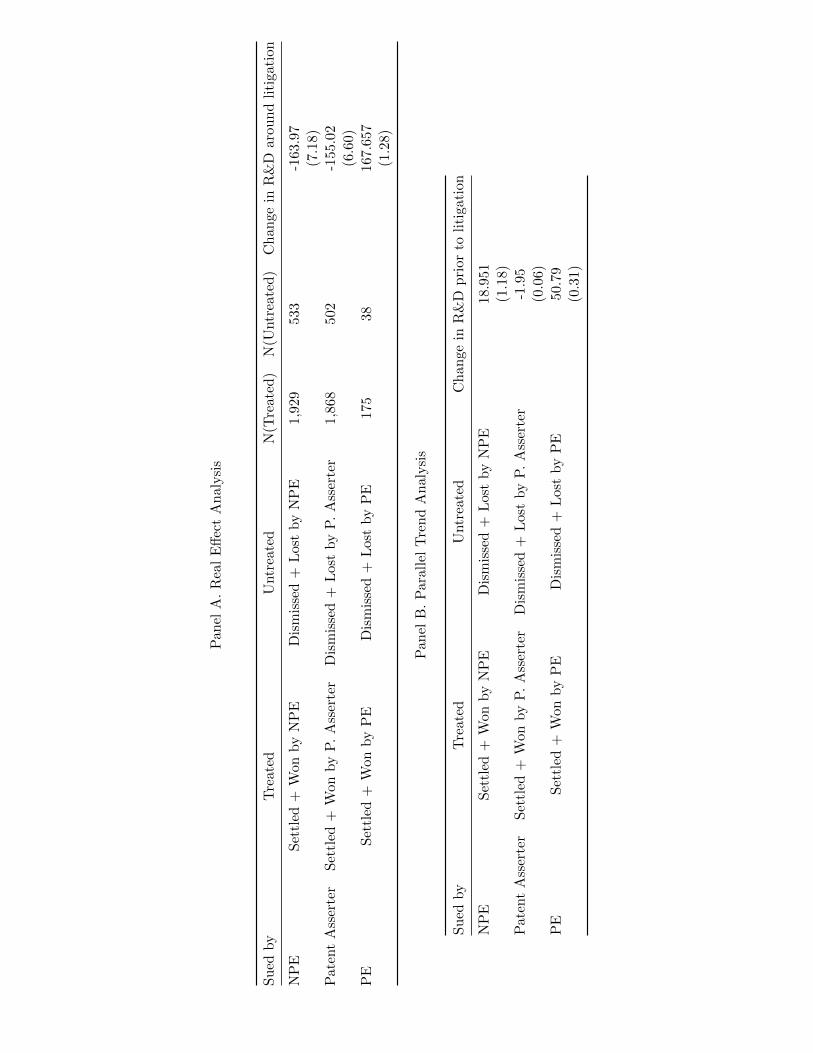
Pan
elA
.R
eal
Eff
ect
An
alysi
s
Su
edby
Tre
ated
Untr
eate
dN
(Tre
ated
)N
(Untr
eate
d)
Ch
an
ge
inR
&D
aro
un
dli
tigati
on
NP
ES
ettl
ed+
Won
by
NP
ED
ism
isse
d+
Los
tby
NP
E1,
929
533
-163.9
7(7
.18)
Pat
ent
Ass
erte
rS
ettl
ed+
Won
by
P.
Ass
erte
rD
ism
isse
d+
Los
tby
P.
Ass
erte
r1,
868
502
-155.0
2(6
.60)
PE
Set
tled
+W
on
by
PE
Dis
mis
sed
+L
ost
by
PE
175
38
167.6
57
(1.2
8)
Pan
elB
.P
aral
lel
Tre
nd
An
alysi
s
Su
edby
Tre
ate
dU
ntr
eate
dC
han
gein
R&
Dp
rior
toli
tigati
on
NP
ES
ettl
ed+
Won
by
NP
ED
ism
isse
d+
Los
tby
NP
E18.9
51
(1.1
8)
Pat
ent
Ass
erte
rS
ettl
ed+
Won
by
P.
Ass
erte
rD
ism
isse
d+
Los
tby
P.
Ass
erte
r-1
.95
(0.0
6)
PE
Set
tled
+W
on
by
PE
Dis
mis
sed
+L
ost
by
PE
50.7
9(0
.31)
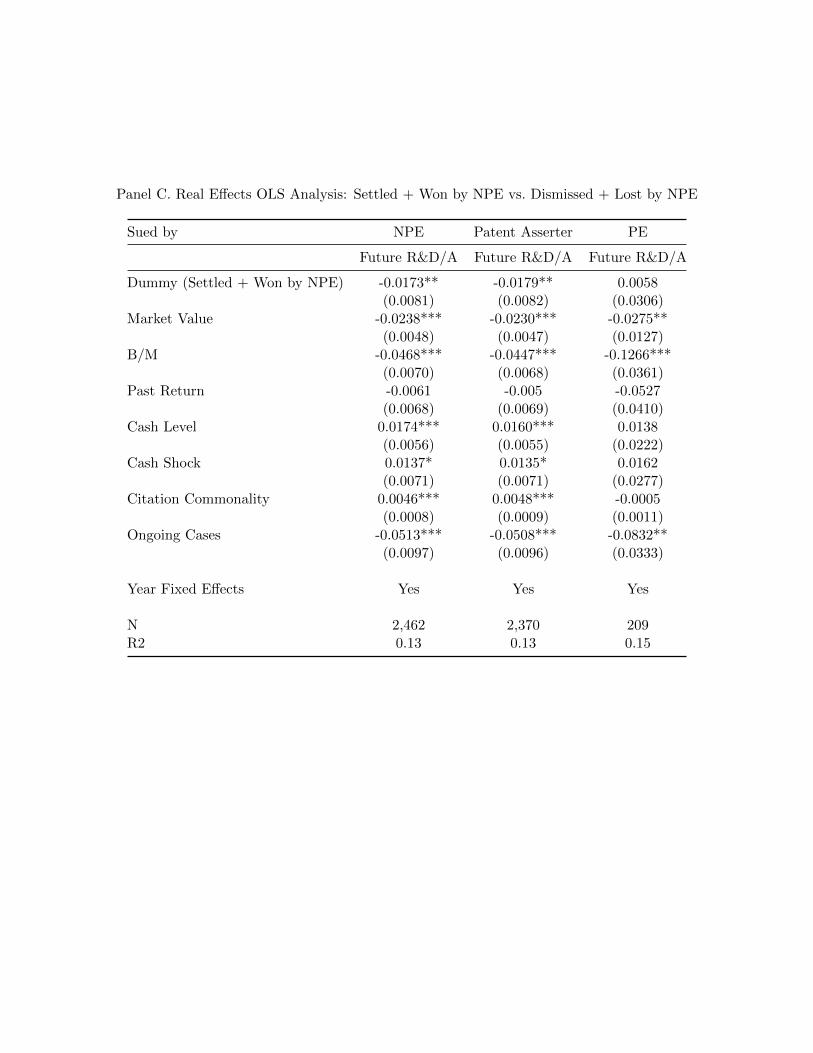
Panel C. Real Effects OLS Analysis: Settled + Won by NPE vs. Dismissed + Lost by NPE
Sued by NPE Patent Asserter PE
Future R&D/A Future R&D/A Future R&D/A
Dummy (Settled + Won by NPE) -0.0173** -0.0179** 0.0058(0.0081) (0.0082) (0.0306)
Market Value -0.0238*** -0.0230*** -0.0275**(0.0048) (0.0047) (0.0127)
B/M -0.0468*** -0.0447*** -0.1266***(0.0070) (0.0068) (0.0361)
Past Return -0.0061 -0.005 -0.0527(0.0068) (0.0069) (0.0410)
Cash Level 0.0174*** 0.0160*** 0.0138(0.0056) (0.0055) (0.0222)
Cash Shock 0.0137* 0.0135* 0.0162(0.0071) (0.0071) (0.0277)
Citation Commonality 0.0046*** 0.0048*** -0.0005(0.0008) (0.0009) (0.0011)
Ongoing Cases -0.0513*** -0.0508*** -0.0832**(0.0097) (0.0096) (0.0333)
Year Fixed Effects Yes Yes Yes
N 2,462 2,370 209R2 0.13 0.13 0.15
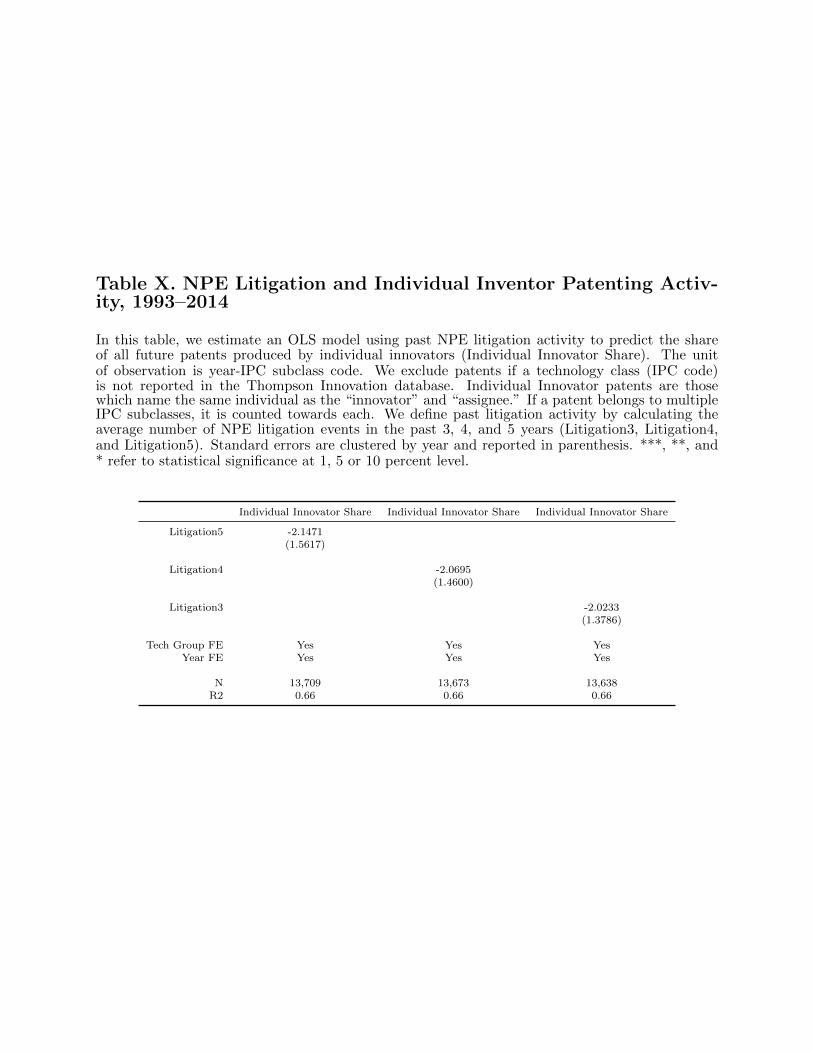
Table X. NPE Litigation and Individual Inventor Patenting Activ-ity, 1993–2014
In this table, we estimate an OLS model using past NPE litigation activity to predict the shareof all future patents produced by individual innovators (Individual Innovator Share). The unitof observation is year-IPC subclass code. We exclude patents if a technology class (IPC code)is not reported in the Thompson Innovation database. Individual Innovator patents are thosewhich name the same individual as the “innovator” and “assignee.” If a patent belongs to multipleIPC subclasses, it is counted towards each. We define past litigation activity by calculating theaverage number of NPE litigation events in the past 3, 4, and 5 years (Litigation3, Litigation4,and Litigation5). Standard errors are clustered by year and reported in parenthesis. ***, **, and* refer to statistical significance at 1, 5 or 10 percent level.
Individual Innovator Share Individual Innovator Share Individual Innovator Share
Litigation5 -2.1471(1.5617)
Litigation4 -2.0695(1.4600)
Litigation3 -2.0233(1.3786)
Tech Group FE Yes Yes YesYear FE Yes Yes Yes
N 13,709 13,673 13,638R2 0.66 0.66 0.66
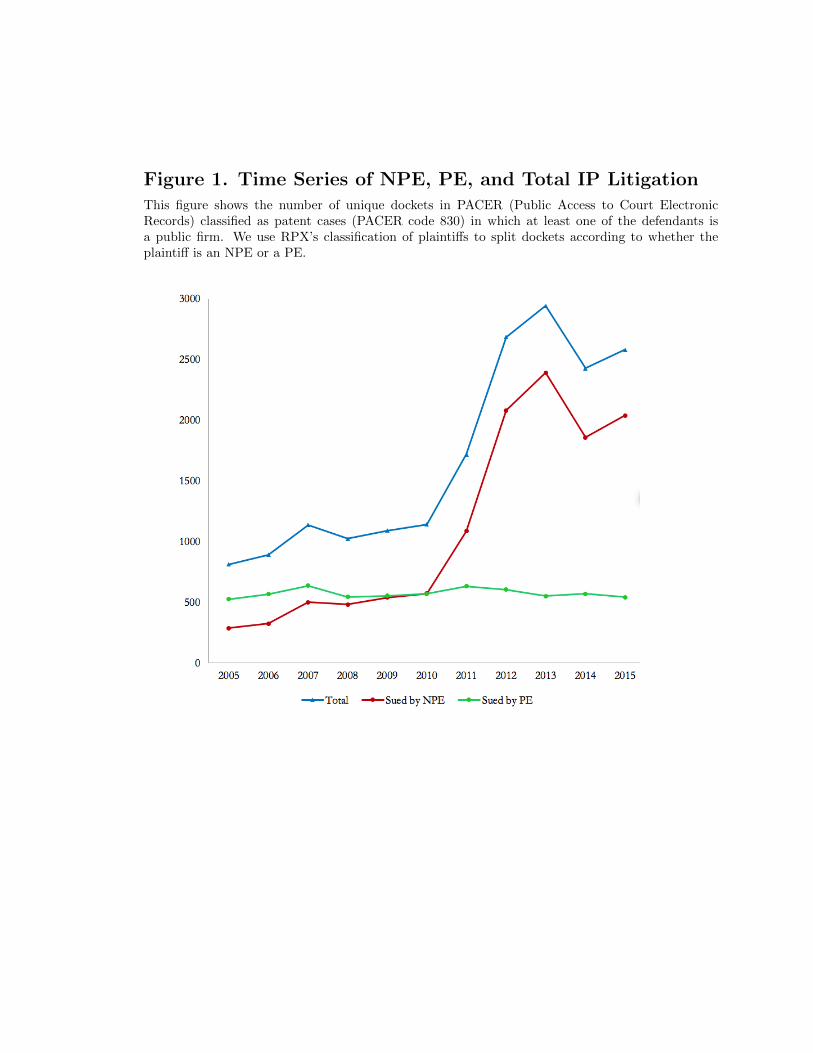
Figure 1. Time Series of NPE, PE, and Total IP LitigationThis figure shows the number of unique dockets in PACER (Public Access to Court ElectronicRecords) classified as patent cases (PACER code 830) in which at least one of the defendants isa public firm. We use RPX’s classification of plaintiffs to split dockets according to whether theplaintiff is an NPE or a PE.
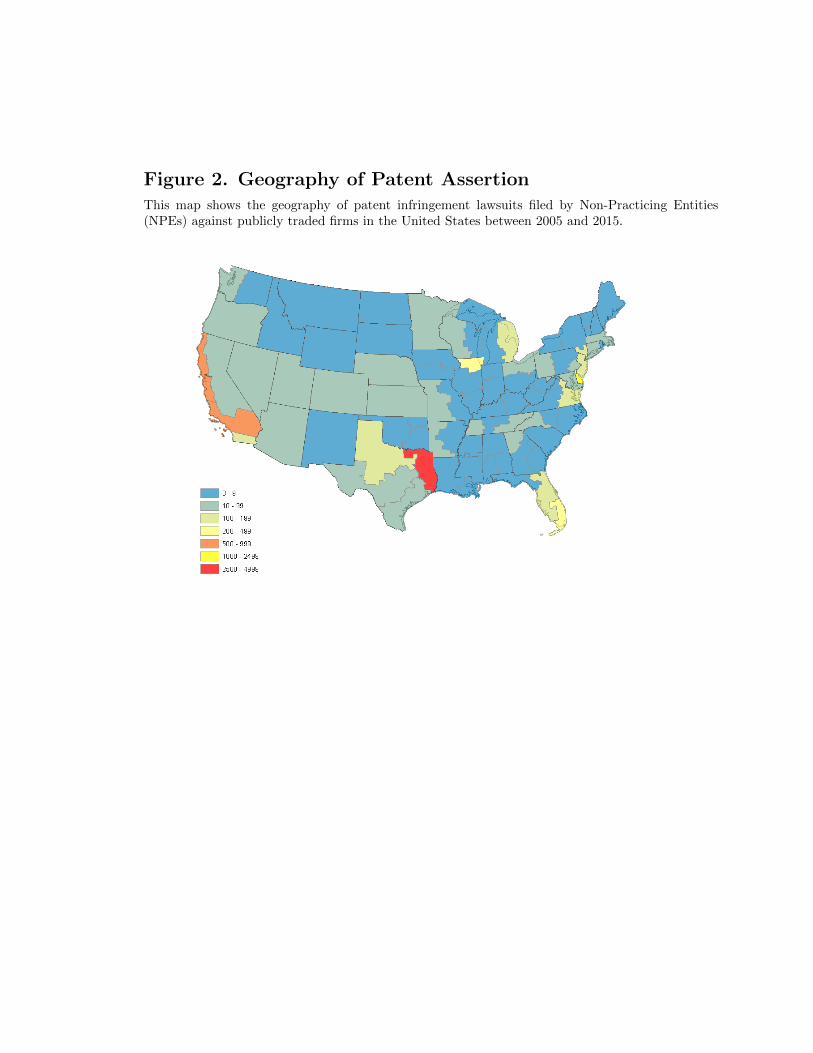
Figure 2. Geography of Patent AssertionThis map shows the geography of patent infringement lawsuits filed by Non-Practicing Entities(NPEs) against publicly traded firms in the United States between 2005 and 2015.
Appendix – Patent Trolls: Evidence
from Targeted Firms
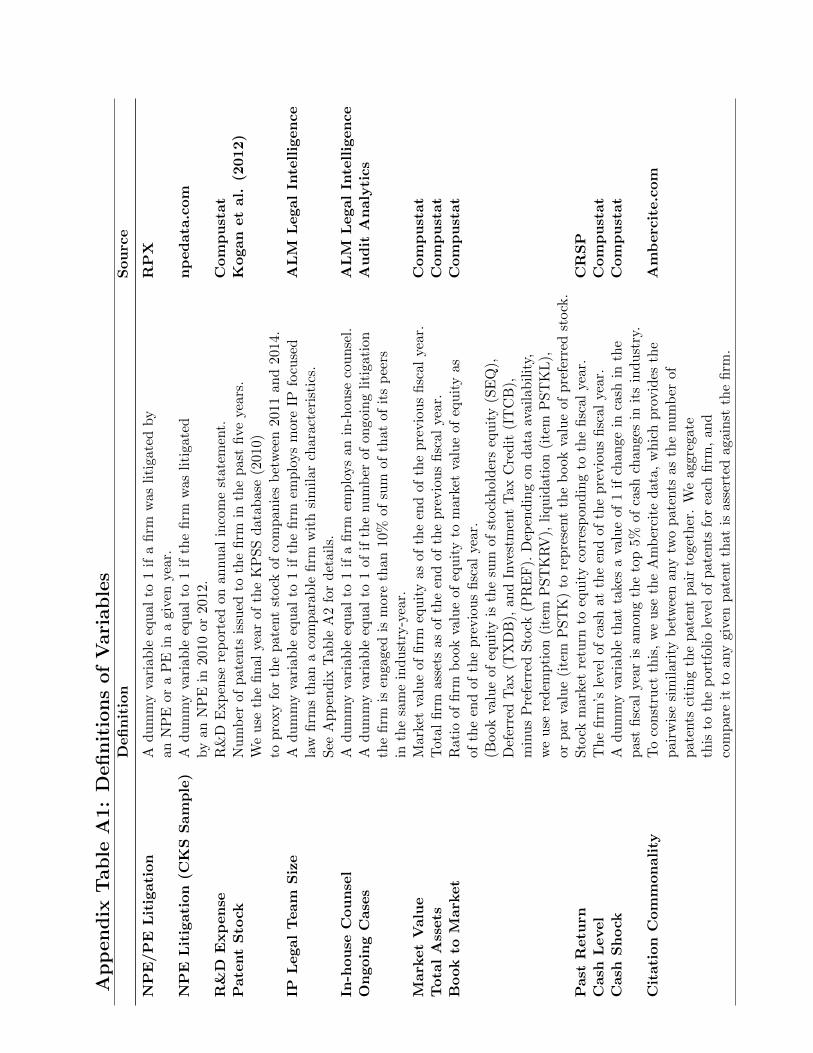
Ap
pen
dix
Tab
leA
1:
Defi
nit
ion
sof
Vari
ab
les
Defi
nit
ion
Sou
rce
NP
E/P
EL
itig
ati
on
Ad
um
my
vari
able
equ
alto
1if
afi
rmw
as
liti
gate
dby
RP
Xan
NP
Eor
aP
Ein
agi
ven
year
.N
PE
Lit
igati
on
(CK
SS
am
ple
)A
du
mm
yva
riab
leeq
ual
to1
ifth
efi
rmw
as
liti
gate
dn
ped
ata
.com
by
anN
PE
in20
10or
2012
.R
&D
Exp
en
seR
&D
Exp
ense
rep
orte
don
annu
alin
com
est
ate
men
t.C
om
pu
stat
Pate
nt
Sto
ckN
um
ber
ofp
aten
tsis
sued
toth
efi
rmin
the
past
five
years
.K
ogan
et
al.
(2012)
We
use
the
fin
alye
arof
the
KP
SS
dat
abase
(2010)
top
roxy
for
the
pat
ent
stock
ofco
mp
anie
sb
etw
een
2011
an
d2014.
IPL
egal
Team
Siz
eA
du
mm
yva
riab
leeq
ual
to1
ifth
efi
rmem
plo
ys
more
IPfo
cuse
dA
LM
Legal
Inte
llig
en
ce
law
firm
sth
ana
com
par
able
firm
wit
hsi
mil
ar
chara
cter
isti
cs.
See
Ap
pen
dix
Tab
leA
2fo
rd
etai
ls.
In-h
ou
seC
ou
nse
lA
du
mm
yva
riab
leeq
ual
to1
ifa
firm
emp
loys
an
in-h
ou
seco
un
sel.
AL
ML
egal
Inte
llig
en
ce
On
goin
gC
ase
sA
du
mm
yva
riab
leeq
ual
to1
ofif
the
nu
mb
erof
on
goin
gli
tigati
on
Au
dit
An
aly
tics
the
firm
isen
gage
dis
mor
eth
an10
%of
sum
of
that
of
its
pee
rsin
the
sam
ein
du
stry
-yea
r.M
ark
et
Valu
eM
arke
tva
lue
offirm
equ
ity
asof
the
end
of
the
pre
vio
us
fisc
al
year.
Com
pu
stat
Tota
lA
ssets
Tot
alfi
rmas
sets
asof
the
end
ofth
ep
revio
us
fisc
al
yea
r.C
om
pu
stat
Book
toM
ark
et
Rat
ioof
firm
book
valu
eof
equ
ity
tom
arke
tva
lue
of
equ
ity
as
Com
pu
stat
ofth
een
dof
the
pre
vio
us
fisc
alye
ar.
(Book
valu
eof
equ
ity
isth
esu
mof
stock
hold
ers
equ
ity
(SE
Q),
Def
erre
dT
ax(T
XD
B),
and
Inve
stm
ent
Tax
Cre
dit
(IT
CB
),m
inu
sP
refe
rred
Sto
ck(P
RE
F).
Dep
end
ing
on
data
avail
ab
ilit
y,w
eu
sere
dem
pti
on(i
tem
PS
TK
RV
),li
qu
idati
on
(ite
mP
ST
KL
),or
par
valu
e(i
tem
PS
TK
)to
rep
rese
nt
the
book
valu
eof
pre
ferr
edst
ock
.P
ast
Retu
rnS
tock
mar
ket
retu
rnto
equ
ity
corr
esp
ond
ing
toth
efisc
al
year.
CR
SP
Cash
Level
Th
efi
rm’s
leve
lof
cash
atth
een
dof
the
pre
vio
us
fisc
al
year.
Com
pu
stat
Cash
Sh
ock
Ad
um
my
vari
able
that
take
sa
valu
eof
1if
chan
ge
inca
shin
the
Com
pu
stat
pas
tfi
scal
year
isam
ong
the
top
5%of
cash
chan
ges
init
sin
du
stry
.C
itati
on
Com
mon
ali
tyT
oco
nst
ruct
this
,w
eu
seth
eA
mb
erci
ted
ata
,w
hic
hp
rovid
esth
eA
mb
erc
ite.c
om
pai
rwis
esi
mil
arit
yb
etw
een
any
two
pat
ents
as
the
nu
mb
erof
pat
ents
citi
ng
the
pat
ent
pai
rto
geth
er.
We
aggre
gate
this
toth
ep
ortf
olio
leve
lof
pat
ents
for
each
firm
,an
dco
mp
are
itto
any
given
pat
ent
that
isass
erte
dagain
stth
efi
rm.
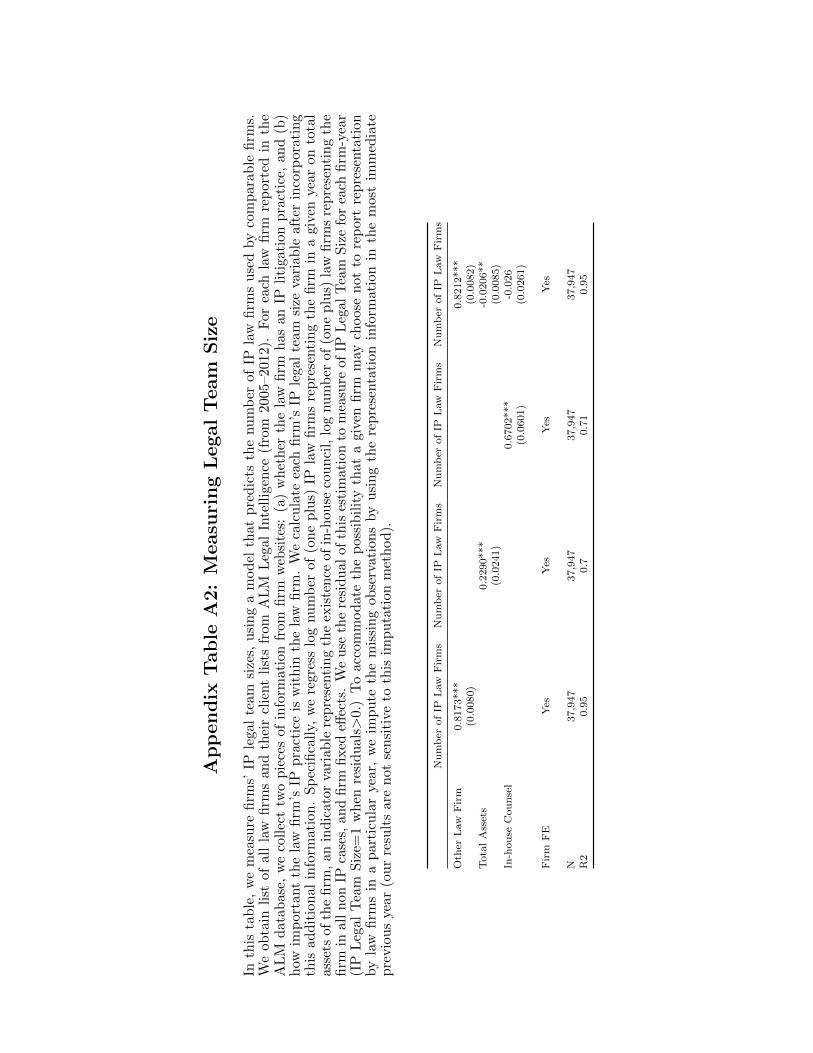
Ap
pen
dix
Tab
leA
2:
Measu
rin
gL
egal
Team
Siz
e
Inth
ista
ble
,w
em
easu
refi
rms’
IPle
gal
team
size
s,u
sing
am
od
elth
atp
red
icts
the
nu
mb
erof
IPla
wfi
rms
use
dby
com
para
ble
firm
s.W
eob
tain
list
ofall
law
firm
san
dth
eir
clie
nt
list
sfr
omA
LM
Leg
alIn
tell
igen
ce(f
rom
2005
–201
2).
For
each
law
firm
rep
ort
edin
the
AL
Md
atab
ase
,w
eco
llec
ttw
op
iece
sof
info
rmat
ion
from
firm
web
site
s:(a
)w
het
her
the
law
firm
has
an
IPli
tigati
on
pra
ctic
e,an
d(b
)h
owim
por
tant
the
law
firm
’sIP
pra
ctic
eis
wit
hin
the
law
firm
.W
eca
lcu
late
each
firm
’sIP
lega
lte
am
size
vari
ab
leaft
erin
corp
ora
tin
gth
isad
dit
ional
info
rmati
on.
Sp
ecifi
call
y,w
ere
gres
slo
gnu
mb
erof
(on
ep
lus)
IPla
wfi
rms
rep
rese
nti
ng
the
firm
ina
giv
enyea
ron
tota
lass
ets
of
the
firm
,an
ind
icat
or
vari
able
rep
rese
nti
ng
the
exis
ten
ceof
in-h
ouse
cou
nci
l,lo
gnu
mb
erof
(on
ep
lus)
law
firm
sre
pre
senti
ng
the
firm
inall
non
IPca
ses,
and
firm
fixed
effec
ts.
We
use
the
resi
du
alof
this
esti
mat
ion
tom
easu
reof
IPL
egal
Tea
mS
ize
for
each
firm
-yea
r(I
PL
egal
Tea
mS
ize=
1w
hen
resi
du
als>
0.)
To
acco
mm
od
ate
the
pos
sib
ilit
yth
ata
give
nfi
rmm
aych
oose
not
tore
port
rep
rese
nta
tion
by
law
firm
sin
ap
arti
cula
rye
ar,
we
imp
ute
the
mis
sin
gob
serv
atio
ns
by
usi
ng
the
rep
rese
nta
tion
info
rmati
on
inth
em
ost
imm
edia
tep
revio
us
year
(ou
rre
sult
sare
not
sen
siti
veto
this
imp
uta
tion
met
hod
).
Nu
mb
erof
IPL
aw
Fir
ms
Nu
mb
erof
IPL
aw
Fir
ms
Nu
mb
erof
IPL
aw
Fir
ms
Nu
mb
erof
IPL
aw
Fir
ms
Oth
erL
aw
Fir
m0.8
173***
0.8
212***
(0.0
080)
(0.0
082)
Tota
lA
sset
s0.2
290***
-0.0
206**
(0.0
241)
(0.0
085)
In-h
ou
seC
ou
nse
l0.6
702***
-0.0
26
(0.0
601)
(0.0
261)
Fir
mF
EY
esY
esY
esY
es
N37,9
47
37,9
47
37,9
47
37,9
47
R2
0.9
50.7
0.7
10.9
5
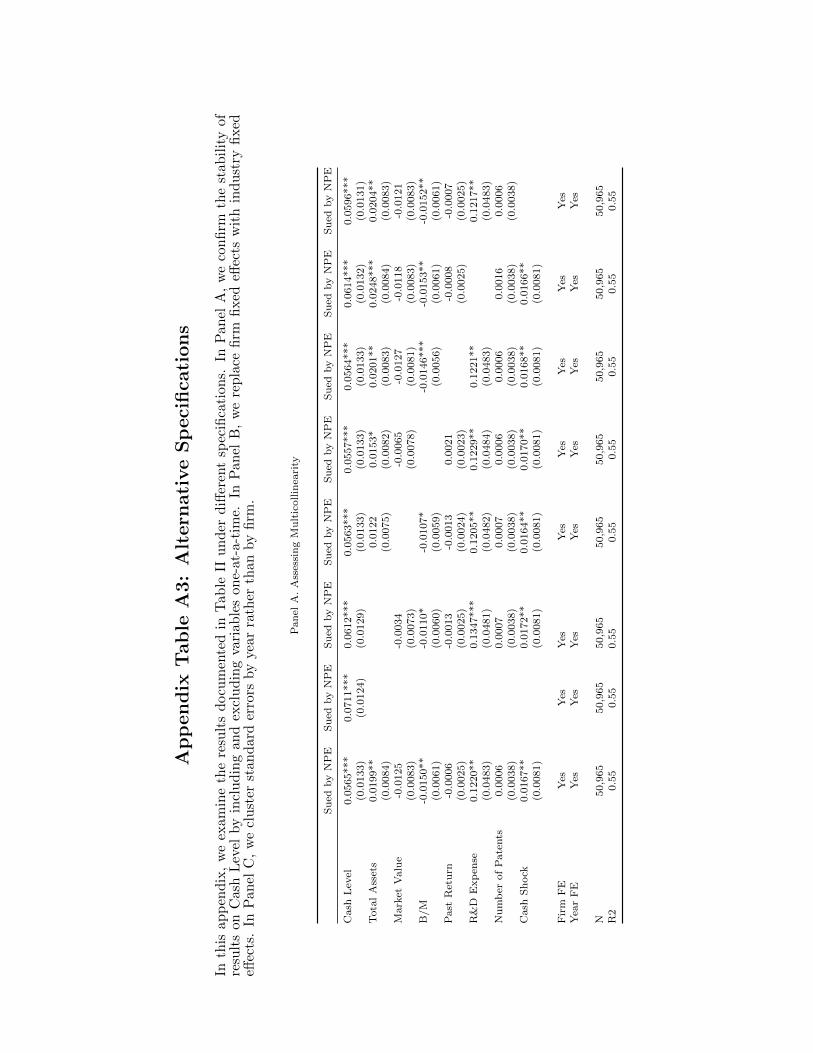
Ap
pen
dix
Tab
leA
3:
Alt
ern
ati
ve
Sp
eci
fica
tion
s
Inth
isap
pen
dix
,w
eex
amin
eth
ere
sult
sd
ocu
men
ted
inT
able
IIu
nd
erd
iffer
ent
spec
ifica
tion
s.In
Pan
elA
,w
eco
nfirm
the
stab
ilit
yof
resu
lts
onC
ash
Lev
elby
incl
ud
ing
and
excl
ud
ing
vari
able
son
e-at
-a-t
ime.
InP
anel
B,
we
rep
lace
firm
fixed
effec
tsw
ith
ind
ust
ryfi
xed
effec
ts.
InP
anel
C,
we
clu
ster
stan
dard
erro
rsby
year
rath
erth
anby
firm
.
Pan
elA
.A
sses
sin
gM
ult
icollin
eari
ty
Su
edby
NP
ES
ued
by
NP
ES
ued
by
NP
ES
ued
by
NP
ES
ued
by
NP
ES
ued
by
NP
ES
ued
by
NP
ES
ued
by
NP
E
Cash
Lev
el0.0
565***
0.0
711***
0.0
612***
0.0
563***
0.0
557***
0.0
564***
0.0
614***
0.0
596***
(0.0
133)
(0.0
124)
(0.0
129)
(0.0
133)
(0.0
133)
(0.0
133)
(0.0
132)
(0.0
131)
Tota
lA
sset
s0.0
199**
0.0
122
0.0
153*
0.0
201**
0.0
248***
0.0
204**
(0.0
084)
(0.0
075)
(0.0
082)
(0.0
083)
(0.0
084)
(0.0
083)
Mark
etV
alu
e-0
.0125
-0.0
034
-0.0
065
-0.0
127
-0.0
118
-0.0
121
(0.0
083)
(0.0
073)
(0.0
078)
(0.0
081)
(0.0
083)
(0.0
083)
B/M
-0.0
150**
-0.0
110*
-0.0
107*
-0.0
146***
-0.0
153**
-0.0
152**
(0.0
061)
(0.0
060)
(0.0
059)
(0.0
056)
(0.0
061)
(0.0
061)
Past
Ret
urn
-0.0
006
-0.0
013
-0.0
013
0.0
021
-0.0
008
-0.0
007
(0.0
025)
(0.0
025)
(0.0
024)
(0.0
023)
(0.0
025)
(0.0
025)
R&
DE
xp
ense
0.1
220**
0.1
347***
0.1
205**
0.1
229**
0.1
221**
0.1
217**
(0.0
483)
(0.0
481)
(0.0
482)
(0.0
484)
(0.0
483)
(0.0
483)
Nu
mb
erof
Pate
nts
0.0
006
0.0
007
0.0
007
0.0
006
0.0
006
0.0
016
0.0
006
(0.0
038)
(0.0
038)
(0.0
038)
(0.0
038)
(0.0
038)
(0.0
038)
(0.0
038)
Cash
Sh
ock
0.0
167**
0.0
172**
0.0
164**
0.0
170**
0.0
168**
0.0
166**
(0.0
081)
(0.0
081)
(0.0
081)
(0.0
081)
(0.0
081)
(0.0
081)
Fir
mF
EY
esY
esY
esY
esY
esY
esY
esY
esY
ear
FE
Yes
Yes
Yes
Yes
Yes
Yes
Yes
Yes
N50,9
65
50,9
65
50,9
65
50,9
65
50,9
65
50,9
65
50,9
65
50,9
65
R2
0.5
50.5
50.5
50.5
50.5
50.5
50.5
50.5
5
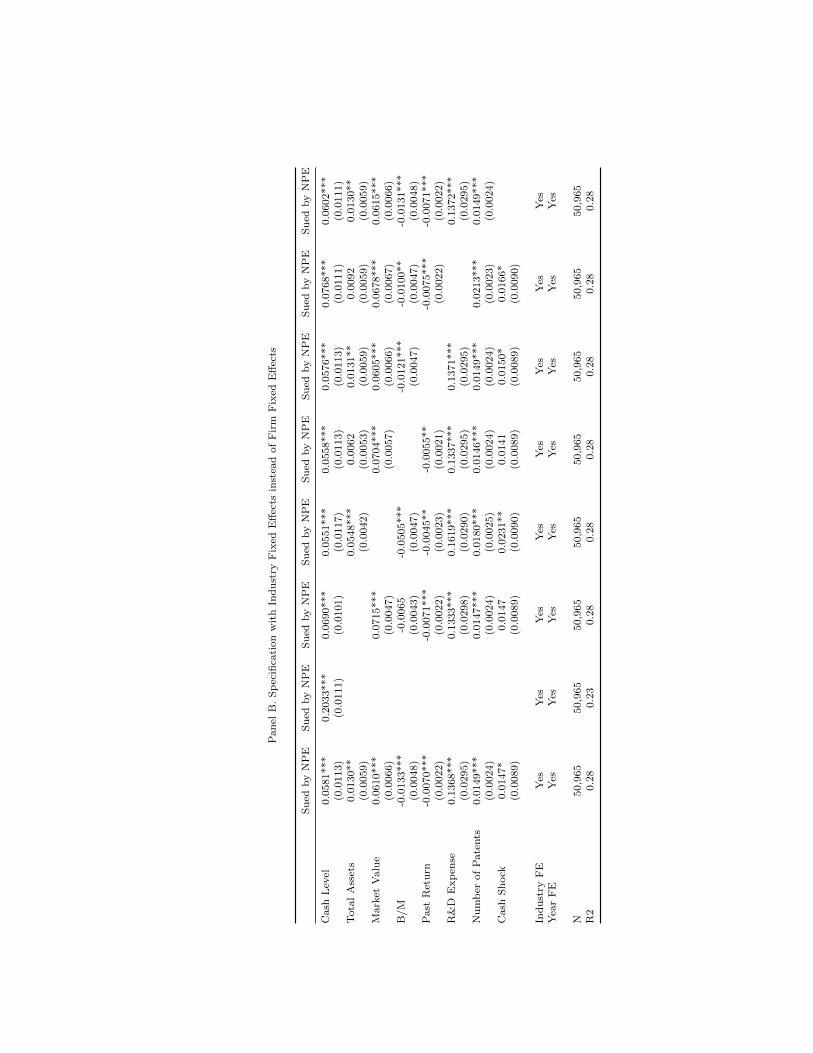
Pan
elB
.S
pec
ifica
tion
wit
hIn
du
stry
Fix
edE
ffec
tsin
stea
dof
Fir
mF
ixed
Eff
ects
Su
edby
NP
ES
ued
by
NP
ES
ued
by
NP
ES
ued
by
NP
ES
ued
by
NP
ES
ued
by
NP
ES
ued
by
NP
ES
ued
by
NP
E
Cash
Lev
el0.0
581***
0.2
033***
0.0
690***
0.0
551***
0.0
558***
0.0
576***
0.0
768***
0.0
602***
(0.0
113)
(0.0
111)
(0.0
101)
(0.0
117)
(0.0
113)
(0.0
113)
(0.0
111)
(0.0
111)
Tota
lA
sset
s0.0
130**
0.0
548***
0.0
062
0.0
131**
0.0
092
0.0
130**
(0.0
059)
(0.0
042)
(0.0
053)
(0.0
059)
(0.0
059)
(0.0
059)
Mark
etV
alu
e0.0
610***
0.0
715***
0.0
704***
0.0
605***
0.0
678***
0.0
615***
(0.0
066)
(0.0
047)
(0.0
057)
(0.0
066)
(0.0
067)
(0.0
066)
B/M
-0.0
133***
-0.0
065
-0.0
505***
-0.0
121***
-0.0
100**
-0.0
131***
(0.0
048)
(0.0
043)
(0.0
047)
(0.0
047)
(0.0
047)
(0.0
048)
Past
Ret
urn
-0.0
070***
-0.0
071***
-0.0
045**
-0.0
055**
-0.0
075***
-0.0
071***
(0.0
022)
(0.0
022)
(0.0
023)
(0.0
021)
(0.0
022)
(0.0
022)
R&
DE
xp
ense
0.1
368***
0.1
333***
0.1
619***
0.1
337***
0.1
371***
0.1
372***
(0.0
295)
(0.0
298)
(0.0
290)
(0.0
295)
(0.0
295)
(0.0
295)
Nu
mb
erof
Pate
nts
0.0
149***
0.0
147***
0.0
180***
0.0
146***
0.0
149***
0.0
213***
0.0
149***
(0.0
024)
(0.0
024)
(0.0
025)
(0.0
024)
(0.0
024)
(0.0
023)
(0.0
024)
Cash
Sh
ock
0.0
147*
0.0
147
0.0
231**
0.0
141
0.0
150*
0.0
166*
(0.0
089)
(0.0
089)
(0.0
090)
(0.0
089)
(0.0
089)
(0.0
090)
Ind
ust
ryF
EY
esY
esY
esY
esY
esY
esY
esY
esY
ear
FE
Yes
Yes
Yes
Yes
Yes
Yes
Yes
Yes
N50,9
65
50,9
65
50,9
65
50,9
65
50,9
65
50,9
65
50,9
65
50,9
65
R2
0.2
80.2
30.2
80.2
80.2
80.2
80.2
80.2
8
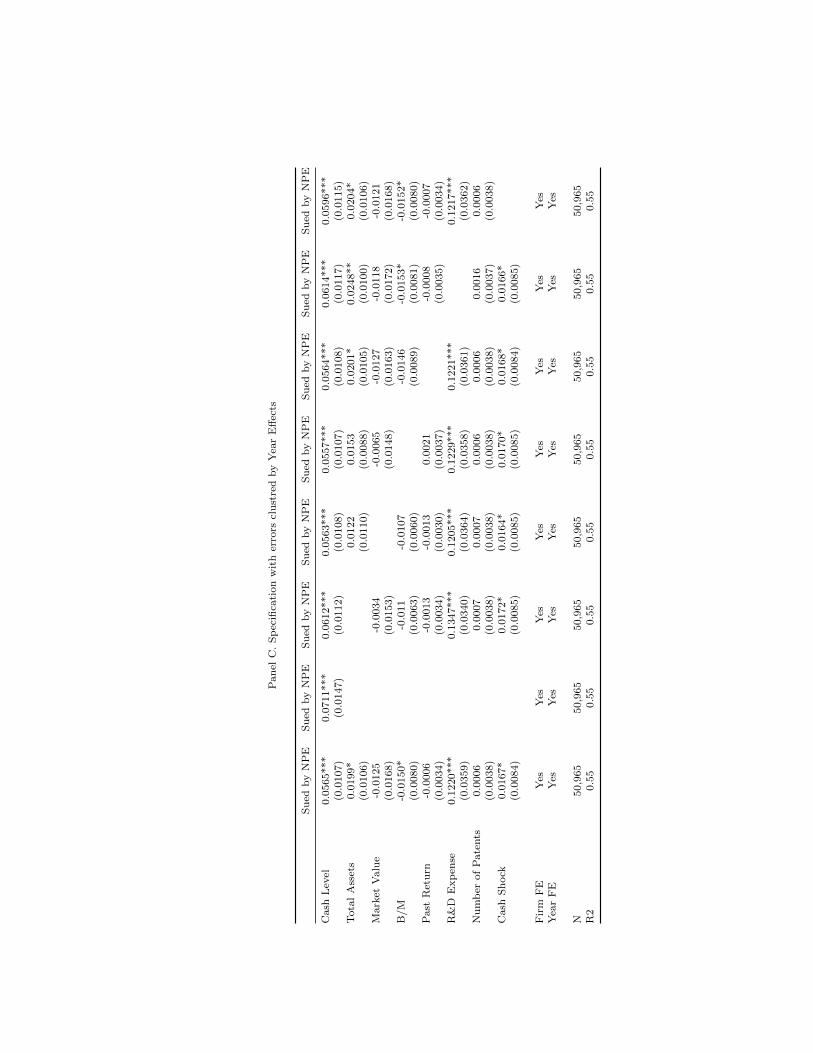
Pan
elC
.S
pec
ifica
tion
wit
her
rors
clu
stre
dby
Yea
rE
ffec
ts
Su
edby
NP
ES
ued
by
NP
ES
ued
by
NP
ES
ued
by
NP
ES
ued
by
NP
ES
ued
by
NP
ES
ued
by
NP
ES
ued
by
NP
E
Cash
Lev
el0.0
565***
0.0
711***
0.0
612***
0.0
563***
0.0
557***
0.0
564***
0.0
614***
0.0
596***
(0.0
107)
(0.0
147)
(0.0
112)
(0.0
108)
(0.0
107)
(0.0
108)
(0.0
117)
(0.0
115)
Tota
lA
sset
s0.0
199*
0.0
122
0.0
153
0.0
201*
0.0
248**
0.0
204*
(0.0
106)
(0.0
110)
(0.0
088)
(0.0
105)
(0.0
100)
(0.0
106)
Mark
etV
alu
e-0
.0125
-0.0
034
-0.0
065
-0.0
127
-0.0
118
-0.0
121
(0.0
168)
(0.0
153)
(0.0
148)
(0.0
163)
(0.0
172)
(0.0
168)
B/M
-0.0
150*
-0.0
11
-0.0
107
-0.0
146
-0.0
153*
-0.0
152*
(0.0
080)
(0.0
063)
(0.0
060)
(0.0
089)
(0.0
081)
(0.0
080)
Past
Ret
urn
-0.0
006
-0.0
013
-0.0
013
0.0
021
-0.0
008
-0.0
007
(0.0
034)
(0.0
034)
(0.0
030)
(0.0
037)
(0.0
035)
(0.0
034)
R&
DE
xp
ense
0.1
220***
0.1
347***
0.1
205***
0.1
229***
0.1
221***
0.1
217***
(0.0
359)
(0.0
340)
(0.0
364)
(0.0
358)
(0.0
361)
(0.0
362)
Nu
mb
erof
Pate
nts
0.0
006
0.0
007
0.0
007
0.0
006
0.0
006
0.0
016
0.0
006
(0.0
038)
(0.0
038)
(0.0
038)
(0.0
038)
(0.0
038)
(0.0
037)
(0.0
038)
Cash
Sh
ock
0.0
167*
0.0
172*
0.0
164*
0.0
170*
0.0
168*
0.0
166*
(0.0
084)
(0.0
085)
(0.0
085)
(0.0
085)
(0.0
084)
(0.0
085)
Fir
mF
EY
esY
esY
esY
esY
esY
esY
esY
esY
ear
FE
Yes
Yes
Yes
Yes
Yes
Yes
Yes
Yes
N50,9
65
50,9
65
50,9
65
50,9
65
50,9
65
50,9
65
50,9
65
50,9
65
R2
0.5
50.5
50.5
50.5
50.5
50.5
50.5
50.5
5
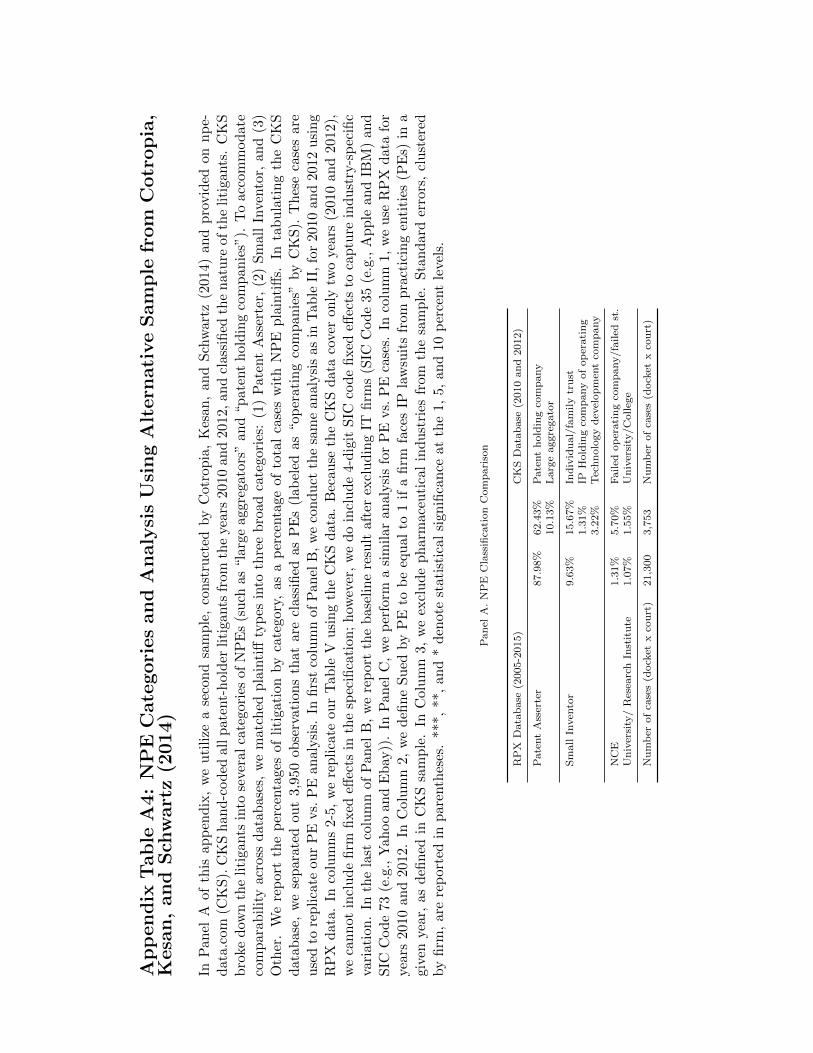
Ap
pen
dix
Tab
leA
4:
NP
EC
ate
gori
es
an
dA
naly
sis
Usi
ng
Alt
ern
ati
ve
Sam
ple
from
Cotr
op
ia,
Kesa
n,
an
dS
chw
art
z(2
014)
InP
anel
Aof
this
ap
pen
dix
,w
eu
tili
zea
seco
nd
sam
ple
,co
nst
ruct
edby
Cot
rop
ia,
Kes
an,
and
Sch
wart
z(2
014)
an
dp
rovid
edon
np
e-d
ata.c
om(C
KS
).C
KS
han
d-c
od
edall
pat
ent-
hol
der
liti
gants
from
the
year
s20
10an
d20
12,
and
clas
sifi
edth
en
atu
reof
the
liti
gants
.C
KS
bro
ked
own
the
liti
gants
into
seve
ral
cate
gor
ies
ofN
PE
s(s
uch
as“l
arge
aggr
egat
ors”
and
“pat
ent
hold
ing
com
pan
ies”
).T
oacc
om
mod
ate
com
para
bil
ity
acro
ssd
ata
bas
es,
we
mat
ched
pla
inti
ffty
pes
into
thre
eb
road
cate
gori
es:
(1)
Pat
ent
Ass
erte
r,(2
)S
mall
Inve
nto
r,an
d(3
)O
ther
.W
ere
port
the
per
centa
ges
of
liti
gat
ion
by
cate
gory
,as
ap
erce
nta
geof
tota
lca
ses
wit
hN
PE
pla
inti
ffs.
Inta
bu
lati
ng
the
CK
Sd
atab
ase
,w
ese
para
ted
ou
t3,9
50
ob
serv
ati
ons
that
are
clas
sifi
edas
PE
s(l
abel
edas
“op
erat
ing
com
pan
ies”
by
CK
S).
Th
ese
case
sare
use
dto
rep
lica
teou
rP
Evs.
PE
anal
ysi
s.In
firs
tco
lum
nof
Pan
elB
,w
eco
nd
uct
the
sam
ean
alysi
sas
inT
ab
leII
,fo
r2010
an
d2012
usi
ng
RP
Xdat
a.
Inco
lum
ns
2-5,
we
rep
lica
teou
rT
able
Vu
sin
gth
eC
KS
dat
a.B
ecau
seth
eC
KS
dat
aco
ver
on
lytw
oye
ars
(2010
an
d2012),
we
can
not
incl
ud
efi
rmfi
xed
effec
tsin
the
spec
ifica
tion
;h
owev
er,
we
do
incl
ud
e4-
dig
itS
ICco
de
fixed
effec
tsto
cap
ture
ind
ust
ry-s
pec
ific
vari
ati
on.
Inth
ela
stco
lum
nof
Pan
elB
,w
ere
por
tth
eb
asel
ine
resu
ltaf
ter
excl
ud
ing
ITfi
rms
(SIC
Code
35
(e.g
.,A
pp
lean
dIB
M)
an
dS
ICC
od
e73
(e.g
.,Y
ah
oo
and
Ebay
)).
InP
an
elC
,w
ep
erfo
rma
sim
ilar
anal
ysi
sfo
rP
Evs.
PE
case
s.In
colu
mn
1,
we
use
RP
Xd
ata
for
year
s201
0an
d20
12.
InC
olu
mn
2,w
ed
efin
eS
ued
by
PE
tob
eeq
ual
to1
ifa
firm
face
sIP
law
suit
sfr
om
pra
ctic
ing
enti
ties
(PE
s)in
agiv
enyea
r,as
defi
ned
inC
KS
sam
ple
.In
Col
um
n3,
we
excl
ud
ep
har
mac
euti
cal
ind
ust
ries
from
the
sam
ple
.S
tan
dard
erro
rs,
clu
ster
edby
firm
,ar
ere
por
ted
inp
aren
thes
es.
***
,**,
and
*d
enot
est
atis
tica
lsi
gnifi
can
ceat
the
1,5,
and
10p
erce
nt
leve
ls.
Pan
elA
.N
PE
Cla
ssifi
cati
on
Com
pari
son
RP
XD
ata
base
(2005-2
015)
CK
SD
ata
base
(2010
an
d2012)
Pate
nt
Ass
erte
r87.9
8%
62.4
3%
Pate
nt
hold
ing
com
pany
10.1
3%
Larg
eaggre
gato
r
Sm
all
Inven
tor
9.6
3%
15.6
7%
Ind
ivid
ual/
fam
ily
tru
st1.3
1%
IPH
old
ing
com
pany
of
op
erati
ng
3.2
2%
Tec
hn
olo
gy
dev
elop
men
tco
mp
any
NC
E1.3
1%
5.7
0%
Fail
edop
erati
ng
com
pany/fa
iled
st.
Un
iver
sity
/R
esea
rch
Inst
itu
te1.0
7%
1.5
5%
Un
iver
sity
/C
olleg
e
Nu
mb
erof
case
s(d
ock
etx
cou
rt)
21,3
00
3,7
53
Nu
mb
erof
case
s(d
ock
etx
cou
rt)
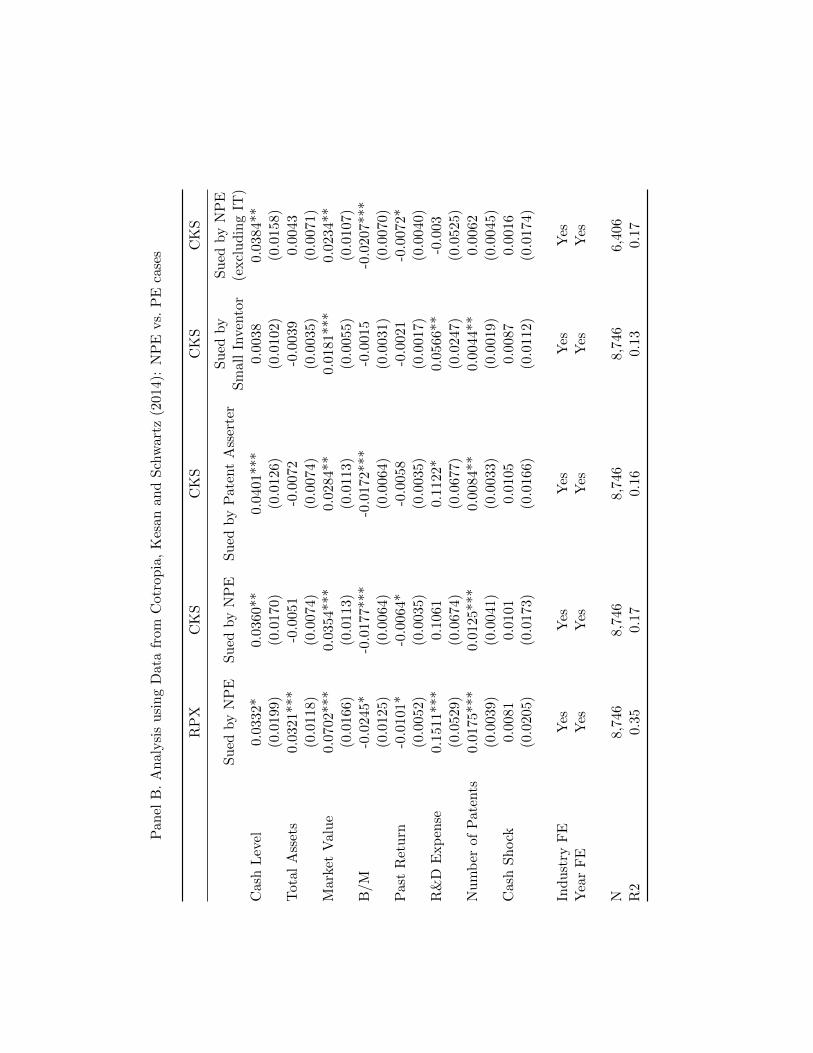
Pan
elB
.A
nal
ysi
su
sin
gD
ata
from
Cot
rop
ia,
Kes
anan
dS
chw
artz
(201
4):
NP
Evs.
PE
case
s
RP
XC
KS
CK
SC
KS
CK
S
Su
edby
NP
ESu
edby
NP
ES
ued
by
Pat
ent
Ass
erte
rS
ued
by
Sm
all
Inve
nto
rS
ued
by
NP
E(e
xcl
ud
ing
IT)
Cash
Lev
el0.
033
2*0.
0360
**0.
0401
***
0.0
038
0.0
384**
(0.0
199
)(0
.017
0)(0
.012
6)(0
.0102
)(0
.0158)
Tot
al
Ass
ets
0.0
321
***
-0.0
051
-0.0
072
-0.0
039
0.0
043
(0.0
118
)(0
.007
4)(0
.007
4)(0
.0035
)(0
.0071)
Mark
etV
alu
e0.0
702
***
0.03
54**
*0.
0284
**0.
018
1***
0.0
234**
(0.0
166
)(0
.011
3)(0
.011
3)(0
.0055
)(0
.0107)
B/M
-0.0
245
*-0
.017
7***
-0.0
172*
**-0
.001
5-0
.0207***
(0.0
125
)(0
.006
4)(0
.006
4)(0
.0031
)(0
.0070)
Past
Ret
urn
-0.0
101*
-0.0
064*
-0.0
058
-0.0
021
-0.0
072*
(0.0
052
)(0
.003
5)(0
.003
5)(0
.0017
)(0
.0040)
R&
DE
xp
ense
0.1
511
***
0.10
610.
1122
*0.0
566
**
-0.0
03
(0.0
529
)(0
.067
4)(0
.067
7)(0
.0247
)(0
.0525)
Nu
mb
erof
Pat
ents
0.0
175
***
0.01
25**
*0.
0084
**0.
004
4**
0.0
062
(0.0
039
)(0
.004
1)(0
.003
3)(0
.0019
)(0
.0045)
Cash
Sh
ock
0.008
10.
0101
0.01
050.0
087
0.0
016
(0.0
205
)(0
.017
3)(0
.016
6)(0
.0112
)(0
.0174)
Ind
ust
ryF
EY
esY
esY
esY
esY
esY
ear
FE
Yes
Yes
Yes
Yes
Yes
N8,7
46
8,74
68,
746
8,746
6,4
06
R2
0.35
0.17
0.16
0.13
0.1
7
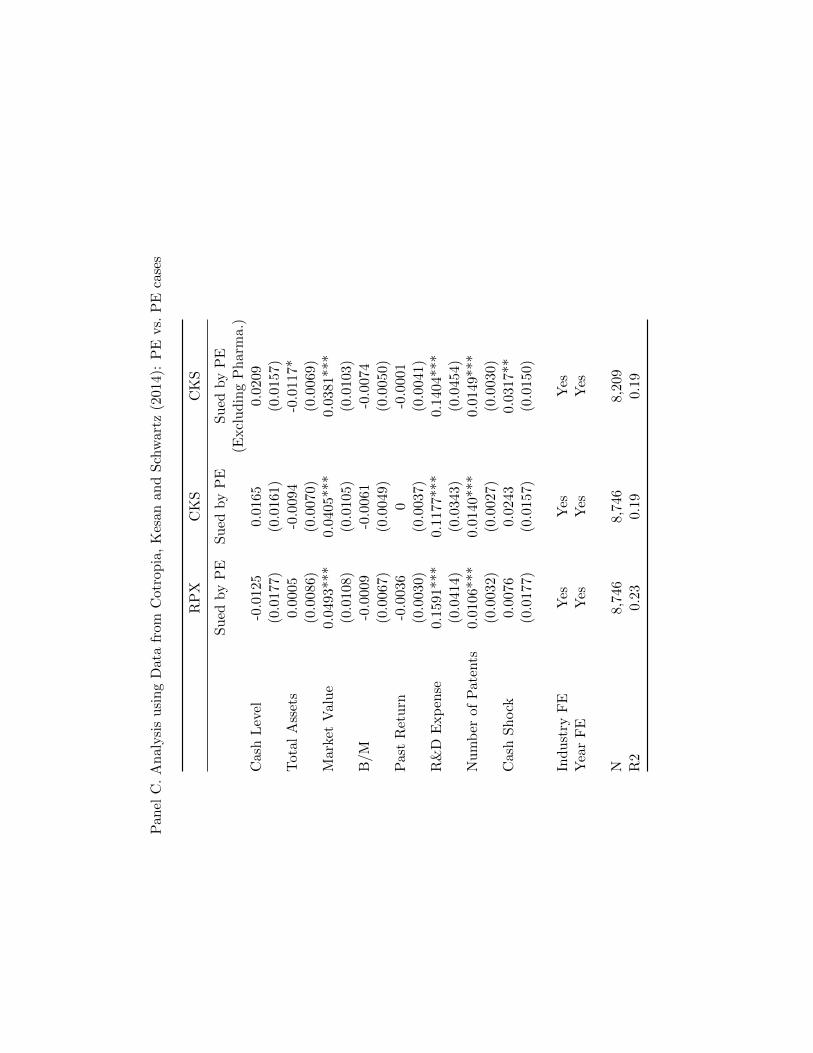
Pan
elC
.A
nal
ysi
su
sin
gD
ata
from
Cot
rop
ia,
Kes
anan
dS
chw
artz
(201
4):
PE
vs.
PE
case
s
RP
XC
KS
CK
S
Su
edby
PE
Sued
by
PE
Su
edby
PE
(Excl
ud
ing
Ph
arm
a.)
Cas
hL
evel
-0.0
125
0.01
650.
0209
(0.0
177)
(0.0
161)
(0.0
157)
Tota
lA
sset
s0.
0005
-0.0
094
-0.0
117*
(0.0
086)
(0.0
070)
(0.0
069)
Mar
ket
Valu
e0.
0493
***
0.04
05**
*0.
0381
***
(0.0
108)
(0.0
105)
(0.0
103)
B/M
-0.0
009
-0.0
061
-0.0
074
(0.0
067)
(0.0
049)
(0.0
050)
Pas
tR
etu
rn-0
.003
60
-0.0
001
(0.0
030)
(0.0
037)
(0.0
041)
R&
DE
xp
ense
0.15
91**
*0.
1177
***
0.14
04**
*(0
.041
4)(0
.034
3)(0
.045
4)N
um
ber
ofP
ate
nts
0.01
06**
*0.
0140
***
0.01
49**
*(0
.003
2)(0
.002
7)(0
.003
0)C
ash
Sh
ock
0.00
760.
0243
0.03
17**
(0.0
177)
(0.0
157)
(0.0
150)
Ind
ust
ryF
EY
esY
esY
esY
ear
FE
Yes
Yes
Yes
N8,
746
8,74
68,
209
R2
0.23
0.19
0.19
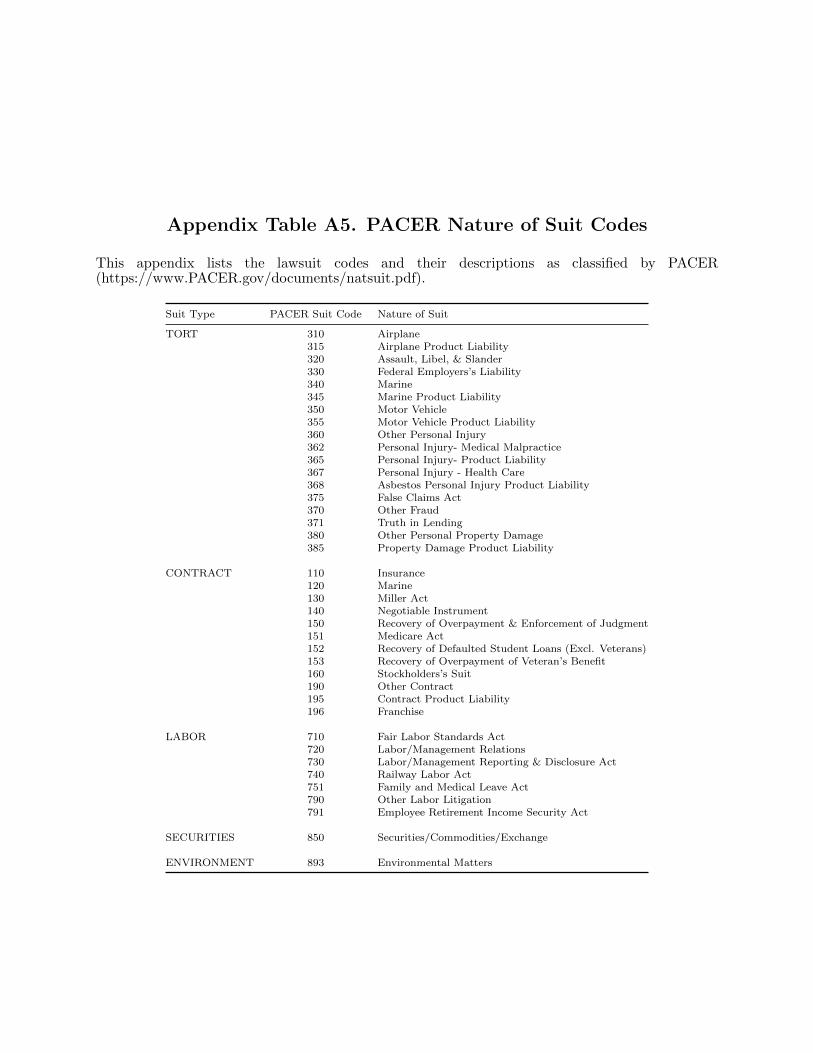
Appendix Table A5. PACER Nature of Suit Codes
This appendix lists the lawsuit codes and their descriptions as classified by PACER(https://www.PACER.gov/documents/natsuit.pdf).
Suit Type PACER Suit Code Nature of Suit
TORT 310 Airplane315 Airplane Product Liability320 Assault, Libel, & Slander330 Federal Employers’s Liability340 Marine345 Marine Product Liability350 Motor Vehicle355 Motor Vehicle Product Liability360 Other Personal Injury362 Personal Injury- Medical Malpractice365 Personal Injury- Product Liability367 Personal Injury - Health Care368 Asbestos Personal Injury Product Liability375 False Claims Act370 Other Fraud371 Truth in Lending380 Other Personal Property Damage385 Property Damage Product Liability
CONTRACT 110 Insurance120 Marine130 Miller Act140 Negotiable Instrument150 Recovery of Overpayment & Enforcement of Judgment151 Medicare Act152 Recovery of Defaulted Student Loans (Excl. Veterans)153 Recovery of Overpayment of Veteran’s Benefit160 Stockholders’s Suit190 Other Contract195 Contract Product Liability196 Franchise
LABOR 710 Fair Labor Standards Act720 Labor/Management Relations730 Labor/Management Reporting & Disclosure Act740 Railway Labor Act751 Family and Medical Leave Act790 Other Labor Litigation791 Employee Retirement Income Security Act
SECURITIES 850 Securities/Commodities/Exchange
ENVIRONMENT 893 Environmental Matters
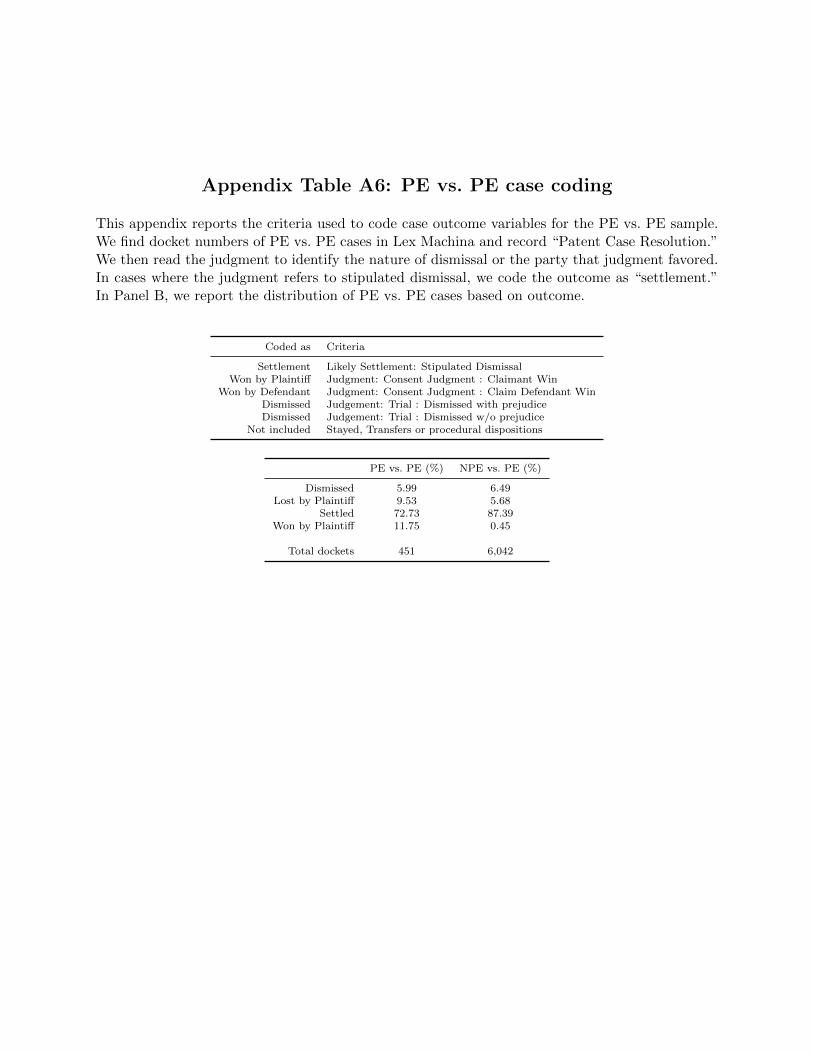
Appendix Table A6: PE vs. PE case coding
This appendix reports the criteria used to code case outcome variables for the PE vs. PE sample.We find docket numbers of PE vs. PE cases in Lex Machina and record “Patent Case Resolution.”We then read the judgment to identify the nature of dismissal or the party that judgment favored.In cases where the judgment refers to stipulated dismissal, we code the outcome as “settlement.”In Panel B, we report the distribution of PE vs. PE cases based on outcome.
Coded as Criteria
Settlement Likely Settlement: Stipulated DismissalWon by Plaintiff Judgment: Consent Judgment : Claimant Win
Won by Defendant Judgment: Consent Judgment : Claim Defendant WinDismissed Judgement: Trial : Dismissed with prejudiceDismissed Judgement: Trial : Dismissed w/o prejudice
Not included Stayed, Transfers or procedural dispositions
PE vs. PE (%) NPE vs. PE (%)
Dismissed 5.99 6.49Lost by Plaintiff 9.53 5.68
Settled 72.73 87.39Won by Plaintiff 11.75 0.45
Total dockets 451 6,042