patches of color
DESCRIPTION
Patches of Color. Outline. Announcements Homework I due TODAY. 5PM by e-mail Homework II on web No lecture on Friday Polar Exploration Patches in 2D--pcolor Example: NWtopex Survey. Polar Exploration. The mystery: how can you produce objects without handles?. Polar Exploration. - PowerPoint PPT PresentationTRANSCRIPT

Patches Patches of Colorof Color

Outline
• Announcements– Homework I due TODAY. 5PM by e-mail– Homework II on web– No lecture on Friday
• Polar Exploration• Patches in 2D--pcolor• Example: NWtopex• Survey
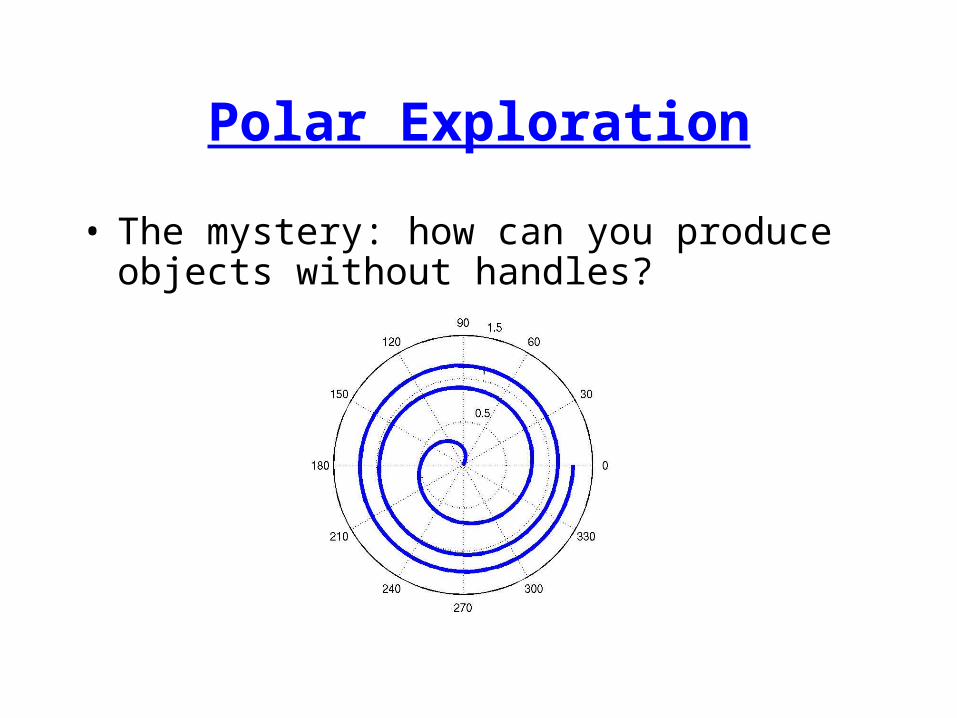
Polar Exploration
• The mystery: how can you produce objects without handles?
Polar Exploration
• toolbox/matlab/graph2d/polar.m• polar creates a patch (white circle),
lines (circular grid, spokes), and text• the ‘HandleVisibility’ is set to ‘off’--
making them inaccessible• Gus Lott wins the Polar Explorer award
for finding this out

Patch Review
• Patches are our workhorse 2D objects
• Lots of functions produce patches• patch is the lowest level functioned
(followed closely by fill)– patch(x,y,c)--x and y specify vertex
coordinates, c controls the color– patch(X,Y,C)--Each column of X, Y, and C
is a separate patch
0 1
1
0
x=[0 1 0]y=[0 0 1]c=‘r’

Patches and data
• We’re moving from y=f(x) to z=f(x,y)• Typically, x & y are defined on a grid of
points:
x(1) x(2) x(3) x(4) x(5) x(6)
y(6)
y(5)y(4)
y(3)
y(2)
y(1)
data lives at points (nodes)Z(3,4)=f(x(4),y(3))

Colorizing z
• A standard way of representing 2D data is to make color indicate z
zzmin zmax

• pcolor(x,y,Z) will colorize Z on grid defined by x and y– Z=m-by-n, x=1-by-n, y=m-by-1
• pcolor(X,Y,Z) will colorize Z on an irregular grid– X,Y, and Z all m-by-n
• h=pcolor(…) gets the handle. – The object is actually a surface object– surface objects are nearly identical to patches
pcolor

How it works
• h=pcolor(eye(3));
1 2 3
3
2
11
0
0
0
0
1
0
1
0
shading(‘faceted’)color of cell is set by lower left-hand corner
shading(‘flat’)edgecolor=‘none’
shading(‘interp’)interpolates between vertices to get color

Controlling pcolor
• shading(str) sets ‘facecolor’ property to str– flat, faceted or interp
• colorbar shows a colorbar• caxis([zmin, zmax]) controls the color
limits– same as set(gca,’clim’,[zmin, zmax])
• colormap(cmap)--changes the colors. help graph3d lists the built in colormaps– we’ll learn how to “role-your-own”

Example: NWtopex
• Since water flows down hill, sea-surface height (SSH) indicates currents
• The TOPEX/Poseidon satellite measures SSH with radar

NWtopex
• load(NWtopex)--loads NWtopex.mat which contains the following arrays:
name size description
lon 1-by-66 longitude (x)
lat 1-by-31 latitude (y)
SSH 31-by-66 SSH=z(x,y)
rkb 256-by-3 new colormap