passing & overtaking on new zealand two ... & overtaking on new zealand two-lane state...
TRANSCRIPT
23rd
ARRB Conference – Research Partnering with Practitioners, Adelaide Australia, 2008
© ARRB Group Ltd and Authors 2008
1
PASSING & OVERTAKING ON NEW ZEALAND TWO-LANE STATE HIGHWAYS: POLICY TO PRACTICE
L. J. Cameron, New Zealand Transport Agency, New Zealand
P. D. Cenek, Opus International Consultants Ltd, New Zealand
D. K. Wanty, MWH New Zealand Ltd, New Zealand
ABSTRACT
A Passing and Overtaking Policy has been formulated to improve the efficiency of New Zealand’s two-lane state highway network. The Policy will be applied to two-lane state highways running through rural and peripheral urban land-use areas, up to the point that four-laning is likely to be required. This paper reports on how the Policy was derived and the results of two studies that have contributed to improving implementation of the Policy.
For the passing lane length and frequency study (Cenek & Lester 2008), six sets of field data were collected using pneumatic dual tube axle sensors located within the passing length and up to 2 km before and 12 km after the passing facility. The operational data acquired was used to refine the Policy’s long-term framework for passing and overtaking treatments.
Another study examined the percentage of following vehicles at about 90 rural count stations throughout New Zealand’s Waikato and Bay of Plenty areas. For each site, vehicle-by-vehicle and time interval data were used to determine percentage following by direction (Wanty 2007).
Key Words: passing lane, percentage following, platooning, terrain, design criteria
INTRODUCTION
In October 2006, the Transit New Zealand Board approved its Passing and Overtaking Policy (after 31 July 2008, Transit New Zealand will join with Land Transport New Zealand to form the New Zealand Transport Agency). To implement the Policy, the following approach was taken:
• Routine standardised layout for the majority of sites
• Procedures for dealing with common exceptions
• Data and professional judgement to cater for one-off situations.
A framework of passing lane lengths and frequencies was developed for the majority of sites but needed verification under New Zealand conditions. To help understand one-off situations, a suitable method for measuring passing/overtaking demand was required.
BACKGROUND
Terminology
Key words are (may differ slightly from AUSTROADS definitions):
• Passing - vehicles use specific passing facilities to pass slower vehicles.
• Overtaking - vehicles cross into the opposing traffic lane to pass slower vehicles.
• Passing/Overtaking Demand - reflects both the amount of traffic bunching and the desire for following vehicles to pass or overtake slower moving vehicles.
• Treatments - are applied directly to the roading infrastructure.
• Measures - act on driver behaviour.
23rd
ARRB Conference – Research Partnering with Practitioners, Adelaide Australia, 2008
© ARRB Group Ltd and Authors 2008
2
Projected Flows
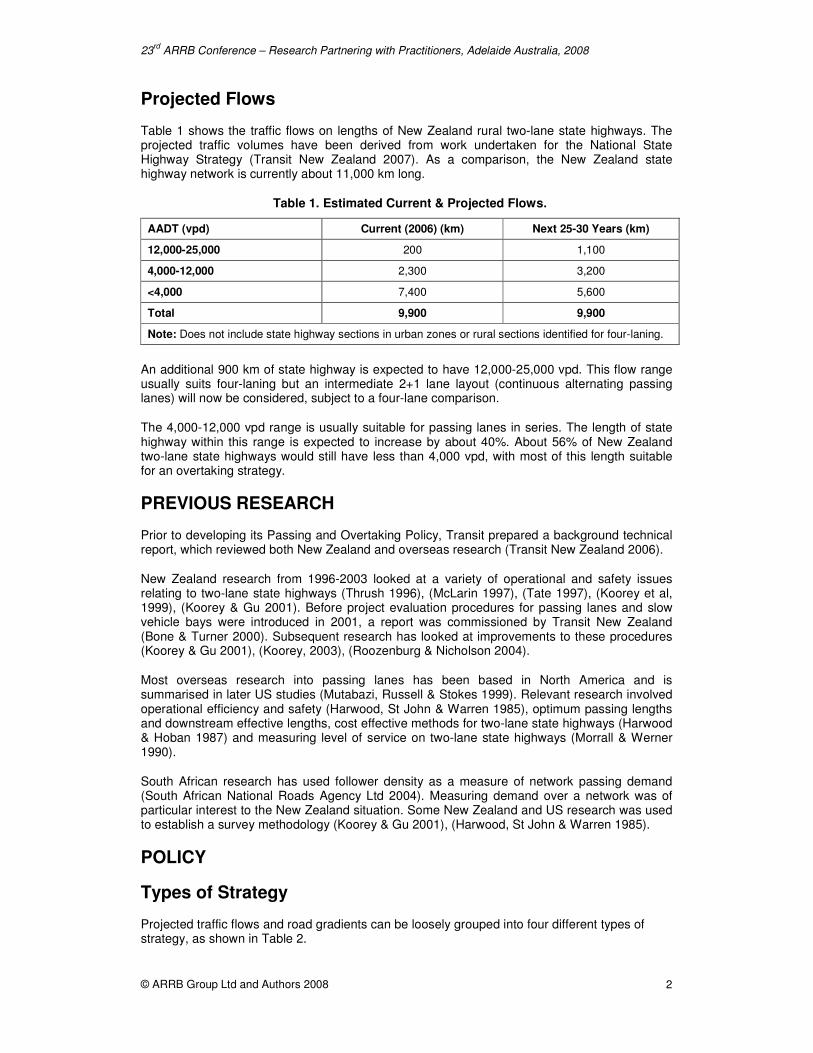
Table 1 shows the traffic flows on lengths of New Zealand rural two-lane state highways. The projected traffic volumes have been derived from work undertaken for the National State Highway Strategy (Transit New Zealand 2007). As a comparison, the New Zealand state highway network is currently about 11,000 km long.
Table 1. Estimated Current & Projected Flows.
AADT (vpd) Current (2006) (km) Next 25-30 Years (km)
12,000-25,000 200 1,100
4,000-12,000 2,300 3,200
<4,000 7,400 5,600
Total 9,900 9,900
Note: Does not include state highway sections in urban zones or rural sections identified for four-laning.
An additional 900 km of state highway is expected to have 12,000-25,000 vpd. This flow range usually suits four-laning but an intermediate 2+1 lane layout (continuous alternating passing lanes) will now be considered, subject to a four-lane comparison.
The 4,000-12,000 vpd range is usually suitable for passing lanes in series. The length of state highway within this range is expected to increase by about 40%. About 56% of New Zealand two-lane state highways would still have less than 4,000 vpd, with most of this length suitable for an overtaking strategy.
PREVIOUS RESEARCH
Prior to developing its Passing and Overtaking Policy, Transit prepared a background technical report, which reviewed both New Zealand and overseas research (Transit New Zealand 2006).
New Zealand research from 1996-2003 looked at a variety of operational and safety issues relating to two-lane state highways (Thrush 1996), (McLarin 1997), (Tate 1997), (Koorey et al, 1999), (Koorey & Gu 2001). Before project evaluation procedures for passing lanes and slow vehicle bays were introduced in 2001, a report was commissioned by Transit New Zealand (Bone & Turner 2000). Subsequent research has looked at improvements to these procedures (Koorey & Gu 2001), (Koorey, 2003), (Roozenburg & Nicholson 2004).
Most overseas research into passing lanes has been based in North America and is summarised in later US studies (Mutabazi, Russell & Stokes 1999). Relevant research involved operational efficiency and safety (Harwood, St John & Warren 1985), optimum passing lengths and downstream effective lengths, cost effective methods for two-lane state highways (Harwood & Hoban 1987) and measuring level of service on two-lane state highways (Morrall & Werner 1990).
South African research has used follower density as a measure of network passing demand (South African National Roads Agency Ltd 2004). Measuring demand over a network was of particular interest to the New Zealand situation. Some New Zealand and US research was used to establish a survey methodology (Koorey & Gu 2001), (Harwood, St John & Warren 1985).
POLICY
Types of Strategy
Projected traffic flows and road gradients can be loosely grouped into four different types of strategy, as shown in Table 2.
23rd
ARRB Conference – Research Partnering with Practitioners, Adelaide Australia, 2008
© ARRB Group Ltd and Authors 2008
3
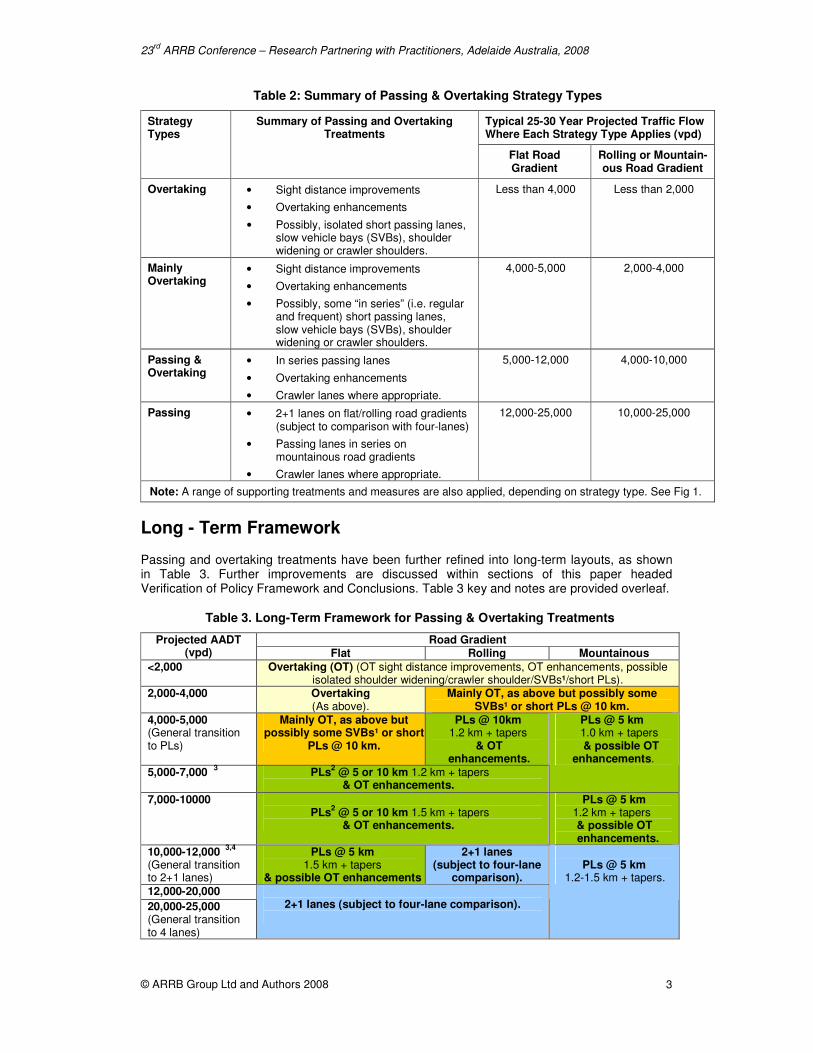
Table 2: Summary of Passing & Overtaking Strategy Types
Typical 25-30 Year Projected Traffic Flow Where Each Strategy Type Applies (vpd)
Strategy Types
Summary of Passing and Overtaking Treatments
Flat Road Gradient
Rolling or Mountain-ous Road Gradient
Overtaking
• Sight distance improvements
• Overtaking enhancements
• Possibly, isolated short passing lanes, slow vehicle bays (SVBs), shoulder widening or crawler shoulders.
Less than 4,000 Less than 2,000
Mainly Overtaking
• Sight distance improvements
• Overtaking enhancements
• Possibly, some “in series” (i.e. regular and frequent) short passing lanes, slow vehicle bays (SVBs), shoulder widening or crawler shoulders.
4,000-5,000 2,000-4,000
Passing & Overtaking
• In series passing lanes
• Overtaking enhancements
• Crawler lanes where appropriate.
5,000-12,000 4,000-10,000
Passing
• 2+1 lanes on flat/rolling road gradients (subject to comparison with four-lanes)
• Passing lanes in series on mountainous road gradients
• Crawler lanes where appropriate.
12,000-25,000 10,000-25,000
Note: A range of supporting treatments and measures are also applied, depending on strategy type. See Fig 1.
Long - Term Framework
Passing and overtaking treatments have been further refined into long-term layouts, as shown in Table 3. Further improvements are discussed within sections of this paper headed Verification of Policy Framework and Conclusions. Table 3 key and notes are provided overleaf.
Table 3. Long-Term Framework for Passing & Overtaking Treatments
Road Gradient Projected AADT (vpd) Flat Rolling Mountainous
<2,000 Overtaking (OT) (OT sight distance improvements, OT enhancements, possible isolated shoulder widening/crawler shoulder/SVBs¹/short PLs).
2,000-4,000
Overtaking (As above).
Mainly OT, as above but possibly some SVBs¹ or short PLs @ 10 km.
4,000-5,000 (General transition to PLs)
Mainly OT, as above but possibly some SVBs¹ or short
PLs @ 10 km.
PLs @ 10km 1.2 km + tapers
& OT enhancements.
5,000-7,000 3
PLs
2 @ 5 or 10 km 1.2 km + tapers
& OT enhancements.
PLs @ 5 km 1.0 km + tapers & possible OT
enhancements.
7,000-10000
PLs
2 @ 5 or 10 km 1.5 km + tapers
& OT enhancements.
PLs @ 5 km 1.2 km + tapers & possible OT enhancements.
10,000-12,000 3,4
(General transition to 2+1 lanes)
PLs @ 5 km 1.5 km + tapers
& possible OT enhancements
2+1 lanes (subject to four-lane
comparison).
12,000-20,000
20,000-25,000 (General transition to 4 lanes)
2+1 lanes (subject to four-lane comparison).
PLs @ 5 km
1.2-1.5 km + tapers.
23rd
ARRB Conference – Research Partnering with Practitioners, Adelaide Australia, 2008
© ARRB Group Ltd and Authors 2008
4
Key - Strategy Type
Overtaking Mainly overtaking Passing and
overtaking Passing
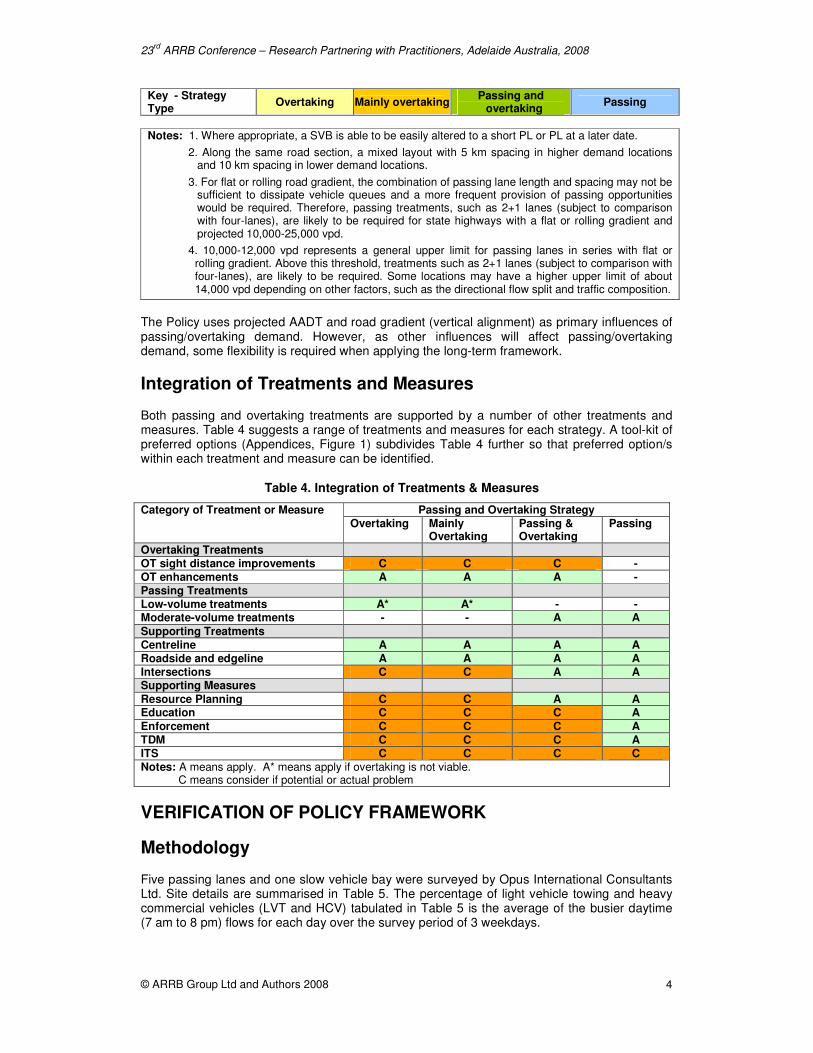
Notes: 1. Where appropriate, a SVB is able to be easily altered to a short PL or PL at a later date.
2. Along the same road section, a mixed layout with 5 km spacing in higher demand locations and 10 km spacing in lower demand locations.
3. For flat or rolling road gradient, the combination of passing lane length and spacing may not be sufficient to dissipate vehicle queues and a more frequent provision of passing opportunities would be required. Therefore, passing treatments, such as 2+1 lanes (subject to comparison with four-lanes), are likely to be required for state highways with a flat or rolling gradient and projected 10,000-25,000 vpd.
4. 10,000-12,000 vpd represents a general upper limit for passing lanes in series with flat or rolling gradient. Above this threshold, treatments such as 2+1 lanes (subject to comparison with four-lanes), are likely to be required. Some locations may have a higher upper limit of about 14,000 vpd depending on other factors, such as the directional flow split and traffic composition.
The Policy uses projected AADT and road gradient (vertical alignment) as primary influences of passing/overtaking demand. However, as other influences will affect passing/overtaking demand, some flexibility is required when applying the long-term framework.
Integration of Treatments and Measures
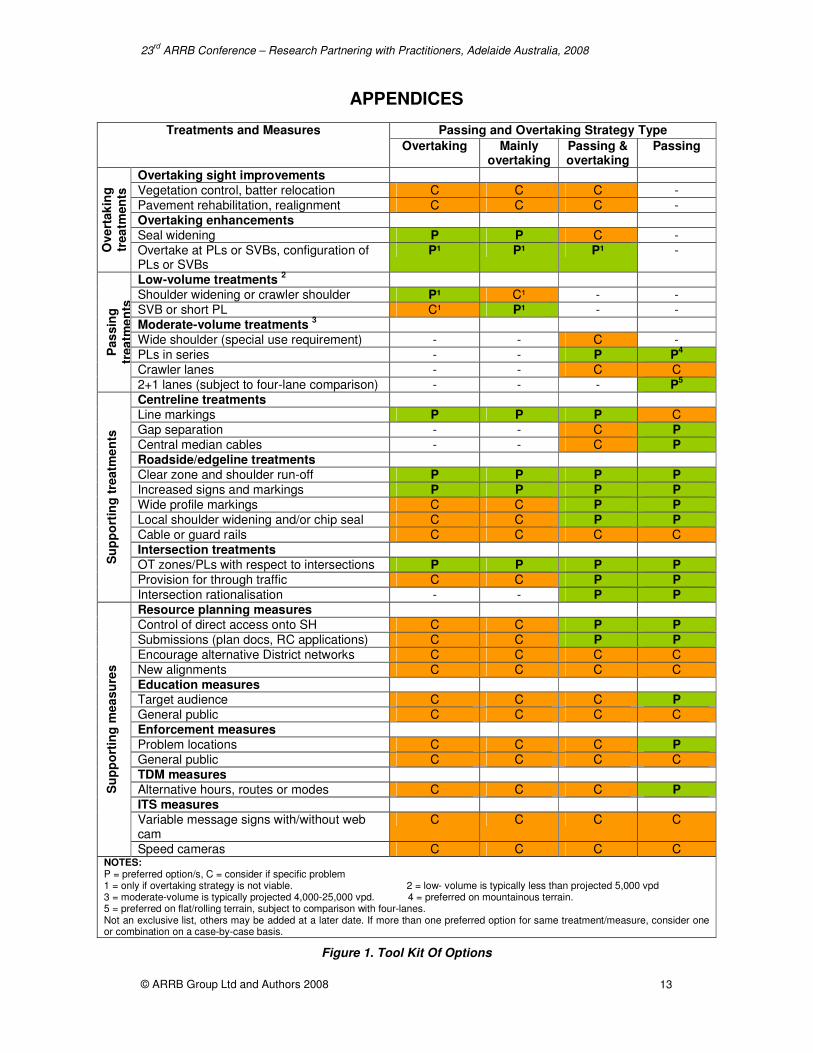
Both passing and overtaking treatments are supported by a number of other treatments and measures. Table 4 suggests a range of treatments and measures for each strategy. A tool-kit of preferred options (Appendices, Figure 1) subdivides Table 4 further so that preferred option/s within each treatment and measure can be identified.
VERIFICATION OF POLICY FRAMEWORK
Methodology
Five passing lanes and one slow vehicle bay were surveyed by Opus International Consultants Ltd. Site details are summarised in Table 5. The percentage of light vehicle towing and heavy commercial vehicles (LVT and HCV) tabulated in Table 5 is the average of the busier daytime (7 am to 8 pm) flows for each day over the survey period of 3 weekdays.
Table 4. Integration of Treatments & Measures
Passing and Overtaking Strategy Category of Treatment or Measure
Overtaking Mainly Overtaking
Passing & Overtaking
Passing
Overtaking Treatments
OT sight distance improvements C C C -
OT enhancements A A A -
Passing Treatments
Low-volume treatments A* A* - - Moderate-volume treatments - - A A
Supporting Treatments
Centreline A A A A
Roadside and edgeline A A A A
Intersections C C A A Supporting Measures
Resource Planning C C A A Education C C C A
Enforcement C C C A
TDM C C C A
ITS C C C C
Notes: A means apply. A* means apply if overtaking is not viable. C means consider if potential or actual problem
23rd
ARRB Conference – Research Partnering with Practitioners, Adelaide Australia, 2008
© ARRB Group Ltd and Authors 2008
5
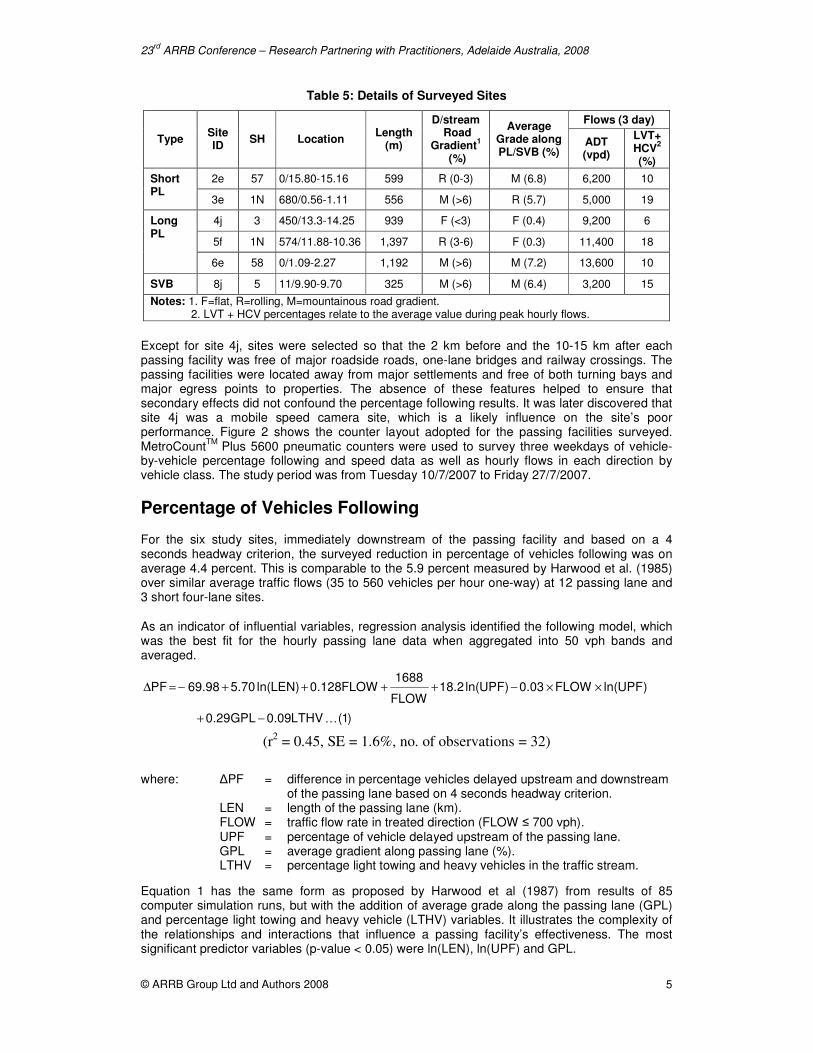
Table 5: Details of Surveyed Sites
Flows (3 day)
Type Site ID
SH Location Length
(m)
D/stream Road
Gradient1
(%)
Average Grade along PL/SVB (%)
ADT (vpd)
LVT+HCV
2
(%)
2e 57 0/15.80-15.16 599 R (0-3) M (6.8) 6,200 10 Short PL
3e 1N 680/0.56-1.11 556 M (>6) R (5.7) 5,000 19
4j 3 450/13.3-14.25 939 F (<3) F (0.4) 9,200 6
5f 1N 574/11.88-10.36 1,397 R (3-6) F (0.3) 11,400 18
Long PL
6e 58 0/1.09-2.27 1,192 M (>6) M (7.2) 13,600 10
SVB 8j 5 11/9.90-9.70 325 M (>6) M (6.4) 3,200 15
Notes: 1. F=flat, R=rolling, M=mountainous road gradient. 2. LVT + HCV percentages relate to the average value during peak hourly flows.
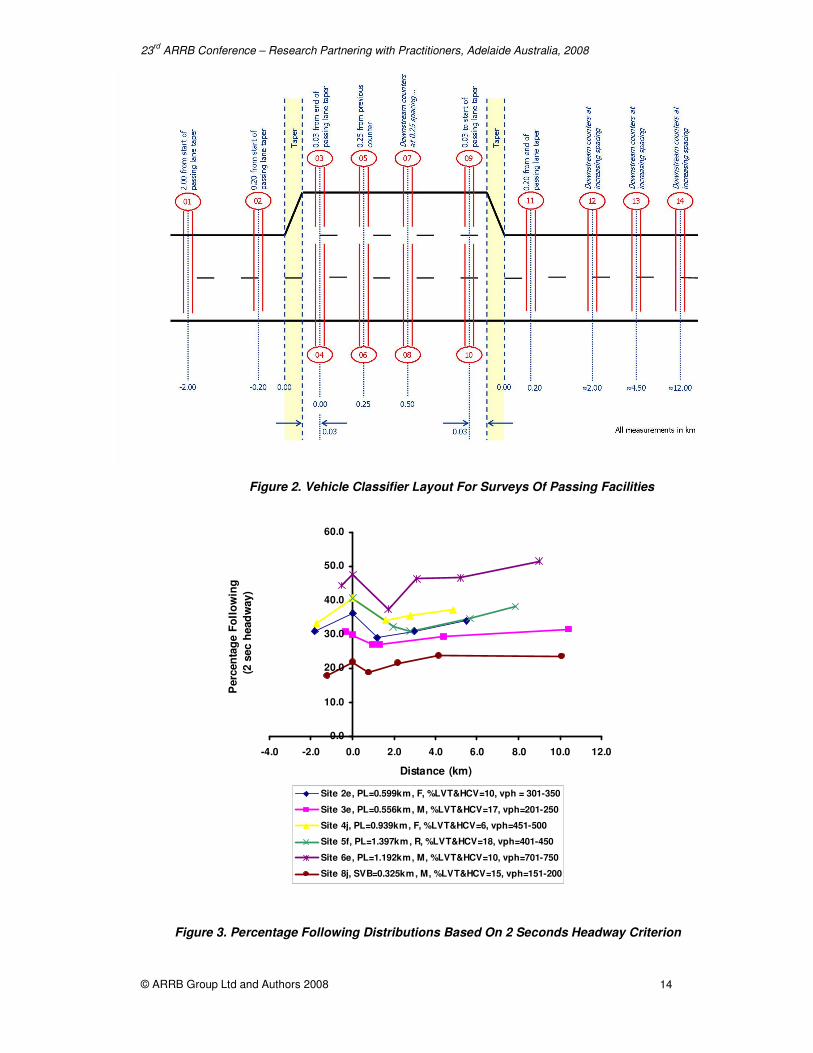
Except for site 4j, sites were selected so that the 2 km before and the 10-15 km after each passing facility was free of major roadside roads, one-lane bridges and railway crossings. The passing facilities were located away from major settlements and free of both turning bays and major egress points to properties. The absence of these features helped to ensure that secondary effects did not confound the percentage following results. It was later discovered that site 4j was a mobile speed camera site, which is a likely influence on the site’s poor performance. Figure 2 shows the counter layout adopted for the passing facilities surveyed. MetroCount
TM Plus 5600 pneumatic counters were used to survey three weekdays of vehicle-
by-vehicle percentage following and speed data as well as hourly flows in each direction by vehicle class. The study period was from Tuesday 10/7/2007 to Friday 27/7/2007.
Percentage of Vehicles Following
For the six study sites, immediately downstream of the passing facility and based on a 4 seconds headway criterion, the surveyed reduction in percentage of vehicles following was on average 4.4 percent. This is comparable to the 5.9 percent measured by Harwood et al. (1985) over similar average traffic flows (35 to 560 vehicles per hour one-way) at 12 passing lane and 3 short four-lane sites.
As an indicator of influential variables, regression analysis identified the following model, which was the best fit for the hourly passing lane data when aggregated into 50 vph bands and averaged.
(r2 = 0.45, SE = 1.6%, no. of observations = 32)
where: ∆PF = difference in percentage vehicles delayed upstream and downstream
of the passing lane based on 4 seconds headway criterion. LEN = length of the passing lane (km). FLOW = traffic flow rate in treated direction (FLOW ≤ 700 vph). UPF = percentage of vehicle delayed upstream of the passing lane. GPL = average gradient along passing lane (%). LTHV = percentage light towing and heavy vehicles in the traffic stream.
Equation 1 has the same form as proposed by Harwood et al (1987) from results of 85 computer simulation runs, but with the addition of average grade along the passing lane (GPL) and percentage light towing and heavy vehicle (LTHV) variables. It illustrates the complexity of the relationships and interactions that influence a passing facility’s effectiveness. The most significant predictor variables (p-value < 0.05) were ln(LEN), ln(UPF) and GPL.
)1(LTHV09.0GPL29.0
)UPFln(FLOW03.0)UPFln(2.18FLOW
1688FLOW128.0)LENln(70.598.69PF
K−+
××−++++−=∆
23rd
ARRB Conference – Research Partnering with Practitioners, Adelaide Australia, 2008
© ARRB Group Ltd and Authors 2008
6
Downstream Operational Length
Percentage following was used to help determine the downstream operational length. This downstream length is the distance from the end of the merge taper through to where percentage following matches surveyed values immediately upstream of the passing facility.
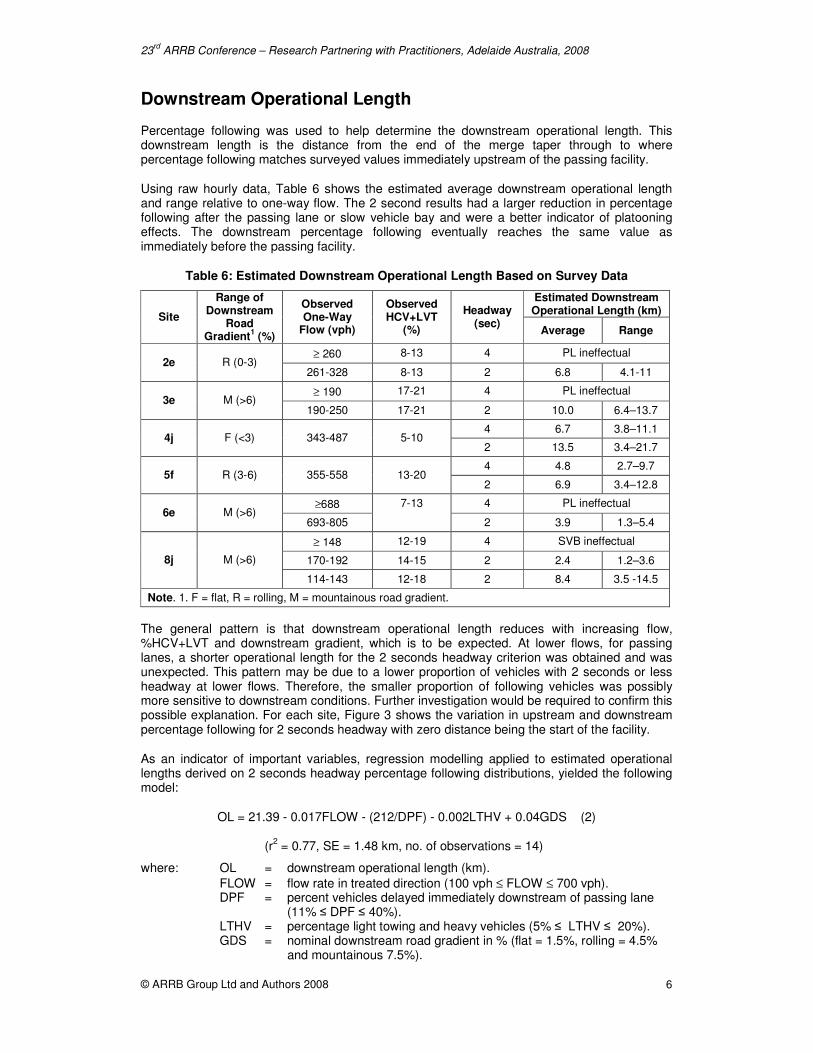
Using raw hourly data, Table 6 shows the estimated average downstream operational length and range relative to one-way flow. The 2 second results had a larger reduction in percentage following after the passing lane or slow vehicle bay and were a better indicator of platooning effects. The downstream percentage following eventually reaches the same value as immediately before the passing facility.
Table 6: Estimated Downstream Operational Length Based on Survey Data
Estimated Downstream Operational Length (km)
Site
Range of Downstream
Road Gradient
1 (%)
Observed One-Way
Flow (vph)
Observed HCV+LVT
(%)
Headway (sec)
Average Range
≥ 260 8-13 4 PL ineffectual 2e R (0-3)
261-328 8-13 2 6.8 4.1-11
≥ 190 17-21 4 PL ineffectual 3e M (>6)
190-250 17-21 2 10.0 6.4–13.7
4 6.7 3.8–11.1 4j F (<3) 343-487 5-10
2 13.5 3.4–21.7
4 4.8 2.7–9.7 5f R (3-6) 355-558 13-20
2 6.9 3.4–12.8
≥688 4 PL ineffectual 6e M (>6)
693-805
7-13
2 3.9 1.3–5.4
≥ 148 12-19 4 SVB ineffectual
170-192 14-15 2 2.4 1.2–3.6 8j M (>6)
114-143 12-18 2 8.4 3.5 -14.5
Note. 1. F = flat, R = rolling, M = mountainous road gradient.
The general pattern is that downstream operational length reduces with increasing flow, %HCV+LVT and downstream gradient, which is to be expected. At lower flows, for passing lanes, a shorter operational length for the 2 seconds headway criterion was obtained and was unexpected. This pattern may be due to a lower proportion of vehicles with 2 seconds or less headway at lower flows. Therefore, the smaller proportion of following vehicles was possibly more sensitive to downstream conditions. Further investigation would be required to confirm this possible explanation. For each site, Figure 3 shows the variation in upstream and downstream percentage following for 2 seconds headway with zero distance being the start of the facility.
As an indicator of important variables, regression modelling applied to estimated operational lengths derived on 2 seconds headway percentage following distributions, yielded the following model:
OL = 21.39 - 0.017FLOW - (212/DPF) - 0.002LTHV + 0.04GDS (2)
(r2 = 0.77, SE = 1.48 km, no. of observations = 14)
where: OL = downstream operational length (km).
FLOW = flow rate in treated direction (100 vph ≤ FLOW ≤ 700 vph). DPF = percent vehicles delayed immediately downstream of passing lane (11% ≤ DPF ≤ 40%). LTHV = percentage light towing and heavy vehicles (5% ≤ LTHV ≤ 20%). GDS = nominal downstream road gradient in % (flat = 1.5%, rolling = 4.5%
and mountainous 7.5%).
23rd
ARRB Conference – Research Partnering with Practitioners, Adelaide Australia, 2008
© ARRB Group Ltd and Authors 2008
7
The most significant predictors (p-value < 0.05) were FLOW and 1/DPF. For the regression modelling, the raw hourly data have been aggregated into 50 vph bands and the average of each band used as the variable.
Further research is needed to calculate the effects of gradient and percentage of light towing and heavy vehicles. The sign for GDS is positive and therefore intuitively wrong. However, both GDS and LTHV do not contribute markedly to the operational length value. Possibly, downstream gradient and overtaking conditions relative to opposing flows have to be more accurately determined. The equation form for operating length may not be conducive for modelling LTHV effects, which are influenced by terrain. For example, on flat terrain all LTHV values are expected to have little influence on operational length.
Comparison with Policy Framework
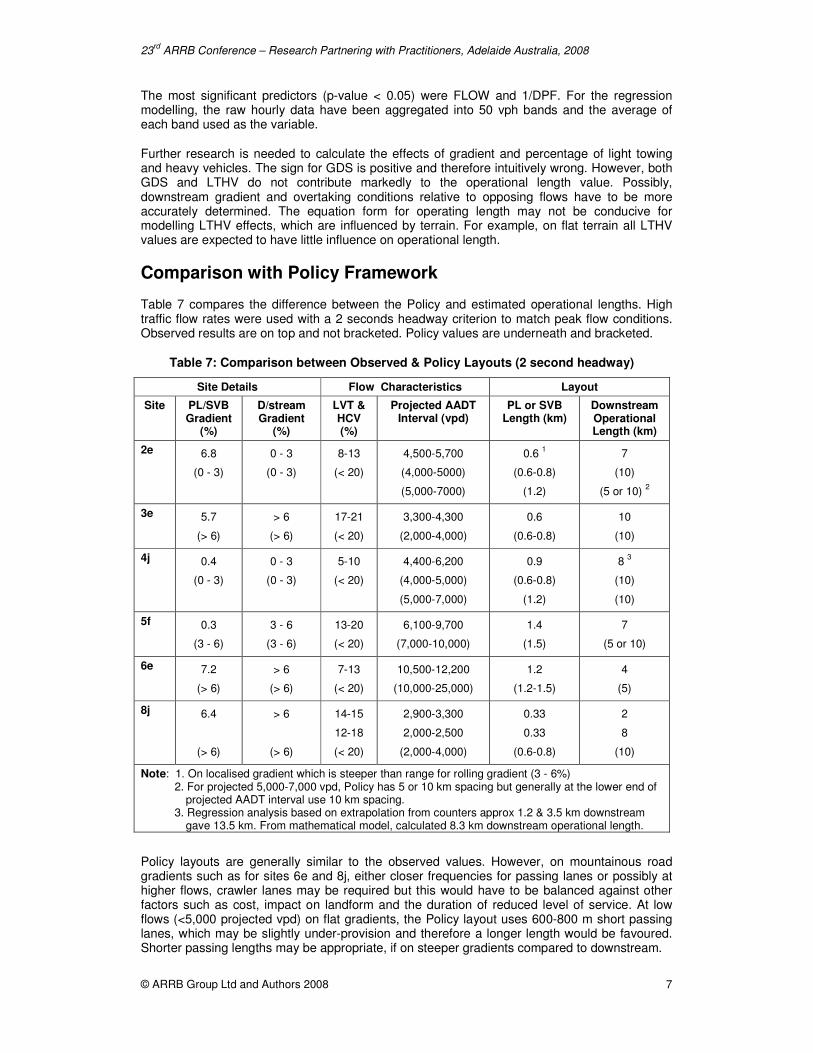
Table 7 compares the difference between the Policy and estimated operational lengths. High traffic flow rates were used with a 2 seconds headway criterion to match peak flow conditions. Observed results are on top and not bracketed. Policy values are underneath and bracketed.
Table 7: Comparison between Observed & Policy Layouts (2 second headway)
Site Details Flow Characteristics Layout
Site PL/SVB Gradient
(%)
D/stream Gradient
(%)
LVT & HCV (%)
Projected AADT Interval (vpd)
PL or SVB Length (km)
Downstream Operational Length (km)
2e 6.8
(0 - 3)
0 - 3
(0 - 3)
8-13
(< 20)
4,500-5,700
(4,000-5000)
(5,000-7000)
0.6 1
(0.6-0.8)
(1.2)
7
(10)
(5 or 10) 2
3e 5.7
(> 6)
> 6
(> 6)
17-21
(< 20)
3,300-4,300
(2,000-4,000)
0.6
(0.6-0.8)
10
(10)
4j 0.4
(0 - 3)
0 - 3
(0 - 3)
5-10
(< 20)
4,400-6,200
(4,000-5,000)
(5,000-7,000)
0.9
(0.6-0.8)
(1.2)
8 3
(10)
(10)
5f 0.3
(3 - 6)
3 - 6
(3 - 6)
13-20
(< 20)
6,100-9,700
(7,000-10,000)
1.4
(1.5)
7
(5 or 10)
6e 7.2
(> 6)
> 6
(> 6)
7-13
(< 20)
10,500-12,200
(10,000-25,000)
1.2
(1.2-1.5)
4
(5)
8j 6.4
(> 6)
> 6
(> 6)
14-15
12-18
(< 20)
2,900-3,300
2,000-2,500
(2,000-4,000)
0.33
0.33
(0.6-0.8)
2
8
(10)
Note: 1. On localised gradient which is steeper than range for rolling gradient (3 - 6%) 2. For projected 5,000-7,000 vpd, Policy has 5 or 10 km spacing but generally at the lower end of
projected AADT interval use 10 km spacing. 3. Regression analysis based on extrapolation from counters approx 1.2 & 3.5 km downstream
gave 13.5 km. From mathematical model, calculated 8.3 km downstream operational length.
Policy layouts are generally similar to the observed values. However, on mountainous road gradients such as for sites 6e and 8j, either closer frequencies for passing lanes or possibly at higher flows, crawler lanes may be required but this would have to be balanced against other factors such as cost, impact on landform and the duration of reduced level of service. At low flows (<5,000 projected vpd) on flat gradients, the Policy layout uses 600-800 m short passing lanes, which may be slightly under-provision and therefore a longer length would be favoured. Shorter passing lengths may be appropriate, if on steeper gradients compared to downstream.
23rd
ARRB Conference – Research Partnering with Practitioners, Adelaide Australia, 2008
© ARRB Group Ltd and Authors 2008
8
The projected AADT interval for most sites is based on 55/45% directional split and an assumed peak hour flow of 10.5% AADT (Approx 125
th percentile highest hour). Sites 4j and 6e are both
on rural commuter routes. For site 4j, a 65/35% directional split and assumed peak hour flow of 12% AADT (Approx 125
th percentile highest hour) was used. For site 6e, a 55/45% directional
split and assumed peak hour flow of 12% AADT was a better match to surveyed flows.
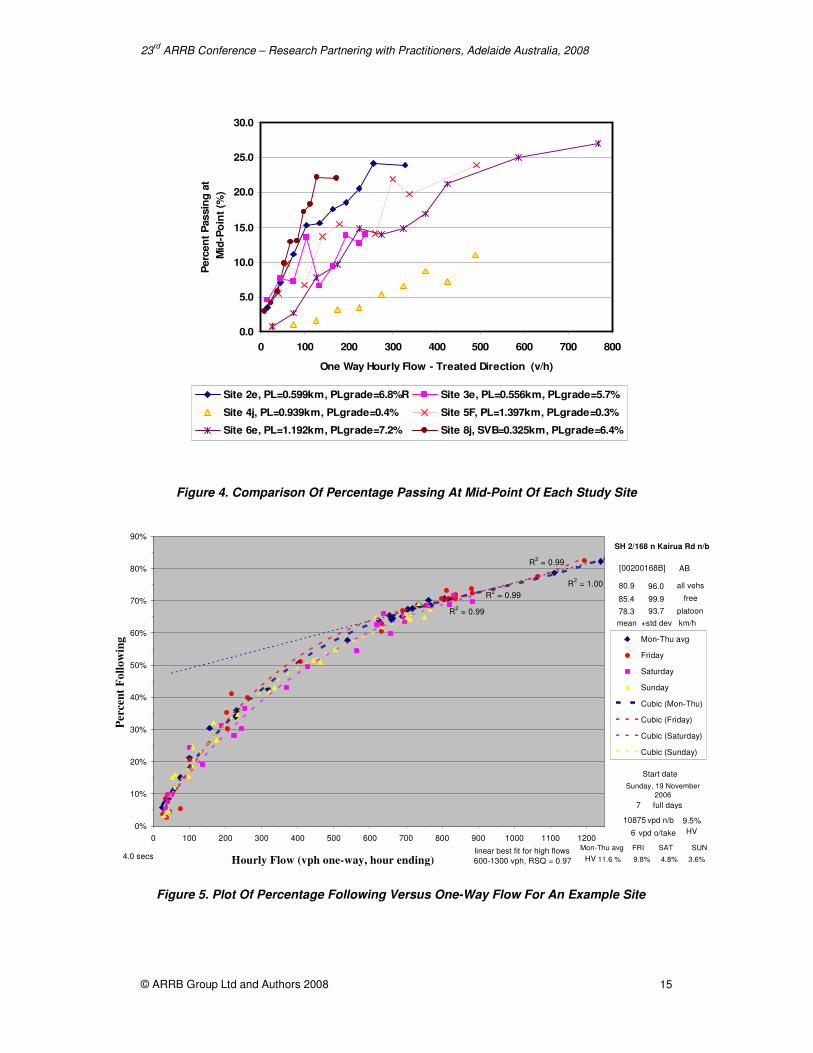
In order to help understand the passing characteristics for each passing lane and slow vehicle bay, a plot of percentage passing relative to one-way flow was generated for each counter location. Figure 4 shows the plot for the mid-point of each passing lane and slow vehicle bay.
MEASUREMENT OF PASSING/OVERTAKING DEMAND
Study Sites
A pilot study was undertaken by MWH NZ Ltd. into using Transit’s traffic monitoring system (TMS) for assessing passing/overtaking demand on rural two-lane state highways. The pilot study area consisted of about 90 sites (almost 180 directional files) in the Waikato and Bay of Plenty regions, using MetroCount traffic data for one week in 2006.
Determination of Headway
The study initially investigated the appropriate headway threshold for determining whether a vehicle was assumed to be following or travelling freely. Alternative headway thresholds were investigated (3.5, 4.0, 4.5, 5.0 seconds) based on the range of values used internationally. The speed distribution for the platooned and free vehicles over a sample of sites showed little effect in changing the assumed ‘free’ threshold. This lack of change is probably due to the vast majority of the number of platooned vehicles remaining unchanged across the threshold range.
However, the cumulative frequency of headways indicated a noticeable change in profile below the 4 second threshold. With a preference for adopting whole numbers and for a ‘tight’ criterion, the study recommended 4.0 seconds as the appropriate threshold for determining the percentage following.
Percentage Following
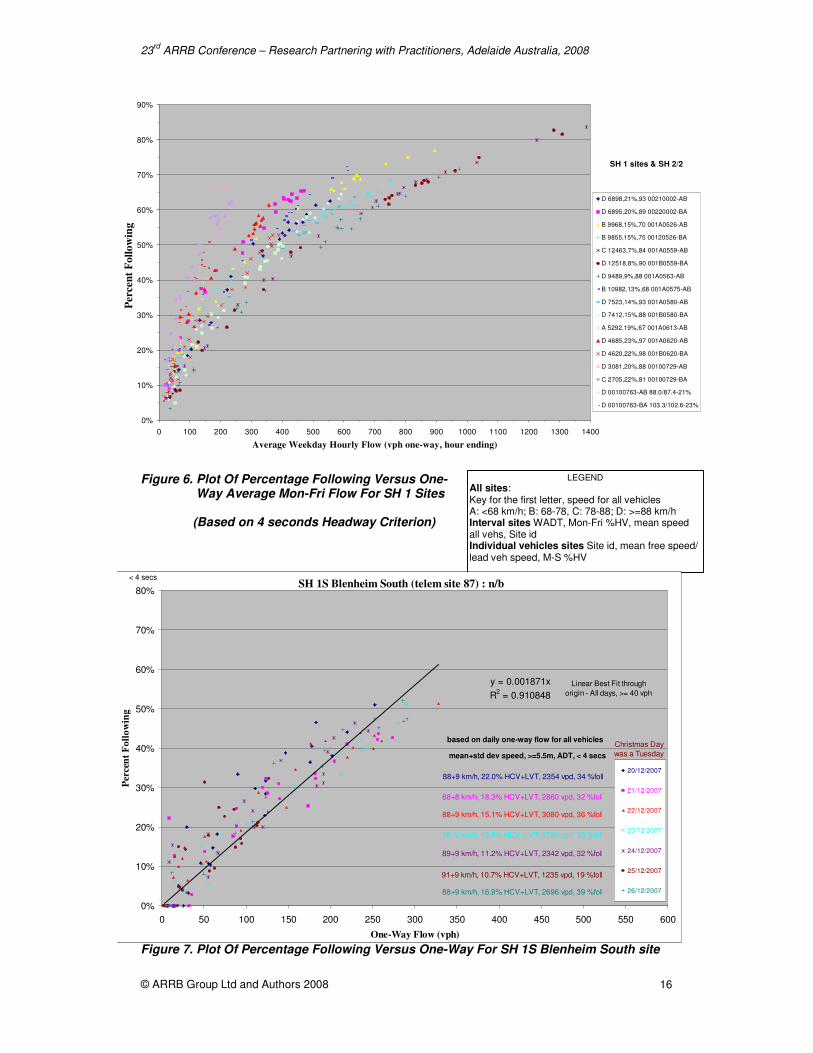
Based on the 4 second threshold, graphs of the percentage following distribution were undertaken for each site. Figure 5 shows the plot of percentage following versus one-way flows for an example site on State highway (SH) 2. Figure 6 shows the plot of percentage following versus average Monday-Friday one-way flows for higher flow (up to 1400 vph) sites on SH 1. An example of the technique was later applied to assess passing/overtaking demand on SH 1 south of Blenheim over the Christmas 2007/08 period, as illustrated in Figure 7.
A cubic curve was fitted to the data for one-way flows up to 600 vph, above which a linear fit appeared reasonable. For a given average weekday hourly flow, the variation in the observed percentage following appeared to decrease with higher flows, with the associated observation that there were no very high flow (> 900 vph one-way) sites, which also had high percentages of heavy vehicles. Inspection of these graphs indicated that the percentage following appears to be influenced more by the percentage of heavy vehicles rather than speed, although there are correlative effects involved.
Table 8 compares one-way flows, percentage following and percentage heavy vehicles for a randomly selected number of sites. For similar values of percentage heavy vehicles, the percentage following values increased as one-way flows increased. This observation is similar to surveyed data in the previous study but varies from mathematical modelling of operational length where the percentage of heavy traffic was not a significant variable. This difference may be due to the limited number of sites used in the Table 8 comparison or the randomly selected sites are inadvertently mainly on rolling or mountainous road gradients.

23rd
ARRB Conference – Research Partnering with Practitioners, Adelaide Australia, 2008
© ARRB Group Ltd and Authors 2008
9
Table 8: Comparison Between Percentage Following & Percentage Heavy Vehicles
One-Way Flow (vph)
< 10%
HV (%)
Percentage
Following (%)
10-20%
HV (%)
Percentage
Following (%)
> 20%
HV (%)
Percentage
Following (%)
300 6-9 35 19 52 20-23 46, 52
600 7-9 55 16 70 21 65
900 7-9 68 15 77 n/a n/a
1200 7 76 11 81 n/a n/a
Speed
Table 9 compares speed, traffic flow and the percentage following values at two sites for different time periods. Higher traffic volumes (and higher proportion of heavy vehicles) does not directly relate to a reduced speed and an increase in percentage following. Road geometrics and the timing of peak heavy traffic relative to passenger vehicle peak periods may partly explain the speed difference between sites. Seasonal/weekend effects could also influence speed results for the same site, particularly at lower AADTs.
Table 9. Intra-Site Comparison of Speed, Flow & Percentage Following
Site 27/82 AB 27/82 AB 28/9 AB 28/9 AB 28/9 AB 28/9 AB
Start Date for Week (2006)
25 June 14 July 1 Mar 15 July 23 Aug. 7 Sept.
Speed Comparison (km/h) Mean speed, all vehicles
89.8 84.6 60.8 69.5 69.4 68.5
Mean speed, free vehicles
90.8 85.8 61.7 70.2 70.0 69.2
Mean speed, platooned vehicles
87.0 81.0 57.9 67.3 66.9 65.6
Flow Comparison (vpd)
One-way ADT (7 days)
1939 1857 1432 1423 1496 1434
%HV Monday to Sunday
18.9 17.5 16.7 15.3 14.7 16.8
%HV Saturday 8.6 7.1 8.8 5.3 7.6 8.1
%HV Sunday 8.7 6.1 6.0 3.8 5.2 4.8
Percent Following Comparison (%)
Predicted M-F % following, 150 vph
29.4 30.3 37.5 35.6 29.7 33.4
The predicted percentage following is derived from the linear best fit line. The observed values vary with the highest weekday flows being about 120 vph one-way. The best fit line is based on a minimum 20 vph with r
2 varying from 0.85 to 0.94.
For the SH 27 site (i.e. 27/82 in A-B direction), there is a difference of about 5 km/h in the speed statistics and about 1-2% in the percentage of heavy vehicles, which is probably not atypical. For the SH 28 site, the observed March speeds were slower by about 8-9 km/h. The SH 28 site recorded a higher percentage of heavy vehicles over the whole weekend during March 2006 (early autumn with daylight saving) than for other periods of the year.
SH 28 has a R3 cross section (approx 8.5 m total seal width) compared to SH 27, which has a R2 cross section (approx 10 m total seal width). SH 27 is part of a long-haul route with the proportion of heavy vehicles being more consistent throughout the year and a higher proportion of heavy vehicles would travel at night outside of peak traffic periods.
23rd
ARRB Conference – Research Partnering with Practitioners, Adelaide Australia, 2008
© ARRB Group Ltd and Authors 2008
10
Effect of Light Vehicles Towing
A further observation related to using combined percentage heavy vehicles and light towing vehicles (Transit New Zealand 2004) rather than only percentage heavy vehicles. As part of the study, a comparison of the percentage following at various telemetry sites was compared with percentage heavy vehicles (vehicle classes 3-13) and light vehicles towing (vehicle class 2) (Appendix A, Transit New Zealand 2004). Results suggested that the combined percentage of heavy vehicles and light towing vehicles may be a better explanatory variable for percentage following than percentage heavy vehicles alone.
Changes to Traffic Monitoring Process
Recommended changes to Transit’s traffic monitoring strategy, as well as the Traffic Monitoring System’s (TMS) data processing, recording, analysis and reporting functions include:
• Telemetry dual loop sites are to record the four length bins for free and platooned vehicles separately.
• Some MetroCount ‘Regular’ devices are to be upgraded to ‘Plus’ devices so that seven days of vehicle-by-vehicle data can be recorded at least once a year at each TMS site (or other traffic counters upgraded or replaced to a similar level).
• The equipment & storage capacity at continuous dual loop sites should be capable not only of recording length by headway for a week but also preferably vehicle-by-vehicle.
• The posted speed limit to be a field in TMS.
FURTHER RESEARCH
Research on more sites would help to confirm other points within the Policy long-term framework and make the mathematical models more robust for predicting both the operational length and the difference between upstream and downstream percentage following. A more detailed determination of downstream road gradient rather than a standard mid-range value may improve the fit of the operational length model. Possibly, for determining downstream conditions, the New Zealand classification system for combined terrain may be a more useful parameter than road gradient, as it takes into account changes in both vertical gradient and horizontal alignment (Land Transport NZ 2006). Opposing flows should also be considered.
For further work on measuring passing/overtaking demand, the data could be subjected to statistical hierarchical clustering techniques to objectively determine site groupings. The resulting dendogram(s) could then be further inspected to help both identify key influences and quantify their separate effects on passing/overtaking demand. This approach would reduce the need for data intensive analysis.
CONCLUSION
This research has helped to confirm the Policy’s framework for long-term development of New Zealand’s two-lane rural state highways. The framework will provide practitioners with an easy reference point for selection of an appropriate layout. However, the projected AADTs should be qualified by one-way flow values and the parameter of road gradient needs to reflect downstream overtaking conditions typical for that terrain. Some professional judgement is still required, such as a shorter passing length if sited on a steeper grade compared to downstream.
Based on six selected sites, downstream platooning effects (using two and four second headway criteria) were generally in agreement with the Policy’s long-term framework. Increased frequency of passing facilities may be required in some mountainous locations (i.e. projected >12,000 vpd) but operational effects would have to be balanced against landscape issues and the duration of reduced level of service. At lower flows (i.e. projected <5,000 vpd) some passing lanes on flat locations may have to be slightly longer than the Policy’s 600-800 m.
23rd
ARRB Conference – Research Partnering with Practitioners, Adelaide Australia, 2008
© ARRB Group Ltd and Authors 2008
11
The methodology outlined for measuring passing/overtaking demand will help practitioners to assess demand on an objective basis. However, speed also needs to be considered. A four second headway criterion is appropriate for New Zealand state highway conditions. A cubic curve relationship was identified between percentage following and one-way traffic volumes. Measurement of passing/overtaking demand is currently data intensive and therefore more suited to one-off situations than widespread assessment of the entire network.
DISCLAIMER
The opinions presented in this paper are the views of the authors and not necessarily the views of their employer organisations.
REFERENCES
• Bone, IH & Turner, SA 2000, Simplified procedures for passing lanes, Transit New Zealand (unpublished).
• Cenek, PD & Lester TJ 2008, Operational evaluation of representative passing lanes against proposed guidelines, Transit New Zealand (unpublished).
• Harwood, DW St John, AD & Warren, DL 1985, “Operational and safety effectiveness of passing lanes on two-lane highways”, Transportation Research Board Record 1026, pp.31-39.
• Harwood, DW and Hoban, CJ 1987, Low-cost methods for improving traffic operations on two lane roads, federal highway administration report no. FHWA-IP-87-2.
• Koorey, GF Farrelly, PM Mitchell, TJ and Nicholson, CS 1999, Assessing passing opportunities – stage 2, research report no. 146, Transfund New Zealand.
• Koorey, GF & Gu, J 2001, Assessing passing opportunities – stage 3, research report no. 220, Transfund New Zealand.
• Koorey, GF 2003, Assessment of rural road simulation modelling tools, research report no. 245, Transfund New Zealand.
• Land Transport New Zealand, 2006, Economic Evaluation Manual Volume 1, ISBN 0-478-28983-9.
• McLarin, MW 1997, Typical accident rates for rural passing lanes and unsealed roads, research report no. 89, Transfund New Zealand.
• Morrall, J and Werner, A 1990, “Measuring level of service of two-lane highways by overtakings”, Transportation Research Record 1287.
• Mutabazi, M Russell, ER and Stokes, RW 1999, Review of effectiveness, location, design and safety of passing lanes in Kansas, report no. K-TRAN:KSU-97-1, Kansas Dept of Transport.
• Roozenburg, A and Nicholson, A 2004, Estimating passing demand, Institution of Professional Engineers New Zealand Transportation Group Technical Conference, 2004.
• South African National Roads Agency Limited 2004, The development of an analysis method for the determination of level of service of two-lane undivided highways in South Africa, draft report project no. NRA GL 58600 – 1002.
• Tate, FN 1997, Assessing passing opportunities – stage 1, draft report for research project PR3-0097, Transit New Zealand (unpublished).
• Thrush, MJ 1996, Assessing passing opportunities, research report no. 60, Transit New Zealand.
• Transit New Zealand 2004, Traffic monitoring for state highways, SM052, May 2004.
• Transit New Zealand 2006, Background technical report for Transit New Zealand’s passing and overtaking policy, (unpublished).
• Transit New Zealand 2007, National State Highway Strategy, ISBN 978-0-478-10599-5.
• Wanty, DK 2007, Pilot study to assess passing/overtaking demand using TMS, Transit New Zealand (unpublished).
ACKNOWLEDGEMENTS
The authors acknowledge the support of Transit New Zealand, Opus International Consultants Ltd. and MWH New Zealand Ltd. in preparing and presenting this paper.
23rd
ARRB Conference – Research Partnering with Practitioners, Adelaide Australia, 2008
© ARRB Group Ltd and Authors 2008
12
AUTHOR BIOGRAPHIES
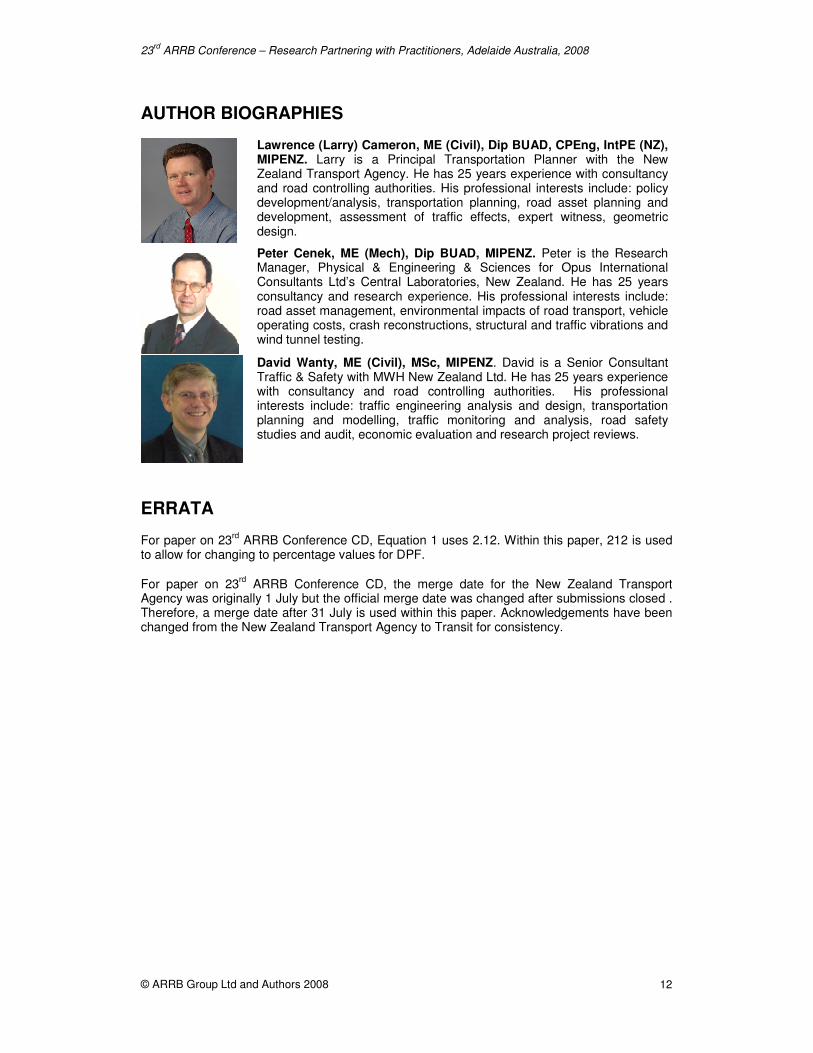
Lawrence (Larry) Cameron, ME (Civil), Dip BUAD, CPEng, IntPE (NZ), MIPENZ. Larry is a Principal Transportation Planner with the New Zealand Transport Agency. He has 25 years experience with consultancy and road controlling authorities. His professional interests include: policy development/analysis, transportation planning, road asset planning and development, assessment of traffic effects, expert witness, geometric design.
Peter Cenek, ME (Mech), Dip BUAD, MIPENZ. Peter is the Research Manager, Physical & Engineering & Sciences for Opus International Consultants Ltd’s Central Laboratories, New Zealand. He has 25 years consultancy and research experience. His professional interests include: road asset management, environmental impacts of road transport, vehicle operating costs, crash reconstructions, structural and traffic vibrations and wind tunnel testing.
David Wanty, ME (Civil), MSc, MIPENZ. David is a Senior Consultant Traffic & Safety with MWH New Zealand Ltd. He has 25 years experience with consultancy and road controlling authorities. His professional interests include: traffic engineering analysis and design, transportation planning and modelling, traffic monitoring and analysis, road safety studies and audit, economic evaluation and research project reviews.
ERRATA
For paper on 23rd
ARRB Conference CD, Equation 1 uses 2.12. Within this paper, 212 is used to allow for changing to percentage values for DPF.
For paper on 23rd
ARRB Conference CD, the merge date for the New Zealand Transport Agency was originally 1 July but the official merge date was changed after submissions closed . Therefore, a merge date after 31 July is used within this paper. Acknowledgements have been changed from the New Zealand Transport Agency to Transit for consistency.
23rd
ARRB Conference – Research Partnering with Practitioners, Adelaide Australia, 2008
© ARRB Group Ltd and Authors 2008
13
APPENDICES
Figure 1. Tool Kit Of Options
Passing and Overtaking Strategy Type Treatments and Measures
Overtaking Mainly overtaking
Passing & overtaking
Passing
Overtaking sight improvements Vegetation control, batter relocation C C C - Pavement rehabilitation, realignment C C C - Overtaking enhancements Seal widening P P C -
Ove
rtak
ing
tr
ea
tmen
ts
Overtake at PLs or SVBs, configuration of PLs or SVBs
P¹ P¹ P¹ -
Low-volume treatments 2
Shoulder widening or crawler shoulder P¹ C¹ - - SVB or short PL C¹ P¹ - - Moderate-volume treatments
3
Wide shoulder (special use requirement) - - C - PLs in series - - P P
4
Crawler lanes - - C C
Pas
sin
g
trea
tme
nts
2+1 lanes (subject to four-lane comparison) - - - P5
Centreline treatments Line markings P P P C Gap separation - - C P Central median cables - - C P Roadside/edgeline treatments Clear zone and shoulder run-off P P P P Increased signs and markings P P P P Wide profile markings C C P P Local shoulder widening and/or chip seal C C P P Cable or guard rails C C C C Intersection treatments OT zones/PLs with respect to intersections P P P P Provision for through traffic C C P P
Su
pp
ort
ing
tre
atm
en
ts
Intersection rationalisation - - P P Resource planning measures Control of direct access onto SH C C P P Submissions (plan docs, RC applications) C C P P Encourage alternative District networks C C C C New alignments C C C C Education measures Target audience C C C P General public C C C C Enforcement measures Problem locations C C C P General public C C C C TDM measures Alternative hours, routes or modes C C C P ITS measures Variable message signs with/without web cam
C C C C
Su
pp
ort
ing
mea
su
res
Speed cameras C C C C NOTES: P = preferred option/s, C = consider if specific problem 1 = only if overtaking strategy is not viable. 2 = low- volume is typically less than projected 5,000 vpd 3 = moderate-volume is typically projected 4,000-25,000 vpd. 4 = preferred on mountainous terrain. 5 = preferred on flat/rolling terrain, subject to comparison with four-lanes. Not an exclusive list, others may be added at a later date. If more than one preferred option for same treatment/measure, consider one or combination on a case-by-case basis.
23rd
ARRB Conference – Research Partnering with Practitioners, Adelaide Australia, 2008
© ARRB Group Ltd and Authors 2008
14
0.0
10.0
20.0
30.0
40.0
50.0
60.0
-4.0 -2.0 0.0 2.0 4.0 6.0 8.0 10.0 12.0
Distance (km)
Perc
en
tag
e F
oll
ow
ing
(2
sec h
ead
way)
Site 2e, PL=0.599km, F, %LVT&HCV=10, vph = 301-350
Site 3e, PL=0.556km, M, %LVT&HCV=17, vph=201-250
Site 4j, PL=0.939km, F, %LVT&HCV=6, vph=451-500
Site 5f, PL=1.397km, R, %LVT&HCV=18, vph=401-450
Site 6e, PL=1.192km, M, %LVT&HCV=10, vph=701-750
Site 8j, SVB=0.325km, M, %LVT&HCV=15, vph=151-200
Figure 2. Vehicle Classifier Layout For Surveys Of Passing Facilities
Figure 3. Percentage Following Distributions Based On 2 Seconds Headway Criterion
23rd
ARRB Conference – Research Partnering with Practitioners, Adelaide Australia, 2008
© ARRB Group Ltd and Authors 2008
15
Figure 4. Comparison Of Percentage Passing At Mid-Point Of Each Study Site
R2 = 1.00
R2 = 0.99
R2 = 0.99
R2 = 0.99
0%
10%
20%
30%
40%
50%
60%
70%
80%
90%
0 100 200 300 400 500 600 700 800 900 1000 1100 1200
Hourly Flow (vph one-way, hour ending)
Per
cen
t F
oll
ow
ing Mon-Thu avg
Friday
Saturday
Sunday
Cubic (Mon-Thu)
Cubic (Friday)
Cubic (Saturday)
Cubic (Sunday)
Start date
Sunday, 19 November
2006
7 full days
10875 vpd n/b
[00200168B] AB
Mon-Thu avg FRI SAT SUN
11.6 % 9.8% 4.8% 3.6%
80.9 96.0 all vehs
85.4 99.9
platoon78.3 93.7
free
mean +std dev km/h
9.5%
600-1300 vph, RSQ = 0.974.0 secs
6
SH 2/168 n Kairua Rd n/b
HV
linear best fit for high flows
vpd o/take
HV
Figure 5. Plot Of Percentage Following Versus One-Way Flow For An Example Site
0.0
5.0
10.0
15.0
20.0
25.0
30.0
0 100 200 300 400 500 600 700 800
One Way Hourly Flow - Treated Direction (v/h)
Perc
en
t P
assin
g a
t
Mid
-Po
int
(%)
Site 2e, PL=0.599km, PLgrade=6.8%R Site 3e, PL=0.556km, PLgrade=5.7%
Site 4j, PL=0.939km, PLgrade=0.4% Site 5F, PL=1.397km, PLgrade=0.3%
Site 6e, PL=1.192km, PLgrade=7.2% Site 8j, SVB=0.325km, PLgrade=6.4%
23rd
ARRB Conference – Research Partnering with Practitioners, Adelaide Australia, 2008
© ARRB Group Ltd and Authors 2008
16
LEGEND
All sites: Key for the first letter, speed for all vehicles A: <68 km/h; B: 68-78, C: 78-88; D: >=88 km/h Interval sites WADT, Mon-Fri %HV, mean speed all vehs, Site id Individual vehicles sites Site id, mean free speed/ lead veh speed, M-S %HV
0%
10%
20%
30%
40%
50%
60%
70%
80%
90%
0 100 200 300 400 500 600 700 800 900 1000 1100 1200 1300 1400
Average Weekday Hourly Flow (vph one-way, hour ending)
Per
cen
t F
oll
ow
ing
D 6898,21%,93 00210002-AB
D 6895,20%,89 00220002-BA
B 9968,15%,70 001A0526-AB
B 9855,15%,75 00120526-BA
C 12463,7%,84 001A0559-AB
D 12518,8%,90 001B0559-BA
D 9489,9%,88 001A0563-AB
B 10982,13%,68 001A0575-AB
D 7523,14%,93 001A0580-AB
D 7412,15%,88 001B0580-BA
A 5292,19%,67 001A0613-AB
D 4685,23%,97 001A0620-AB
D 4620,22%,98 001B0620-BA
D 3081,20%,88 00100729-AB
C 2705,22%,81 00100729-BA
D 00100763-AB 88.0/87.4-21%
D 00100763-BA 103.3/102.6-23%
SH 1 sites & SH 2/2
Figure 6. Plot Of Percentage Following Versus One- Way Average Mon-Fri Flow For SH 1 Sites
(Based on 4 seconds Headway Criterion)
SH 1S Blenheim South (telem site 87) : n/b
y = 0.001871x
R2 = 0.910848
0%
10%
20%
30%
40%
50%
60%
70%
80%
0 50 100 150 200 250 300 350 400 450 500 550 600
One-Way Flow (vph)
Per
cen
t F
oll
ow
ing
20/12/2007
21/12/2007
22/12/2007
23/12/2007
24/12/2007
25/12/2007
26/12/2007
88+9 km/h, 22.0% HCV+LVT, 2354 vpd, 34 %foll
88+8 km/h, 18.3% HCV+LVT, 2860 vpd, 32 %foll
88+9 km/h, 15.1% HCV+LVT, 3080 vpd, 36 %foll
88+9 km/h, 13.5% HCV+LVT, 2768 vpd, 36 %foll
89+9 km/h, 11.2% HCV+LVT, 2342 vpd, 32 %foll
91+9 km/h, 10.7% HCV+LVT, 1235 vpd, 19 %foll
88+9 km/h, 16.9% HCV+LVT, 2696 vpd, 39 %foll
< 4 secs
mean+std dev speed, >=5.5m, ADT, < 4 secs
based on daily one-way flow for all vehicles
Linear Best Fit through
origin - All days, >= 40 vph
Christmas Day
was a Tuesday
Figure 7. Plot Of Percentage Following Versus One-Way For SH 1S Blenheim South site