particle size distribution measurement from …umpir.ump.edu.my/id/eprint/13492/8/particle size...
TRANSCRIPT

PARTICLE SIZE DISTRIBUTION MEASUREMENT FROM DIFFERENT
INDOOR ACTIVITIES
AUI SHWEJ HARN
Report submitted in partial fulfilment of the requirements for the award of the degree of
Bachelor of Occupational Safety and Health (Hons)
Faculty of Engineering Technology UNIVERSITI MALAYSIA PAHANG
JANUARY 2015
vi
ABSTRACT
Human exposure to particulate matter can have significant harmful effects on the
respiratory and cardiovascular system. These effects vary with number, size, and
chemical composition of particulate matter. Studying the particle size distribution under
different indoor activities can help to predict the emission and settlement of particles
with different sizes. In this research, an experimental study was carried out to
investigate the particle size distribution under different indoor activities in main office
FTeK and OSHMO. The indoor activities of office being studied were printing,
photocopying and use of air freshener sprays. Data collection was done by using laser
light scattering instrument to measure the number concentration of particles ranging
from 0.3 tm to 10 Rm. Then, the particle size distribution graph for each activity was
generated using the particle number concentration measured and particle size range.
Environmental parameters such as temperature, relative humidity, air velocity were
measured using IAQ meter. Air change rate was measured using Concentration Decay
Test Method (ASTM Standards E741-00). From the result obtained, the particle size
distribution of printing, photocopy and use of freshener spray was ranged from 0.3 tm
to 10 pm, with the predominant size range of 0.3 pm - 0.5 pm. The use of air freshener
has the highest emission rates which are 3.73 x 10¹⁰ s' at FTeK and 2.97 x 10¹⁰ s at
OSHMO. Whereas printing has the lowest emission rates, which are 3.92 x 10¹⁰ s at
FTeK and 2.63 x 10¹⁰ s at OSHMO. Significant elevation of indoor particle
concentration was noted during the three activities. The photocopy activity can be the
major source of indoor particle concentration because it emitted high number
concentration of particles within a short period and the particles remain fluctuated in the
indoor air with slow decay rate. In conclusion, the three activities selected produced
high level of submicrometer particles (< 1 pm) and indoor particle concentration is
mainly associated with the indoor activities.
vii
4BSTRAK
Pendedahan manusia kepada zarahan boleh memberi kesan buruk yang ketara pada
sistem pernafasan dan kardiovaskular. Kesan-kesan tersebut berbeza daripada segi
nombor, saiz, dan komposisi kimia bahan zarahan. Pemahaman tentang taburan saiz
zarah bawah aktiviti-aktiviti yang berbeza dapat membantu untuk meramalkan
pelepasan zarahan dengan saiz yang berbeza. Dalam projek ini, kaijian tentang taburan
saiz zarah di bawah tiga jenis aktiviti yang dijalankan di pejabat utama FTeK dan
OSHMO telah dilakukan. Tiga jenis aktiviti tersebut termasuklah mencetak, fotokopi
dan penggunaan semburan penyegar udara. Pengumpulan data dilakukan dengan
menggunakan instrumen penyerakan cahaya laser untuk mengukur kepekatan jumlah
zarah yang terdiri daripada 0.3 gm hingga 10 Rm. Kemudian, pengedaran graf saiz
zarah bagi setiap aktiviti telah dijana dengan menggunakan kepekatan jumlah zarah
diukur dan julat saiz zarah. Parameter persekitaran seperti suhu, kelembapan relative
dan halaju udara adalah diukur menggunakan IAQ meter. Kadar perubahan udara pula
diukur menggunakan kaedah ujian dalam Standard ASTM E741-00. Daripada
keputusan yang diperolehi, taburan saiz zarah mencetak, fotokopi dan penggunaan
penyegar semburan adalah dalam lingkungan antara 0.3 jim hingga 10 [Lm. 0.3 jim - 0.5
[Lm ialah size yang dominan dalam tiga jenis aktiviti tersebut. Penggunaan penyegar
udara mempunyai kadar pelepasan zarah tertinggi iaitu 3.73 x 10¹⁰ s_ I di FTeK dan 2.97
x 1010 di OSHMO. Manakala mencetak mempunyai kadar pelepasan yang paling
rendah, iaitu 3.92 x 10¹⁰ s_ I di FTeK dan 2.63 x 10¹⁰ s_ I di OSHMO. Perubahan yang
ketara bagi tahap jumlah zarah di dalam pejabat telah diperhatikan semasa tiga aktiviti
tersebut dij alankan. Aktiviti fotokopi boleh menj adi sumber zarahan utama dalam
pejabat kerana ia melepaskan jumlah zarah yang tinggi dalam masa yang singkat
dengan kadar pereputan zarah yang sangat rendah. Kesimpulannya, ketiga-tiga aktiviti
yang dipilih telah menghasilkan jumlah zarah submicrometer (< 1 jim) yang tinggi dan
tahap jumlah zarah dalam pejabat mempunyai hubungan positif dengan aktiviti-aktiviti
tersebut.
TABLLE OF CONTENTS
Page
SUPERVISOR'S DECLARATION ii
STUDENT'S DECLARATION iii
DECLARATION iv
ACKNOWLEDGEMENTS v
ABSTRACT vi
ABSTRAK vii
TABLLE OF CONTENTS viii
LIST OF TABLES xii
LIST OF FIGURES xiii
LIST OF SYMBOLS xv
LIST OF ABBREVIATIONS xvi
CHAPTER 1 INTRODUCTION
1.1 Background of Study 1
1.2 Problem Statement 2
1.3 Research Objectives 3
1.4 Research Questions 3
1.5 Research Hypothesis 4
1.6 Scope of Study 4
1.7 Significance of Study 4
1.8 Operational Definitions 5
1.9 Conceptual Framework 6
viii
lx
CHAPTER 2 LITERATURE REVIEW
2.1 Introduction 7
2.2 Physical Properties of Particle 7
2.2.1 Particle Size 7
2.2.2 Particle Size Distribution 10
2.3 Indoor Activities in Office 12
2.3.1 Printing 13
2.3.2 Photocopying
14
2.3.3 Use of Cleaning and Air Freshener Sprays
15
2.4 Formation Mechanisms of Particles from Indoor Activities 16
2.5 Particle Emission Rates Estimation
18
2.6 Health Impacts of Inhalation of Particles
20
2.7 Influence of Air Change Rate on Indoor Particle Concentrations
23
CHAPTER 3 METHODOLOGY
3.1 Introduction
25
3.2 Research Design 25
3.2.1 Study Area 26
3.3 Sampling Strategy 27
3.4 Data Collection and Instrumentation 30
3.4.1 Air Change Rate 30
3.4.2 Environmental Parameters 32
3.4.3 Particle Number Concentration and Size Distribution 32
3.4.4 Particle Mass Concentration 33
3.4.5 Estimation of Particle Emission Rate 34
3.4.6 Test Procedure for Activities Selected 35
3.5 Data Processing and Analysis 35
x
3.5.1 Descriptive Analysis 36
3.5.2 Inferential Analysis 36
3.6 Quality Assurance 36
3.7 Study Limitation 36
3.8 Study Ethics •37
CHAPTER 4 RESULT AND DISCUSSION
4.1 Introduction 38
4.2 Walktbrough Observation 38
4.3 Air Change Rate 40
4.4 Environmental Parameters 42
4.4.1 Comparison Before and After Activities 44
4.5 Particle Number Concentration and Size Distribution 46
4.6 Particle Emission Rate 50
4.6.1 Printing 51
4.6.2 Photocopy 53
4.6.3 Use of Air Freshener Spray 55
4.7 Indoor Particle Concentration of Offices 56
CHAPTER 5 CONCLUSION AND RECOMMENDATION
5.1 Introduction 61
5.2 Conclusion 61
5.3 Recommendation62
REFERENCES 64

APPENDICES
A Layout Design of Ground Floor of Block A2 71
BI Particle Number Concentration Based on Size Ranges During Printing
in FTeK
B2 Particle Number Concentration Based on Size Ranges During Printing
inOSHMO
B3 Particle Number Concentration Based on Size Ranges During
Photocopy in FTeK
B4 Particle Number Concentration Based on Size Ranges During
Photocopy in OSHMO
B5 Particle Number Concentration Based on Size Ranges During Use of
Air Freshener Spray in FTeK
B6 Particle Number Concentration Based on Size Ranges During Use of
Air Freshener Spray in OSHMO
C Photos Taken during Data Collection 82
D Gantt Chart 83
xi
w

LIST OF TABLE
Table No. Title Page
1.1 Operational Definitions 5
2.1 Particle number and surface area per 10.xg m 3 of airborne 21 particles
3.1 Description of indoor activities and its test procedure 35
4.1 Summary of information on preliminary walkthrough 39 observation
4.2 Air change rate for main office of FTeK and OSHMO 41
4.3 The temperature, relative humidity and air velocity of six 43 sampling points
4.4 Acceptable range for specific environmental parameters 44
4.5 Comparison of environmental parameters before and after 45
indoor activities
4.6 Result of ANOVA 45
4.7 Particle number concentrations based on different size range 46 (FTeK)
4.8 Particle number concentrations based on different size range 46 (OSHMO)
4.9 The emission rate for printing, photocopy and use of freshener 50
spray
4.10 Mean and standard deviation for indoor particle concentration 58
during office and lunch hours in FTeK
4.11 Mean and standard deviation for indoor particle concentration 59
during office and lunch hours in OSHMO
xii

LIST OF FIGURES
Figure No. Title Page
1.1 Conceptual framework of study 6
2.1 Illustration of the concept of equivalent spheres 8
2.2 Examples of particle shapes 8
2.3 Classification of particles in different size ranges 9
2.4 Particle number distributions of particles generated during 11 printing and idle mode
2.5 The volume median diameters (VMDs) during oven cooking 12 and sautéing in one home
2.6 Particulate movement and removal 17
2.7 Predicted fractional deposition of inhaled particles in human 22 respiratory tract
2.8 Indoor-outdoor ratios of (A) PM(0.02-0.1), (B) PM(1.0-05), 24 (C) PM (0.7-2.5), and (D) PM(2.5-10) versus air exchange rates measured in each home. Data are based on hourly averages
3.1 Plant layout of Faculty Technology Engineering (FTeK) 26
3.2 Plant layout of Occupational Safety and Health Management 27 Office (OSHMO)
3.3 The process flow of research 29
3.4 Measurement of air change rate in office room using gas 31 tracer methods
3.5 CO2 was released into enclosed office room with a uniform 31 concentration
3.6 IAQ meter 32
3.7 Handheld Laser Particle Counters 33
3.8 DustMate 34
4.1 Main office of Faculty Technology Engineering (FTeK) 40
xlii
xlv
4.2 Occupational Safety and Health Management Office 40 (OSHMO)
4.3 CO2 decay rate in main office of FTeK and OSHMO 42
4.4 Comparison of particle size concentration based on different 47 size range for different activities in FTeK
4.5 Comparison of particle size concentration based on different 47 size range for different activities in OSHMO
4.6 Comparison of particle size distribution of different 48 activities in FTeK
4.7 Comparison of particle size distribution of different 49 activities in OSHMO
4.8 Comparison of particle emission rates between different 51 activities
4.9 Particle number concentration measured during printing in 52 FTeK
4.10 Particle number concentration measured during printing in 52 OSHMO
4.11 Particle number concentration measured during photocopy in 54 FTeK
4.12 Particle number concentration measured during photocopy in 54 OSHMO
4.13 Particle number concentration measured during spray in 55 FTeK
4.14 Particle number concentration measured during spray in 56 OSHMO
4.15 Indoor particle concentration variation during office and 57 lunch hours in FTeK
4.16 Indoor particle concentration variation during office and 57
lunch hours in OSHMO
4.17 Comparison of Indoor particle concentration during office 59
and lunch hours for FTeK and OSHMO
LIST OF SYMBOLS
% Percentage
> Greater than
< Less than
± Standard deviation
a Air change rate
AT Time difference
tg m 3 Microgram per cubic metre
Micrometre
.tm cm-3 Micometre per cubic centimetre
C Degree Celcius
cm-3 per cubic centimetre
cm Cubic centimetre
CO2 Carbon Dioxide
hr' per hour
L Litre
L/min Litre per minute
m s 1 Meter per second
m3 Cubic metre
rim Nanometre
s second
S Source strength or emission rate
t Time
V Volume
xv

LIST OF ABBREVIATIONS
ASHRAE American Society of Heating, Refrigerating, and Air-Conditioning Engineers
ANOVA Analysis of variance
ASTM American Society for Testing and Materials
CMD Count Median Diameter
DOSH Department of Occupational Safety and Health
FTeK Faculty of Technology Engineering
HVAC Heating, Ventilating and Air Conditioning
IAQ Indoor Air Quality
MMD Mass Median Diameter
NAAQS National Ambient Air Quality Standard
NMD Number Median Diameter
NOx Oxides of Nitrogen
03 Ozone
OH Hydroxyl radical
OSHMO Occupational Safety and Health Management Office
PSD Particle size distribution
PM Particulate matter
SOA Secondary organic aerosol
SVOC Semi-volatile organic compounds
TACs Toxic air contaminants
TSP Total suspended particle
TWA Time Weighted Average
UFP Ultrafine particle
xvi

xvii
USEPA United States Environmental Protection Agency
VMD Volume Median Diameter
VOC Volatile organic compound
CHAPTER 1
INTRODUCTION
1.1 BACKGROUND OF STUDY
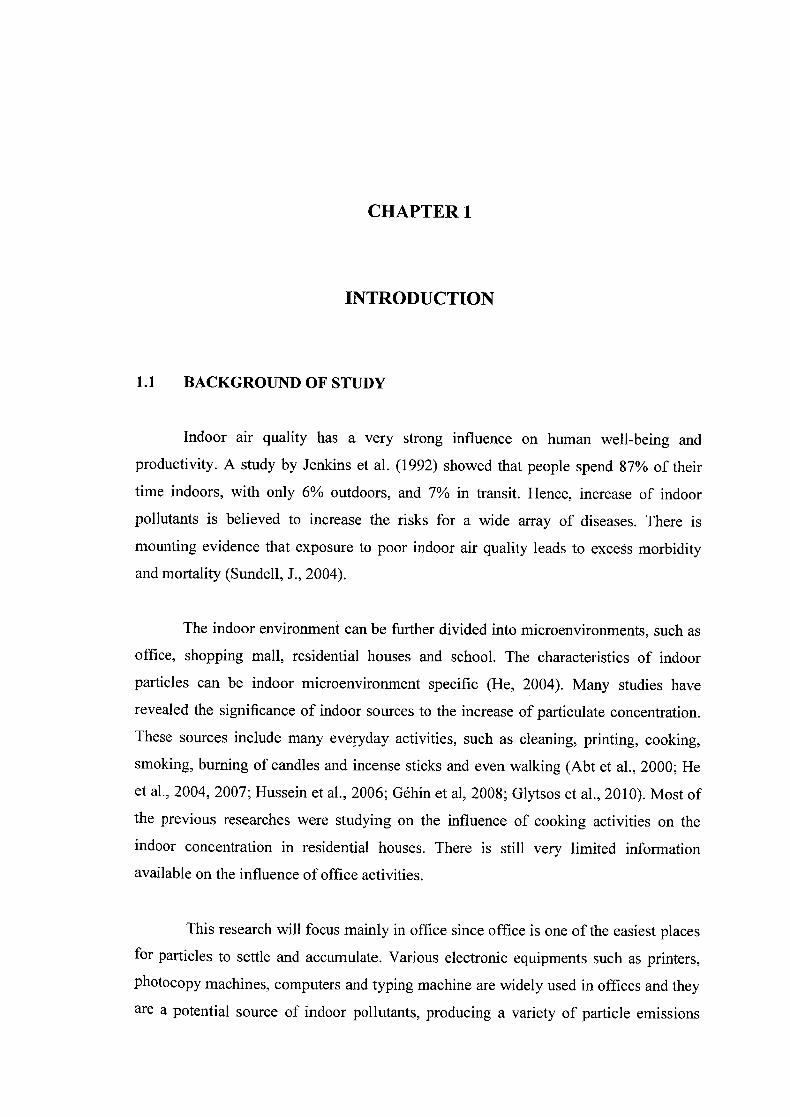
Indoor air quality has a very strong influence on human well-being and
productivity. A study by Jenkins et al. (1992) showed that people spend 87% of their
time indoors, with only 6% outdoors, and 7% in transit. Hence, increase of indoor
pollutants is believed to increase the risks for a wide array of diseases. There is
mounting evidence that exposure to poor indoor air quality leads to excess morbidity
and mortality (Sundell, J., 2004).
The indoor environment can be further divided into microenvironments, such as
office, shopping mall, residential houses and school. The characteristics of indoor
particles can be indoor microenvironment specific (He, 2004). Many studies have
revealed the significance of indoor sources to the increase of particulate concentration.
These sources include many everyday activities, such as cleaning, printing, cooking,
smoking, burning of candles and incense sticks and even walking (Abt et al., 2000; He
et al., 2004, 2007; Hussein et al., 2006; Géhin et al, 2008; Glytsos et al., 2010). Most of
the previous researches were studying on the influence of cooking activities on the
indoor concentration in residential houses. There is still very limited information
available on the influence of office activities.
This research will focus mainly in office since office is one of the easiest places
for particles to settle and accumulate. Various electronic equipments such as printers,
photocopy machines, computers and typing machine are widely used in offices and they
are a potential source of indoor pollutants, producing a variety of particle emissions

2
(Lee et al., 2001; Kaji et al., 2007). It is also important to note that the smaller and
larger particles in the air behave differently (He, 2004). In addition to the penetration of
pollutants from outdoor air, most indoor built environments contain air pollution
sources that release fibers, particles, organic vapours, or inorganic gases (He et al.,
2007).
From the previous studies, it showed that the major sources of indoor pollutants
in office are generated from photocopier, printers and air freshener spray. According to
He et al. (2007), the monitoring of particle characteristics in a large open-plan office
showed that particles generated by printers can significantly affect the submicrometer
particle (< 1 [tm) number concentration levels in the office. Besides that, fine particles
were detected (< 1 tm) in the study of Afshari et al. (2005) during the use of air
freshener sprays. Though specific printer-emitted VOCs and PM has been studied (Kagi
et al., 2007), no information on the size distribution of the photocopier-emitted particles
has been reported. Field studies on the impact of photocopiers and printers on indoor air
quality are still relatively limited.
Furthermore, this research focused more on the particle number concentration
and distribution of different indoor activities. This is due to the existing database is very
limited to particle mass concentration and emission rates with only a few studies
reported on particle number concentration. However, since the smaller particles can be
high in number but contribute very little to mass, and they have higher probability of
penetration into deeper parts of human respiratory tract, they should be getting more
attention from researchers. Recent studies have also suggested that the particle number
concentration would be a more appropriate predictor of health impact than mass
concentration.
1.2 PROBLEM STATEMENT
Human exposure to particulate matter can have significant harmful effects on the
respiratory and cardiovascular system. These effects vary with number, size, and
chemical composition of particulate matter, which vary significantly with space and
time (Davidson et al., 2005). The PM concentration during indoor activities can reach
3
elevated values (up to tenfold compared to the situation without the sources) for short or
even for longer periods of time (Wallace, 2006). Since particle size determines the fate
of particles on or in the human body which in turn affects a person's exposure risk, it is
necessary to fully understand the size distribution of particles when determining
secondary exposure.
Hence, in this research, several indoor activities in an office were studied in
order to provide size-specific particle number distribution. This is important because
particulate matter of different sizes is known to cause different levels of adverse health
impacts to human. Finer particles penetrate into deeper parts of the human body and
cause respiratory or cardiovascular disorders (Jimoda, 2012).
1.3 RESEARCH OBJECTIVES
The aim of the study intends to meet the objectives below:
i. To investigate the particle size distribution under different indoor activities;
ii. To evaluate the relationship between different indoor activities and
indoor particle concentration level.
1.4 RESEARCH QUESTIONS
This research is further guided by the research questions below with the purpose
to gain better understanding of the research based on the identified research objectives.
The two research questions are as follows:
i. How is the particle size distribution under different indoor activities?
ii. Is there any relationship between indoor activities and indoor particle
concentration levels?
4
1.5 RESEARCH HYPOTHESIS
This study is guided by the following hypothesis:
Hoi: There are no particles of different sizes emitted during different indoor
activities in different proportion.
Hu: There are particles of different sizes emitted during different indoor
activities in different proportion.
1102: There is no relationship between indoor activities and indoor particle
concentration level.
H12: There is a relationship between indoor activities and indoor particle
concentration level.
1.6 SCOPE OF STUDY
A continuous real time monitoring measurement was conducted in offices.
Number of occupants, presence of HVAC system, models of printer, photocopier and
air freshener sprays were recorded. Particle size distribution of particles ranging from
0.3jim to 1 Ojim under different indoor activities in the office was investigated to
identify number concentration of particles with different sizes. The indoor activities
being studied were printing, photocopying and use of air freshener sprays. The particle
size distribution of these activities will be compared to find out which activity produce
the highest level of submicrometer particles (< 1 tm). Hence, we could predict the
exposure risk of office workers during different indoor activities.
1.7 SIGNIFICANT OF STUDY
Indoor sources have been identified as a major contributor to the increase of
particle concentration in indoor environment. Focusing on the particle size distribution
of particle is very important for a number of reasons. Size has a major influence on the
settling velocity of particles. Studying the particle size distribution under different
indoor activities can help to predict the emission and settlement of particles with
different sizes.
5
By understanding the particle size distribution of different indoor activities, we
could compare which activities involved the submicrometer particles that have high
impact on human health. This helps to identify the exposure risk so that preventive
measures and action plan could be developed to reduce the risk. In addition, the
information gained in this study can be used as a reference in the future studies which
related to indoor air quality. This can help to further improve the safety and health
system and parameters in the workplace.
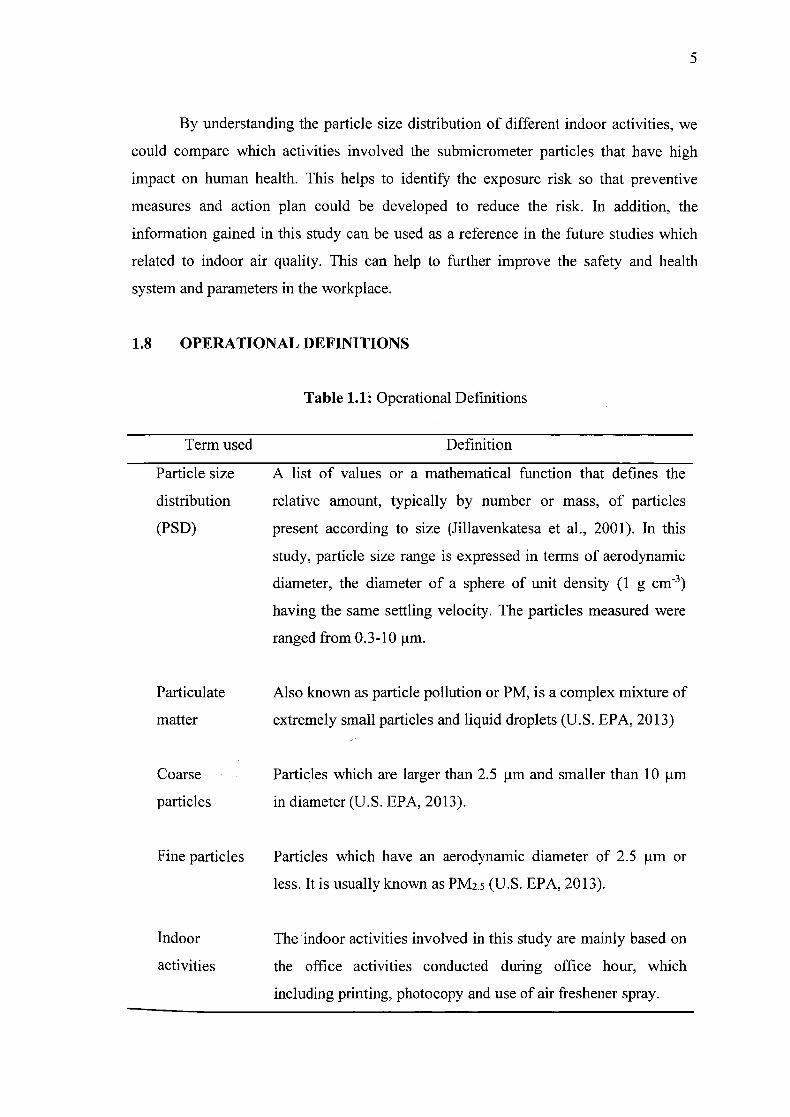
1.8 OPERATIONAL DEFINITIONS
Table 1.1: Operational Definitions
Term used Definition
Particle size A list of values or a mathematical function that defines the
distribution relative amount, typically by number or mass, of particles
(PSD) present according to size (Jillavenkatesa et al., 2001). In this
study, particle size range is expressed in terms of aerodynamic
diameter, the diameter of a sphere of unit density (1 g cm-3)
having the same settling velocity. The particles measured were
ranged from 0.3-10 vim.
Particulate Also known as particle pollution or PM, is a complex mixture of
matter extremely small particles and liquid droplets (U.S. EPA, 2013)
Coarse Particles which are larger than 2.5 tm and smaller than 10 pm
particles in diameter (U.S. EPA, 2013).
Fine particles Particles which have an aerodynamic diameter of 2.5 tm or
less. It is usually known as PM2.5 (U.S. EPA, 2013).
Indoor The indoor activities involved in this study are mainly based on
activities the office activities conducted during office hour, which
including printing, photocopy and use of air freshener spray.
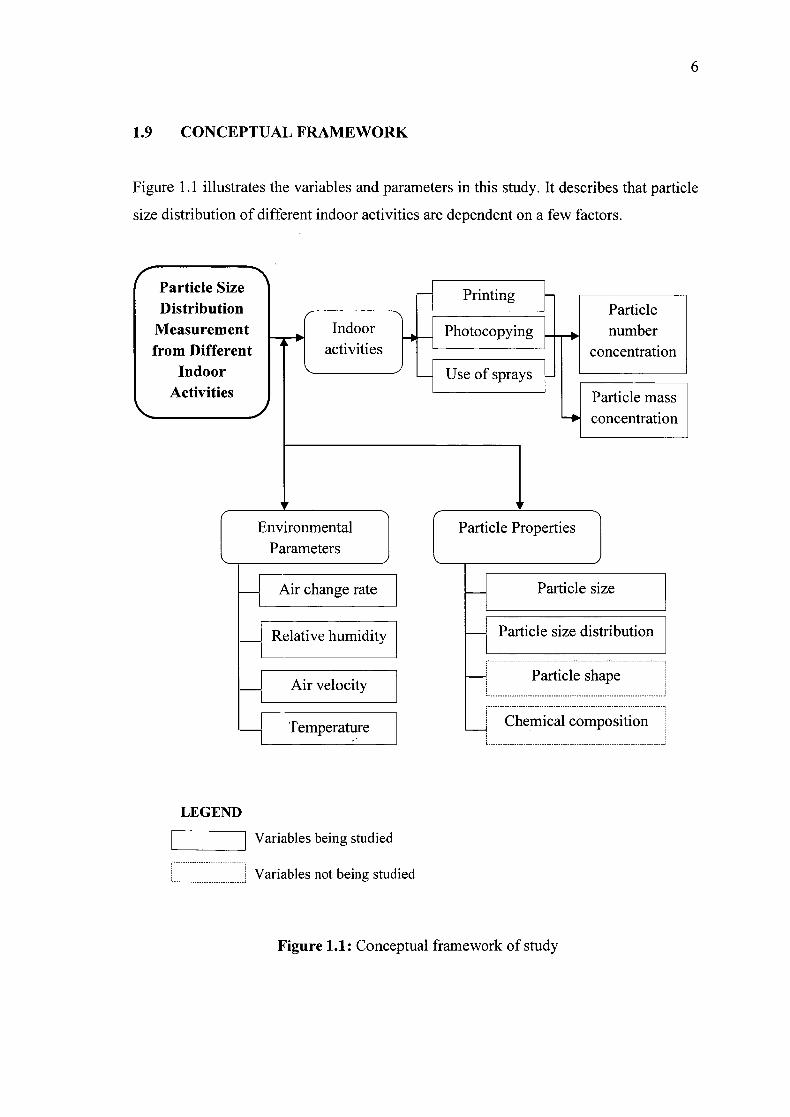
1.9 CONCEPTUAL FRAMEWORK
Figure 1.1 illustrates the variables and parameters in this study. It describes that particle
size distribution of different indoor activities are dependent on a few factors.
Particle Size Distribution I Printing
Particle Measurement Indoor _____ Photocopying number from Different L activities concentration
Indoor Use of sprays __________
Particle mass Activities
concentration
Environmental Particle Properties Parameters
Air change rate Particle size
Relative humidity I H Particle size distribution
1--', Particle shape
Air velocity
Temperature LJ Chemical composition
LEGEND
Variables being studied
Variables not being studied
Figure 1.1: Conceptual framework of study
CHAPTER 2
LITERATURE REVIEW
2.1 INTRODUCTION
This chapter reviews the relevant literature that related to my study such as the
definition of particle properties and the description of three main indoor activities in
office which have been selected in this research. It also provides a solid historical
background to support this study. The strengths and weakness from relevant studies will
serve as a stepping stone to achieve the objectives of current research.
2.2 PHYSICAL PROPERTIES OF PARTICLE
The behaviour of particulate matter is often dominated by the physical properties of
particles. There are a few important physical properties of particles to measure. These
include particle size, particle -shape, surface properties, charge properties and
microstructure. For this research, particle size distribution is the main characteristic to
be studied. Hence, the focus will be placed on the most significant and easy to measure
property, which is particle size.
2.2.1 Particle Size
By far the most important physical property of particulate matter is particle size.
Particles are 3-dimensional objects, and they cannot be fully described by a single
dimension such as a radius or diameter unless they are perfect spheres (e.g. emulsions
8
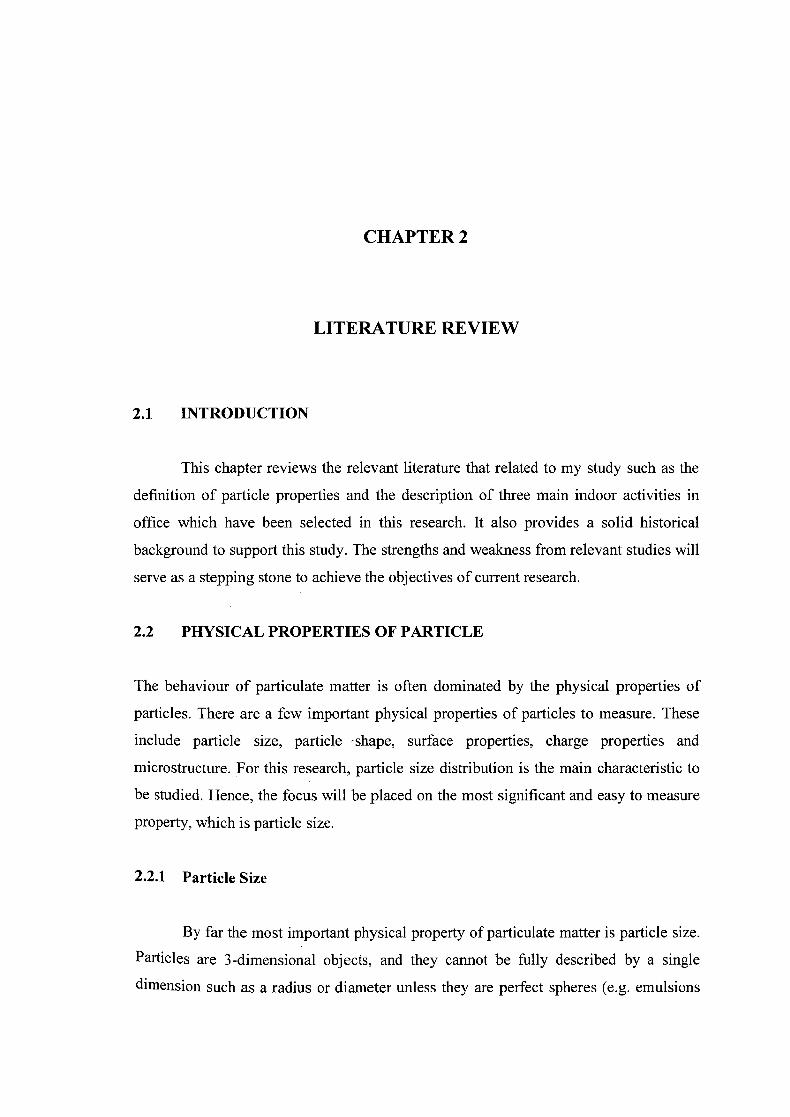
or bubbles). Hence, it is usually convenient to define the particle size in term of
equivalent spheres concept in order to simplify the measurement process.
Sphere of same minimum length
Sphere of same
wn
w
weight
Sphere having same sedimentation rate d
Sphere of same
Sphere passing same surface area
sieve aperture
Figure 2.1: Illustration of the concept of equivalent spheres
Source: A Basic Guide to Particle Characterization (2012)
Spherical (e.g. fly h)
Aggregates Irregular
(e.g. soot) (e.g. minor)
owe
Shape
odlt Fibrous
Ce.Q. tai) (e, . cellulose)
Platelet (e. g. mke
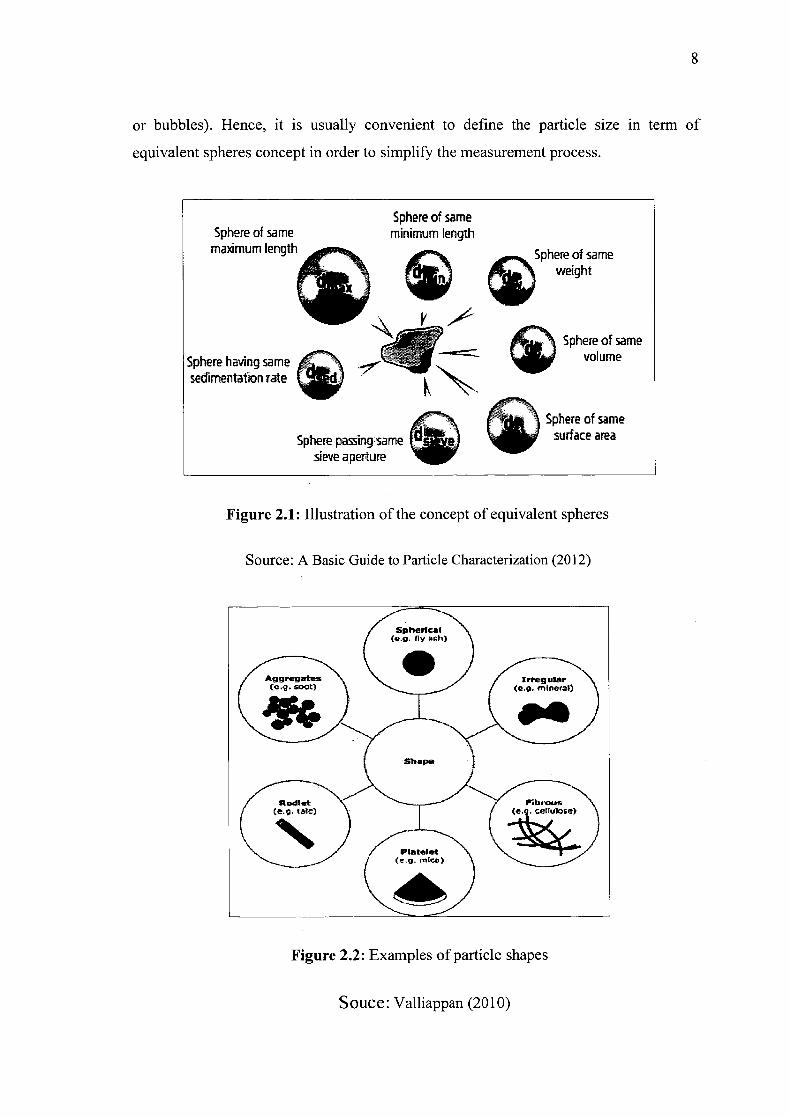
4* Figure 2.2: Examples of particle shapes
Sphere of same maximum length
SLSphere of same
volume
Souce: Valliappan (2010)

As shown in Figure 2. 1, particle size is defined by the diameter of an equivalent
sphere which has the same property as the actual particle such as mass or volume. The
equivalent sphere concept works well for particles with regular shape. However, it may
not always be appropriate to apply on particles with irregular shape due to significant
difference in size dimension. In fact, the atmospheric particles could have different
shapes and densities, as shown in Figure 2.2 (Valliappan, 2010).
Different terminologies have been used to define the particles in various size
ranges. Total Suspended Particles (TSP) refers to all particles suspended in the air,
while PMio and PM2.5 are airborne particulate matter equal to or smaller than 10 and 2.5
tim, respectively. At least one of these three type of particulates is included as part of
indoor air quality guidelines in most countries around the world. These particle
parameters are therefore important from a regulatory standpoint. For research purposes,
airborne particles are also classified as super-coarse (> 10 jim), coarse (2.5- 10 jim), fine
(<2.5 tm), ultrafine (<0.1 pm), and nanoparticles (<0.05 jim). Identification of PM
can also be based directly on their sizes, for example, supermicrometer and
submicrometer particles denote those larger and smaller than 1 jim, respectively. Figure
2.3 summarizes the common terminologies used to describe particles of different
aerodynamic diameters and their corresponding size ranges.
Particle diameter, Dp (pm)
iO 1012 10 Up, 10' 10 I I I I I III I i i I UI I I I I UI 1111
Total suspended pakIcs(1) I (PM
PM2.5 or Fine particles Coarse SupErcoarse
Luitrafine particles (UFPs
Nanoparticles J [ubkrthneLr parlides - 1superrn1crornerprUcIesl
Figure 2.3: Classification of particles in different size ranges

10
2.2.2 Particle Size Distribution
Measurement of particle size distributions is routinely carried out across a wide
range of industries and is often a critical parameter in the industrial and non-industrial
buildings. Measuring particle size and understanding how it is distributed during
different indoor activities is important to determine the potential health risk exposure to
the occupants (Morawska and Salthammer, 2003).
Particles suspended in the air are ranged in size from about 1 nm to about 100
tm. The former is molecular size and the latter is the size above which particles
sediment rapidly due to gravitational forces. Almost all sources generate particles with
some distribution of the sizes (polydisperse aerosol) rather than particles of a single size
(monodisperse aerosol). The spread of the particle size distribution is characterized by
an arithmetic or geometric (logarithmic) standard deviation. The most common ways of
characterizing a particle distribution are in terms of its mean size, which is the average
of all sizes, its median size, which means that there are an equal number of particles
above and below this size, or its mode size, which is the size with the maximum number
of particles. The terms used include: count median diameter (CMD), number median
diameter (NMD) or mass median diameter (MMD) respectively (Morawska and
Salthammer, 2003).
The particle size distribution is always presented in either a frequency
distribution curve, or a cumulative (undersize) distribution curve. Particles generated by
most sources have a log-normal size distribution, which means that the particle
concentration versus particle size curve is "normal" (bell-shaped) when the particles are
plotted on a logarithmic scale. Geometric standard deviation characterizes the width of
the peak in the distribution. When a single pollution source is investigated and when it
operates under steady conditions (for example, steady parameters for a combustion
process), the size distribution obtained is likely to have one distinctive peak and
sometimes additional, usually much smaller peaks. These peaks are called modes of the
distribution. Different emission sources are characterized by different size distributions
and while these distributions are not unique to these particle sources alone, the
information from the size distribution can help to identify their contribution to particle

I
concentrations in ambient air, and also serve as a source signature (Morawska and
Salthammer, 2003).
Particle distributions can be presented either in terms of number or mass
distributions. In terms of number, the vast majority of airborne particles are in the ultra-
fine range. Different sources contribute to the generation of particles in the
submicrometer range, which is predominant in particle number, and different sources to
larger particles, which predominate in mass. For example, measurements of particle
concentrations as a function of time conducted in a large office building with
mechanical ventilation, air-conditioning, and sealed windows, demonstrated that for the
three smaller particle size bins of 0.3-0.5 jim, 0.5-0.7 jim, and 0.7-1.0 jim, the particle
number concentrations decrease under most conditions by roughly an order of
magnitude as the particle size bin increases one step (Fisk et al., 2000). Figure 2.4
presents an example of number distributions of particles generated during printing and
idle mode.
L2OE+05
IOOE+05 -Q- Before printing
8-OOE+04I-W-after90page pnnt
600E+04 0
400E+04 - C 0 U
200E+04
0.00E+O010 100 1000
Particle size (nrn)
Figure 2.4: Particle number distributions of particles generated during printing and
idle mode
Souce: Valliappan (2010)