part v annexes - unstats.un.org handbook... · harmonizing different classifications ... conceptual...
TRANSCRIPT

1
Part V ANNEXES
Contents Annex I: Empirical challenges........................................................................................................................ 3
1. Estimation of missing countries, import flow matrices and/or distribution margins ....................... 3
2. Overcoming national data inconsistencies between national accounts and trade statistics ........... 4
3. Estimation of international trade and transport margins matrices .................................................. 6
4. Reconciling international trade asymmetries (goods and services) ................................................. 7
5. Harmonizing different classifications ................................................................................................ 9
6. Direct purchases abroad ................................................................................................................. 10
7. To balance or not to balance…........................................................................................................ 10
8. Construction of inter-country input-output tables ......................................................................... 11
9. International cooperation in data sources and methodologies ..................................................... 11
ANNEX II: Conceptual Accounting topics .................................................................................................... 13
Figure 8.1 - Global Value Chain (GVC) ..................................................................................................... 13
1. Contract Manufacturing in a Global Value Chain ........................................................................... 14
2. Outward Processing ........................................................................................................................ 14
a. Making adjustments in merchandise trade statistics ................................................................. 14
b. Estimating imports of goods purchased abroad for processing ................................................. 16
c. Estimating exports of processed goods not returning ................................................................ 17
d. Estimating imports of processing services .................................................................................. 18
e. Estimating (changes in) inventories held abroad........................................................................ 18
f. Recording of goods returning to the country of principal .......................................................... 19
g. Summary of recordings and adjustment .................................................................................... 20
3. Inward Processing ........................................................................................................................... 20
a. Making adjustments in merchandise trade statistics ................................................................. 21
b. Estimating exports for purchases of goods for processing by the principal in the country of
processor ............................................................................................................................................. 21
c. Estimating exports of processing services .................................................................................. 22
d. Excluding inventories under ownership of the principal ............................................................ 23
e. Summary of recordings ............................................................................................................... 23
4. Merchanting .................................................................................................................................... 24
a. Estimating of the trade service of the merchant ........................................................................ 24

2
b. Estimating the net exports under merchanting .......................................................................... 24
c. Estimating (changes in) inventories held abroad........................................................................ 25
5. Factoryless Goods Production ........................................................................................................ 26
6. Transactions in Intellectual Property Products ............................................................................... 26
7. BEPS Recommendations ................................................................................................................. 28
8. Summary ......................................................................................................................................... 29

3
Annex I: Empirical challenges
1. In reality, the construction of a global (or regional) SUIOT is mired in empirical challenges, including the need to make up for the sometimes limited availability of, and level of detail in, national SUIOTs; estimating missing countries, import flow matrices and/or distribution margins matrices; overcoming national data inconsistencies between national accounts and trade statistics, particularly those caused by goods sent abroad for processing and merchanting in the 2008 SNA; estimation of international trade and transport margins matrices; reconciling international trade asymmetries (goods and services) with an appropriate geographical allocation of trade by countries of origin and destination; and harmonizing different classifications for products (HS, EBOPS, CPA) and for industries (ISIC vs national systems) differences. This section describes these challenges in detail as well as the different ways in which these can be dealt with.
1. Estimation of missing countries, import flow matrices and/or distribution
margins
2. Although most countries are able to provide national SUIOTs, they typically vary in the level of detail they provide as well as in their national classification systems. Assuring that the level of industry detail is coherent and comparable across all countries used is an important (although not absolutely essential 1 ) first challenge in constructing inter-country SUTs in practice.
3. Moreover, not all countries currently produce SUIOTs. Two approaches lend themselves to dealing with the lack of SUIOTs for all countries. The first, (and preferred approach) for comprehensive analysis of global production is to estimate missing national (or regional) tables using various assumptions and data sources such that they can be included within an inter-country SUIOT. Typically, this involves using the input-output (or input use) coefficients for a similar country constrained to available national accounts information on value added, production and consumption (which are generally available for all countries, albeit at varying levels of aggregation), coupled with international trade data (which, again are typically available at a detailed level for all countries).
4. An alternative approach is to treat all other countries (Rest of the World RoW) as exogenous in the inter-country SUIOT. However, this approach does result in some analytical limitations, particularly if missing countries are also significant traders with ‘observed’ countries (as the imports from the RoW may contain significant ‘content’ that originated in ‘observed’ countries and exports from the RoW may also include value added that originated in ‘observed’ countries).
5. Many countries, but not all particularly in developing economies, produce import transaction matrices. Where this information is not available, the classic ‘import proportionality’ assumption is necessarily used, i.e. that assumes that the share of intermediate imports in total intermediate consumption for a given imported product is the same for all using industries, with similar assumptions for categories of final demand. Note that this can also capitalise on the ability to differentiate between different categories of imports (intermediates, final demand, and investment, as described in the BEC classification).
6. A study outsourced by Eurostat (Rueda-Cantuche et al, 2013) examined a few non-exhaustive methods for the estimation of distribution margins matrices, domestic and import Use tables at basic prices and Use tables (totals) at basic prices with a selection of auxiliary information and providing an indication of how much the estimates fitted
1 Note that the construction of global (and regional) SUIOTs need not have exactly the same level of detail of industries (or products) for all countries included. A table could also be constructed where one country has a breakdown into X industries (products) and another into Y. However consistency in this regard facilitates comparisons of results from using the tables across all countries, which is one of the main reasons why most existing global SUIOTs tables are developed in this way.

4
the reality in the absence of other official tables. The main conclusion is that the usage of tables of previous years generally provides the best options in each case. This is mainly because they gather detailed country-specific information that is not expected to change in the short term. Regarding distribution margins, it is better to start with an estimation of matrices of taxes less subsidies on products and then, the trade and transport margins matrix would be calculated by difference with respect to the (if available) Use table at basic prices. This solution performed better than the other way round. For the split between domestic and imported uses, the availability of a previous year’s or current input-output table of imports makes a difference. In the case of missing Use tables (total) at basic prices: using the joint structure of the distribution margins matrices of a previous year is proved to be the best option (i.e. difference between the Use table at purchaser's prices and the Use table at basic prices from a previous year, if both available).
2. Overcoming national data inconsistencies between national accounts and trade
statistics
7. International trade statistics, in particular merchandise trade statistics (but often too, in practice, services trade statistics), do not follow exactly the same concepts as those used for imports and exports in the SNA2 (the key accounting framework used in constructing official national SUIOTs). At present, most countries’ available official SUIOTs are based on the 1993 SNA, meaning that the differences between merchandise trade totals and national accounts totals for goods are generally not significant (after adjusting for non-residents expenditures in the domestic economy and residents expenditures abroad, which are captured in trade in services statistics and not merchandise trade data) facilitating the use of mathematical balancing approaches to resolve asymmetries.
8. But the changes made in the 2008 SNA for goods sent abroad for processing and merchanting in particular, imply significant changes for some countries, notably trading ‘hubs’ (such as Hong Kong, Singapore and the Netherlands) but also countries with large processing sectors (such as China and Mexico) and, of course, those countries providing the intermediate inputs and purchasing the output from processing countries.
9. Balances for merchandise trade statistics include all the underlying flows related to goods for processing3 – the processing services provided by the processing firm and the goods used by the processor in the production that were supplied without a change of ownership taking place between the principal and the processor. National SUTs that conform to the 2008 SNA require that for the processing firm (and country) merchandise trade data exclude the value of the goods imported that have not changed ownership and correspondingly exports of goods by the processing firm only reflect the additional value of the exported product (processing fee) generated by the processing firm. Similarly for the principal firm (and country) exports should exclude the value of goods supplied to the processor (without a change in ownership) with a corresponding correction for any imports from the processor.
10. Bilateral partner estimates of processing fees are available in the balanced estimates of Trade in Services produced by countries (EBOPS). But what is also required for aligning flows of merchandise trade data with comparable flows in SUTs are estimates of these processing services by CPA or CPC and, in, addition estimates of the value of imported and exported goods whose ownership has not changed but are included in merchandise trade data. By definition, in order to produce national SUTs, this information (or at least national estimates of this information) must, in theory, be available. The challenge is to create equivalent estimates of these flows on a partner basis. For instance, suppose US exports 100 USD of a certain good for being processed to Mexico and it comes back to US (it can be elsewhere, too) processed for 110 USD. There is no change in economic ownership in the goods
2 Two important differences concern the treatment of merchanting, recorded under goods in the SNA but excluded from merchandise trade statistics and goods for processing transactions, where the additional value provided by the processor is treated as a processing services fee and no imports or exports of goods appear in the processing country in the SNA. See also #10.17 to #10.23 of the Sixth Edition of the Balance of Payments and International Investment Position Manual. 3 Chapter 8 provides a full description of the implications of the 2008 SNA treatment of goods sent abroad for processing and merchanting activities.

5
exported and imported. Therefore, US should have 110 USD less of imports from Mexico and 100 USD less exports to Mexico. Ultimately, an import of a processing fee for 10 USD from Mexico should be allocated to US.
11. Unfortunately, the information needed to make those additional adjustments to international merchandise trade data is limited4, i.e.: how much gross trade is related to these types of goods and how much processing services fees are paid, by country and by type of good traded. For instance, partial information can be found in the Balance of Payments data – BPM6 – of countries and/or by combining business statistics and merchandise and services international trade data5. For this purpose, the trade in goods between countries broken down by economic activity, size class of enterprises, trade concentration, geographical diversification and products traded may allow for assessing more accurately the impact of international trade in goods on the employment, production and value added of economies that are increasingly interconnected (see chapter 3).
12. In practice, a merchanting activity is nothing else than a re-export but without the good crossing the border of the merchanting country. Very few countries are able to produce statistics that identify the origin country of merchanting services. Differently from the 1993 SNA, imports of merchanting services are now included as goods under the 2008 SNA. Moreover, in the balanced merchandise trade statistics, merchanting services are implicitly excluded from import flows and captured instead in what is referred to as the CIF-FOB adjustment. As such, for consistency with national SUTs, merchanting services need to be added to the balanced merchandise trade statistics to align with the national accounts estimates of exports. In the absence of data on imports (by partner), it is recommended that partners’ reported export information (available in trade in services statistics on a BPM5 basis and separately identifiable for countries producing SUT tables on a 2008 SNA basis) is used to estimate the value of imported merchanting services by partner (allocated to the same goods category)6.
13. For merchanting transactions (under the 2008 SNA) adjustments are needed to ensure that exports of goods include the merchanting margin applied by the merchant in the country where it is resident. Under the 1993 SNA, merchanting was included as an explicit item within the ‘Other business services’ category of EBOPS (2002). The item is no longer included within EBOPS but is typically available/collected in most countries. Assuming the merchanting transaction occurs in the same period7, the adjustment to merchandise trade statistics requires a positive entry (export) of goods in the merchanting country and a corresponding import of goods in the counterpart country8. In this context it is important to recall that the balanced view of bilateral trade in services explicitly excludes merchanting related transactions from both the estimates of exports and imports of any given country.
14. For illustrative purposes, suppose a Dutch trader sells fish from a Norwegian ship at Helsinki’s harbour for 1.5 million EUR, being 0.5 million EUR the merchanting fee. The international merchandise trade statistics record
4 For the European Union, for instance, the Eurostat’s Integrated Global Accounts (IGA) Project carried out in 2017 a stock-taking on current practices in the Member States on these issues. It is expected that more data on trade of goods sent abroad for processing will be available within the next few years. 5 For the European Union, this combination of two statistical domains is already established for merchandise trade data (Trade Enterprise Characteristics, TEC) but for services, it is still work in progress (Services Trade Enterprise Characteristics, STEC). 6 Note that this adjustment does not, in general, correct for partner country relationships in merchandise trade data that record goods produced in country A and sold in country C, via a merchanter in country B, as imports by C from A; in theory, the conceptually correct treatment in the SNA would record these flows as imports by B from A and exports by B to C. On the rare occasions that countries record negative exports in one period and positive exports in another, with corresponding changes in changes in inventories, the preferred approach will be to adjust SUTs to remove these flows. In other words in the first period remove the negative for exports and the positive for changes in inventories and in the second period reduce exports and increase changes in inventories. This helps to preserve the underlying trade in goods bilateral flows with those reflected in merchandise trade data and avoids introducing unnecessarily complicated changes to partner relationships (which may also introduce distortions in measures of GVC participation). 7 See also Chapter 6 of The Guide on the Impact of Globalisation in the National Accounts 8 And a corresponding negative entry in exports of the Principal
6
Finnish imports of fish from Norway for 1 million EUR and Finnish imports of trade services from the Netherlands for half a million EUR. However, SNA requires counting for a Dutch import (negative export) of fish from Norway for 1 million EUR and a Dutch export of fish to Finland for 1.5 million EUR, including the merchanting fee. Hence, the necessary adjustments to align trade statistics with SNA would consist in decreasing Finnish imports of fish from Norway by 1 million EUR, decreasing Finnish imports of merchanting (trade) services from the Netherlands by 0.5 million EUR, adding (negative) exports of fish from Norway to the Netherlands for 1 million EUR and adding Dutch exports of fish to Finland by 1.5 million EUR. The difference is considered the output of the merchanting activity recorded in the Dutch economy (merchanting fee). Regretfully, data of goods traded under merchanting is limited and adjustments can only be made in some cases; for instance, EBOPS categories in BPM6 can only provide gross trade flows, with that including the merchanting fee.
15. It is also instructive in this context to consider how factory-less producers are recorded in national SUTs, and how these should (ideally) be treated in global (or regional) inter-country SUTs. In the strict sense these are firms that own no material inputs in the production process and instead provide only intellectual property (design, brand etc.), meaning they are treated in SUTs in the same way that merchanting transactions are recorded. However, when similar firms purchase some of the material inputs in the production process, the firms share similarities with principal firms under goods for processing arrangements. Complications arise however when the material inputs purchased by these firms do not cross borders, as these are not recorded in conventional trade statistics, but imputations are made for the purposes of national SUTs. Where such imputations are made, and available on a partner country basis, it would be preferable to make explicit corresponding adjustments to the conventional (balanced) bilateral trade statistics. Where partner country information is not available however it would be preferable to exclude the imputations from the national SUTs (affecting imports, exports, intermediate consumption and output).
16. Re-exports are foreign goods imported and subsequently exported without being processed or having substantial transformation from one country to another via a third country (re-exporter). The goods need to cross the borders of the third country. Typically, SUTs/SNA includes re-exports (also denoted as foreign exports) in the export column of the import use table by type of product (although this might not be true for all countries). However, international merchandise (good) trade statistics do not distinguish between domestic and foreign exports (re-exports). Therefore, international merchandise trade data would require some additional information and adjustments to separate domestic exports from re-exports and thus, be aligned with the SUTs/SNA total values of domestic and foreign exports.
3. Estimation of international trade and transport margins matrices
17. For merchandise trade statistics, imports are valued in CIF and exports in FOB. In national SUTs at basic prices, import flow matrices are typically reported in CIF by product type while total imports (summed over all products) are required to be valued in FOB9. Hence, depending on whether the transport company is resident or non-resident, a CIF-FOB (national accounts) adjustment needs to be made. The adjustment column consists of a deduction from the services items for transport and insurance with an offsetting global adjustment made to imports of goods (2008 SNA, para. 28.10).
18. However, the construction of inter-country SUIOTs particularly refers to a slightly different concept, which is the so-called CIF-FOB valuation adjustment, defined as the difference between the import flows in CIF and their mirror imports in FOB. One would expect that the difference would just be the amount of transportation and insurance costs paid either by the seller or the buyer in each transaction. Nevertheless, the 2008 SNA requires merchanting services to be added to the value of the imported good (instead of as a trade service), thus leading to a new factor contributing to such difference.
9 (2008 SNA, para. 26.19) Valuation principles are the same in the SNA and the international accounts. In both cases, market values are used (…). In the international accounts,
the valuation of exports and imports of goods is a special case where a uniform valuation point is used, namely the value at the customs frontier of the exporting economy, that
is, the FOB-type valuation (free on board).

7
19. Within the inter-country SUTs framework, the costs associated with the international transport and insurance of merchandise trade (also referred to as CIF-FOB margins) are crucial for two reasons: a) to address bilateral trade asymmetries of imports and exports at the same valuation; b) to adjust national import flow matrices to the FOB valuation. For these purposes, the OECD has recently published a global bilateral database of CIF-FOB margins combining the largest and most detailed cross-country sample of official national statistics on explicit CIF-FOB margins to date with estimates from an econometric gravity model, and using a novel approach to pool product codes across World Customs Organization Harmonized System (HS) nomenclature vintages. The Database shows that distance, natural barriers and infrastructure continue to play an important role in shaping regional (and global) value chains 10 . However, this database is based on BPM5 and therefore, CIF-FOB margins do not capture international trade margins (merchanting) that would need to be estimated differently by looking into available data on goods purchased and goods sold under merchanting, with the support of services trade statistics data too.
20. Official statistics on CIF-FOB margins are still far from being regularly produced by national statistical offices and that would be very much useful to improve the quality of the balanced view of bilateral trade supporting the construction of global (or regional) inter-country SUIOTs.
4. Reconciling international trade asymmetries (goods and services)
21. Perhaps the biggest challenge for constructing a global (or regional) inter-country SUIOT concerns bilateral trade statistics. With very few notable exceptions (such as the United States and Canada, who use a single-flow approach which compiles bilateral trade statistics only on the basis of imports), these are not typically consistent (see Figure 13.2 below for example). Particularly, EU statistics have a specific challenge due to the EU internal market – the traditional data source customs declarations does not exist – leading thus to bigger intra-EU asymmetries. For goods, this partly reflects the price basis (as imports are generally recorded on a CIF basis which differs from the FOB basis used for exports). But even after adjusting for the price basis, significant differences can remain, reflecting a number of factors, for example: imports are typically recorded on the basis of country of origin while exports are recorded on the country of last known destination, which can be (and is) the source of significant discrepancies, particularly for goods passing through trading hubs such as Hong Kong, Netherlands and Singapore; differences in the Trade System – General Trade vs Special Trade; and the occurrence of unallocated (usually confidential) trade (see Jansen (2014) for additional factors).
Figure 13.2: Examples of large trade asymmetries by Chapter of Harmonized System (HS) 2014
Source: UN Comtrade, mln USD
22. The OECD, in cooperation with other international organisations, has recently developed new approaches to balancing bilateral merchandise and services trade statistics, built around the core principles of transparency and
10 For more details on the methodology, see Miao and Fortanier (2017): http://dx.doi.org/10.1787/8267bb0f-en
Reporter
country
Partner
countryProduct (HS chapter number)
Reported
imports
Mirror
exports
Imports -/-
Exports
Netherlands Russia Mineral fuels and oils (27) 21,650 57,294 -35,644
USA China Electrical machinery, equipment and parts (85) 127,093 92,550 34,543
China Korea Electrical machinery, equipment and parts (85) 76,674 51,182 25,492
China Japan Electrical machinery, equipment and parts (85) 40,572 25,751 14,820
USA China Nuclear reactors, machinery & mechanical app. (84) 105,279 90,883 14,396
Germany China Electrical machinery, equipment and parts (85) 28,804 14,458 14,346
Germany Norway Mineral fuels and oils (27) 8,137 20,105 -11,968
France China Electrical machinery, equipment and parts (85) 14,397 5,551 8,846
France Russia Mineral fuels and oils (27) 11,641 4,132 7,509
Netherlands China Nuclear reactors, machinery & mechanical app. (84) 15,695 22,019 -6,323
Spain France Vehicles and parts (87) 10,664 5,105 5,559
Spain Russia Mineral fuels and oils (27) 6,971 3,421 3,550

8
replicability (Fortanier et al. (2016) and Fortanier and Sarrazin (2016)). This approach derives a ‘symmetry’ index11 for each country (used as weights) in order to arrive at a coherent view of partner country trade data. The balanced set of trade data in services is publicly available on the OECD statistics portal12 while for merchandise trade data is forthcoming, thus greatly facilitating efforts of any institution or individual wishing to produce their own global (or regional) inter-country SUIOTS and their own multi-partner GVC extended accounts, too.
23. Besides the CIF-FOB corrections, there is another important issue regarding merchandise trade data (UN Comtrade), i.e. domestic exports need to be separated from exports of foreign goods (or re-exports), otherwise they would provide a distorted picture of the geographical allocation of trade required for the construction of inter-country SUIOTs. We can illustrate this with a real example about the crude oil trade between Spain and Portugal. UN Comtrade reported around 576 million EUR of Portuguese imports (CIF) of crude oil from Spain and 510 million EUR of exports (FOB) of crude oil from Spain to Portugal. The difference can easily be attributed to CIF-FOB margins. However, by looking at the information on country of origin provided by other European trade statistics sources, such as Comext (Eurostat's database on trade in goods statistics), we observe that Portugal reported 505 million EUR of crude oil imported from Algeria (country of origin) and 71 million EUR really coming from and being produced by Spain (country of origin). This clearly indicates that Spain is re-exporting crude oil from Algeria to Portugal for an amount of 505 million EUR. This is confirmed by the total output of mining and quarrying products (including crude oil) from the Spanish Supply table, which amounts to around 110 million EUR of production, of which 71 million is exported to Portugal (domestic exports). For the European Union, the problem can be sorted out through a well-established database (Comext) which is considered the official reference regarding international trade in goods within the European Statistical System and is well recognized by users as a statistical product. For other countries in the world, the recommendation is thus trying to get additional information from other sources that can quantify the amount of foreign exports (re-exports) in order to come up with a correct geographical distribution of merchandise trade.
24. One last important issue before the final balancing of asymmetries is the treatment of confidential data, not geographically specified trade or not allocated trade, which in some cases can be very important (e.g. German and Austrian trade in petroleum and natural gas). Ideally, confidential data should be used as much as possible as long as no disclosure is made. In other cases, proportionality is generally assumed across countries or products. Alternatively, they can be left out separately to transparently identify how much of the international trade did not have enough detail to be allocated to countries or products. Clearly, a fully specified balanced view of trade would be more in line with users’ needs while leaving unspecified trade separated out would have a more statistical ground.
25. For services statistics, where there are currently significant data gaps with bilateral data, the approach also incorporates a gravity based model to generate missing data, before being balanced using the same ‘symmetry’ approach. As mentioned earlier, the estimation process of missing trade data can be more burdensome than for merchandise trade data mainly because typically only the financial flows are observable. Hence, a variety of different data sources and estimation techniques are necessarily used in practice. The OECD (Fortanier et al, 2016) suggests a top-down approach to estimate missing trade flows whenever official data are available (e.g. using structural information over time; simple derivations; mirror data; linear interpolations; moving average based backcasting and
11 More formally, the symmetry index is calculated as follows. For each reporter i, partner j, product k,in a given year,
the Asymmetry Level (AL) is calculated: 𝐴𝐿𝑖𝑗𝑘 =|𝑋𝑖𝑗𝑘−𝑀𝑗𝑖𝑘|
𝑋𝑖𝑗𝑘+𝑀𝑗𝑖𝑘𝑡 , where X and M refer to reported exports and imports
respectively. Subsequently, only those export and import values for which 𝐴𝐿𝑖𝑗𝑘𝑡 ≤ 0.10 are retained (exports (𝑋𝑟)
and imports (𝑀𝑟). The export symmetry index 𝑆𝐼𝑥 is then calculated as the ratio of the sum of retained export values
as a share of total exports (by reporter, product and year), while the import symmetry index 𝑆𝐼𝑚 is similarly defined
as the as the sum of retained import values as a share of total imports, and are used as the country weights: 𝑆𝐼𝑖𝑘𝑥 =
∑𝑋𝑖𝑗𝑘
𝑟
𝑋𝑖𝑗𝑘𝑗 𝑎𝑛𝑑 𝑆𝐼𝑖𝑘
𝑚 = ∑𝑀𝑖𝑗𝑘
𝑟
𝑀𝑖𝑗𝑘𝑗
12 https://stats.oecd.org/Index.aspx?DataSetCode=MEI_TRD

9
nowcasting methods) and otherwise, gravity models for specific items. Total services trade by EBOPS category and country are expected to be used as benchmark for the estimation of other sub-items.
26. The gravity models for specific items use four types of independent variables: economic (such as GDP of reporter and partner countries, GDP per capita of reporter country and overall exports and/or imports of services by partner and reporter countries); distance; dummy variables specifying: common border (contiguity), language affinity, territorial link (e.g. Czech and Slovakia were one single country not so long ago), membership to a highly integrated region (e.g. NAFTA, EU, APEC…); and fixed effects for partner and year.
27. Once a complete (although unbalanced) dataset of bilateral trade flows of services data is achieved, the same balancing approach and principle (symmetry index) set out in Fortanier and Sarrazin (2016) can be applied to deal with trade asymmetries. At this stage, it is important that the largest trade asymmetries are discussed between the affected countries either on a bilateral basis, trilateral basis (such as for NAFTA countries) or through dedicated workshops such as those organized by Eurostat within the European Union. It is expected that during these meetings trade experts from countries have the opportunity to exchange experiences, discuss bilaterally and decide on specific actions to resolve their corresponding trade asymmetries.
5. Harmonizing different classifications
28. Merchandise trade data are compiled using the Harmonised System (HS) of products, which (because of the significant disaggregation of data available) are readily convertible to the product classifications used in constructing national SUTs (and which are typically much more aggregated), such as the international product standard CPC. However the same is not true for trade in services data, which is based on the Extended Balance of Payments Services classification (EBOPS), and where the level of detail collected by countries is often less than the comparable detail used in national SUTs. A combination of EBOPS-CPA/CPC concordance tables, SUIOTs and other data sources such as business statistics are normally used to make such conversion.
29. For convenience and ease of exposition the 12 key (aggregated) product groupings used in EBOPS (2010), and which is often the only level of detail produced by many economies, are shown below:
1. Manufacturing services on physical inputs owned by others: (goods for processing) 2. Maintenance and repair services not included elsewhere 3. Transportation 4. Travel 5. Construction 6. Insurance and pension services 7. Financial services 8. Charges for the use of intellectual property not included elsewhere 9. Telecommunications, computer and information services 10. Other business services 11. Personal, cultural and recreational services 12. Government goods and services not included elsewhere
30. The challenge for constructing inter-country SUIOTs is converting these data into equivalent CPC (or the typically preferable CPA classifications). For most of the categories above this is not an overly arduous exercise, however two categories warrant special mention, and indeed attention: “Manufacturing services on physical inputs owned by others” and “Travel”.
31. As intimated above, despite the CPC’s international coverage, the CPA system is generally preferred in the construction of SUTs as the architecture and structure (by design) mimics that of the corresponding industry classification (NACE, which is closely related to the international standard ISIC). But “Manufacturing services on physical inputs owned by others”, in CPA product classifications, is not allocated to the category of products under the services umbrella. Instead it is recorded under goods classifications (as the output of the manufacturing sector).

10
Similarly, “Travel” which covers non-residents expenditures (exports) and residents expenditures abroad (imports), is comprised of a number of products (including goods) and is usually shown as a separate item in national SUTs (a negative adjustment item in household final consumption and a corresponding positive entry in exports for non-residents expenditures, and a positive entry to imports and equivalent positive to household final consumption).
6. Direct purchases abroad
32. Direct purchases abroad by residents (imports) and direct purchases in the domestic territory by non-residents (exports) are typically included in National Accounts as a lump-sum total but not separated by product, as required to perform conventional input-output analysis. Even though they are available through the balanced view of trade under the “Travel” item in EBOPS categories, they still need to be separated from pure travel services using Tourism Satellite Accounts, SUIOTs or any other related source data. The estimated values will then be transferred to the goods categories and partners (i.e.: country of origin of the non-resident).
33. Although there will be differences between the spending patterns of tourists in a given country, depending on their nationality, information available in Tourism Satellite Accounts is rarely available at this level of detail, and so, in these circumstances the simplest way of arriving at a global balance of travel expenditures by products, is to assume that all tourists in a given country have the same spending patterns (by product). In other words, they purchase the same basket of goods and services for every 1USD spent, using information on the product breakdowns from Tourism Satellite Accounts in that country or, by convention, using fixed assumptions.
34. By extension import statistics by product are also directly generated through the statistics on exports by partner generated in the balanced set of travel statistics, which in turn automatically generates a coherent and equivalent set of import statistics by partner and product. There may however remain a difference between the equivalent national accounts estimates. This difference should be subsequently allocated in a way that the balanced view of trade is preserved by product across countries of origin.
7. To balance or not to balance…
35. Figure 13.1 (above) allows for two separate global (or regional) inter-country SUTs, i.e. with or without discrepancy items. The tables with an explicit discrepancy item would provide a perhaps more accurate view of the underlying state of statistics available across countries and indeed pointers to national statistics agencies on those areas where data improvements could be advanced. However, for most users, the preference is to have a balanced table without discrepancy items (recognising too that the discrepancies above could also be negative and not just positive; which adds another level of complexity when interpreting results from unbalanced tables).
36. Bearing this in mind, it is important to note that any globally (or regionally) coherent and balanced view of trade (consistent with the national accounts concepts) cannot satisfy the dual constraint of no changes in current account balances and GDP (and value added by industry), if discrepancies exist between total global (or regional) exports and total global (or regional) imports recorded in national SUTs – which is the case. In other words some residual (discrepancy) item is necessarily needed to overcome this contradiction, unless changes to GDP and the current account balance are made; which should be avoided as the primary focus of a global (or regional) inter-country SUIOT is to analyse the interactions between trade and production (and not least because the estimates of output, and factors of production are usually of good quality). As such, whether tables are automatically balanced or not, constraining to published national accounts, at the global (or regional) level, necessarily requires a discrepancy item.
37. As required by users, perhaps the simplest way to achieve a balanced inter-country SUTs without discrepancy items is to use a standard optimisation model, such as GRAS, but with a control total for the export discrepancy column set as the difference between total unallocated exports and unallocated imports (equivalent to the total difference of total global exports and total global imports, based on each country’s national accounts), when global exports are greater than global imports, and allocated to the import row when the opposite is true.

11
8. Construction of inter-country input-output tables
38. The construction of the Inter-country IOTs shall be based on the estimated inter-country SUTs. For product by product IOTs, the final demand component remains unchanged by definition so no further changes need to be made in the final demand component of the inter-country IOTs. The changes will therefore affect only to the intermediate uses by exporting country, trade partner and product and value added by country and product (using either the product or the industry technology assumption, Eurostat, 2008). The final inter-country IOT will also have to respect available national IOTs and eventually be benchmarked to the latest National Accounts aggregated data (i.e.: using GRAS).
39. Regarding industry by industry IOTs, intermediate and final uses (from the inter-country SUTs) will have to change by definition while value added would remain unchanged. In such case, we assume either fixed product or fixed industry sales structures (Eurostat, 2008) for estimating the missing IOTs. Again, official IOTs will have to be respected. The final IOT will also have to be benchmarked to the latest aggregated National Accounts data.
40. It is worth noting that using, for instance, the industry technology assumption or the fixed product sales structures assumption over the full Inter-country SUTs would result in undesirable changes in the geographical balanced view of trade across countries (column-wise and row-wise, respectively), which should be avoided.
9. International cooperation in data sources and methodologies
41. Starting from a given national SUT, the same view of balanced merchandise trade and services trade statistics and combined with the same approach for unallocated trade and other adjustments for exports and imports and the same national accounts constraints, should generate the same results for any given country and their partners, in whatever permutation of countries are included within regional or global tables. This is the key point for the development of a coordinated approach to global inter-country SUIOTs that avoids introducing inconsistent views across regional initiatives.
42. A significant cause of these inconsistencies reflects differences in balancing international trade statistics, so, it follows that improved coherence across the various existing initiatives can come about through a common view of bilateral trade data. Whilst this will certainly help improve coherence across the various initiatives, the changes adopted in the 2008 SNA also require a common view to avoid introducing implicit distortions in partner country trade statistics, after merchandise trade statistics, for example, have been balanced. The chief constraint in this respect, which cannot be underestimated as it is a central consideration in the design of the system, concerns the need to ensure additivity (consistency) between the regional tables and the global table comprising the regional dimensions. Relaxing this constraint would result in a significantly simplified schematic but the risk of inconsistencies (and correspondingly confusion) between the regional sub-components and the global one would be high, especially if independent balancing mechanisms were used. For example an Asian table may generate a balanced table (and view of trade with the rest of the world) that is inconsistent with the comparable (implicit) transactions recorded within say a European table.
43. Recent years have seen a significant take-up in international efforts to develop measures of Trade in Value Added, driven by growing demands for better, more comprehensive and more timely data on global value chains, their drivers and impacts and so the global inter-country IOTs underlying them. Examples of initiatives include OECD-WTO TiVA, Eurostat’s FIGARO Project, North American TiVA, APEC-TiVA, WIOD, regional IOTs for Latin America coordinated by ECLAC, and many others. The participants of the so-called OECD’s Regional-Global TiVA Workshop convened in March 2017 to take stock of all these initiatives, and to explore the scope to develop synergies, mechanisms for closer collaboration, and a common action plan for going forward. There was an agreement to work towards a common consistent dataset.
44. Participants agreed that there was significant scope for the creation of synergies across the various initiatives, in particular to avoid duplication of activities and ensure the most efficient allocation of resources at a global level, and to seek to develop guidance on best-practice that could be adopted across the initiatives. There

12
was unanimous support, not least to avoid confusion amongst users, for the principle of developing a single consistent internationally recognised benchmark data set – of TiVA and the underlying global/regional SUIOTs – and that the mechanisms and methodologies used across initiatives should be oriented towards supporting that goal.

13
ANNEX II: Conceptual Accounting topics
1. This Chapter will reiterate some of the measurement issues and other challenges identified in the UNECE Guide to Measuring Global Production (2015). The perspective is that of increased activities of Global Value Chains (GVCs) and how outstanding measurement issues impact on arriving at a rounded understanding of these GVCs.
2. Findings of the UNECE Guide to Measuring Global Production are presented in the form of illustrative schemes, where possible. The focus is primarily on the measurement challenges related to contract manufacturing. Contract manufacturing covers goods sent abroad for processing and factoryless goods production. Merchanting, another area of global production where there are measurement challenges is also discussed.
3. The discussion below is in the context of the current accounting standards, the System of National Accounts 2008 (2008 SNA) and the Balance of Payments and International Investment Position Manual, sixth edition (BPM6). These standards follow consistently the change of ownership principle. However, properly applying this principle may be challenging.
4. The measurement of intellectual property involved in inter affiliate transactions by MNEs is another measurement challenge. The chapter will also include an evaluation of how inventories held abroad can be identified and measured in the context of these different trading arrangements of contract manufacturing and merchanting.
5. In Figure 8.1 a standard GVC framework is outlined. Contract manufacturing occurs in the manufacturing/assembling stage of production. Merchanting occurs along the stages of manufacturing/assembling and logistics. Although IP it is an input to manufacturing , on a contract basis or on own account, it relates to the upstream elements of the GVC and generates substantial value added for the GVC. In fact it is clear to see that manufacturing is the lowest value added generator for the GVC and accordingly it is understandable that an MNE might outsource this element of its GVC – where there is a captive or hierarchical governance structure.
Figure 8.1 - Global Value Chain (GVC)
6. Goods sent abroad for processing covers many of the transactions associated with contract manufacturing. The entire model for recording these types of transactions where elements of the production process are outsourced has changed since SNA’93 and BPM5 were introduced. The standard case was where goods went abroad for further processing and then returned to the country of the sender. The treatment was to impute a “change in economic ownership” and recognise the export and import associated with the movement of the good before and after
Production stage
Valueadded
AssemblingManufacturing
Logistics
Marketing
Branding
Design
R&D
Innovation
Standardization

14
processing abroad. The net of these two transactions accords with the value of the processing service provided abroad.
7. In reality no change in ownership takes place because the good remains in the ownership of the principal that sent it abroad. In SNA 2008 and BPM6 it is recognised that no change in economic ownership takes place and the transaction with the processer abroad is recorded as the import of a manufacturing service by the principal.
8. In the case of merchanting a good is bought in one country and then resold to another country without crossing the border of the merchant. The standards changed the way of reporting these transactions. In SNA’93 they were recorded on a net basis under the services heading; the margin on the buy/sell was recorded as a business service. In this case a “no change of economic ownership” was imputed. In SNA 2008 these buy and sell transactions were recorded on a gross basis under the goods heading; thus recognising the change in economic ownership that occurs when the merchant buys the good and again when it is sold. However, the two transactions are recorded as positive and negative exports of goods. No overall change to GDP results from this change in recording.
9. Many of the merchanting and goods for processing transactions take place within global value chains (GVCs) and involve outsourcing and procurement between affiliates and third parties abroad. These GVCs span continents as specialization of stages in the production and distribution cycle are clustered in particular countries or zones.
1. Contract Manufacturing in a Global Value Chain
10. International merchandise trade statistics (IMTS), as one of the main data sources for national accounts and balance of payments, are based on physical movements and need be adjusted to the change of ownership principle. The data items needed to make these adjustments may not be readily available and statisticians may need to resort to new data collection or estimation. This is not always straightforward, but sometimes even relatively small changes in data collection are helpful. Therefore, data collections should be reviewed to see whether they properly measure processing, merchanting and factoryless goods production. To foster international comparability of national accounts and balance of payments, common guidance is needed for national statistical institutes (NSI) and other compiling agencies on how to develop data collection and carry out the necessary adjustments in line with the change of ownership principle.
11. Chapter 5 of the UNECE Guide to Measuring Global Production examines thoroughly the changes in the accounting standards between the 1993 and 2008 versions of the SNA and differences between the fifth and sixth versions of the BPM. The Guide on Impact of Globalization Guide (2011), on the other hand, explains the conceptual underpinnings of these changes in more detail.
2. Outward Processing
12. Outward processing occurs when a resident company (principal) sends goods abroad for processing while retaining economic ownership of these goods. After the processing phase, goods may be sent back to the principal or to its country, or be delivered to customers in other countries. The following sections give an overview of data items and corresponding adjustments needed in the context of outward processing.
a. Making adjustments in merchandise trade statistics
13. As a general guideline, IMTS record all goods which add to or subtract from the stock of material resources of a country by entering (imports) or leaving (exports) its economic territory.
14. As the 2008 SNA and BPM6 require only the recording of a fee paid for the delivery of processing services as import of services (will be discussed later), the following adjustments in IMTS are needed:

15
(i) Remove the merchandise trade exports for the goods being sent abroad for processing from the overall
trade flows
(ii) Remove from the overall trade flows the merchandise trade imports for the goods being returned to the
domestic economy following processing
Figure 8.2
15. To be able to make these adjustments properly also other differences of IMTS, in addition to the change of ownership principle, need be translated to SNA and BPM concepts. This includes especially coverage of goods, time of recording, valuation and country of origin.
16. Additional information available in IMTS may help to make the necessary adjustments. Merchandise trade subject to processing may qualify for exemptions from normal customs duties. Those cases may be identified in customs data with the nature of transactions code. In addition to the nature of transactions code, customs data may include other items not currently received or used by statisticians, but which may be important for the required adjustments. Therefore, negotiations with customs agencies are highly recommended for access to additional records on customs documents.
17. The desired additional information for adjustments in merchandise trade statistics includes, for instance:
• nature of transaction code
• values and commodity codes of goods sent abroad for processing
• processing fees paid
• country of processing
• destination country of processed goods
• dates of departure and return of temporarily shipped goods
18. These data items form the basis for making the adjustment for change in ownership. In addition to collecting or receiving new data items, one-off surveys to understand declaration practices may be very useful.

16
19. Alternative data sources for making outward processing adjustments in merchandise trade statistics include, for instance:
• Adding new questions to business surveys concerning the value of goods sent abroad for processing and the payments of processing fees to foreign processors. This will, however, increase the response burden.
• Using any existing information on the payments of processing fees from business surveys and international trade in services surveys.
• Estimating data by calculating ratios of processing fees to processed goods for similar firms in terms of ISIC etc. to approximate the gross flows. In this case, it is important to remember that sometimes goods do not return after processing to the country of principal and this may cause disturbances in the trade balance. One-off surveys that help estimate the importance of those flows would be helpful.
b. Estimating imports of goods purchased abroad for processing
20. Goods purchased abroad for processing (from the country of processor or from other countries) are not recorded as imports in IMTS when these goods do not cross the borders of the country of principal. Therefore, the related purchase needs to be estimated as imports of goods.
Figure 8.3
21. Possible data sources for estimating imports of goods purchased abroad for processing include, for instance:
• Adding new question(s) to business surveys to capture domestic purchases of intermediate goods as a
separate item from purchases abroad. To limit response burden, the question could be added only for
industries in which outward processing exists more widely.
• Estimating data by subtracting the processing fee paid from the value of the imports (after processing) as
reported in customs records.

17
22. It has to be noted that removing imports after outward processing from merchandise trade statistics without replacing them with the actual import value of the goods purchased abroad before processing would cause an error.
c. Estimating exports of processed goods not returning
23. Processed goods not returning are not recorded as exports in IMTS as processed goods do not cross the border of the principal. Therefore, the related exports need to be estimated.
Figure 8.4
24. The information that may be useful in estimating the exports of processed goods not returning includes, for instance:
• Nature of transaction codes to detect goods sent for processing and not returning from IMTS.
• Matching the detected goods sent for processing and not returning with turnover from foreign sales (as
reported by the principal in business surveys).
• Estimating the transaction value by adding the processing fee to the value of goods reported in customs
records at the moment of shipping the goods abroad.
25. Without sufficiently detailed and good quality information on the nature of transactions, adjustments in IMTS cannot be made without risk. It has to be also noted that removing shipments for outward processing from IMTS without replacing the actual export value of the good after processing would cause an error.

18
d. Estimating imports of processing services
26. Instead of the value of physical flows of goods before and after the processing, 2008 SNA and BPM6 require recording of a fee paid for the delivery of processing services as import of services. This fee is not recorded in IMTS and, therefore, other data sources are needed for estimating it.
Figure 8.5
27. Main data sources for estimating imports of processing services are business surveys and international trade in services surveys. A variable on purchases of processing services from foreign suppliers could be added in those surveys. In addition to including a new variable, good coverage of firms engaged in (outward) processing need be ensured.
28. Alternatively, the processing fee may be measured indirectly as a difference in the values of the goods before and after processing in IMTS. Further, it has to be noted that in addition to the processing fee, value differences may include holding gains and overhead costs. This method is also problematic if the goods do not return to the home country. It has to be also taken into account that the product classification may change before and after processing. Because of these risks, it is recommended to observe the processing fee directly.
e. Estimating (changes in) inventories held abroad
29. In case of processing, inventories held abroad usually exist and change in their value needs be estimated to be in line with the 2008 SNA and BPM6 recording.
Figure 8.6

19
30. Detailed guidance on the recording of inventories under global production is provided in the forthcoming Eurostat-OECD compilation guide on inventories (chapter 8.7). The inventories of raw materials, work-in-progress and finished goods during processing abroad remain property of the principal and will be recorded in his accounts as no change of ownership takes place.
31. In line with this, the raw materials that are sent from the country of the principle to the country of the processor will not be recorder as withdrawals of inventories when crossing the border. During the production process the increase in the work-in-progress equals the corresponding processing service for the same period. If the processing is completed within the same accounting period countries assume that the respective transactions are offsetting each other there is no need of specific adjustment. However, this may not be the case in long production processes. If production straddles more than one accounting period withdrawals and additions from the stock of inventories should be recorded at the price prevailing at that time and any price differences be accounted as holding gains/losses.
32. The data on inventories are usually collected in the business survey. Other sources of information could be tax records, special inquiries or consolidated financial statements. Ideally, surveys would:
• Capture also inventories held abroad
• Split between domestic and foreign held inventories
• Split between raw materials and work-in-progress/processed goods
33. The latter split between raw materials and processed goods is most useful in providing a broader picture of the commodity flows subject to outward processing and are helpful for proper revaluations.
f. Recording of goods returning to the country of principal
34. Recording of goods returning to the country of principal is more straightforward than the previous cases. Goods delivered to customers in the country of principle are recorded as domestic production. Goods returning to the country of principle, before the delivery to final customers in another country, follow the recording in IMTS. The following scheme presents these flows:

20
Figure 8.7
g. Summary of recordings and adjustment
35. The following scheme presents the complicated nature of the recordings and the necessary adjustments:
Figure 8.8
3. Inward Processing
36. Inward processing occurs when a resident company (processor) is engaged in the physical transformation of goods that are owned by a foreign principal. After the processing phase, the goods may return to the country of principal, or be supplied to customers in other countries. The following sections give an overview of data items and corresponding adjustments needed in the context of inward processing.
21
a. Making adjustments in merchandise trade statistics
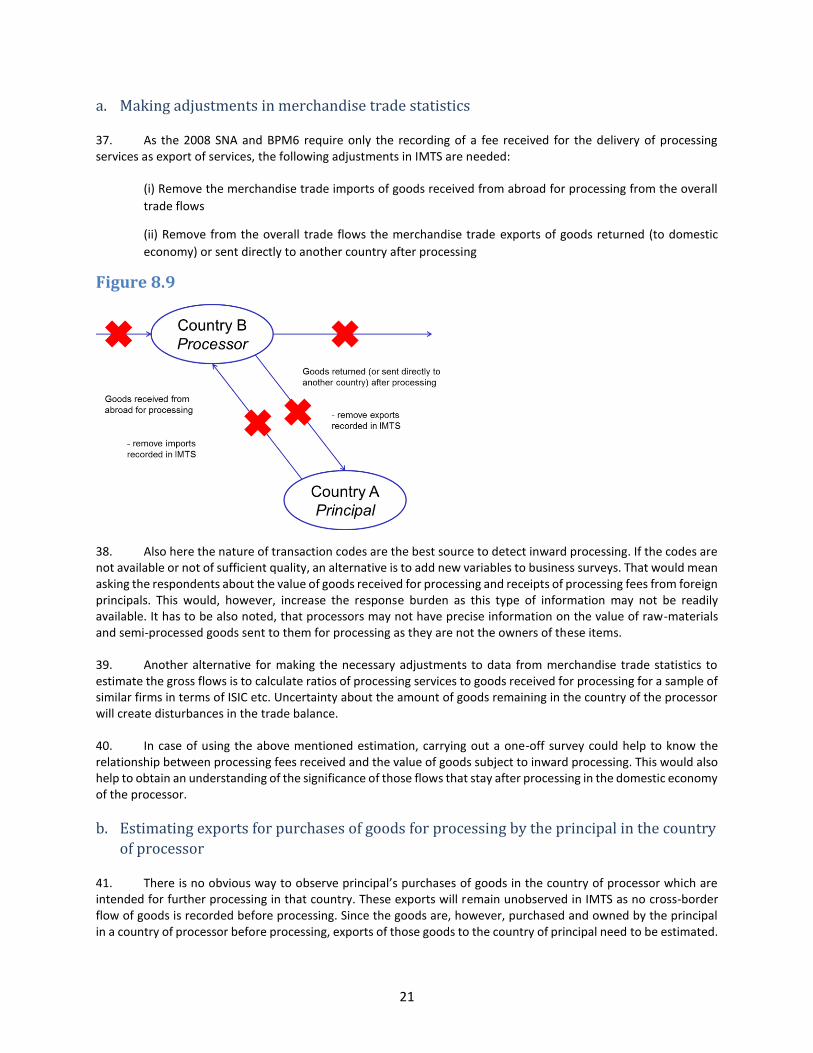
37. As the 2008 SNA and BPM6 require only the recording of a fee received for the delivery of processing services as export of services, the following adjustments in IMTS are needed:
(i) Remove the merchandise trade imports of goods received from abroad for processing from the overall
trade flows
(ii) Remove from the overall trade flows the merchandise trade exports of goods returned (to domestic
economy) or sent directly to another country after processing
Figure 8.9
38. Also here the nature of transaction codes are the best source to detect inward processing. If the codes are not available or not of sufficient quality, an alternative is to add new variables to business surveys. That would mean asking the respondents about the value of goods received for processing and receipts of processing fees from foreign principals. This would, however, increase the response burden as this type of information may not be readily available. It has to be also noted, that processors may not have precise information on the value of raw-materials and semi-processed goods sent to them for processing as they are not the owners of these items.
39. Another alternative for making the necessary adjustments to data from merchandise trade statistics to estimate the gross flows is to calculate ratios of processing services to goods received for processing for a sample of similar firms in terms of ISIC etc. Uncertainty about the amount of goods remaining in the country of the processor will create disturbances in the trade balance.
40. In case of using the above mentioned estimation, carrying out a one-off survey could help to know the relationship between processing fees received and the value of goods subject to inward processing. This would also help to obtain an understanding of the significance of those flows that stay after processing in the domestic economy of the processor.
b. Estimating exports for purchases of goods for processing by the principal in the country
of processor
41. There is no obvious way to observe principal’s purchases of goods in the country of processor which are intended for further processing in that country. These exports will remain unobserved in IMTS as no cross-border flow of goods is recorded before processing. Since the goods are, however, purchased and owned by the principal in a country of processor before processing, exports of those goods to the country of principal need to be estimated.

22
Figure 8.10
42. In this case, surveying may not be very helpful. The domestic processor is not directly involved in the purchase of raw materials and it would not be reasonable query the processor about the country of origin of the materials it processes.
43. Estimation by subtracting the processing fees from the value of the export flow after processing (as recorded in IMTS) could be considered as an option. However, this would also be complicated as only part of the processed goods are purchased by the principal in the economy of processor.
c. Estimating exports of processing services
44. Instead of recording the value of physical flows of goods before and after processing, the 2008 SNA and BPM6 require recording of the fee received for the delivery of processing services as export of services. This fee is not recorded in IMTS and, therefore, other data sources are needed for estimating it.
Figure 8.11
45. The main data sources for estimating exports of processing services are business and international trade in services surveys statistics. For this purpose, they should include variables on production and export of processing services. This is usually easier to observe in the processor’s accounts than the principal’s intermediate consumption of processing services. Observing exports of processing services directly is recommended rather than measuring it as the difference in the value of the goods before and after processing. The same reasons are valid as in the case of outward processing.

23
d. Excluding inventories under ownership of the principal
46. In case of inward processing, inventories of raw materials and processed goods under the ownership of the principal usually exist. If their value, for some reason, is included in the books of the processor, it needs be excluded to be in line with the 2008 SNA and BPM6 recording.
Figure 8.12
47. The data on inventories are usually collected in the business survey and it should be clearly specified in the instructions of those surveys that the value of inventories under the ownership of the principal need be excluded13.
e. Summary of recordings
48. The following scheme presents again the complicated nature of the recordings and necessary adjustments:
Figure 8.13
13 Detailed guidance is provided in the Eurostat-OECD compilation guide on inventories, chapter 8.7 Inventories held under global production

24
4. Merchanting
49. Merchanting occurs when a trader purchases goods from a foreign supplier and sells them subsequently to customers abroad, the goods do not physically enter the domestic territory of the trader, and the trader does not carry out substantial transformation on the goods.
50. The 2008 SNA and BPM6 require a net export of goods under merchanting be shown in the accounts of the country in which the merchant is resident. Merchant’s purchases of goods from a supplier abroad that are intended to be sold abroad should be recorded as negative exports. Further, the goods directly delivered to customers in the country of a supplier or yet another country need be estimated as positive exports from the country of principal. Output remains, thus, equal to the trade service, which is also called the trade margin.
51. Merchanting related imports (or negative exports) and exports remain, however, unobserved in IMTS. The main data sources are again possibly business surveys, particularly on the wholesale industry. Achieving the required data most probably requires some adjustments in the survey questionnaires.
52. Data comparisons may also be very useful. This could include, for instance:
• Analysis of business data from different sources (particularly within the wholesale industry) that include international transactions
• Comparison of detailed banking data on transactions in foreign currency (classified as exports of goods) with customs data on exports for individual enterprises
• Comparison of data from business surveys with customs data
53. The required data and adjustments for estimating the trade service of the merchant and the net exports under merchanting are discussed below.
a. Estimating of the trade service of the merchant
54. The main data sources for estimating the trade service of the merchant are business surveys and the survey for international trade in services statistics.
55. Turnover from business surveys on distributive trade and purchases of goods subject to distributive trade allow estimating trade margins as the difference between trade related purchases and sales. The following additional questions on the merchanting portion of trade related activities would be useful:
• Goods purchased abroad, and sold: (i) domestically / (ii) abroad
• Goods sold abroad, and purchased: (i) domestically / (ii) abroad
• Changes in inventories as a result of timing differences between (a) and (b)
56. The survey for international trade in services statistics may already include information on some revenues from merchanting (as complementary information). This information (excluding holding gains and losses) would enable a more complete analysis of the international supply of services.
b. Estimating the net exports under merchanting
57. Merchanting related flows remain unobserved in IMTS. As mentioned above, adjusting (business or international trade in services) surveys is needed to observe merchanting transactions. The minimum requirement

25
is to measure the trade margin from merchanting. The corresponding product values could be roughly derived by making assumptions. Further, the information on trade service alone provides a reasonable proxy of the contribution of merchanting to the trade balance.
Figure 8.14
c. Estimating (changes in) inventories held abroad
58. When the transactions straddle accounting period adjustments need to be made, including for price revaluations14.
59. The business surveys of wholesale traders will again be considered as the main data sources. In addition to observing purchases and sales of goods under merchanting, the question on inventories held abroad as part of merchanting should be included. This would provide a comprehensive view of merchanting and support making the distinction between trade services and revaluations of related inventories.
Figure 8.15
14 Detailed guidance is provided in the Guide on the Impact of Globalization on National Accounts, chapter 6 and in the Eurostat-OECD compilation guide on inventories, chapter 8.7 Inventories held under global production

26
5. Factoryless Goods Production
60. According to the current standards, factoryless goods producers (FGPs) are generally considered as a special case of merchants and are, thus, classified under trade. This is the case when the FGP does not provide the production process with any material inputs. However, if some material inputs come from the FGP, the arrangement is considered as goods sent for processing and the entity is classified under manufacturing industries.
61. Even so FGP has typically a more active role in the manufacturing stages of production than a merchant. It may own the underlying intellectual property product and control the production process or some of its stages. This type of FGPs would ideally be separately identified to allow further analysis of their characteristics in order to decide about their possible classification under manufacturing industries. It must be kept in mind, however, that often the same entity is involved in different kinds of production arrangements with its partners. The entity performing the factoryless goods production may also have some production of its own or it may send some materials or goods to processors for further processing.
62. When FGPs are classified in trade their recording will follow the merchanting arrangement discussed in the previous section of this chapter. The necessary accounting adjustments if FGPs are to be classified to manufacturing are presented in Chapter 2 of the UNECE Guide to Measuring Global Production. In addition, Chapter 5 of the Guide proposes the criteria that could be used to detect such companies.
6. Transactions in Intellectual Property Products
63. As outlined in the Guide to Measuring Global Production : In the national accounts and the balance of payments statistics the recording of product transactions on the basis of economic ownership change is a fundamental principle. However, in the context of global production the identification of changes in the ownership of goods and assets can be quite a challenge to statistics compilers. This is particularly true for the globalized production activities of multinational enterprises (MNE). The entangled webs of MNE ownership structures, often spanning continents, can be a real challenge for statistics compilers, as it may not always be easy to breakdown these activities straightforwardly on a country-by-country basis.
In particular the intangible nature of an IPP provides significant scope for an MNE to locate the IPP original in an economy that maximises the overall post-tax MNE profits. This is not necessarily the same economy as where the IPP original was produced and nor is it necessarily the same economy where services or copies provided by the IPP are subsequently embodied in, or used to produce, other product.
64. The previous standards SNA ’93 distinguished between the three elements of R&D:
1. Expenditure incurred in the development of R&D assets
2. R&D related services such as royalties and licenses which related to the use of assets
created by R&D activities
3. The R&D assets themselves i.e. intellectual property products (IPPs).
65. In the SNA ‘93 patented entities, as these IP assets were classified, were treated as non-financial, non produced assets15. However, payments arising from the use of R&D related intellectual property products were required by convention to be recorded as payments for services (similar to rentals from an operating lease of fixed assets such as aircraft or ships). This created an anomaly in the SNA accounting rules, which then required payments for the use of non-produced assets to be recorded as property income. If R&D is not treated as capital formation, in
15 See SNA’93 par 10.130

27
this context, the question was whether the payment for the use of patented entities should continue as a payment for services i.e. royalties.
66. The measurement of productivity in the SNA’93 (ESA95) framework also highlighted shortcomings in approach to R&D and the related patented entities. There were clearly some unanswered questions, specifically how could accurate estimates for capital services and multi factor productivity be made when the IP assets are excluded from the calculations. At the same time, the exports of royalties added to Gross Value Added. Thus the result was an overstatement of all measures of productivity.
67. There is a particular emphasis on the impact on R&D given the cross border nature of these activities. Of all the globalisation related issues that were reviewed in the SNA 2008 and BPM6 revision process, R&D had the largest single impact on the national accounts and balance of payments statistics for some compilers.
68. The treatment of R&D activities and the related IPP (patented entities) created by these activities are recorded indistinguishably and capitalised in the National Accounts. Nevertheless the consequences for countries of the inclusion of each of these two aspects of R&D together in the latest version of SNA are very different.
69. Cross border R&D is capitalised in the National Accounts, however, the activities abroad are treated as an import of services with the result that no overall addition to GDP results from this element of R&D activities. In the case of IPP (patented entities) we are considering assets that are already the outcome of R&D activities. The other cross border service imports of R&D relate to the activity that might lead to the development abroad of IP assets.
70. Regardless of whether the IP assets were developed abroad by affiliates or purchased outright, they add to Gross Value Added and GDP once they begin to be used in production activities:
• in the domestic economy,
or
• through the use of contract manufacturing arrangements abroad
or
• through the export of royalties to other non-resident affiliates.
71. In the Guide a decision tree is provided 16to assist compilers in assigning economic ownership to IP, in particular cross border IP transactions.
72. R&D activities mainly take the form of research programmes carried out in Universities or other public sector institutions. R&D is also carried out in the corporate sector and through partnerships between public and private sector companies and institutions. In addition to this R&D, many multinational enterprises (MNEs) fund research and development activities abroad on their behalf.
73. In SNA 2008 (ESA2010) manual R&D transactions are described as follows regardless of whether they relate to outright purchases of R&D intellectual property products or expenditure on R&D activities:
A market producer purchases R&D: The purchases are reclassified from intermediate
consumption (ESA95) to gross fixed capital formation (ESA2010).
74. The former distinction between R&D assets and expenditure on R&D was replaced by a common treatment, with both being capitalised and recorded under capital formation and in the stocks of capital assets of a country. It is likely that the distinction between these two elements of R&D was no longer considered relevant because the development of IP assets was being capitalised as the expenditure was incurred. However, when the impact of cross
16 Guide to Measuring Global Production pp 67 - 68

28
border purchases of R&D related IPP (patents) is considered these changes were very significant particularly for small, open economies engaged in activities where these intellectual property products are critical inputs to production.
75. Moreover, these changes in the standards relating to R&D were compounded by other developments in favour of greater compliance with international recommendations for corporate tax planning, specifically the OECD Base Erosion and Profit Shifting (BEPS). These initiatives were complimented by other developments in national tax law in European countries.
76. It is unlikely than those involved in framing the statistical standards could have foreseen that the introduction of the new statistical standards as they apply to Research and Development activities would coincide with these global and domestic initiatives addressing aspects of corporate tax planning by MNEs.
7. BEPS Recommendations
77. The Base Erosion and Profit Shifting (BEPS) recommendations of OECD were aimed at ensuring greater compliance with the principal that income is taxed where it is earned and received significant support, particularly from OECD member countries.
78. Following on from the introduction of the BEPS recommendations and the associated legal changes there has been a stream of imports related to cross border purchases of Intellectual Property from foreign affiliates by MNEs. However these same developments will assist compilers in identifying transactions in these intangible assets because a feature of the BEPS recommendations is country – by-country reporting which involves an exchange of information between taxation authorities on these IP flows.
79. Expenditure GDP17 is the ideal prism through which these corporate events involving IP can be viewed where changes in investment and exports and imports of goods and services can be observed. However, Income GDP18 is also very informative. The Expenditure variables that were impacted by the outright purchases of IP are imports and capital formation that contribute to GDP. Looking at the impact of additional IP on the income side particularly where cross border IP is being considered means that two separate but definitely linked sets of calculations around Gross Operating Surplus and what is termed Primary income in the Balance of Payments, need to be examined. Primary income is the main contributor to Net Factor Incomes (NFI) from abroad, the key explanatory variable in the transition from GDP to GNP (GNI).
80. To calculate Gross Operating Surplus, company depreciation charges are added back. Depreciation is then calculated based on the permanent inventory method (PIM) and subtracted from the Gross Operating Surplus calculation to give Net Operating Surplus (see Fig 8.16 below). Depreciation is calculated in the PIM model based on the economic lives of the assets. This differs from the accounting measure used in a company’s statutory accounts. In the case of the IP assets related to R&D, the economic life tends to be longer than the accounting life although assets lives can vary from company to company. The asset valuation at the outset is the same19 in both approaches but the consequence of the difference in asset lives is that the depreciation from the PIM model can be smaller than the statutory accounting depreciation annual charge.
17 Personal and Government Consumption of goods and services, Capital formation and net exports C+I+G+(X-M) = GDP 18 Operating surplus, mixed income, compensation of employees, depreciation plus taxes less subsidies on products and production. GOS+GMI+COE+T-S =GDP 19 Simplification - the asset valuation may be different at the outset. In addition the annual revaluation, geometric assumptions etc. of the asset will result in different asset valuations to apply the depreciation calculations to.
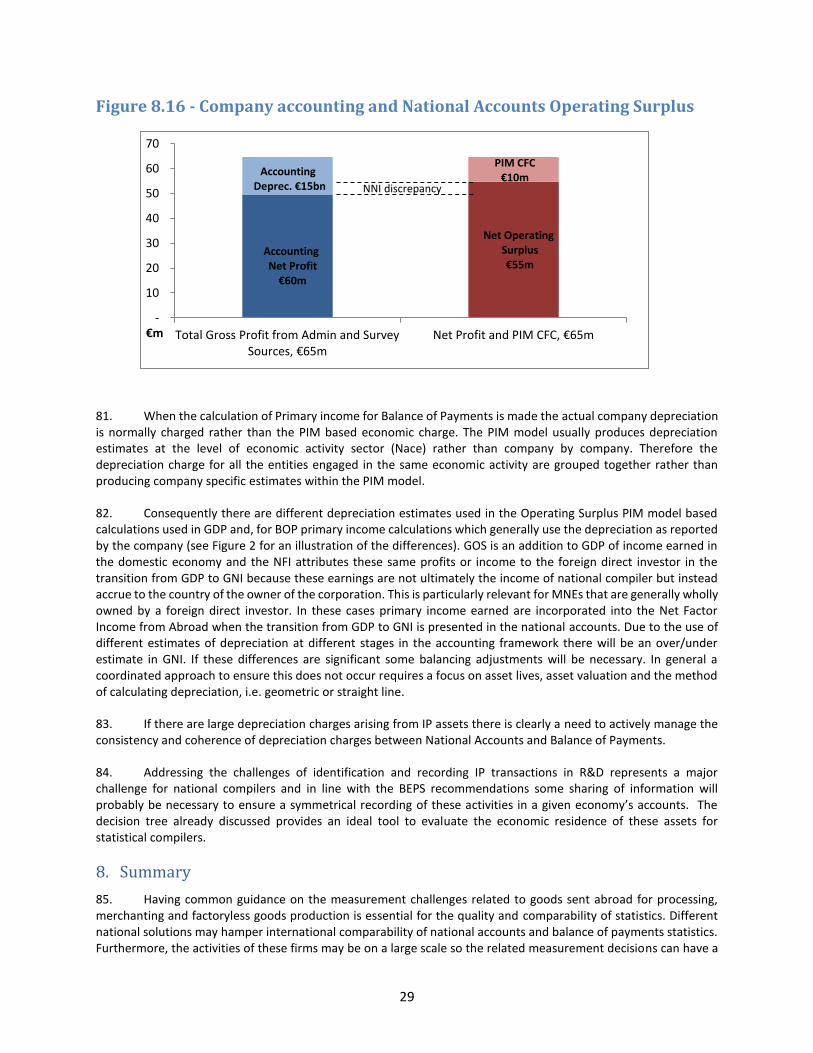
29
Figure 8.16 - Company accounting and National Accounts Operating Surplus
81. When the calculation of Primary income for Balance of Payments is made the actual company depreciation is normally charged rather than the PIM based economic charge. The PIM model usually produces depreciation estimates at the level of economic activity sector (Nace) rather than company by company. Therefore the depreciation charge for all the entities engaged in the same economic activity are grouped together rather than producing company specific estimates within the PIM model.
82. Consequently there are different depreciation estimates used in the Operating Surplus PIM model based calculations used in GDP and, for BOP primary income calculations which generally use the depreciation as reported by the company (see Figure 2 for an illustration of the differences). GOS is an addition to GDP of income earned in the domestic economy and the NFI attributes these same profits or income to the foreign direct investor in the transition from GDP to GNI because these earnings are not ultimately the income of national compiler but instead accrue to the country of the owner of the corporation. This is particularly relevant for MNEs that are generally wholly owned by a foreign direct investor. In these cases primary income earned are incorporated into the Net Factor Income from Abroad when the transition from GDP to GNI is presented in the national accounts. Due to the use of different estimates of depreciation at different stages in the accounting framework there will be an over/under estimate in GNI. If these differences are significant some balancing adjustments will be necessary. In general a coordinated approach to ensure this does not occur requires a focus on asset lives, asset valuation and the method of calculating depreciation, i.e. geometric or straight line.
83. If there are large depreciation charges arising from IP assets there is clearly a need to actively manage the consistency and coherence of depreciation charges between National Accounts and Balance of Payments.
84. Addressing the challenges of identification and recording IP transactions in R&D represents a major challenge for national compilers and in line with the BEPS recommendations some sharing of information will probably be necessary to ensure a symmetrical recording of these activities in a given economy’s accounts. The decision tree already discussed provides an ideal tool to evaluate the economic residence of these assets for statistical compilers.
8. Summary
85. Having common guidance on the measurement challenges related to goods sent abroad for processing, merchanting and factoryless goods production is essential for the quality and comparability of statistics. Different national solutions may hamper international comparability of national accounts and balance of payments statistics. Furthermore, the activities of these firms may be on a large scale so the related measurement decisions can have a
PIM CFC€10m
-
10
20
30
40
50
60
70
Total Gross Profit from Admin and Survey Sources, €65m
Net Profit and PIM CFC, €65m€m
AccountingDeprec. €15bn
AccountingNet Profit
€60m
NNI discrepancy
Net OperatingSurplus€55m

30
significant impact on national statistics and if not recorded symmetrically add to the discrepancies in global trade. It is extremely important to discuss data issues and sources both nationally and internationally, and reconcile data between different economic statistics.
86. A major practical challenge, discussed earlier, is the adjustment of IMTS data to the required recording in the 2008 SNA and BPM6. The first step should be to analyze the additional information items that are available in IMTS but may not be fully utilized.
87. Arriving in accordance with the 2008 SNA and BPM6 requirements is also likely to require estimation especially if reliable nature of transaction codes are not available from Customs data.
88. While the use of multiple data sources combined with estimation is essential for making the adjustments, proper data adjustments will also require some new variables to be collected by surveying. This tends to increase enterprises’ response burden and has to be, thus, carefully planned. Additional information (such as on trade services connected to merchanting, processing fees, exports of goods directly following processing, inventories held abroad etc.) could be, for instance, first collected only annually or even as a one-off survey. This would already give a better basis for estimations.
89. As some data sources are incomplete or unreliable, using the integrated business register for data matching and validating can be helpful. Another very useful further step would be to advance data exchange among national statistical offices. Exchange of micro-data is, however, quite a challenge because of confidentiality issues and other legal constrains.