part 1: problem - mathsnz teachers booklet.docx · web viewlevel 3 – as91580 – 4 credits –...
TRANSCRIPT

NCEA Level 3 - 3.8 Time Seriesstudents.mathsnz.com
Level 3 – AS91580 – 4 Credits – InternalInvestigate Time Series Data
Written by J Wills – MathsNZ – [email protected]
Achievement Achievement with Merit Achievement with Excellence
Investigate time series data. Investigate time series data, with justification.
Investigate time series data, with statistical insight.
Part 1: Problem.......................................................................................................................... 2Part 2: Plan................................................................................................................................. 4
Part 2.1: Explain the Variables................................................................................................4Part 2.2: Naming the Source...................................................................................................6
Part 3: Data – Using NZGrapher.................................................................................................8Part 4: Analysis......................................................................................................................... 10
Part 4.1: Long Term Trend....................................................................................................10Part 4.2: Seasonal Pattern.....................................................................................................12Part 4.3: Outliers................................................................................................................... 14Part 4.4: Appropriateness of the Model.................................................................................16Part 4.5: Predictions..............................................................................................................18Part 4.6: Reasons for Confidence..........................................................................................20
Part 5: Conclusion.................................................................................................................... 22Part 6a: Writing Your Own Internal 1........................................................................................24Part 6b: Writing Your Own Internal 2........................................................................................26Sample Internal (at Achieved Level)........................................................................................28Data Set Information................................................................................................................30Assessment Guidelines – 91580 – Investigate Time Series Data..............................................32

NCEA Level 3 - 3.8 Time Seriesstudents.mathsnz.com
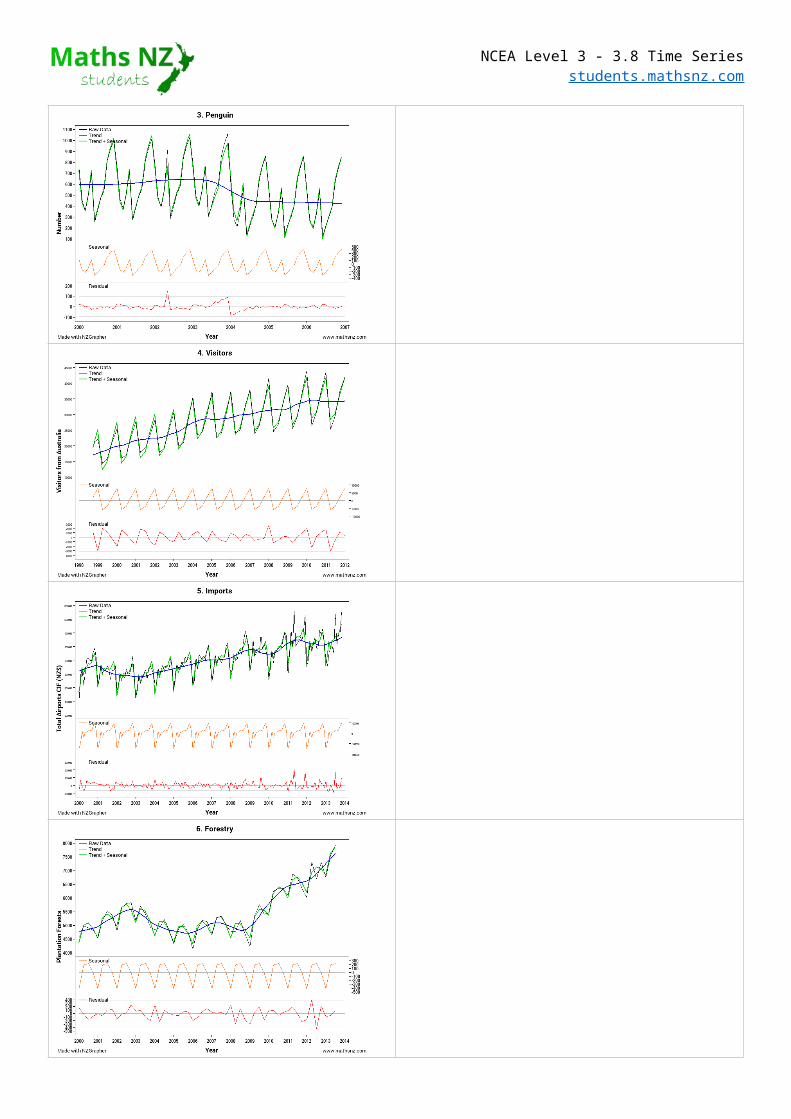
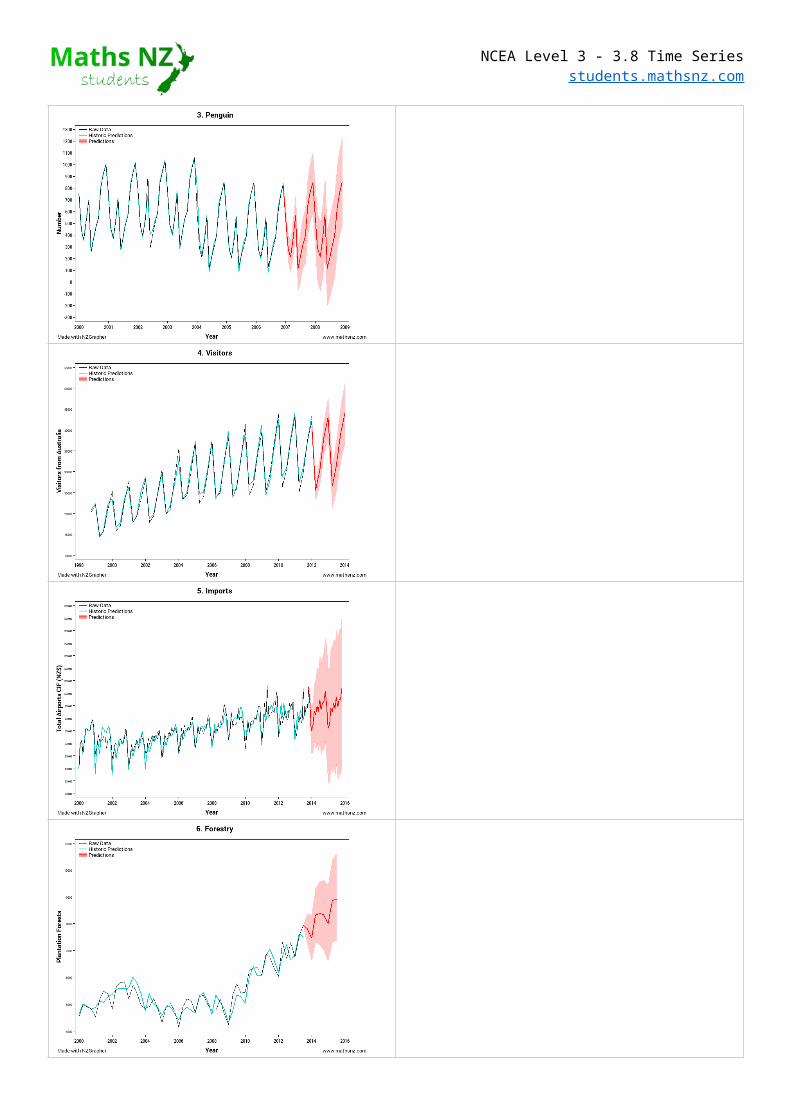
Part 1: ProblemFor each of the graphs write a good purpose. A purpose should give a reason as to why you would want to look at this dataset. You should be trying to link this to research.You then need to state what you are going to be predicting, and link this to your purpose.The first two have been done for you. Note: NZGrapher will always predict for the next two years
People who live in low lying areas are concerned about the amount of ice in the sea as when it melts they are worried about their homes flooding. “Even a modest rise in sea levels could cause flooding problems for low-lying coastal areas.”1
One of the main areas of ice in the world is at the North Pole, or the Arctic, so I am going to predict the surface area of the ice at the North Pole for the next two years.1. http://science.howstuffworks.com/environmental/green-science/
global-warming4.htmA doctor at the local birthing unit has asked me to look at the number of births so that he can work out if he should be employing more staff or not.
The number of males and females born are approximately the same, so I am going to predict the number of live male births in New Zealand for the next two years.


NCEA Level 3 - 3.8 Time Seriesstudents.mathsnz.com
Part 2: PlanPart 2.1: Explain the Variables
The next thing that we need to do is explain our variable(s) and say what units are being used. Identify the variables for each of the graphs. The first two have been done as examples for you.
The sea ice is the surface area of sea ice in the Arctic Circle which is measured in millions of square kilometres.
Male live births is the number of males born in each quarter in New Zealand.


NCEA Level 3 - 3.8 Time Seriesstudents.mathsnz.com
Part 2.2: Naming the SourceIn order for our report to have validity, we need to state where the data has come from.Name the source for each of the graphs. The first two have been done as examples for you.Hint: Information of all of the data sources is in the appendix.
The data used in this investigation is from the National Snow and Ice Data Center from 1990 - 2011.
The data used in this investigation is from Statistics New Zealand from 2000 - 2012.

NCEA Level 3 - 3.8 Time Seriesstudents.mathsnz.com
Part 3: Data – Using NZGrapherThe next section that we need to do is the data section. This is reproducing the graphs on Page 2 using NZGrapher. The example below will go through using the Rugby dataset for weight by position.NZGrapher runs on anything with a browser… Macs, PCs, iPad, Android, ChromeBooks and more.
The example below uses the sea ice dataset.First up we need to start NZGrapher by going to the link in the box to the right.
www.jake4maths.com/grapher
The first time you load NZGrapher it will display an overlay with descriptions as to what all the different areas do as shown to the right. To load your data in either select it from the dropdown in the top right, or upload it in the top left corner and press go.
To draw a dot plot there are just three things you need to do.1. Select the x-variable… this is your time
series variable that will be on the x-axis, in this case it’s ‘Time’.
2. Select the y-variable… this is your actual data, in this case it’s ‘Arctic’.
3. Select the graph type… for this we want the ‘time series re-composition’.
You then just need to check the graph title and axis labels to make sure they are appropriate (include units where necessary) and add press update graph to save the titles.
To copy the graph just right click and press copy image, or to save press ‘Save Image As’ or whatever your device says that is similar.
Note: If you want to identify the extreme points, if you click the ‘Point Labels’ checkbox this will add little numbers next to the points that correspond with the point id.

NCEA Level 3 - 3.8 Time Seriesstudents.mathsnz.com
To get the seasonal effect graph just change the graph type to ‘time series seasonal effects’
Note: you will need to change the x-axis title to reflect if it is monthly or quarterly (or something else).
The final graph we need is the forecast graph. To get the visual output you just change the graph type to ‘time series forecasts’
You will also need the text output of the predictions which you can get by clicking on the tick box below the graph.
Now it’s your turn. For each dataset produce all the outputs shown above.
Teachers: for tips and tricks on how to format data for time series click on the time series link on: http://www.mathsnz.com/inzight-tips/
NCEA Level 3 - 3.8 Time Seriesstudents.mathsnz.com
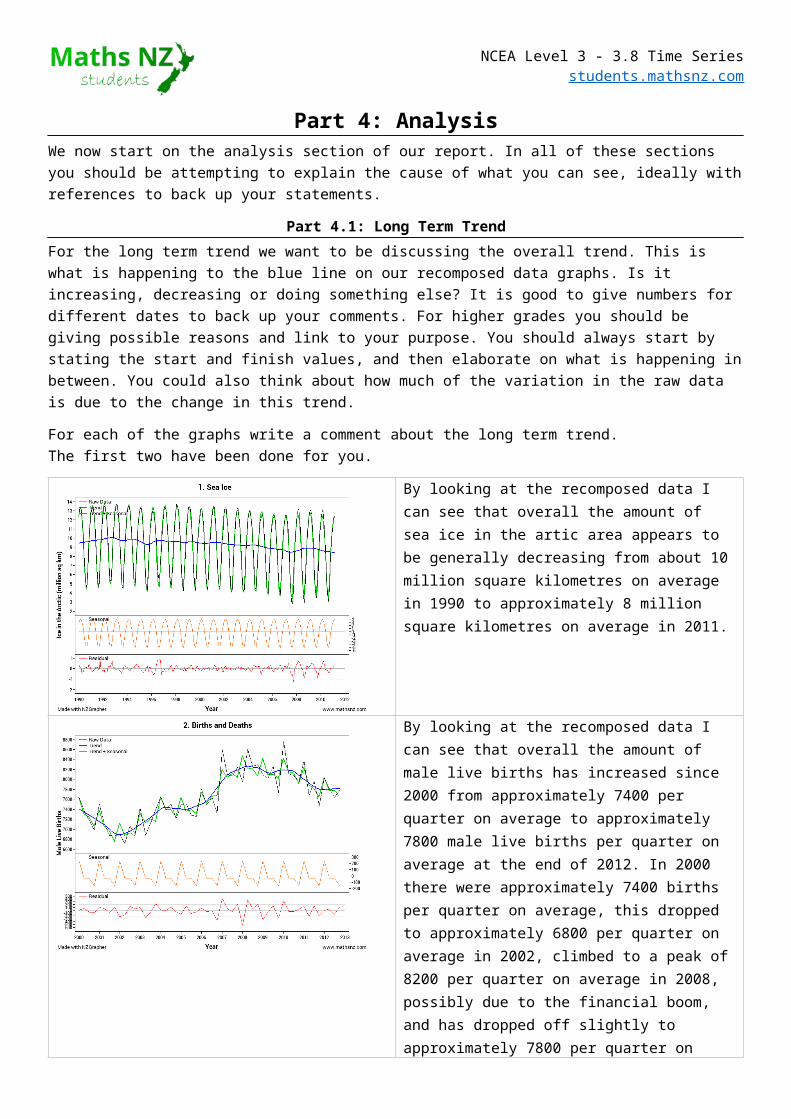
Part 4: AnalysisWe now start on the analysis section of our report. In all of these sections you should be attempting to explain the cause of what you can see, ideally with references to back up your statements.
Part 4.1: Long Term TrendFor the long term trend we want to be discussing the overall trend. This is what is happening to the blue line on our recomposed data graphs. Is it increasing, decreasing or doing something else? It is good to give numbers for different dates to back up your comments. For higher grades you should be giving possible reasons and link to your purpose. You should always start by stating the start and finish values, and then elaborate on what is happening in between. You could also think about how much of the variation in the raw data is due to the change in this trend.For each of the graphs write a comment about the long term trend.The first two have been done for you.
By looking at the recomposed data I can see that overall the amount of sea ice in the artic area appears to be generally decreasing from about 10 million square kilometres on average in 1990 to approximately 8 million square kilometres on average in 2011.
By looking at the recomposed data I can see that overall the amount of male live births has increased since 2000 from approximately 7400 per quarter on average to approximately 7800 male live births per quarter on average at the end of 2012. In 2000 there were approximately 7400 births per quarter on average, this dropped to approximately 6800 per quarter on average in 2002, climbed to a peak of 8200 per quarter on average in 2008, possibly due to the financial boom, and has dropped off slightly to approximately 7800 per quarter on average in at the end of 2012.


NCEA Level 3 - 3.8 Time Seriesstudents.mathsnz.com
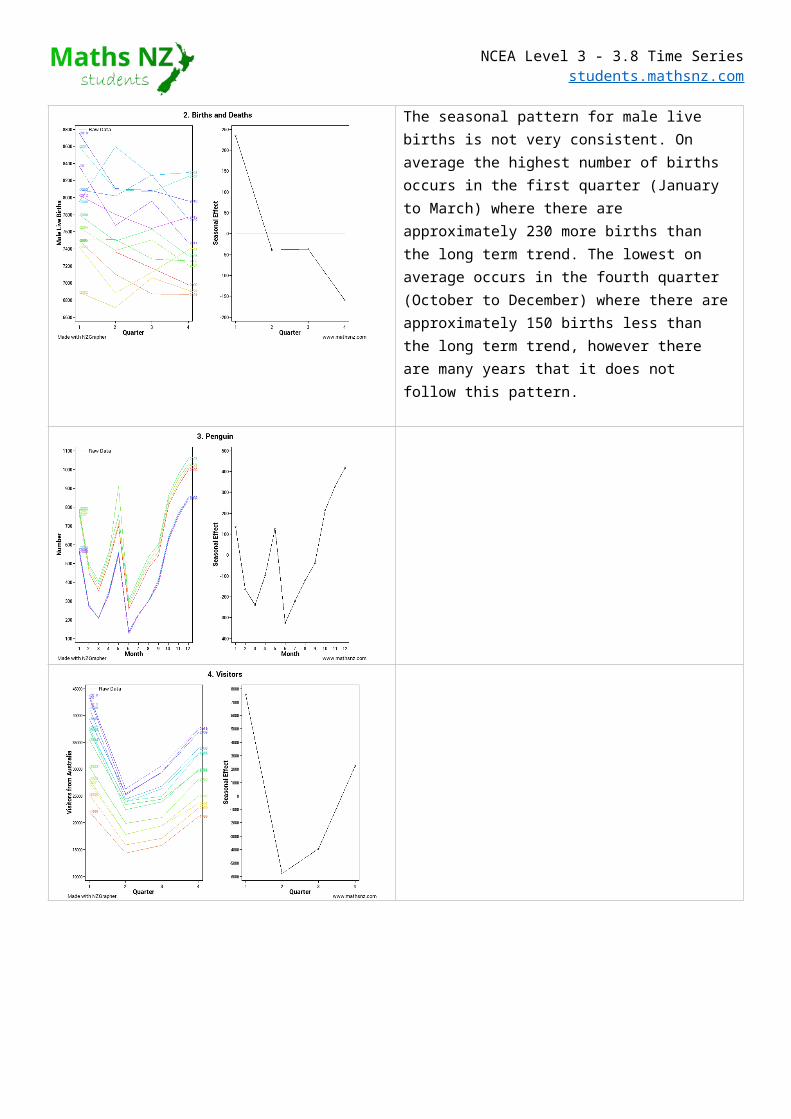
Part 4.2: Seasonal PatternWith the seasonal pattern we are looking at what is happening in each month or each quarter. You want to be commenting on any highs or lows and also the change between them. For higher grades you should be giving possible reasons and link to your purpose and also think about the relative size of the season pattern to the overall variation.For each of the graphs write a comment about the long term trend. The first two have been done for you.
The largest amount of sea ice at the North Pole normally occurs during February and March when the amount of sea ice is approximately 4 million square kilometres above the long term trend. Between April and August there is a consistent drop from month to month as temperatures are rising. The smallest amount of sea ice regularly occurs in September where the amount of sea ice is approximately 5 million square kilometres below the long term trend. After this the temperatures start cooling down again increasing the amount of ice on a month to month basis until it returns to its peak in February and March.The seasonal pattern for male live births is not very consistent. On average the highest number of births occurs in the first quarter (January to March) where there are approximately 230 more births than the long term trend. The lowest on average occurs in the fourth quarter (October to December) where there are approximately 150 births less than the long term trend, however there are many years that it does not follow this pattern.
NCEA Level 3 - 3.8 Time Seriesstudents.mathsnz.com
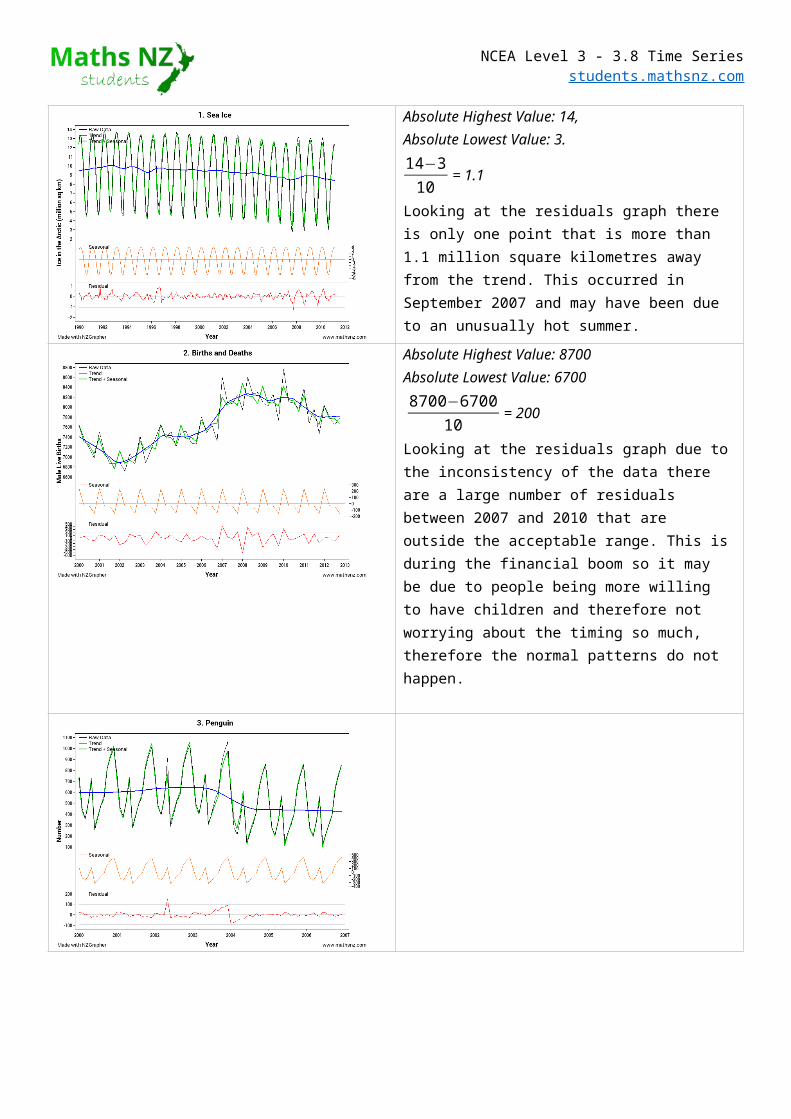
Part 4.3: Unusual PointsThe next step involves a little bit of mathematical calculations. To work out if a point is an outlier tend to use the rule of thumb that the residual is more than 10% of the overall spread. NZGrapher automatically draws these in as light grey lines for you in the residuals section. To easily identify points if you tick the ‘Point Labels’ button it puts the id of the row next to each point.To calculate this we use the following calculation:Absolute Highest Value−Absolute Lowest Value
10 If any of the residuals are either larger or smaller than this value we need to comment on them and what might be causing them. You could

NCEA Level 3 - 3.8 Time Seriesstudents.mathsnz.com
also be thinking about how big the variation is of the residuals is as a component of the overall variation.
For each of the graphs calculate if there are any outliers and comment on any unusual features. The first two have been done for you.
Absolute Highest Value: 14, Absolute Lowest Value: 3.14−310 = 1.1
Looking at the residuals graph there is only one point that is more than 1.1 million square kilometres away from the trend. This occurred in September 2007 and may have been due to an unusually hot summer.
Absolute Highest Value: 8700 Absolute Lowest Value: 6700
8700−670010 = 200
Looking at the residuals graph due to the inconsistency of the data there are a large number of residuals between 2007 and 2010 that are outside the acceptable range. This is during the financial boom so it may be due to people being more willing to have children and therefore not worrying about the timing so much, therefore the normal patterns do not happen.
NCEA Level 3 - 3.8 Time Seriesstudents.mathsnz.com
Part 4.4: Appropriateness of the ModelAt this point in your report you should include the forecast graph we produced earlier.You need to make a comment around how well the forecast model fits the data by looking at how the historic predictions fits with the raw data, particularly commenting on any time periods where it does not fit particularly well. Try and link these to how accurate you think the predictions will be. You can also discuss how well the recomposed data we looked at earlier fits the data.For each of the graphs comment on how well the model fits the data. The first two have been done for you.

NCEA Level 3 - 3.8 Time Seriesstudents.mathsnz.com
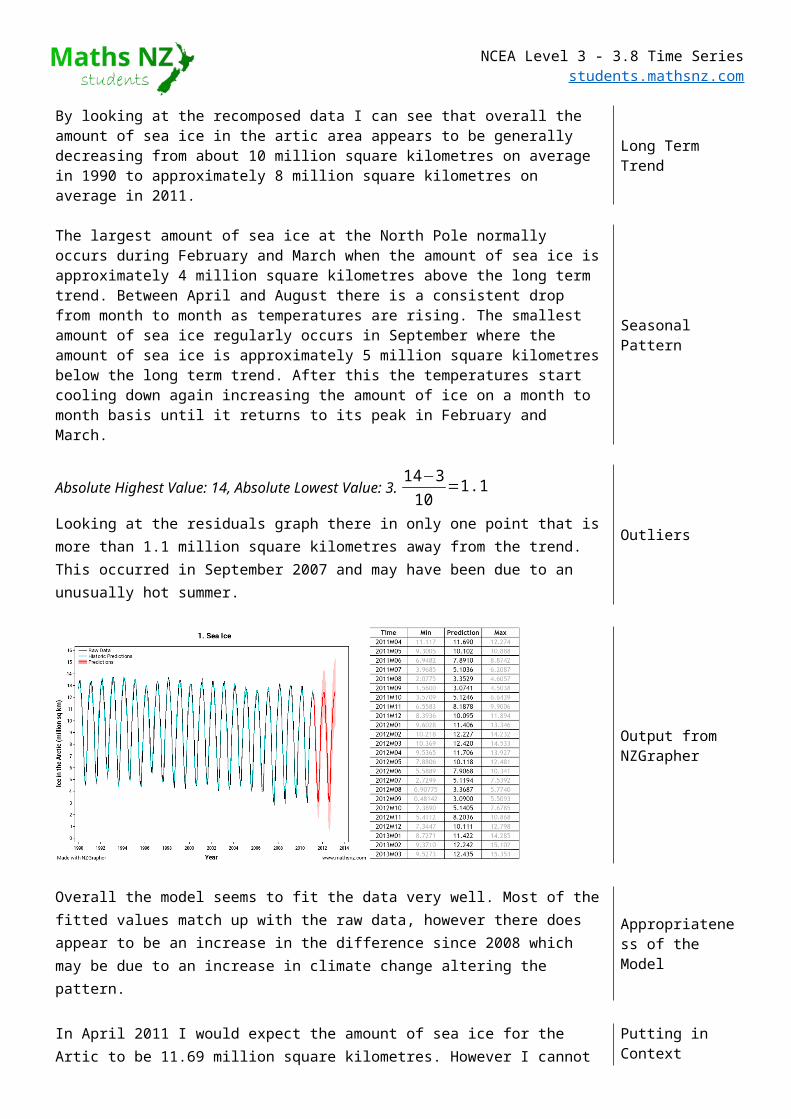
Overall the model seems to fit the data very well. Most of the fitted values match up with the raw data, however there does appear to be an increase in the difference since 2008 which may be due to an increase in climate change altering the pattern.
Due to the highly variable nature of the seasonal effects the model doesn't fit the data particularly well. It is not too bad before 2006 and appears to have settled down after 2011. Provided the pattern remains settled the predictions should be reasonably accurate

NCEA Level 3 - 3.8 Time Seriesstudents.mathsnz.com
Part 4.5: Predictions
NCEA Level 3 - 3.8 Time Seriesstudents.mathsnz.com
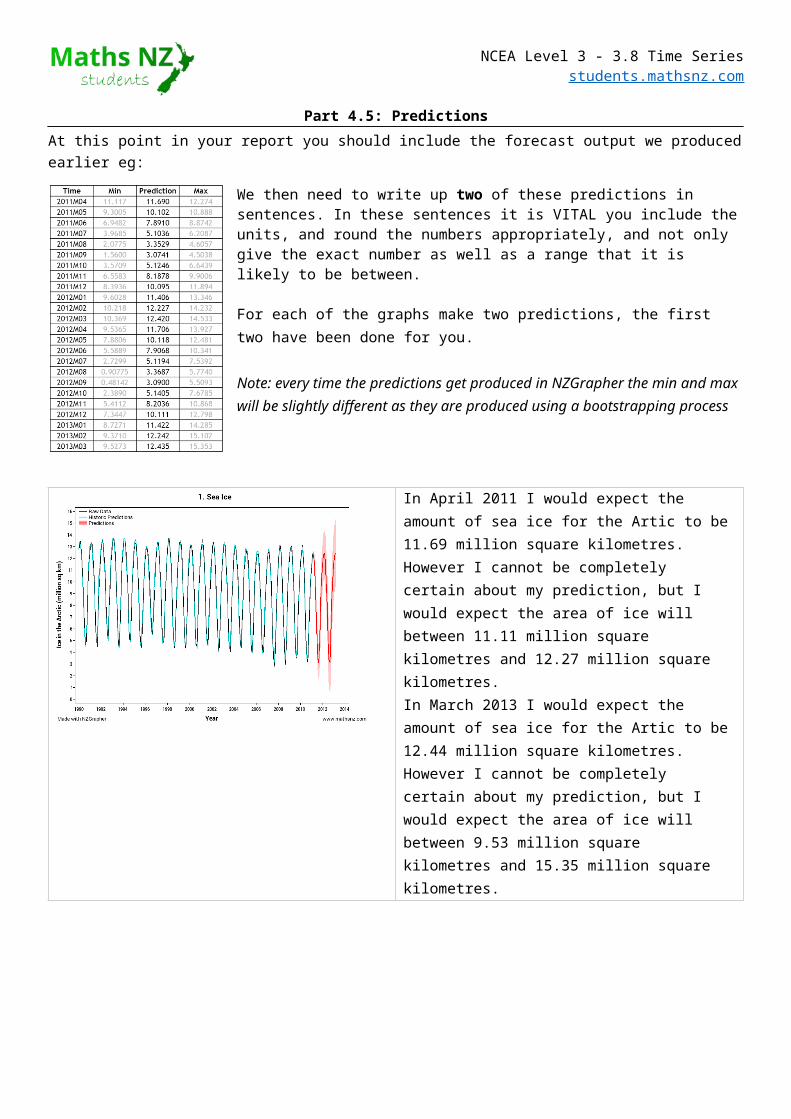
At this point in your report you should include the forecast output we produced earlier eg:We then need to write up two of these predictions in sentences. In these sentences it is VITAL you include the units, and round the numbers appropriately, and not only give the exact number as well as a range that it is likely to be between.
For each of the graphs make two predictions, the first two have been done for you.
Note: every time the predictions get produced in NZGrapher the min and max will be slightly different as they are produced using a bootstrapping process
In April 2011 I would expect the amount of sea ice for the Artic to be 11.69 million square kilometres. However I cannot be completely certain about my prediction, but I would expect the area of ice will between 11.11 million square kilometres and 12.27 million square kilometres.In March 2013 I would expect the amount of sea ice for the Artic to be 12.44 million square kilometres. However I cannot be completely certain about my prediction, but I would expect the area of ice will between 9.53 million square kilometres and 15.35 million square kilometres.In January to March 2013 I would expect there to be approximately 8030 male live births. However I cannot be completely confident in my prediction, but I would expect the number of male live births for this quarter to be somewhere between 7540 and 8590.In October to December 2014 I would expect there to be approximately 7410 male live births. However I cannot be completely confident in my prediction, but I would expect the number of male live births for this quarter to be somewhere between 5890 and 9050.

NCEA Level 3 - 3.8 Time Seriesstudents.mathsnz.com
Part 4.6: Reasons for ConfidenceWith our predictions we normally cannot be completely confident in our predictions. It is useful to discuss other factors that may be influencing the predictions and how much effect these will have on your predictions. This is a great time to include some extra research.
For each of the graphs make comments about your predictions.The first two have been done for you.
We can’t be completely certain about our predictions as there are a number of factors that could be affecting the amount of sea ice. One of these factors is possibly global temperatures which is affected by sun spots (NASA, 2014).
We can't be completely certain about our predictions as there are a number of factors that could be affecting the number of male live births. One of these factors is the economic conditions as when times are tougher people think more before having children, so it depends on what happens to New Zealand’s economy as to how many live births there are likely to be.


NCEA Level 3 - 3.8 Time Seriesstudents.mathsnz.com
Part 5: ConclusionIn the conclusion we need to summarise and link back to the purpose. It is important to:
- Give a brief summary- Link back to the research… do our findings match up?- What is the impact of these findings?
For each of the graphs write up a conclusion, the first two have been done for you.
In conclusion, there appears to be a definite decrease in the amount of sea ice at the North Pole. This should be of concern to people living in low lying areas as this means the sea levels are likely to be rising, potentially putting their homes at risk of flooding.
In conclusion, the amount of male births fluctuates widely depending on the economic climate, therefore if the doctor feels like economic times are improving he might want to employ more staff, but if he thinks economic times are likely to get tougher then he should not employ more staff.

NCEA Level 3 - 3.8 Time Seriesstudents.mathsnz.com
Congratulations, you have now written up a report for 4 different sets of data, so you now should be able to write up your own internal. Don’t forget to give your
report a title.

NCEA Level 3 - 3.8 Time Seriesstudents.mathsnz.com
Part 6a: Writing Your Own Internal 1
Using the framework below write a report on the sunglasses sales data.
Sunglasses Title Is Given
Problem________________________________________________________________________________________________________________________________________________________________________________________________________________________________________________
Purpose
________________________________________________________________________________________________________________________________________________________________________________________________________________________________________________
What I’m Predicting
Plan________________________________________________________________________________________________________________________________________________________________________________________________________________________________________________
Explain the Variables
________________________________________________________________________________________________________________________________________________________________________________________________________________________________________________
Naming the Source
Data
The Graph including adding the axis label.
Analysis________________________________________________________________________________________________________________________________________________________________________________________________________________________________________________
Long Term Trend
________________________________________________________________________________________________________________________________________________________________________________________________________________________________________________________________________________________________________________________________________________________________________________________________________________
Seasonal Pattern
________________________________________________________________________________________________________________________________________________________________________________________________________________________________________________________________________________________________________________________________________________________________________________________________________________
Outliers

NCEA Level 3 - 3.8 Time Seriesstudents.mathsnz.com
________________________________________________________________________________
Output from NZGrapher
________________________________________________________________________________________________________________________________________________________________________________________________________________________________________________________________________________________________________________________________________________________________________________________________________________________________________________________________________________________________________________________________________________________________________________________________________________________________________________________________
Appropriateness of the Model
________________________________________________________________________________________________________________________________________________________________________________________________________________________________________________________________________________________________________________________________________________________________________________________________________________________________________________________________________________________________________________________________________________________________________________________________________________________________________________________________________________________________________________________________________________
Putting in Context
________________________________________________________________________________________________________________________________________________________________________________________________________________________________________________________________________________________________________________________________
Confidence in Predictions
Conclusion________________________________________________________________________________________________________________________________________________________________________________________________________________________________________________________________________________________________________________________________________________________________________________________________________________________________________________________________________________________________________________________________________________________________________________________________________________________________________________________________
Summarise and Link Back to the Purpose
Part 6b: Writing Your Own Internal 2
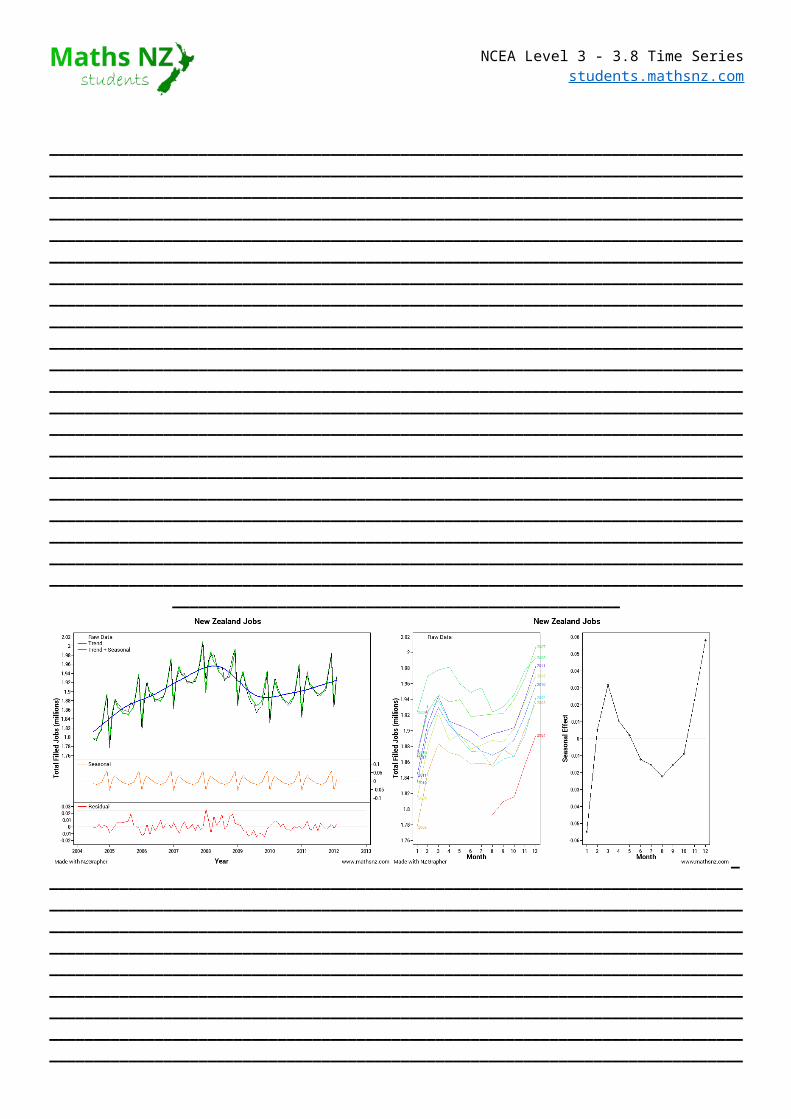
This time you have just been provided with graphs. Using these write your own internal.

NCEA Level 3 - 3.8 Time Seriesstudents.mathsnz.com
______________________________________________________________________________________________________________________________________________________________________________________________________________________________________________________________________________________________________________________________________________________________________________________________________________________________________________________________________________________________________________________________________________________________________________________________________________________________________________________________________________________________________________________________________________________________________________________________________________________________________________________________________________________________________________________________________________________________________________________________________________________________________________________________________________________________________________________________________________________________________________________________________________________________________________________________________________________________________________________________________________________________________________________________________________________________________________________________________________________________________________________________________________________________________________________________________________________________________________________________________________________________________________________________________________________________________________
_____________________________________________________________________________________________________________________________________________________________________________________________________________________________________________________________________________________________________________________________________________________________________________________________________________________________________________________________________________________________________________________________________________________________________________________________________________________________________________________________________________________________________________________________________________________________________________________________________________________________________________________________________________________________________________________________________________________________________________________________________________________________________________________________________________________________________________________________________________________________________________________________________________________________________________________________________________________________________________________________________________________________________________________________________________________________________________________________________________________________________________________________________________________________________________________________________________________________________________________________________________________________________________________________________________________________________________________________________________________________________________________________________________________________________________________________________________________________________________________________________________________________________________________________________________

NCEA Level 3 - 3.8 Time Seriesstudents.mathsnz.com
___________________________________________________________________________________________________________________________________________________________________________________________________________________________________________________________________________________________
_________________________________________________________________________________________________________________________________________________________________________________________________________________________________________________________________________________________________________________________________________________________________________________________________________________________________________________________________________________________________________________________________________________________________________________________________________________________________________________________________________________________________________________________________________________________________________________________________________________________________________________________________________________________________________________________________________________________________________________________________________________________________________________________________________________________________________________________________________________________________________________________________________________________________________________________________________________________________________________________________________________________________________________________________________________________________________________________________________________________________________________________________________________________________________________________________________________________________________________________________________________________________________________________________________________________________________________________________________________________________________________________________________________________________________________________________________________________________________________________________________________________________________________________________________________________________________________________________________________________________________________________________
________________________________________________________________________

NCEA Level 3 - 3.8 Time Seriesstudents.mathsnz.com
Sample Internal (at Achieved Level)
Ice at the North Pole Title Is GivenProblemPeople who live in low lying areas are concerned about the amount of ice in the sea as when it melts they are worried about their homes flooding. “Even a modest rise in sea levels could cause flooding problems for low-lying coastal areas.”1
Purpose
One of the main areas of ice in the world is at the North Pole, or the Arctic, so I am going to predict the surface area of the ice at the North Pole for the next two years.
What I’m Predicting
PlanThe sea ice is the surface area of sea ice in the Arctic Circle which is measured in millions of square kilometres.
Explain the Variables
The data used in this investigation is from the National Snow and Ice Data Center from 1990 - 2011.
Naming the Source
Data
The Graph including adding the axis label.
AnalysisBy looking at the recomposed data I can see that overall the amount of sea ice in the artic area appears to be generally decreasing from about 10 million square kilometres on average in 1990 to approximately 8 million square kilometres on average in 2011.
Long Term Trend
The largest amount of sea ice at the North Pole normally occurs during February and March when the amount of sea ice is approximately 4 million square kilometres above the long term trend. Between April and August there is a consistent drop from month to month as temperatures are rising. The smallest amount of sea ice regularly occurs in September where the amount of sea ice is approximately 5 million square kilometres below the long term trend. After this the temperatures start cooling down again increasing the amount of ice on a month to month basis until it returns to its peak in February and March.
Seasonal Pattern
Absolute Highest Value: 14, Absolute Lowest Value: 3. 14−310=1.1
Outliers
1 http://science.howstuffworks.com/environmental/green-science/global-warming4.htm
NCEA Level 3 - 3.8 Time Seriesstudents.mathsnz.com
Looking at the residuals graph there in only one point that is more than 1.1 million square kilometres away from the trend. This occurred in September 2007 and may have been due to an unusually hot summer.
Output from NZGrapher
Overall the model seems to fit the data very well. Most of the fitted values match up with the raw data, however there does appear to be an increase in the difference since 2008 which may be due to an increase in climate change altering the pattern.
Appropriateness of the Model
In April 2011 I would expect the amount of sea ice for the Artic to be 11.69 million square kilometres. However I cannot be completely certain about my prediction, but I would expect the area of ice will between 11.11 million square kilometres and 12.27 million square kilometres.In March 2013 I would expect the amount of sea ice for the Artic to be 12.44 million square kilometres. However I cannot be completely certain about my prediction, but I would expect the area of ice will between 9.53 million square kilometres and 15.35 million square kilometres.
Putting in Context
We can’t be completely certain about our predictions as there are a number of factors that could be affecting the amount of sea ice. One of these factors is possibly global temperatures which is affected by sun spots.
Confidence in Predictions
ConclusionIn conclusion, there appears to be a definite decrease in the amount of sea ice at the North Pole. This should be of concern to people living in low lying areas as this means the sea ice levels are likely to be rising, potentially putting their homes at risk of flooding.
Summarise and Link Back to the Purpose
NCEA Level 3 - 3.8 Time Seriesstudents.mathsnz.com
Data Set InformationBirths and DeathsData on the number of births and deaths in New Zealand.The data is sourced from Statistics New Zealand.
Variable DescriptionQuarter QuarterlyMale Live Births Number of males born during the quarterFemale Live Births
Number of females born during the quarter
Male Deaths Number of male deaths during the quarterFemale Deaths Number of female deaths during the
quarter
ForestryThe volume of wood removed from different types of forests in New Zealand.The data is sourced from the Ministry for Primary Industries.
Variable DescriptionQuarter QuarterlyNatural Forests The volume of wood removed from Natural Forests in millions of
m3
Plantation Forests
The volume of wood removed from Plantation Forests in millions of m3
ImportsInformation on imports to and from New Zealand.The data is sourced from Statistics New Zealand.
Variable DescriptionMonth Monthly TotalAirportsCIF Cost, insurance and freight of imported goods in
NZ$(000)TotalParcelPostCIF Cost, insurance and freight of imported goods in
NZ$(000)TotalSeaportsCIF Cost, insurance and freight of imported goods in
NZ$(000)TotalAirportsWeight Weight of imported goods in tonnesTotalParcelPostWeight
Weight of imported goods in tonnes
TotalSeaportsWeight Weight of imported goods in tonnes
JobsThe number of people in employment in New Zealand.The data is sourced from Statistics New Zealand.
Variable DescriptionMonth Monthly

NCEA Level 3 - 3.8 Time Seriesstudents.mathsnz.com
Total Filled Jobs
The number of jobs that are filled

NCEA Level 3 - 3.8 Time Seriesstudents.mathsnz.com
PenguinData on the number of penguins at the Phillip Island Penguin Parade in Australia.
Variable
Description
Month MonthlyNumber The number of penguins in the
colony
Sea IceThe data is the surface area of sea ice in millions of square kilometres.The data is sourced from the National Snow and Ice Data Center.
Variable DescriptionTime MonthlyArctic Million Square Kilometres of Ice in the
ArcticAntarctica Million Square Kilometres of Ice in
Antarctica
SunglassesData on the value of sunglasses sold.
Variable
Description
Quarter QuarterlySales Amount of sales in thousands of
dollars
VisitorsThe visitors’ dataset is the number of people entering New Zealand on a Visitor Visa from Australia, China, Japan and the UK.The data is sourced from Statistics New Zealand.
Variable DescriptionDate QuarterlyAustralia Number of visitors in the quarter from
AustraliaChina, People's Republic of
Number of visitors in the quarter from China
Japan Number of visitors in the quarter from Japan
United Kingdom Number of visitors in the quarter from the UK

NCEA Level 3 - 3.8 Time Seriesstudents.mathsnz.com
Assessment Guidelines – 91580 – Investigate Time Series Data
Achieved (all compulsory)
Merit… Achieved PLUS Excellence… Merit PLUS
Problem Identify a purpose for the investigation
Purpose is clear (compulsory) Research is used to develop purpose (compulsory)
Plan Select a variable to investigate that links to the purpose
Context is researched
Data Graph the raw and the smoothed data
Appropriate model is fitted and can be given as an equation, a fitted line or a graph of the smoothed data
Must have the following: Recomposition graph Seasonal Plot and
estimated seasonal effects
Raw data plus predictions plus prediction intervals
Remember to include the units on the axis if appropriate.
Graph must have a title, correctly labelled axis and any series shown on the graph(s) are clearly identified
Other relevant variables are discussed. This could include creating a new variable from the variables given
Analysis Give quantitative description of the trend and linked to context including stating the start and end points. (long term trend)
Seasonal pattern described and linked to context (seasonal effects)
Other relevant features are identified (residuals)
Forecasts are made with correct units
The appropriateness of the model is justified throughout the entire range of x-values
Other relevant features must be explained in context and comments made must be supported with statistical evidence
Forecasts are given in context and rounded correctly
Discussion given on how precise the predictions might be based on reliability of the trend or seasonal components
Understanding shown that forecasts are estimates
Provide possible explanations for the features of the graph
A comparison of predicted values for the most recent data values of the model could be made
Comparison between two data sets could be made
Conclusion
Conclusion is consistent with the purpose of the investigation
Conclusion must be given in context (compulsory)
The purpose of the investigation is addressed (compulsory)
There is a reflection on the analysis with respect to the background research undertaken
Impact of the findings is discussed
NCEA Level 3 - 3.8 Time Seriesstudents.mathsnz.com
Final grades will be decided using professional judgement based on a holistic examination of the evidence provided against the criteria in the Achievement Standard.