parliamentary election cycles and the turkish banking …fm · parliamentary election cycles and...
TRANSCRIPT
Parliamentary election cycles and the Turkish banking sector
Christopher F Bauma,b,∗, Mustafa Caglayanc, Oleksandr Talaverad
aDepartment of Economics, Boston College, Chestnut Hill, MA 02467 USAbDIW Berlin, Mohrenstraße 58, 10117 BerlincDepartment of Economics, University of Sheffield, Sheffield S10 2TN, UKdSchool of Economics, University of East Anglia, Norwich NR4 7TJ, UK
Abstract
This paper analyzes the effects of parliamentary election cycles on the Turkish banking system. Using
annual bank-level data representing all banks in Turkey during 1963–2007, we present evidence of mean-
ingful differences in the structure of bank assets, liabilities and financial performance across different
stages of the parliamentary election cycle. However, we find that government-owned banks’ behavior does
not meaningfully differ from that of either domestic and foreign-owned private sector banks before, during
or after elections. Our estimates also show that government-owned banks underperform both domestic
and foreign-owned private sector counterparts.
JEL classification: G21, G28
Keywords: Elections; State banks; Domestic banks; Foreign-owned banks; Loans; Interest rate margin
∗Corresponding author. Tel.: +1 617 552 3673; fax: +1 617 552 2308.Email addresses: [email protected] (Christopher F Baum), [email protected] (Mustafa Caglayan),[email protected] (Oleksandr Talavera)
1. Introduction
Despite the observation that the role of commercial banks in market-oriented economies is
shrinking, it is an undeniable fact that they retain a pivotal role in financial markets. However,
when we investigate the structure of banking systems across different countries, we find substantial
differences. For instance, in pure market-oriented economies such as the US and the UK, govern-
ments have traditionally only played a regulatory role in the banking sector,1 while in many other
countries governments directly control financial resources through ownership of one or more banks
in addition to their regulatory functions.2 Nations that contain government-owned or state banks
base the existence of such institutions on the ability of state-owned banks to finance projects that
would not pass scrutiny at private-sector banks. This reasoning is quite controversial as it harbors
the seeds of corruption and inefficiency. For instance, state-owned banks can be misused by the
governing party, who may direct state banks to channel funds to projects which will benefit those
who support the government rather than those which serve the greater public interest. In that
sense, actions of state-owned banks in financial markets are scrutinized very closely by the public
and by international organizations such as the IMF and the World Bank.
Given the potential controversies embedded in a mixed financial system in which private-
sector and state-owned banks coexist, researchers are keen to document the behavioral differences
between state-owned and private-sector banks. The questions that researchers investigate vary
from the significance of bank ownership in the promotion of economic growth to politicians’ ability
to influence election results through state-owned banks’ actions. At the heart of the matter,
researchers seek to determine whether state-owned banks fulfill their functions efficiently and
effectively or if they promote abuse and economic inefficiency through misallocation of capital.
1.1. Brief literature review
Recent research points out that state-owned banks in developing countries seem to have lower
profitability and higher costs. An earlier study by Molyneux and Thornton (1992), who use a
sample of European banks during 1986–1989, finds that government ownership has a positive
1The de facto nationalization of US and UK banks in the 2008 financial crisis stands in sharp contrast to thosenations’ historical behavior.
2For instance, 32% of Turkish banking assets were controlled by the state in 2005.
2
impact on bank profitability. Yet Barth et al. (2000) and La Porta et al. (2002) provide evidence
that state-owned banks are associated with lower economic growth. Similarly, Bongini et al. (2002)
suggest that political connections may determine governments’ intervention to rescue failing banks.
Dinc (2005) investigates the effects of politicians’ influence on state-owned banks, concentrating
on bank lending behavior. Using a large cross-country dataset, he finds evidence that state-owned
banks increase their lending in election years relative to private sector banks. In a similar vein,
Brown and Dinc (2005) show that prior to elections, failing banks are less likely to be taken into
administration. A recent study by Micco et al. (2007) points out that the performance of state-
owned banks worsens during election years as they are influenced by political concerns. A broad
cross-country study by Hauner (2008) provides evidence of a significant negative effect of credit to
government in developing economies.
Studies that concentrate on country-specific data on the behavior of lenders and borrowers also
reveal that firms that have political ties with politicians are favored by state-owned banks. Sapienza
(2004) shows the effect of political connections on state-owned banks in Italy. Concentrating on
Italian firms, he provides evidence that state-owned banks charge lower interest rates than do
private sector banks. He also shows that firms pay lower interest rates in areas where the head of
the local state-owned bank has the same party affiliation as the ruling political party. Using data
from Pakistan, Khwaja and Mian (2005) provide evidence that low-quality borrowers with political
connections can borrow from state-owned banks. Fraser et al. (2006) suggest that Malaysian
banks’ leverage is affected by the share of government ownership, informal ties to politicians, and
the ownership share held by “institutional investors”, de facto controlled by the government or
government-sponsored agencies. Baum et al. (2008) find that politically affiliated banks in Ukraine
have significantly lower interest rate margins and that the level of activity of affiliated deputies in
parliament has a positive impact on linked banks’ capitalization ratios. Cole (2009), using data
from India, shows that state bank credit is 5–10% higher in election years and even more so in
heavily contested electoral districts. He also indicates that state bank loans are less likely to be
repaid. Other researchers have shown that Chinese state-owned banks are less profitable, less
efficient and have worse asset quality than other types of banks (Lin and Zhang (2009), Berger
3
et al. (2009)).
Research on Turkish political business cycles also highlights the possibility of state-owned banks
being used for the advancement of governments’ ambitions. Tutar and Tansel (2001) point out
that during election periods both the budget deficit and line items of the budget are significantly
negatively affected. Alper and Onis (2004) claim that these ‘deficits reflect the existence of powerful
pressures for rent distribution as a major element of Turkey’s political economy in recent decades.’
Similarly, Akalin and Erkisi (2007) find that government expenditures increase during election
years over the 1950–2006 period.
1.2. Overview of the paper
We study the behavior of private sector and state-owned banks in Turkey throughout par-
liamentary election cycles. Our dataset covers the period between 1963 and 2007, during which
Turkey conducted 11 parliamentary elections. Our sample consists of 2,158 bank-year observations
pertaining to 86 banks. Since the establishment of the republic in the 1920s, Turkish financial mar-
kets benefited from state-owned banks as well as domestic and foreign private-sector banks. Hence,
the data, collected and made available by the Banks Association of Turkey, are rich and consistent
throughout the period of interest. We carry out our empirical analysis using the system dynamic
panel data (DPD) estimator which combines equations in differences of the variables with equations
in levels of the variables (see Blundell and Bond (1998)).
Our study differs from the earlier literature on several dimensions. First, our study provides
a thorough investigation of all types of banks in Turkey over election cycles rather than a knife-
edge comparison of banks’ behavior between election versus non-election years. Next, we also
concentrate on the behavior of a number of bank finance ratios, their growth rates and performance
measures rather than a single factor. Finally, by focusing on a single country’s entire banking
sector, we scrutinize a consistent dataset which is not prone to sample selection bias or accounting
problems that might have affected the results presented in earlier research.
Several findings emerge in a setting where confounding factors are taken into account within
the framework of a dynamic model. Although Turkish election cycles significantly affect bank
behavior, these effects do not differ meaningfully across state, domestic and foreign-owned private
4
sector banks. In particular, we find no evidence that state-owned banks increase their lending in
comparison to other bank categories before, during, or after elections. This is an interesting finding,
and stands in contrast to earlier research that has used cross-country or country-specific data
which points out that state-owned banks behave differently during election years. Furthermore,
our regression results also show that election cycles do not lead to a differential impact on other
key financial ratios across banks. The second set of results, in line with earlier research, indicate
that state-owned banks are less efficient in comparison to both domestic and foreign-owned private
sector banks.
The rest of this paper is organized as follows. In the next section we describe parliamentary
elections in Turkey followed by a short summary of developments in the Turkish banking sector.
Section 3 presents the data. Section 4 lays out the econometric model and estimation results.
Finally, Section 5 concludes.
2. Parliamentary elections and banking in Turkey
Prior to discussing the empirical model and results, it is useful to provide some information
about the parliamentary system and the banking system in Turkey. In the next two subsections,
we first discuss parliamentary elections in Turkey and then describe the banking sector.
2.1. Parliamentary elections in Turkey
The Turkish Republic is a secular, democratic and pluralistic parliamentary system. The
unicameral Grand National Assembly is elected by popular vote and the country is governed by
the Council of Ministers headed by the Prime Minister. Members of the Grand National Assembly
are elected for a certain period of time, and may be reelected.
Over the period of our investigation, 11 national parliamentary elections took place in Turkey,
in the years 1965, 1969, 1973, 1977, 1983, 1987, 1991, 1995, 1999, 2002 and 2007. The period
under investigation is generally characterized by the implementation of two distinct economic
policies before and after the military coup of 1980. In particular, the pre-1980 period is considered
as a period of a planned economy, and the post-1980 period represents a transition towards a
free-market economy. There is also an important distinction between the election system before
and after the 1980 coup. During the pre-1980 period the electoral system was based on the d’Hont
5
scheme without any regional or national threshold levels. Hence it was extremely difficult for a
single party to construct a government. In this electoral system, members from any of the parties
that took part in the election could gain a seat in the parliament. For example, in the elections
of 1965 and 1969, all six parties that participated in the elections were able to gain seats in the
Parliament.3 Consequently, the country enjoyed single party governments only in the 1960s. In
the 1970s, nine of the eleven established governments were coalitions. Only towards the end of
the 1970s do we again see single-party governments. The last government of that era, which was
a right-wing cabinet, was swept aside by the military coup of 1980.
The military intervention in 1980 was in response to an unstable political situation that the
cabinet and the Grand National Assembly seemed powerless to remedy. The military leaders
declared their intention to restore public order and to prepare the country for a transition to a
functioning democratic system which would avoid the impasses experienced in prior years. The
next parliamentary elections took place in 1983, prior to which all pre-1980 parties were abolished.
Only three parties were allowed to take part in this election and a two-party system was envisioned:
a governing party, an opposition party and a third party which would participate in the election
but not be able to enter the parliament. During the campaign, the pre-1980 leaders were deprived
of their political rights and some of the newly-formed parties were denied access to the ballot.
When civilian control was restored with the 1983 elections, the pre-1980 parties and several others
emerged as the artificial parties established under military rule dissolved into oblivion. In fact
37 new parties were established in the 1983–2007 period and members of 11 parties found a seat
in parliament. At least three of these parties are considered as major right-wing parties while
one or two are considered main left-wing parties. The remaining parties basically fill the rest
of the spectrum from far left to far right. During this period, Turkey experienced single-party
governments following the 1983, 1987 and 2002 and 2007 elections, all of which were established
by right-wing parties. As a result of the 1991, 1995 and 1999 elections, two- or three-party coalitions
emerged, encompassing both left- and right-wing parties.
3Following the 1980 coup, a change in the election rules introduced a national threshold of 10% to avoid frac-tionalization of the parliament and encourage single-party governments.
6
Prior to the 1983 elections, members of the National Assembly were elected for a four-year
term through universal suffrage. Since that time, members are elected for a five-year term, but
Parliament may determine the timing of elections. Over the period of our study, parliamentary
elections took place every four years except for the last two terms. Unlike a number of other
parliamentary democracies, by-elections in the Turkish system are not common as the criteria to
hold a by-election are quite restrictive. To call for by-elections, at least 5% (or 28) of the 550 seats
of the National Assembly must be empty. Furthermore, by-elections cannot take place in the two
years following a parliamentary election, or within the year before a general election.4
2.2. The banking sector in Turkey
The financial sector in Turkey is traditionally dominated by banking activities. The Central
Bank of the Republic of Turkey (TCMB), founded in the early 1930s, regulates and supervises
the banking system while carrying out other responsibilities such as the issuance of banknotes and
protecting the value of the currency. The Central Bank also finances the government’s budget
deficits and makes loans to public and private banks.
Banking activities have been carried out both by state-owned banks and private-sector banks
since the early years of the republic. Most of the private-sector banks are locally owned. Some
are foreign-owned, while a few are jointly owned by domestic and foreign banks. The number of
state-owned banks declined following the financial liberalization programme of the 1980s. To avoid
speculative motivations, banks operating in Turkey are not allowed to engage in trading of goods
or real estate for commercial purposes.
The major domestically owned private banks are closely linked to industrial groups. For in-
stance, Yapı ve Kredi Bankası is owned by the Cukurova Group conglomerate, while Akbank is
owned by the Sabancı Group, one of the largest conglomerates. Partially publicly traded Kocbank
is owned by another powerful group, Koc Holding Company.5 The number of foreign-owned pri-
vate sector banks increased substantially after the country went through a programme of financial
liberalization in the early 1980s. Currently, banks from various countries including the US, UK,
4See Turan (2003) on political developments and Taymaz and Yılmaz (2008) on macroeconomic policies andperformance, including the references therein.
5Yapı ve Kredi Bankası and Kocbank merged in 2008.
7
Netherlands, Germany, and Greece operate in Turkey. Also, during the post-1980 period, several
joint ventures were created, and two Islamic banks started trading in the financial markets. As
foreign banks increased their share in Turkish financial markets, they brought in new concepts
and financial practices and help raise the country’s banking standards. Overall, the entrance of
foreign banks into the Turkish banking system is perceived by bankers and investors throughout
the world as a reflection of the progressive internationalization of Turkey’s financial system.
When we investigate the state of the financial markets throughout the period of interest, we
see that capital markets were highly underdeveloped in the 1960s and 1970s. During those decades
state-owned banks were dominant in the system, playing an important role by lending to the gov-
ernment and state-owned enterprises. The market was heavily regulated in terms of new entry,
interest rates, and exchange rates. International capital movements and foreign exchange oper-
ations were also controlled with a very heavy hand. After the implementation of the financial
liberalization and restructuring programme in the 1980s, financial markets began to thrive. Al-
though the state-owned banks continued to have a dominant role in the system while creating
unfair competition for deposits and threatening the banking system in the 1990s, their numbers
declined steadily after 1987 and stabilized at six by 2000. Their share of total assets in the banking
sector has declined fairly steadily since 1992.
In the post-1980 period, fierce competition among banks led to closure of some banks while the
total number of banks increased. Interest rates and exchange rates were freed and new banking
and capital market laws were introduced. All restrictions on foreign exchange trading and capital
movement were removed as well as that on market entry. Turkish citizens were allowed to hold
foreign currency and open foreign exchange deposits in banks. During this period, the Ozal
administration took steps to revive Istanbul’s stock market, which had closed down in the late
1970s. The Istanbul Stock Exchange (ISE) reopened in December 1985. Trading on the ISE
expanded rapidly in the early 1990s and it became one of the best performing emerging markets
among its peers. Foreign exchange operations and international capital movements were liberated
and the Turkish lira became fully convertible in 1989. A year later the exchange rate was allowed
to be freely determined by market forces. The restructuring of the Turkish economy in the 1980s
8
led to legislative changes and strengthened the Central Bank’s role in supervising the markets.
Nevertheless, we observe the emergence and collapse of many brokerage houses in 1982 due to fierce
competition and weak regulatory enforcement. Yet, with financial liberalization, capital inflows
began to rise continuously, and the financial system became increasingly linked with external
markets.6
Over the period of investigation Turkey experienced two major banking crises, in 1994 and
in 2000. These bank crises did not occur due to the absence of regulation but due to weak
implementation of these rules. An important step in supervision of the financial markets was
taken in 1985 by assigning supervisory responsibility over the banking sector to the Treasury
(Banks Act No. 3182) while the Central Bank was also incorporated in this process. This Act
was passed in response to the bank and brokerage house failures of 1982 following the financial
liberalization measures of 1980. However, as financial crises emerged in 1994, the Treasury was
not able to take over failing banks. The process required the approval of the State Minister for
Economic Affairs, whose decisions were politically motivated. Another problem is that banking
regulation was a secondary concern for the Treasury as it must deal with day-to-day financial
matters of the government and the economy. For a regulatory body, having such dual concerns
constitutes an important distortion in the regulatory system. As under-capitalized banks financed
government debt by raising cheap finance from international markets, the Treasury as a regulatory
body faced a conflict of interest in supervising these banks.
Given the state of the financial markets, it would have been beneficial to have an independent
regulatory agency as early as 1980. However, its realization required a significant crisis and the
involvement of the IMF. Following the 1994 economic crises and the 1997 Asian crisis, the Bank
Act No. 4389 led to the establishment of the Banking Regulation and Supervision Agency (BRSA)
in 1999. Several amendments were required to close various loopholes in this new regulatory
structure. For instance, Act No. 4491 gave the BRSA the right to issue new banking permits,
removing it from the the domain of the Council of Ministers. The BRSA had a clear objective
6For more detail on the Turkish banking system, see Denizer (2000), Mercan et al. (2003), Alper and Onis (2004),and Matousek et al. (2008).
9
to rehabilitate and improve the performance of the banking system. Initially the agency was not
immune to political pressures, but during and after the crisis of 2000–2001, its autonomy increased
as it dealt with the problems of both private banks and state-owned banks. During the 2000–2001
financial crisis, several banks went into administration under the control of the Savings Deposit
Insurance Fund (SDIF), which was established by Act No. 4491 as the legal entity to take over and
restructure failing banks. In 2003 corporate governance rules are defined and further strengthened
in 2005 by the Capital Markets Board of Turkey. In 2006, the BRSA announced new regulations on
corporate governance principles. As importantly, a limited deposit insurance system was adopted
in 2004 to replace the full coverage extended to all financial institutions following the 1994 crisis.7
The restructuring of the banking system cost the Turkish economy around one third of 2001
GDP or $53 billion, including $19 billion in compensation for losses on credits given to small
businesses and farmers and $22.5 billion for the bailout of banks which were transferred to the
SDIF. In 2003, a coordination committee was established to ensure the implementation of Basel
II standards, and as of 2010, the banks’ capital adequacy ratio exceeds the required level. The
banking sector in Turkey has been strengthened considerably. Currently, it stands as one of the
rare examples of financial sectors able to withstand the 2007–2009 global financial crisis without
any bank failures.
3. Data description
Our dataset contains detailed information on all Turkish banks’ balance sheets as published
on the Banks Association of Turkey website.8 The original data set has 2,242 observations from
1963 to 2007. We exclude non-state-owned investment banks and banks which have gone into
administration.9 We also drop banks with fewer than five years of available data as they are either
newly-chartered banks or banks that have been liquidated. In order to alleviate the influence of
extreme observations, bank-level variables are denoted as missing at the most extreme (top and
7See Canevi and Cetinkaya (2001), Steinherr et al. (2004), Kibritcioglu (2005), and Yildirim (2008) for furtherinformation on banking in Turkey, bank regulation and its political background.
8As of January 2010, available at http://www.tbb.org.tr/english/9State-owned investment banks are included in our analysis (while private and foreign investment banks are
excluded) as the state-owned investment banks’ lending activities may be fungible with those of their deposit-taking counterparts.
10
bottom) one percent level of the distribution on an annual basis. After all screening, our sample
size consists of 2,158 bank-year observations pertaining to 86 banks. Table 1 presents the number
of banks by type over the sample period, as well as the share of assets in the banking sector
represented by each type of bank. Our dataset also contains indicator variables indicating the
type of bank (private, state-owned or foreign-owned), recession years, and parliamentary election
years.
Tables 2 and 3 summarize the variables that we examine in our analysis. Table 2 gives the
definitions of variables as well as the basic descriptive statistics for the entire sample. Most banks
are domestic private sector commercial banks. Foreign banks constitute 23.4 percent of the sample,
and state-owned banks represent 21.7 percent of bank-years. We specifically examine some of the
banks’ financial ratios including loan-to-asset, deposit-to-asset and securities-to-asset ratios. We
also investigate the growth rates of loans, deposits and government securities as well as bank
performance measures such as interest expenditures, interest revenues and the interest margin.
Descriptive statistics show that banks earn 3.8 percent interest margin (Margint) and lend 28.8
percent of assets (Loant/TAt) over the entire sample. Furthermore, we observe that banks enjoy
positive growth rates (in real terms) of deposits (DepositGrowtht), loans (LoanGrowtht) and
government securities holdings (BondGrowtht).
Table 3 presents the basic descriptive statistics of our variables to give a flavor of the evolution
of our variables over different stages of the election cycle. The table is composed of four panels to
provide information on the variables over four different periods in an election cycle. These periods
are the year before the election, the election year, the year after the election, and the year that
is non-adjacent to those three years (the most remote year from the election), which we call the
benchmark year. Turkish banks exhibit a higher mean share of government securities to assets
(4.3 percent) in non-adjacent (benchmark) years. The average deposit-to-asset ratio is highest in
the benchmark years as well: 46.5 percent. Interestingly, Turkish banks decrease their loan growth
rate in pre-election years (−1.2 percent). Similarly, in line with the growth rate of loans, banks’
loan-to-asset ratios are lowest in pre-election years. The behavior of loan dynamics over election
cycles could be explained by more cautious lending behavior in pre-election years. Also, compared
11
with the election periods, the growth of government securities holdings in pre-election years is
significantly higher, as the government, in need of funds to finance pre-election activities, issues
attractive securities. To sum up, there is casual evidence that election cycles may have an impact
on banks’ behavior.
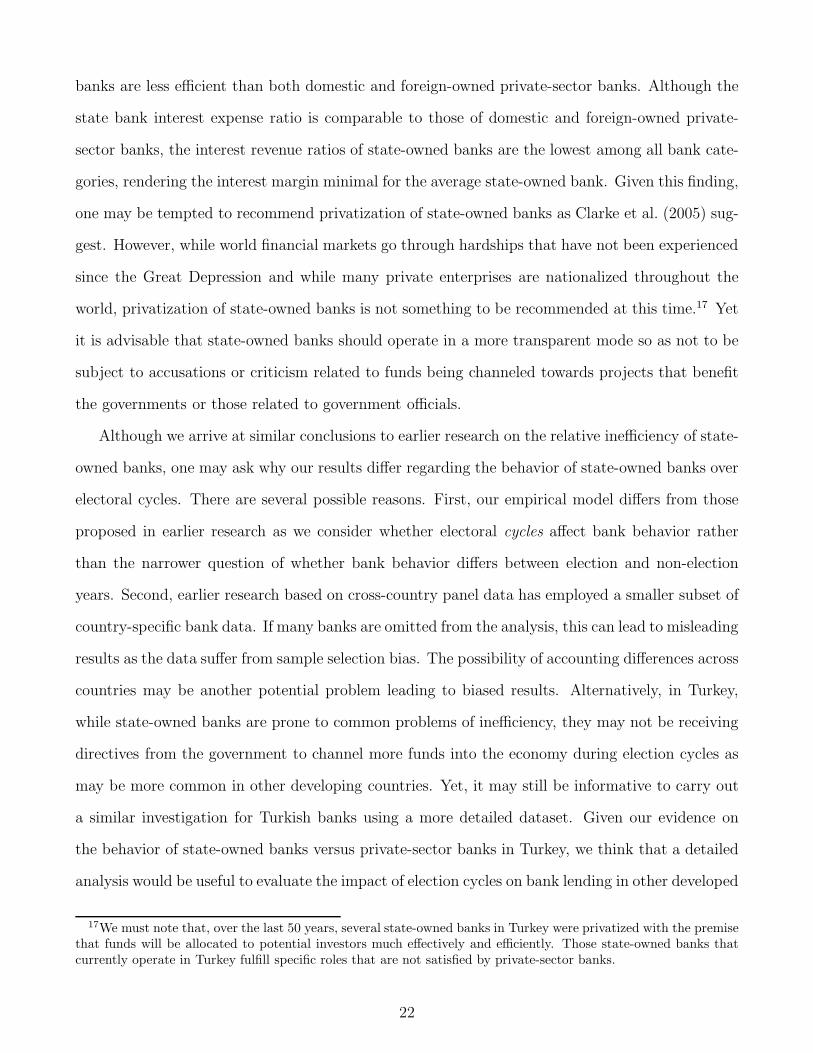
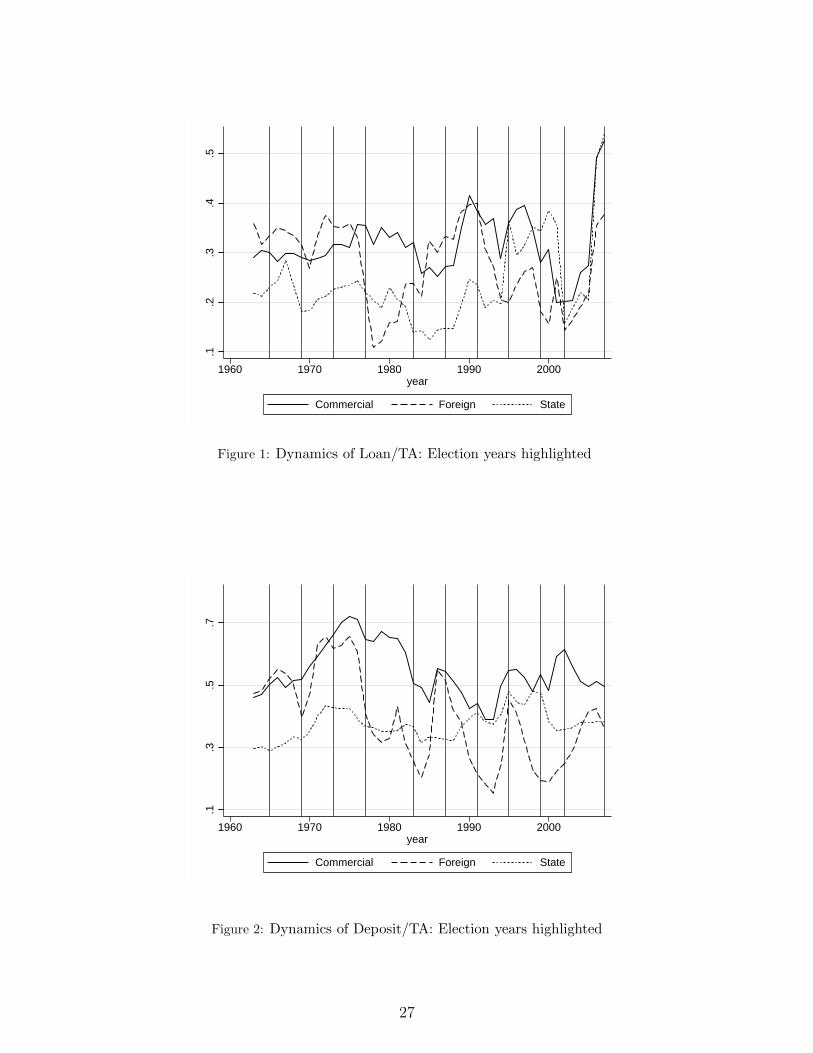
We next present a visual inspection of the evolution of some of these variables across bank
types, as our aim is to understand the behavior of different bank types over election cycles. In
Figure 1 we plot the average loan-to-asset ratio for three types of banks: domestic commercial,
foreign-owned, and state-owned, with election years highlighted. From 1963–1994, we find that
state-owned banks had the lowest lending share with respect to their total assets. However, as of
1988 the loan-to-asset ratio of state-owned banks starts to increase: after 1998, to around 0.38.
Since then, on average, state-owned banks’ loan-to-asset ratios have been higher than those of other
bank types in most years. This is understandable as state-owned banks played an important role
in the development of various industries and small businesses starting with the implementation of
financial restructuring in the 1990s. The 1980–1990 period was also characterized by an increase
in the number of foreign banks with a presence in the Turkish banking sector (see also Table
1). As we can see from Figure 1, bank loans dropped significantly during the financial crisis and
recession of 2001, after which credit volume increased substantially. This significant increase in
lending is due to a move towards consumer banking, increases in consumer credit and credit cards
and a reduction in the amount of government securities held. In particular, government securities
lost their appeal, as the government’s public-sector restructuring programme in late 1999 led to a
fall in double-digit inflation and interest rates when monetary growth was strictly limited to net
domestic assets of the central bank (see Akcay (2001)).
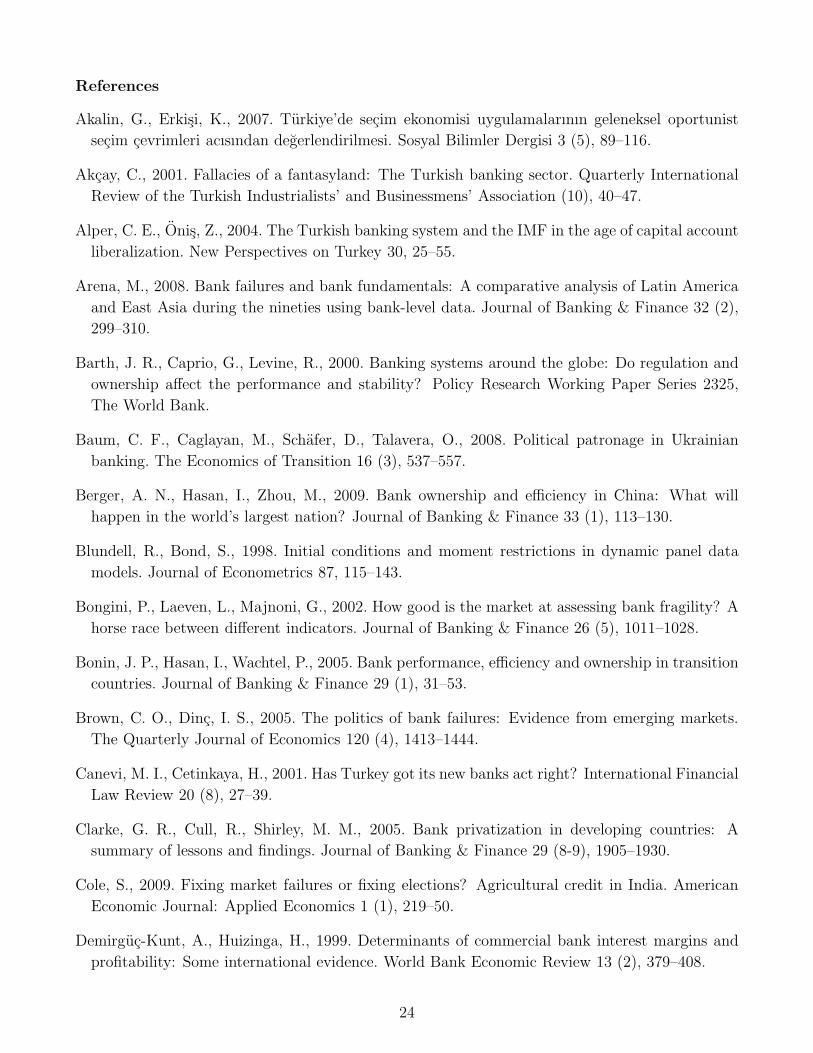
Figure 2 plots the evolution of average deposit-to-asset ratios for each type of bank. We see
that domestic commercial banks have a higher average deposit ratio compared to their state-
owned and foreign-owned counterparts. This is mainly due to the fact that domestic commercial
banks have extended their branches throughout the country and they offer several services that
are competitive with state-owned banks’ offerings.10 In contrast, foreign-owned banks’ presence is
10State-owned banks also have a wide presence throughout the country.
12
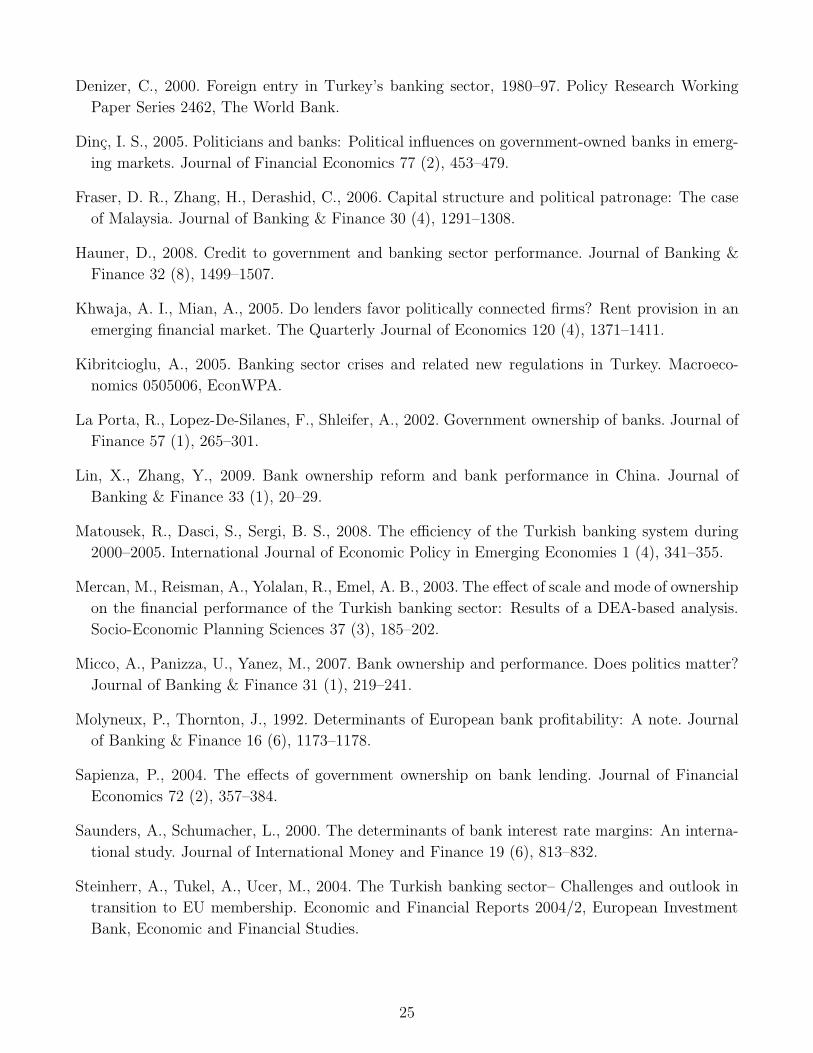
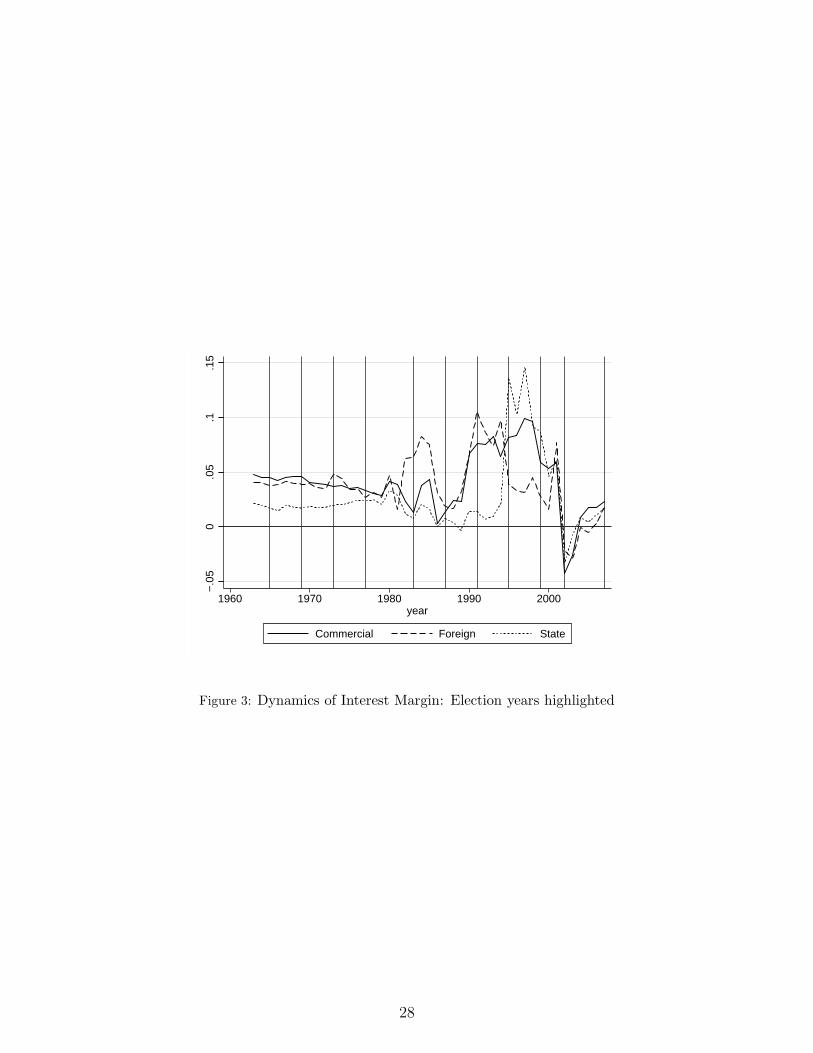
confined to the largest cities, with a much lower emphasis on retail banking. Figure 3 depicts the
behavior of the average interest margin for all banks. Notice that there is almost no difference in
the interest margin between domestic commercial and foreign-owned banks in the 1960s and 1970s,
during which this measure was very low at times for all banks. This is not surprising as prior to
1980 banks’ activity in financial markets was very limited. There was little competition between
banks as interest rates were controlled by the government. Furthermore, the 1973–74 oil crises had
quite negative effects in Turkey. With the implementation of a financial reform programme in the
1980s, competition amongst banks became more common. Given their expertise and knowledge
in financial markets, foreign-owned banks were able to improve their interest margin substantially,
while their competing domestic counterparts followed suit. As expected, state banks’ performance
trailed that of private-sector banks until the mid-1990s.11 By then, state banks’ interest margin
caught up with foreign and domestic banks during a period of consolidation through mergers and
increasing efficiency in the private sector.
While providing interesting insights, the descriptive analysis of these figures and the statistics
presented in Tables 2–3 alone cannot provide a full account of Turkish banks’ behavior over election
cycles, as they do not control for several confounding factors. Hence, we subject the data to a
rigorous empirical investigation to understand how different bank types’ behavior may have differed
over election cycles. In the next section, we describe the econometric strategy that we employ to
investigate the effects of election cycles on state-owned versus private-sector bank behavior.
4. Empirical model and results
As we document in the previous section, Turkish banks’ financial ratios and their growth
rates appear to vary around the dates of parliamentary elections. Graphs of some of these ratios
also give the impression of the presence of differences across bank types. Some of the cyclical
movements visible in Figures 2 and 3 could be due to electoral cycles. To quantify the presence
of differences between bank types and to determine whether election cycles have an impact on
11These observations, which prompted many researchers to advocate privatization programmes, are in line withthe findings of Bonin et al. (2005). In particular, they show that state-owned banks substantially underperformprivate-sector bank performance.
13
bank behavior across bank types, we use a variant of a dynamic empirical specification proposed
by earlier researchers. The main difference in our approach is the introduction of a set of election
timing dummies to capture the dynamics of bank behavior over election cycles, rather than merely
focusing on election years. We also interact the election timing dummies with bank type to observe
potential differences across bank types. Our model takes the following form:
Yit = α0 + α1Yi,t−1 + ζ1Stateit + ζ2Foreignit +
Etβ + StateitEtξ1 + ForeignitEtξ2 + Zitγ + λEt + νi + εit
where i and t denote bank and time indices, respectively and β, ξ1 and ξ2 are vectors of coefficients
on the election timing indicators and their interactions with bank type. The dependent variables
in our investigation, Yit, include a set of bank finance ratios, the growth rates of several variables
and bank performance measures. These include the loan-to-asset (Loanit/TAit), deposit-to-asset
(Depositit/TAit) and securities-to-asset (Bondit/TAit) ratios to model the changes in the asset and
the liability sides of the banks’ balance sheet. We also scrutinize loan growth rates (LoanGrowthit)
as well as deposit and securities growth rates (DepositGrowthit, and BondGrowthit, respectively).
Finally, we investigate several performance measures including the interest margin (Marginit),
interest revenues (IntRevenueit) and interest expense (IntExpenseit). To allow for persistence in
the behavior of the dependent variable, reflecting continuity in banks’ financial policies, we include
the lagged dependent variable, Yi,t−1 in our regression model. We control for the effects of other
factors, including a vector of bank-level and country-level variables (denoted by Z), as described
below. Stateit (Foreignit) is an indicator variable which equals one if the bank is state- (foreign-)
owned at time t and zero otherwise. Bank fixed effects are captured by νi, and εit denotes the
error term.
The key variables of interest are a set of election timing dummies, denoted as E, which include
three indicator variables: Electiont, Electiont−1, and Electiont+1. The first dummy variable is
equal to one if parliamentary elections took place at time t and zero otherwise. Similarly, years
before the elections and after the elections are captured by Electiont−1 and Electiont+1 dummies,
respectively. The coefficients of these variables allow us to compare the effects of election cycles on
the dependent variables of interest. The interactions of these variables with Stateit and Foreignit
14
allow us to test whether election cycles’ effects are related to the bank types, as reflected in the
magnitudes and significance of the ξ1 and ξ2 coefficients.
The elements of vector Z control for bank-specific and macroeconomic characteristics that
influence banks’ policies. The choice of our control variables is motivated by earlier research which
investigate bank lending and performance in time series or panel data settings.12 To control for
economies of scale, we include the natural log of real total assets (log(TAit)). The financial strength
of a bank is measured by its net worth normalized by total assets (Equityit/TAt). In addition,
we introduce two variables to control for macroeconomic factors that may affect bank behavior:
recession and coup dummies, Recessiont and Coupt, respectively.13
Although our specification takes into account some of the macroeconomic factors that might
affect banks’ performance, there may be other important influences. Dealing with these poses two
challenges. First, consistent series of macroeconomic aggregates are not available in the earlier
years of our sample period. Second, even if appropriate data were readily available, any set of
macroeconomic factors could be argued to be incomplete, thus imperfectly addressing issues of
omitted-variables bias. Given the nature of our specification, we cannot adopt the usual remedy of
fixed time effects, as the election-timing dummies in E and macro dummies in Z would be collinear
with time effects. Therefore, in order to capture the importance of time-varying macroeconomic
effects, we introduce a set of election cycle dummies, λEt . These indicators are defined for each
of the eleven election cycles, including the two years after each election year.14 The specification
contains ten of these indicators. In the empirical results, an F -test for the null hypothesis that
their coefficients are jointly zero is presented. We always reject that null, suggesting that there are
significant macro factors (over and above those in Z) captured by election cycle dummies.
We estimate the model with the one-step system dynamic panel data (DPD) estimator. System
DPD combines equations in differences of the variables with equations in levels of the variables. In
12See, for instance, Demirguc-Kunt and Huizinga (1999), Saunders and Schumacher (2000) or Arena (2008).13Throughout the sample period, Turkey experienced recessions in 1979, 1980, 1994, 1999, and 2001, while a
military coup took place in 1980–1982. Thanks to remittances from Turkish “guest workers” (gastarbeiters) inGermany and other European countries, the Turkish economy did not experience a downturn in the 1960s or early1970s.
14Given the irregular timing of elections, it is not always possible to include two years following the election year.
15
this system GMM approach (see Blundell and Bond (1998)), lagged levels are used as instruments
for differenced equations and lagged differences are used as instruments for level equations. The
models are estimated using a first difference transformation to remove the individual firm effect.
The set of instruments includes from second to fourth lags of levels of bank-specific variables for
difference equations, and second lags of differences of bank-specific variables for level equations.
Macroeconomic characteristics are treated as exogenous.
The reliability of our econometric methodology depends crucially on the validity of the instru-
ments, which can be evaluated with Sargan’s test of overidentifying restrictions, asymptotically
distributed as χ2 in the number of restrictions. A rejection of the null hypothesis that instruments
are orthogonal to errors would indicate that the estimates are not consistent. We also present test
statistics for first-order and second-order serial correlation in the error process. In a dynamic panel
data context, we expect first-order serial correlation, but should not be able to detect second-order
serial correlation if the instruments are appropriately uncorrelated with the errors.
4.1. Empirical findings
We present our results in three sets of tables. Our first set of results considers the effects of
elections on bank financial variables. The second table depicts our results on how growth rates of
bank loans, deposits and securities holdings evolve through election cycles. The last set of results
concentrate on the relationship between election cycles and bank performance. Our main focus,
throughout the discussion, will be on the sign, size and significance of the coefficients associated
with the election dummies and their interactions with bank type dummies. For all models discussed
in the following subsection, the Hansen statistic for overidentifying restrictions and the Arellano–
Bond AR(2) tests shows that, at the 5% significance level, our instruments are appropriately
orthogonal to the error and no second order serial correlation is detected, respectively. Hence, we
do not make additional comments on those aspects of the estimates.
4.1.1. Bank financial ratios
Table 4 evaluates the impact of the election cycle on the loan-to-asset, deposit-to-asset and
securities-to-assets ratio. The first column gives the regression results for the loan-to-asset ratio.
In this column we see that the State dummy is negative and significant. This indicates that
16
state-owned banks have lower loan-to-asset ratios. The election dummies are negative and more
so during the year before the election than in the election year. One year after the election, the
election dummy is also negative, and the magnitude of its effect is about two-thirds of that of the
pre-election period. This implies that banks reduce their loan-to-asset ratios during and around the
election year which may be due to a perception of an increased risk to lending. When we consider
whether banks’ behavior over the election cycle differ from one another, we find no difference in
the behavior of loan-to-asset ratios across bank types over the cycle. During the post-election year,
foreign-owned and state-owned banks’ ratios increase slightly in comparison to those of domestic
private-sector banks, which can be explained by the desire to expand operations after the elections.
However, neither the size nor the significance level of the relevant coefficients imply a significant
divergence across bank types.
The lack of differences in the loan-to-asset ratio across bank types over the election cycle is
an interesting finding due to the fact that the banking literature generally has claimed that state-
owned bank loans grow more than those of other bank types, suggesting the existence of politically
motivated lending. Although our results consider the level of the loan-to-asset ratio rather than its
growth, we find that state-owned banks’ ratios do not differ from those of domestic commercial or
foreign-owned banks. This is an interesting observation to which we return when we investigate the
behavior of loan growth over the election cycle. Finally, the coefficient of the Recession dummy
is negative as one would expect, signaling that during downturns bank loans decline.
The next column presents results for the deposit-to-asset ratio. We find that foreign-owned
banks’ ratios are lower than those of state-owned banks and domestic private-sector banks. While
banks’ deposit-to-asset ratios do not change in the election year, in the year thereafter, the deposit-
to-asset ratio more than doubles in comparison to the pre-election year value. Although we do
not have the detailed balance sheet data to further our claim, it seems that the public put their
savings in other instruments such as foreign currencies or gold, both of which are traditional savings
instruments in Turkey, in the election year. This claim can be rationalized by savers’ desire to lessen
the impact of potential economic volatility due to uncertainties about the elected governments’
economic programme. Considering the impact of election cycles on the deposit-to-asset ratio, the
17
ratio decreases for state-owned and foreign-owned banks in comparison to private banks in the
post-election year. Finally, the coefficient of the Recession dummy is positive signalling that the
public deposit their savings in safe havens during recessions.
The last column considers the behavior of the securities-to-asset ratio over the election cycle.
During the pre-election year banks seem to increase their government bond holdings, but we find
no difference between domestic private-sector and state banks over any point in the election cycle.
We also find that state-owned (foreign-owned) banks hold fewer (more) government securities in
comparison to domestic banks. Finally, we see that banks reduced their bond-to-asset ratio during
the coup years, when banks were first allowed to broaden their asset holdings during financial
liberalization, and increased it during the recessionary episodes per expectations.
4.1.2. Growth in loans, deposits and bond holdings
We next investigate how the growth rates of loans, deposits and bond holdings evolve around the
parliamentary election years. The literature concentrates on loan growth regressions to compare
the differences in lending behavior of state-owned versus private-sector banks across election and
non-election years.15 The first column of Table 5 shows that loan growth is significantly lower for
state-owned banks. We do not detect any differences in loan growth rates between private-sector
domestic and foreign-owned banks. Yet, observing the election dummies for the year before the
election, we see that the loan growth rate declines substantially for all banks. This decline is
further observed for foreign-owned banks during the election year. However, state-owned banks
and domestic private sector banks do not alter their loan growth rate over the election cycles.
In particular, state-owned banks do not systematically increase their lending during elections in
comparison to other banks in the financial system. This result is in sharp contrast to that of Dinc
(2005) who shows that state-owned banks increase their loans during election years and claim that
political motivations influence this behavior.
Given that Dinc’s results are based on cross-country panel regressions, it is possible that some
influential outliers or the presence of accounting differences in reporting across countries may have
15Section 1.1 provides an overview of the inefficiencies that both developing and emerging countries face due topolitical pressures. More specifically see Micco et al. (2007), Cole (2009), and Dinc (2005) who discuss how banks’lending behavior during election periods may bend to political will.
18
played a role in his findings. It is also possible that his results are driven by the choice of banks
included in the regressions.16 Equally, the time period during which he studied the phenomena
may have an impact on his findings. In our case, by concentrating on a single country, we can
clearly observe that Turkish state-owned banks do not change their lending behavior vis-a-vis that
of private-sector banks. As expected we find that during recessionary episodes loan growth was
reduced and during the period of military rule it increased substantially as discussed above.
Column two of the same table provides regression results for the deposit growth rate. Deposit
growth rates are higher in the election year and the following year compared to the benchmark
year. However, we do not find any differences in the deposit growth rate across different bank
types over election cycles.
The third column of Table 5 depicts our findings for the securities growth rate. As in the case
of deposit growth rates, we find no difference across bank types in this growth rate. During the
election years all banks seem to decrease their holdings of government bonds. However, while state
banks’ growth rates are significantly higher than the other two bank categories in the election year,
the bond growth rate of foreign-owned banks declines significantly in the pre-election year. Their
reduction of growth of government bond holdings during the pre-election period can be rationalized
by those banks’ desire to reduce exposure to risky government debt.
4.1.3. Bank performance indicators
Table 6 presents the effects of elections on interest rate margin and its two components: the
interest revenue and interest expense ratios. The first column of the table presents our results
for the interest margin. We can observe that the coefficient associated with state-owned banks
is significantly negative. This implies that the state-owned banks’ interest rate margin is the
lowest. In fact the literature has pointed out the inefficiencies of state banks and recommended
their privatization. We also find that in all three (pre-election, election and post-election) years,
banks’ interest margin declines relative to the benchmark year. However, we do not see significant
differences across different election stages; although all coefficients on the election dummies are
16Although the panel data Dinc uses includes a large number of countries, it does not necessarily cover all banksthat play an important role in each country.
19

negative and statistically significant, they do not differ significantly from one another. Likewise,
we do not detect significant differences across bank types over election cycles.
Column two of the table presents the behavior of the interest revenue-to-asset ratio. As in the
case of interest margin, state-owned banks’ interest revenue ratios are significantly lower than those
of domestic private-sector or foreign-owned banks. In the year of the election, interest revenues
fall for all banks, increasing in the post-election year. We also find some slight differences across
bank categories in banks’ interest revenues over election cycles. For instance, foreign banks have
lower interest revenues in the pre-election year, which might be explained by a decrease in lending
activities. Finally, column three depicts the impact of election cycles on banks’ interest expense-
to-asset ratios. We find that state-owned and domestic banks’ ratios are indistinguishable from
each other, whereas foreign-owned banks have much lower ratios, perhaps reflecting their broader
access to funding. Given this finding, it is evident that the state banks’ interest margin is lowest
among all bank types due to the fact that their interest revenues are very low. It is likely to be
the case that state banks are allowed to lend at a loss to potential borrowers. When we consider
differences across banks over election cycles, we see that state- and foreign-owned banks’ interest
expense ratios are lower than those of domestic private banks during the post-election year.
For the interest revenue and interest expense regressions, we observe that the coefficient of the
Recession dummy is positive and that of the Coup dummy is negative. These results are intuitive
and we do not elaborate further.
4.2. Robustness checks
We extend our analysis by examining whether our key results are robust to changes in instru-
ment set and sub-periods. As explained in Section 3, our set of instruments includes the second
and third lags of levels of bank-specific variables (including ownership) for difference equations,
and the second and fourth lags of differences of bank-specific variables for level equations. We
also experimented with instrument sets which include up to six lags of bank-dependent variables
in both level and difference equations, but this did not affect our main results.
Furthermore, we check the consistency of our results by concentrating on the 1980–2007 period.
These 27 years include the 1980–1982 coup period, during which the military was in control of the
20
country, as well as a substantial increase in the number of foreign banks and the financial crisis of
2000. Our results (available upon request) for this period are similar to those reported in Tables
4, 5 and 6 are not reported for the sake of brevity.
5. Conclusions
The recent literature has investigated state-owned versus private-sector banks’ lending activities
to scrutinize the impact of elections on banks’ behavior. This paper extends the question and
asks if bank behavior changes meaningfully over the full election cycle, rather than focusing on
election versus non-election years. If so, is there a difference between state-owned versus private-
sector (domestically or foreign owned) banks’ reactions to election cycles? In our investigation
we specifically concentrate on several bank financial ratios and performance measures. To carry
out our analysis, we utilize a bank panel data collected from Turkey over 1963–2007 including all
banks in the financial sector.
The key variables of interest are a set of election timing dummies, which capture the effects of
the election year and pre- and post-election years on bank behavior. Inspecting the coefficients of
election dummies as well as the interaction between election and bank type dummies, we investigate
the impact of election cycles on banks and test for differences across different type of banks. A
simple model captures the effects of election cycles on banks’ loan, deposit and bond-to-asset ratios,
the growth rates of these variables, and the changes in bank performance indicators in relation to
election cycles.
Our results can be summarized as follows. We observe that Turkish election cycles significantly
affect bank behavior. However, we do not find conclusive evidence that bank behavior differs
across bank types as claimed in earlier research. In particular, we find no evidence that Turkish
state-owned banks change their lending activities in comparison to other bank categories before,
during or after elections. This is an interesting result on its own as several country-specific studies
have found that state-owned banks behave differently during elections. Furthermore, we detect no
effect of election cycles on deposit-to-asset and bond-to-asset ratios or their growth rates across
banks.
The second set of results that we gather from our study points out that Turkish state-owned
21
banks are less efficient than both domestic and foreign-owned private-sector banks. Although the
state bank interest expense ratio is comparable to those of domestic and foreign-owned private-
sector banks, the interest revenue ratios of state-owned banks are the lowest among all bank cate-
gories, rendering the interest margin minimal for the average state-owned bank. Given this finding,
one may be tempted to recommend privatization of state-owned banks as Clarke et al. (2005) sug-
gest. However, while world financial markets go through hardships that have not been experienced
since the Great Depression and while many private enterprises are nationalized throughout the
world, privatization of state-owned banks is not something to be recommended at this time.17 Yet
it is advisable that state-owned banks should operate in a more transparent mode so as not to be
subject to accusations or criticism related to funds being channeled towards projects that benefit
the governments or those related to government officials.
Although we arrive at similar conclusions to earlier research on the relative inefficiency of state-
owned banks, one may ask why our results differ regarding the behavior of state-owned banks over
electoral cycles. There are several possible reasons. First, our empirical model differs from those
proposed in earlier research as we consider whether electoral cycles affect bank behavior rather
than the narrower question of whether bank behavior differs between election and non-election
years. Second, earlier research based on cross-country panel data has employed a smaller subset of
country-specific bank data. If many banks are omitted from the analysis, this can lead to misleading
results as the data suffer from sample selection bias. The possibility of accounting differences across
countries may be another potential problem leading to biased results. Alternatively, in Turkey,
while state-owned banks are prone to common problems of inefficiency, they may not be receiving
directives from the government to channel more funds into the economy during election cycles as
may be more common in other developing countries. Yet, it may still be informative to carry out
a similar investigation for Turkish banks using a more detailed dataset. Given our evidence on
the behavior of state-owned banks versus private-sector banks in Turkey, we think that a detailed
analysis would be useful to evaluate the impact of election cycles on bank lending in other developed
17We must note that, over the last 50 years, several state-owned banks in Turkey were privatized with the premisethat funds will be allocated to potential investors much effectively and efficiently. Those state-owned banks thatcurrently operate in Turkey fulfill specific roles that are not satisfied by private-sector banks.
22

or developing economies.
Acknowledgements
We thank Kamil Yılmaz for sharing his work on Turkish macroeconomic policies and Olena
Talavera for excellent research assistance. The standard disclaimer applies.
23
References
Akalin, G., Erkisi, K., 2007. Turkiye’de secim ekonomisi uygulamalarının geleneksel oportunist
secim cevrimleri acısından degerlendirilmesi. Sosyal Bilimler Dergisi 3 (5), 89–116.
Akcay, C., 2001. Fallacies of a fantasyland: The Turkish banking sector. Quarterly International
Review of the Turkish Industrialists’ and Businessmens’ Association (10), 40–47.
Alper, C. E., Onis, Z., 2004. The Turkish banking system and the IMF in the age of capital account
liberalization. New Perspectives on Turkey 30, 25–55.
Arena, M., 2008. Bank failures and bank fundamentals: A comparative analysis of Latin America
and East Asia during the nineties using bank-level data. Journal of Banking & Finance 32 (2),
299–310.
Barth, J. R., Caprio, G., Levine, R., 2000. Banking systems around the globe: Do regulation and
ownership affect the performance and stability? Policy Research Working Paper Series 2325,
The World Bank.
Baum, C. F., Caglayan, M., Schafer, D., Talavera, O., 2008. Political patronage in Ukrainian
banking. The Economics of Transition 16 (3), 537–557.
Berger, A. N., Hasan, I., Zhou, M., 2009. Bank ownership and efficiency in China: What will
happen in the world’s largest nation? Journal of Banking & Finance 33 (1), 113–130.
Blundell, R., Bond, S., 1998. Initial conditions and moment restrictions in dynamic panel data
models. Journal of Econometrics 87, 115–143.
Bongini, P., Laeven, L., Majnoni, G., 2002. How good is the market at assessing bank fragility? A
horse race between different indicators. Journal of Banking & Finance 26 (5), 1011–1028.
Bonin, J. P., Hasan, I., Wachtel, P., 2005. Bank performance, efficiency and ownership in transition
countries. Journal of Banking & Finance 29 (1), 31–53.
Brown, C. O., Dinc, I. S., 2005. The politics of bank failures: Evidence from emerging markets.
The Quarterly Journal of Economics 120 (4), 1413–1444.
Canevi, M. I., Cetinkaya, H., 2001. Has Turkey got its new banks act right? International Financial
Law Review 20 (8), 27–39.
Clarke, G. R., Cull, R., Shirley, M. M., 2005. Bank privatization in developing countries: A
summary of lessons and findings. Journal of Banking & Finance 29 (8-9), 1905–1930.
Cole, S., 2009. Fixing market failures or fixing elections? Agricultural credit in India. American
Economic Journal: Applied Economics 1 (1), 219–50.
Demirguc-Kunt, A., Huizinga, H., 1999. Determinants of commercial bank interest margins and
profitability: Some international evidence. World Bank Economic Review 13 (2), 379–408.
24
Denizer, C., 2000. Foreign entry in Turkey’s banking sector, 1980–97. Policy Research Working
Paper Series 2462, The World Bank.
Dinc, I. S., 2005. Politicians and banks: Political influences on government-owned banks in emerg-
ing markets. Journal of Financial Economics 77 (2), 453–479.
Fraser, D. R., Zhang, H., Derashid, C., 2006. Capital structure and political patronage: The case
of Malaysia. Journal of Banking & Finance 30 (4), 1291–1308.
Hauner, D., 2008. Credit to government and banking sector performance. Journal of Banking &
Finance 32 (8), 1499–1507.
Khwaja, A. I., Mian, A., 2005. Do lenders favor politically connected firms? Rent provision in an
emerging financial market. The Quarterly Journal of Economics 120 (4), 1371–1411.
Kibritcioglu, A., 2005. Banking sector crises and related new regulations in Turkey. Macroeco-
nomics 0505006, EconWPA.
La Porta, R., Lopez-De-Silanes, F., Shleifer, A., 2002. Government ownership of banks. Journal of
Finance 57 (1), 265–301.
Lin, X., Zhang, Y., 2009. Bank ownership reform and bank performance in China. Journal of
Banking & Finance 33 (1), 20–29.
Matousek, R., Dasci, S., Sergi, B. S., 2008. The efficiency of the Turkish banking system during
2000–2005. International Journal of Economic Policy in Emerging Economies 1 (4), 341–355.
Mercan, M., Reisman, A., Yolalan, R., Emel, A. B., 2003. The effect of scale and mode of ownership
on the financial performance of the Turkish banking sector: Results of a DEA-based analysis.
Socio-Economic Planning Sciences 37 (3), 185–202.
Micco, A., Panizza, U., Yanez, M., 2007. Bank ownership and performance. Does politics matter?
Journal of Banking & Finance 31 (1), 219–241.
Molyneux, P., Thornton, J., 1992. Determinants of European bank profitability: A note. Journal
of Banking & Finance 16 (6), 1173–1178.
Sapienza, P., 2004. The effects of government ownership on bank lending. Journal of Financial
Economics 72 (2), 357–384.
Saunders, A., Schumacher, L., 2000. The determinants of bank interest rate margins: An interna-
tional study. Journal of International Money and Finance 19 (6), 813–832.
Steinherr, A., Tukel, A., Ucer, M., 2004. The Turkish banking sector– Challenges and outlook in
transition to EU membership. Economic and Financial Reports 2004/2, European Investment
Bank, Economic and Financial Studies.
25
Taymaz, E., Yılmaz, K., 2008. Integration with the global economy: The case of Turkish automo-
bile and consumer electronics industries. Tech. Rep. 0801, TUSIAD-Koc University Economic
Research Forum.
Turan, I., 2003. Volatility in politics, stability in parliament: An impossible dream? The Turkish
Grand National Assembly during the last two decades. The Journal of Legislative Studies 9 (2),
151–176.
Tutar, I., Tansel, A., 2001. Political business cycles, institutional structure and budget deficits in
Turkey. Working Papers 2019, METU–ERC.
Yildirim, C., 2008. Moral hazard, corporate governance, and bank failure: evidence from the
2000–2001 Turkish crises. Tech. rep., mimeo.
26
.1.2
.3.4
.5
1960 1970 1980 1990 2000year
Commercial Foreign State
Figure 1: Dynamics of Loan/TA: Election years highlighted
.1.3
.5.7
1960 1970 1980 1990 2000year
Commercial Foreign State
Figure 2: Dynamics of Deposit/TA: Election years highlighted
27
−.0
50
.05
.1.1
5
1960 1970 1980 1990 2000year
Commercial Foreign State
Figure 3: Dynamics of Interest Margin: Election years highlighted
28
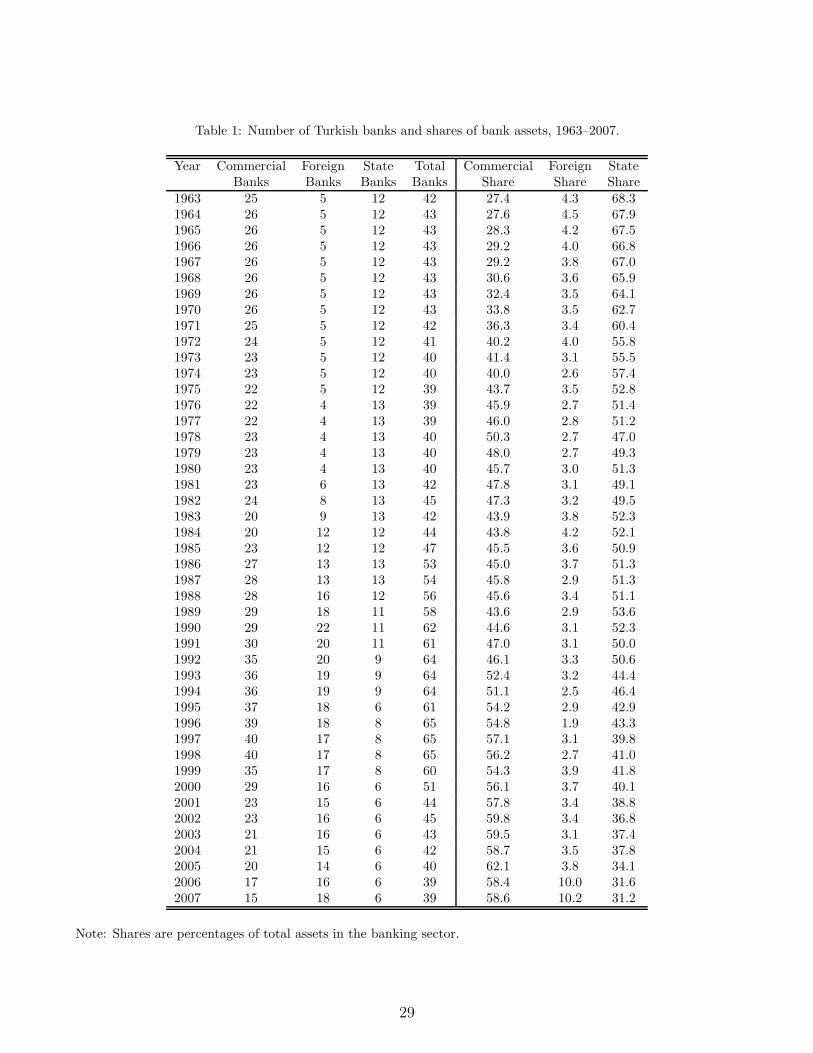
Table 1: Number of Turkish banks and shares of bank assets, 1963–2007.
Year Commercial Foreign State Total Commercial Foreign StateBanks Banks Banks Banks Share Share Share
1963 25 5 12 42 27.4 4.3 68.31964 26 5 12 43 27.6 4.5 67.91965 26 5 12 43 28.3 4.2 67.51966 26 5 12 43 29.2 4.0 66.81967 26 5 12 43 29.2 3.8 67.01968 26 5 12 43 30.6 3.6 65.91969 26 5 12 43 32.4 3.5 64.11970 26 5 12 43 33.8 3.5 62.71971 25 5 12 42 36.3 3.4 60.41972 24 5 12 41 40.2 4.0 55.81973 23 5 12 40 41.4 3.1 55.51974 23 5 12 40 40.0 2.6 57.41975 22 5 12 39 43.7 3.5 52.81976 22 4 13 39 45.9 2.7 51.41977 22 4 13 39 46.0 2.8 51.21978 23 4 13 40 50.3 2.7 47.01979 23 4 13 40 48.0 2.7 49.31980 23 4 13 40 45.7 3.0 51.31981 23 6 13 42 47.8 3.1 49.11982 24 8 13 45 47.3 3.2 49.51983 20 9 13 42 43.9 3.8 52.31984 20 12 12 44 43.8 4.2 52.11985 23 12 12 47 45.5 3.6 50.91986 27 13 13 53 45.0 3.7 51.31987 28 13 13 54 45.8 2.9 51.31988 28 16 12 56 45.6 3.4 51.11989 29 18 11 58 43.6 2.9 53.61990 29 22 11 62 44.6 3.1 52.31991 30 20 11 61 47.0 3.1 50.01992 35 20 9 64 46.1 3.3 50.61993 36 19 9 64 52.4 3.2 44.41994 36 19 9 64 51.1 2.5 46.41995 37 18 6 61 54.2 2.9 42.91996 39 18 8 65 54.8 1.9 43.31997 40 17 8 65 57.1 3.1 39.81998 40 17 8 65 56.2 2.7 41.01999 35 17 8 60 54.3 3.9 41.82000 29 16 6 51 56.1 3.7 40.12001 23 15 6 44 57.8 3.4 38.82002 23 16 6 45 59.8 3.4 36.82003 21 16 6 43 59.5 3.1 37.42004 21 15 6 42 58.7 3.5 37.82005 20 14 6 40 62.1 3.8 34.12006 17 16 6 39 58.4 10.0 31.62007 15 18 6 39 58.6 10.2 31.2
Note: Shares are percentages of total assets in the banking sector.
29
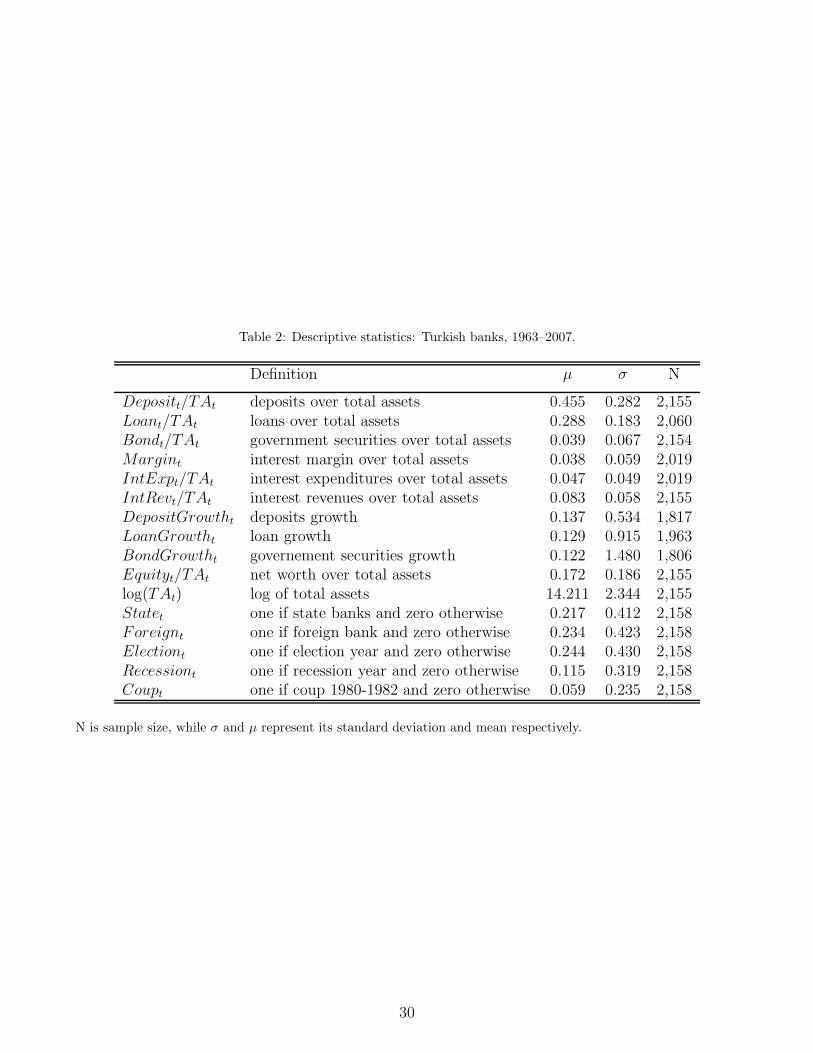
Table 2: Descriptive statistics: Turkish banks, 1963–2007.
Definition µ σ N
Depositt/TAt deposits over total assets 0.455 0.282 2,155Loant/TAt loans over total assets 0.288 0.183 2,060Bondt/TAt government securities over total assets 0.039 0.067 2,154Margint interest margin over total assets 0.038 0.059 2,019IntExpt/TAt interest expenditures over total assets 0.047 0.049 2,019IntRevt/TAt interest revenues over total assets 0.083 0.058 2,155DepositGrowtht deposits growth 0.137 0.534 1,817LoanGrowtht loan growth 0.129 0.915 1,963BondGrowtht governement securities growth 0.122 1.480 1,806Equityt/TAt net worth over total assets 0.172 0.186 2,155log(TAt) log of total assets 14.211 2.344 2,155Statet one if state banks and zero otherwise 0.217 0.412 2,158Foreignt one if foreign bank and zero otherwise 0.234 0.423 2,158Electiont one if election year and zero otherwise 0.244 0.430 2,158Recessiont one if recession year and zero otherwise 0.115 0.319 2,158Coupt one if coup 1980-1982 and zero otherwise 0.059 0.235 2,158
N is sample size, while σ and µ represent its standard deviation and mean respectively.
30
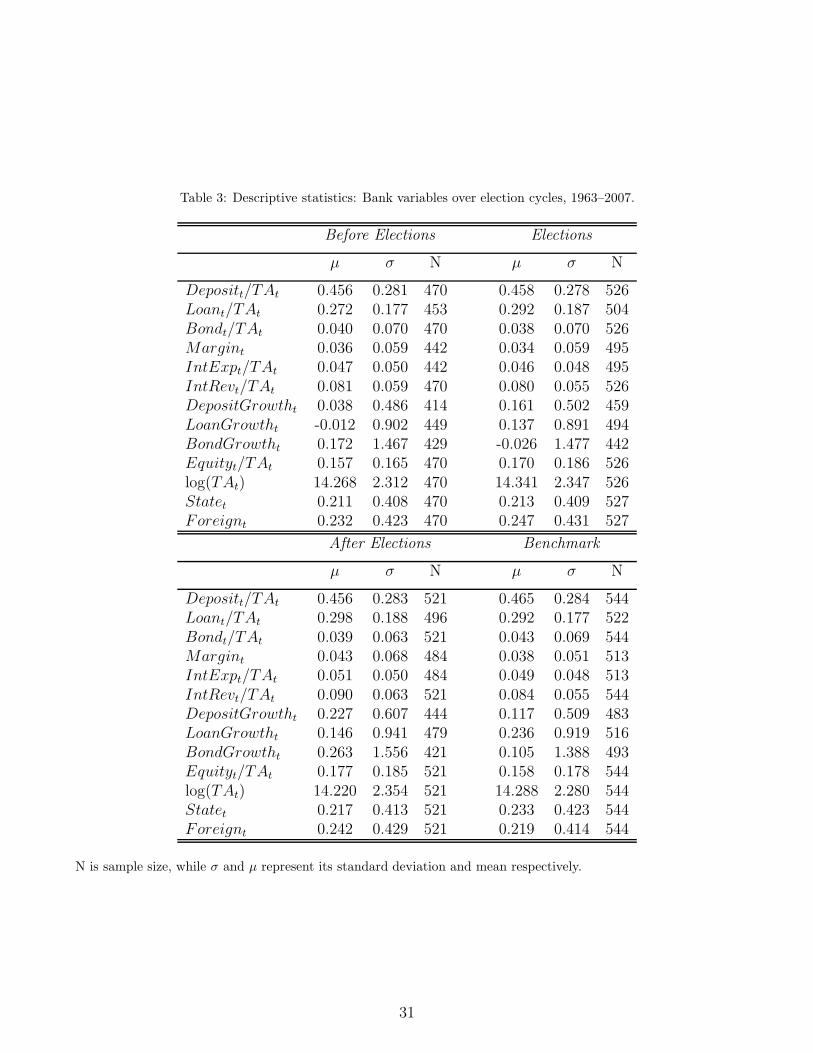
Table 3: Descriptive statistics: Bank variables over election cycles, 1963–2007.
Before Elections Elections
µ σ N µ σ N
Depositt/TAt 0.456 0.281 470 0.458 0.278 526Loant/TAt 0.272 0.177 453 0.292 0.187 504Bondt/TAt 0.040 0.070 470 0.038 0.070 526Margint 0.036 0.059 442 0.034 0.059 495IntExpt/TAt 0.047 0.050 442 0.046 0.048 495IntRevt/TAt 0.081 0.059 470 0.080 0.055 526DepositGrowtht 0.038 0.486 414 0.161 0.502 459LoanGrowtht -0.012 0.902 449 0.137 0.891 494BondGrowtht 0.172 1.467 429 -0.026 1.477 442Equityt/TAt 0.157 0.165 470 0.170 0.186 526log(TAt) 14.268 2.312 470 14.341 2.347 526Statet 0.211 0.408 470 0.213 0.409 527Foreignt 0.232 0.423 470 0.247 0.431 527
After Elections Benchmark
µ σ N µ σ N
Depositt/TAt 0.456 0.283 521 0.465 0.284 544Loant/TAt 0.298 0.188 496 0.292 0.177 522Bondt/TAt 0.039 0.063 521 0.043 0.069 544Margint 0.043 0.068 484 0.038 0.051 513IntExpt/TAt 0.051 0.050 484 0.049 0.048 513IntRevt/TAt 0.090 0.063 521 0.084 0.055 544DepositGrowtht 0.227 0.607 444 0.117 0.509 483LoanGrowtht 0.146 0.941 479 0.236 0.919 516BondGrowtht 0.263 1.556 421 0.105 1.388 493Equityt/TAt 0.177 0.185 521 0.158 0.178 544log(TAt) 14.220 2.354 521 14.288 2.280 544Statet 0.217 0.413 521 0.233 0.423 544Foreignt 0.242 0.429 521 0.219 0.414 544
N is sample size, while σ and µ represent its standard deviation and mean respectively.
31
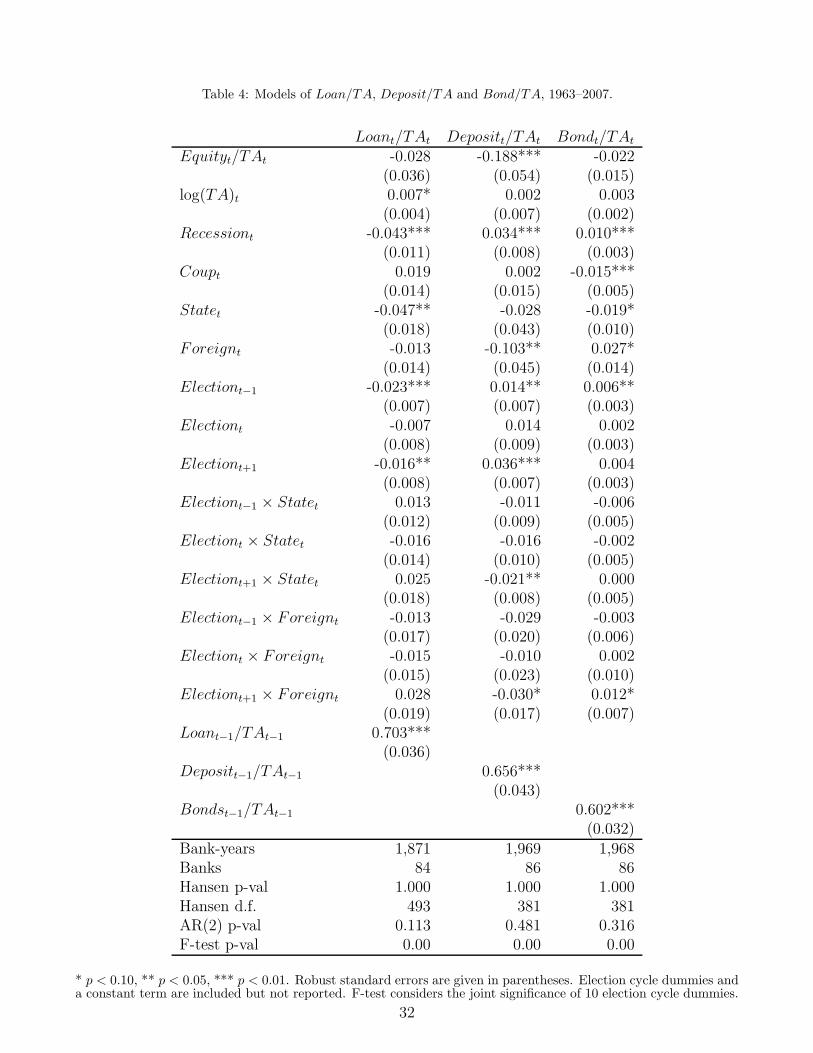
Table 4: Models of Loan/TA, Deposit/TA and Bond/TA, 1963–2007.
Loant/TAt Depositt/TAt Bondt/TAt
Equityt/TAt -0.028 -0.188*** -0.022(0.036) (0.054) (0.015)
log(TA)t 0.007* 0.002 0.003(0.004) (0.007) (0.002)
Recessiont -0.043*** 0.034*** 0.010***(0.011) (0.008) (0.003)
Coupt 0.019 0.002 -0.015***(0.014) (0.015) (0.005)
Statet -0.047** -0.028 -0.019*(0.018) (0.043) (0.010)
Foreignt -0.013 -0.103** 0.027*(0.014) (0.045) (0.014)
Electiont−1 -0.023*** 0.014** 0.006**(0.007) (0.007) (0.003)
Electiont -0.007 0.014 0.002(0.008) (0.009) (0.003)
Electiont+1 -0.016** 0.036*** 0.004(0.008) (0.007) (0.003)
Electiont−1 × Statet 0.013 -0.011 -0.006(0.012) (0.009) (0.005)
Electiont × Statet -0.016 -0.016 -0.002(0.014) (0.010) (0.005)
Electiont+1 × Statet 0.025 -0.021** 0.000(0.018) (0.008) (0.005)
Electiont−1 × Foreignt -0.013 -0.029 -0.003(0.017) (0.020) (0.006)
Electiont × Foreignt -0.015 -0.010 0.002(0.015) (0.023) (0.010)
Electiont+1 × Foreignt 0.028 -0.030* 0.012*(0.019) (0.017) (0.007)
Loant−1/TAt−1 0.703***(0.036)
Depositt−1/TAt−1 0.656***(0.043)
Bondst−1/TAt−1 0.602***(0.032)
Bank-years 1,871 1,969 1,968Banks 84 86 86Hansen p-val 1.000 1.000 1.000Hansen d.f. 493 381 381AR(2) p-val 0.113 0.481 0.316F-test p-val 0.00 0.00 0.00
* p < 0.10, ** p < 0.05, *** p < 0.01. Robust standard errors are given in parentheses. Election cycle dummies anda constant term are included but not reported. F-test considers the joint significance of 10 election cycle dummies.
32
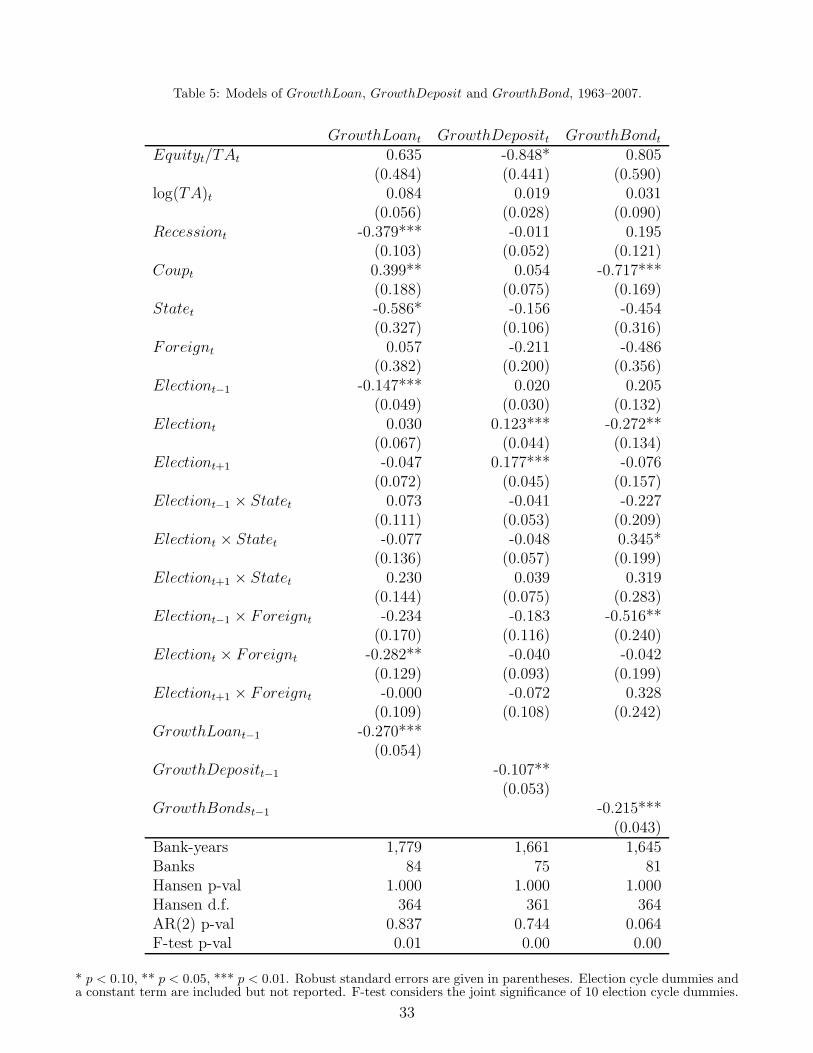
Table 5: Models of GrowthLoan, GrowthDeposit and GrowthBond, 1963–2007.
GrowthLoant GrowthDepositt GrowthBondt
Equityt/TAt 0.635 -0.848* 0.805(0.484) (0.441) (0.590)
log(TA)t 0.084 0.019 0.031(0.056) (0.028) (0.090)
Recessiont -0.379*** -0.011 0.195(0.103) (0.052) (0.121)
Coupt 0.399** 0.054 -0.717***(0.188) (0.075) (0.169)
Statet -0.586* -0.156 -0.454(0.327) (0.106) (0.316)
Foreignt 0.057 -0.211 -0.486(0.382) (0.200) (0.356)
Electiont−1 -0.147*** 0.020 0.205(0.049) (0.030) (0.132)
Electiont 0.030 0.123*** -0.272**(0.067) (0.044) (0.134)
Electiont+1 -0.047 0.177*** -0.076(0.072) (0.045) (0.157)
Electiont−1 × Statet 0.073 -0.041 -0.227(0.111) (0.053) (0.209)
Electiont × Statet -0.077 -0.048 0.345*(0.136) (0.057) (0.199)
Electiont+1 × Statet 0.230 0.039 0.319(0.144) (0.075) (0.283)
Electiont−1 × Foreignt -0.234 -0.183 -0.516**(0.170) (0.116) (0.240)
Electiont × Foreignt -0.282** -0.040 -0.042(0.129) (0.093) (0.199)
Electiont+1 × Foreignt -0.000 -0.072 0.328(0.109) (0.108) (0.242)
GrowthLoant−1 -0.270***(0.054)
GrowthDepositt−1 -0.107**(0.053)
GrowthBondst−1 -0.215***(0.043)
Bank-years 1,779 1,661 1,645Banks 84 75 81Hansen p-val 1.000 1.000 1.000Hansen d.f. 364 361 364AR(2) p-val 0.837 0.744 0.064F-test p-val 0.01 0.00 0.00
* p < 0.10, ** p < 0.05, *** p < 0.01. Robust standard errors are given in parentheses. Election cycle dummies anda constant term are included but not reported. F-test considers the joint significance of 10 election cycle dummies.
33
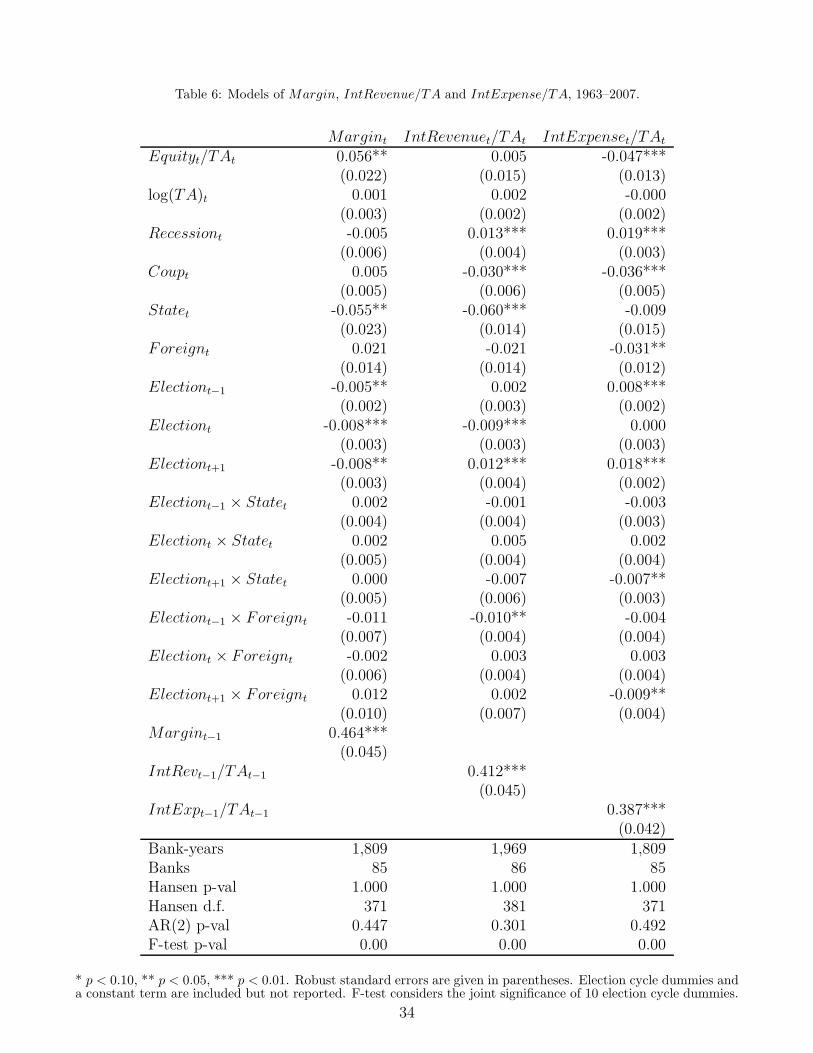
Table 6: Models of Margin, IntRevenue/TA and IntExpense/TA, 1963–2007.
Margint IntRevenuet/TAt IntExpenset/TAt
Equityt/TAt 0.056** 0.005 -0.047***(0.022) (0.015) (0.013)
log(TA)t 0.001 0.002 -0.000(0.003) (0.002) (0.002)
Recessiont -0.005 0.013*** 0.019***(0.006) (0.004) (0.003)
Coupt 0.005 -0.030*** -0.036***(0.005) (0.006) (0.005)
Statet -0.055** -0.060*** -0.009(0.023) (0.014) (0.015)
Foreignt 0.021 -0.021 -0.031**(0.014) (0.014) (0.012)
Electiont−1 -0.005** 0.002 0.008***(0.002) (0.003) (0.002)
Electiont -0.008*** -0.009*** 0.000(0.003) (0.003) (0.003)
Electiont+1 -0.008** 0.012*** 0.018***(0.003) (0.004) (0.002)
Electiont−1 × Statet 0.002 -0.001 -0.003(0.004) (0.004) (0.003)
Electiont × Statet 0.002 0.005 0.002(0.005) (0.004) (0.004)
Electiont+1 × Statet 0.000 -0.007 -0.007**(0.005) (0.006) (0.003)
Electiont−1 × Foreignt -0.011 -0.010** -0.004(0.007) (0.004) (0.004)
Electiont × Foreignt -0.002 0.003 0.003(0.006) (0.004) (0.004)
Electiont+1 × Foreignt 0.012 0.002 -0.009**(0.010) (0.007) (0.004)
Margint−1 0.464***(0.045)
IntRevt−1/TAt−1 0.412***(0.045)
IntExpt−1/TAt−1 0.387***(0.042)
Bank-years 1,809 1,969 1,809Banks 85 86 85Hansen p-val 1.000 1.000 1.000Hansen d.f. 371 381 371AR(2) p-val 0.447 0.301 0.492F-test p-val 0.00 0.00 0.00
* p < 0.10, ** p < 0.05, *** p < 0.01. Robust standard errors are given in parentheses. Election cycle dummies anda constant term are included but not reported. F-test considers the joint significance of 10 election cycle dummies.
34