parameter analysis of the iwa anaerobic digestion model no. 1 for the anaerobic digestion of...
TRANSCRIPT
Parameter analysis of the IWA Anaerobic DigestionModel No. 1 for the anaerobic digestion of blackwaterwith kitchen refuse
Y. Feng, J. Behrendt, C. Wendland and R. Otterpohl
Institute of Municipal and Industrial Wastewater Management, Hamburg University of Technology,
Eissendorferstr. 42, D-21073 Hamburg, Germany (E-mail: yucheng.feng@ tu-harburg.de)
Abstract The IWA anaerobic digestion model No.1 (ADM1) had been successfully applied to the lab-scale
mesophilic blackwater anaerobic digestion (BWAD) plant for cases of only blackwater (BW) feeding and of
BW plus kitchen refuse (KR) feeding. In this paper, the simulation results of BW þ KR anaerobic digestion
are presented and discussed, followed by the analyses and discussion of the critical and important
parameters as well as the performance of ADM1 based on these results. The raw BW can contain up to
30% short chain fatty acids (SCFA) which severely impact the performance of the model. The model proved
that the disintegration/hydrolysis rate of BW is around 4.5 d21, which is about ten times higher than that of
KR (Kdis,KR ¼ 0.5 d21). ADM1 is not sensitive to the distribution ratio among carbohydrates, proteins and
lipids. For BWAD the C4 metabolism can be integrated in the uptake of LCFA. The uptake delay
phenomenon was observed and cannot be simulated by ADM1, but it is tolerable. No unique KI,NH3,ac is
found out for all investigated ammonia concentration ranges. Meanwhile, ADM1 is not sensitive to KLa and
kp, so they can easily be set up.
Keywords ADM1; blackwater; blackwater anaerobic digestion; disintegration; hydrolysis; inhibition; kitchen
refuse; KLa and kp; mesophilic; Monod-type kinetics
Introduction
Being one of the oldest natural processes, anaerobic digestion (AD) is also among the old-
est processes used for wastewater treatment and biosolids stabilization (Metcalf and Eddy,
2003). AD is also an appropriate as well as an important waste and wastewater treatment
method for ecological sanitation (ECOSAN) (Otterpohl et al., 1997). Therefore, due to its
many advantages both the European community and U.S. consider the anaerobic treatment
as the most promising approach for the future in sustainable development (Lema and
Omil, 2001; NRC, 1995). The mathematical anaerobic digestion model (ADM) has been
extensively investigated and developed during the last three decades (Gavala et al., 2003).
As one of the most sophisticated and complex ADM, the IWA Anaerobic Digestion Model
No. 1 (ADM1) was published by the IWA Task Group for Mathematical Modelling of
Anaerobic Digestion Processes in 2002 (Batstone et al., 2002).
Based on ECOSAN concepts, blackwater (BW) (contains faeces, urine, toilet paper
and flushing water) from vacuum toilets can be treated in biogas plant so that the energy
is recovered as biogas and a fertilizer is generated (Otterpohl et al., 1999). One ECOSAN
project was successfully realized in Lubeck-Flintenbreite, Germany (Otterpohl, 2001).
Correspondingly, in order to optimize the on-site biogas plant and find control options
and process variations, a lab-scale mesophilic blackwater anaerobic digestion (BWAD)
plant was built at the Institute of Municipal and Industrial Wastewater Management,
Hamburg University of Technology, Germany. ADM1 was applied to simulate the
performance of this lab-scale BWAD plant. The model successfully achieved three
scenario studies: (1) reference conditions, (2) different feeding frequencies, and (3) with
Water
Science
&Techno
logyVol54No4pp139–147Q
IWAPub
lishing
2006
139doi: 10.2166/wst.2006.535

high NHþ4 concentration. Meanwhile, two virtual scenario studies with kitchen refuse
(KR) as additional organic loading were executed by the model, and the model properly
showed the tendency and provided usable suggestions (Feng et al., 2006). KR was added
to the lab-scale BWAD plant. In this paper the simulation results of AD of BW þ KR are
presented and discussed, and the important parameters as well as the performance of
ADM1 are analysed and discussed based on these simulation results.
Materials and methods
All experimental data were generated by three parallel lab-scale BWAD reactors, which
were built as continual stirred tank reactors (CSTR). Each reactor has 10.0 l volume.
8.0 l BW and sludge were held in each reactor, where 2.0 l space was retained as the
headspace. The reactors were operated at 38 8C with discontinuous BW feeding, which
were under the same conditions as the on-site biogas plant (Wendland et al., 2004).
The reactors were fed three times per week. The hydraulic retention time (HRT) and
the sludge retention time (SRT) were the same 20 days. BW from vacuum toilets has
relatively high COD, which is normally in the range 4,500–13,000 g COD/m3 with the
average level of 6,500 g COD/m3. The biogas production and pH were measured on-line,
where other parameters were checked once per week. The lab-scale BWAD reactors had
been steadily operated for two years. More details about materials, equipments and exper-
iments can be found from Feng et al. (2006). ADM1 was implemented by the software
AQUASIM 2.1 d, which is a computer program for data analysis and simulation of
aquatic systems (Reichert, 1994). AQUASIM 2.1 d also provides two powerful tools:
sensitivity analysis and parameter estimation, where the latter tool can be used for verify-
ing the kinetic parameters.
Regarding KR, every time the ground KR was firstly mixed with BW, and then the
mixture was fed into the reactors. The feeding frequency was also three times per week,
and HRT were kept the same as before, i.e. 20 days. The organic loading of KR was in
the range 7,000–13,5000 g COD/m3.
Results
In this paper the simulation results of AD of BW þ KR are presented and discussed, and
the simulation of other five above-mentioned scenario studies can be found from Feng
et al. (2005).
Anaerobic digestion of BW 1 KR
The model has been calibrated based on the reference conditions scenario (see Feng et al.,
2006). KR is added into the model considered as independent organic loading. The stoi-
chiometric coefficients of KR (fproduct,KR) and the disintegration rates of KR (Kdis,KR)
were set up, respectively. In order to get better simulation results, the different Kdis,KR
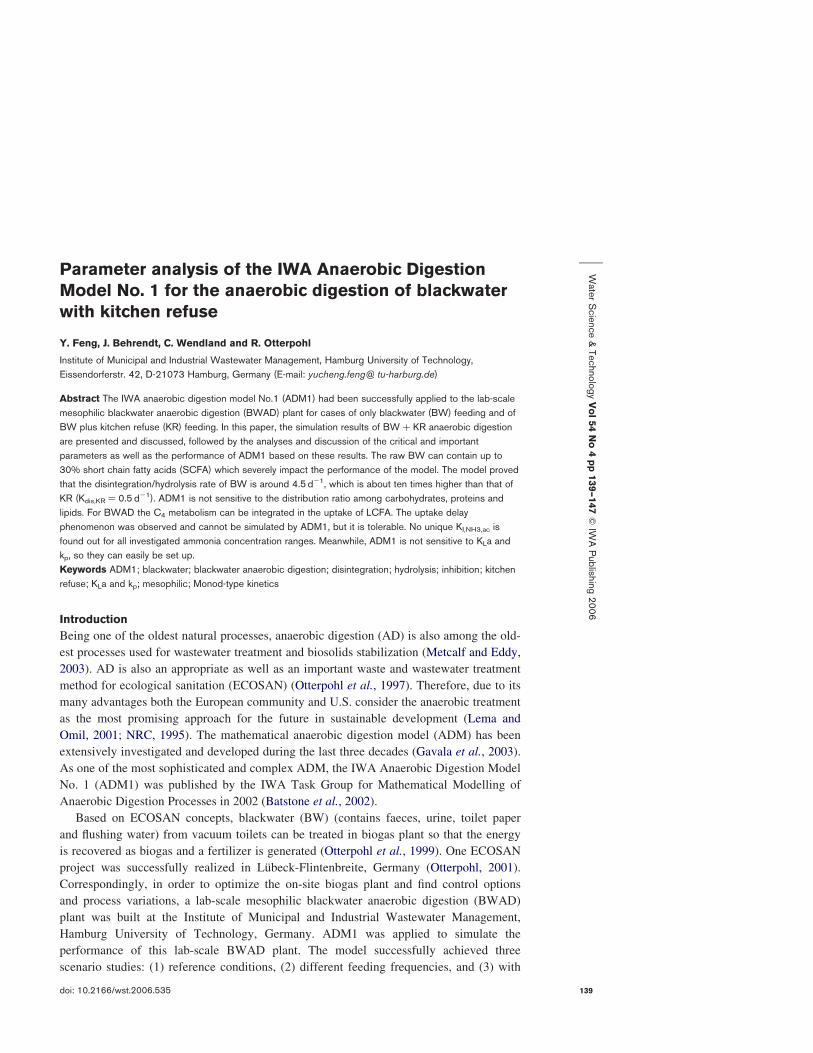
were tested by the model, i.e. 0.8 d21, 0.5 d21 and 0.3 d21. Figure 1 shows the simulation
results of biogas production rates (BPR) with different Kdis,KR. In the figure the Y-axis is
the specific BPR which is the absolute BPR divided by the reactor volume under the stan-
dard conditions.
Due to unknown reasons, the experimental data of day five and day seven were
unstable. With that exception, the model is able to properly simulate AD of BW þ KR in
a general manner. It also shows that when Kdis,KR is set up as 0.5 d21, the simulation
curves fit the experiment data better. It also coped well with the suggested value by
ADM1. This rate is about ten times lower than that of BW which is 4.5 d21. Meanwhile,
under the reference conditions, the maximum BPR is around 0.2m3 norm/(m3 reactor
volume d) (see Figure 2). Therefore, BW þ KR has around 4 times higher BPR than
Y.F
enget
al.
140
BW, which implies that AD of BW þ KR is a very promising method for waste and
wastewater treatment. Other parameters which were also appropriately simulated are not
shown here.
Discussion
Based on all these scenario studies, the important parameters as well as the performance
of ADM1 are analysed and discussed as follows.
Characterization of the raw BW
As discussed in ADM1, the biodegradability of raw BW is one of the key issues. The
analytical methods from Pavlostathis and Gossett (1986) and Gossett and Belser (1982)
are suggested. However, those methods mainly deal with the biodegradability of activated
sludge from wastewater treatment plants, which is unlike BW, so the biodegradability of
BW needs to be examined individually. From the medical description of faeces and the
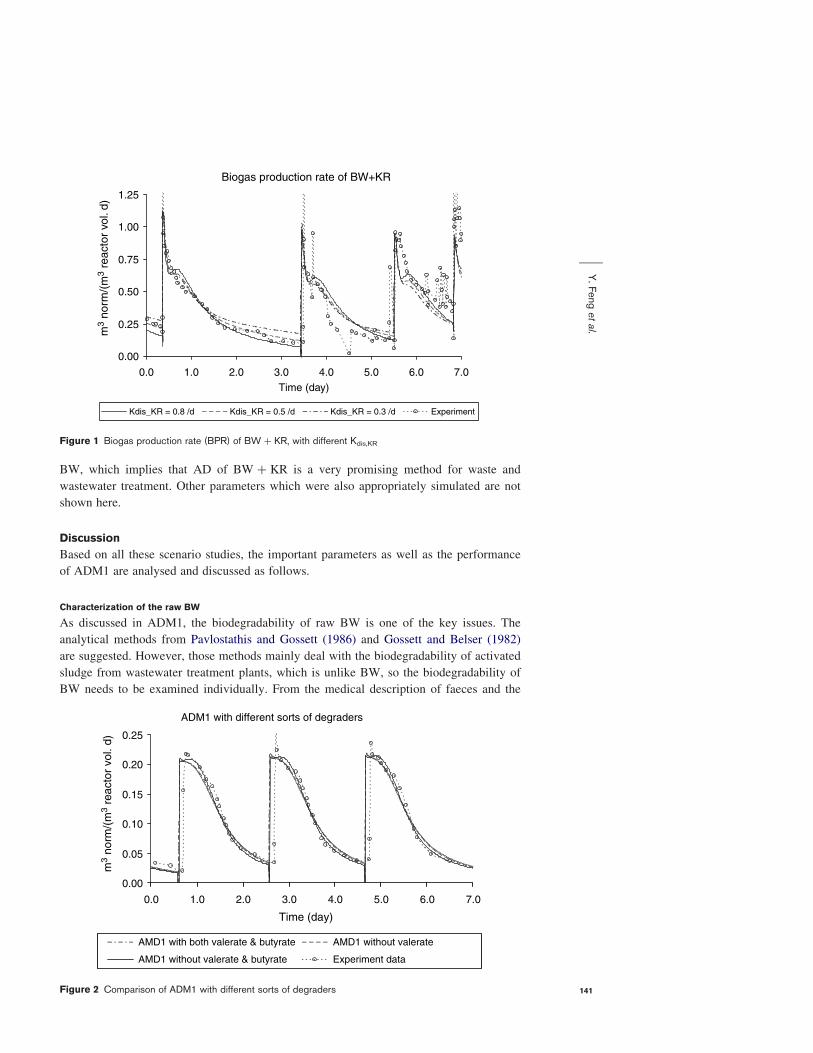
Figure 2 Comparison of ADM1 with different sorts of degraders
Figure 1 Biogas production rate (BPR) of BW þ KR, with different Kdis,KR
Y.F
enget
al.
141
testing results by ADM1, the inert part of BW is around 20–30%. In our studies, 25.5%
of total input COD was treated as the inert part which resulted in very good simulations.
The biodegradable portion of input is further hydrolysed into three parts: carbo-
hydrates (ch), proteins (pr) and lipids (li). The distribution ratio among three parts is
regarded as the critical and difficult issue, as carbohydrates, proteins and lipids have
different hydrolysis rates. It is, generally, necessary to determine this ratio in order to
execute ADM1 accurately. However, it is found that the distribution ratio is not sensitive
in BWAD, which might be caused by following reasons. Firstly, the hydrolysis rates of
the BWAD are not critical. One observed phenomenon can prove this conjecture.
For checking the hygiene conditions of BW after AD, one reactor was fed with cooked
BW, which was heated at 70 8C degree for an hour before feeding. This heating step can
dramatically speed up hydrolysis rates. Nevertheless, cooked and uncooked BW have the
same biogas products and BPR, which implicates that hydrolysis is not rate-limiting step
for the BWAD. Secondly, in our case BW already contains around 25–30% short chain
fatty acids (SCFA), which are mainly acetate. The existence of SCFA (especially acetate)
in raw BW further diminishes the influence of the hydrolysis step on the final output in
the model.
By the performance of our model, it shows that the variation of this ratio can be
20–30%, whereas BPR and the biogas components are only slightly different. At the
same time, the existence of SCFA in raw BW makes the model more sensitive to BW.
Therefore, instead of knowing the distribution ratio, the amount of SCFA in BW must be
determined. In our case, BW is characterized in Table 1.
Disintegration and hydrolysis
As the first stage of anaerobic digestion processes, these two steps are often rate-limiting, so
their reaction rates have been extensively investigated. These two steps are not separated in
many literatures, and the processes are generally investigated by the hydrolysis term.
The disintegration rates (kdis) suggested by AMD1 are around 0.5 d21 for mesophilic
digestion. However, kdis of our BW is ten times higher than this value. After extensively
testing by the model, it was found that kdis has to be set around 4.5 d21. It is probably
because the components of BW are mainly human faeces and BW is the liquid phase,
which can be beneficial to disintegration and hydrolysis. Meanwhile, before BW was
transported from the locale to the laboratory, it had been kept in the container for one or
two days, and afterwards BW was stored at 4 8C for about two weeks, which provides
more time to perform disintegration and hydrolysis. This may also be the reason that BW
contains such a high amount of SCFA.
Normally, carbohydrates, proteins and lipids have different hydrolysis rates and fall
into the range 0.01–1.0 d21. But their recommended values from ADM1 for mesophilic
and thermophilic solids AD are set at the same value of 10 d21. It is presumed that under
certain situations the hydrolysis rates of the three parts are not significantly different, so
the same rate can be used and, consequently, they can be represented by the disinte-
gration step. Hence, the adequately high values (e.g. 10 d21) are used in order to comple-
tely exclude the influence of the hydrolysis step in the model. This also makes the model
Table 1 Characterization of the raw blackwater
Biodegradable Inert
ch 1 pr 1 li (47.5%) SCFA (27%) 25.5%
Carbohydrates Proteins Lipids Butyrate Propionate Acetate14.5% 14.5% 18.5% 2% 5% 20%
Y.F
enget
al.
142

easier to manipulate. When three components have the same hydrolysis rates, it further
causes the model to be less sensitive to the aforementioned distribution ratio. In our case,
the hydrolysis rates of the three components are set up as 10 d21 as recommended
by ADM1.
Monod-type kinetics
ADM1 includes 7 different sorts of degraders utilising 8 different substrates, where
valerate and butyrate are utilised by the same degraders. Like most literatures, all kinetic
parameters are figured out based upon their total concentrations in the reactor, although
Spieß (1991) proved that only undissolved SCFA can be utilised by microorganisms.
In our work the same manner as ADM1 was used for uptake.
Estimation of kinetic parameters (km and KS). The batch experiments were executed in
our studies in order to obtain the kinetic parameters of butyrate, propionate and acetate
(Feng et al., 2006). The parameter estimation tool offered by AQUASIM 2.1 d was used
to estimated the maximum uptake rates of acetate (km) and the corresponding
half-saturation concentration (KS) of each substrate, respectively. In our studies, km of
butyrate, propionate and acetate are found to be as 18, 14, 13 d21, and the corresponding
KS are 110, 120, 160 g COD/m3.
Modification of the model. As the intermediates with a relative low concentration,
valerate and butyrate can be omitted in our case. Two more simulations were performed
in order to check the influence from valerate and butyrate on BWAD, i.e. case one: omit
only valerate from the model, and case two: omit both valerate and butyrate. In both
cases, the parameters were kept the same as the original model. The comparison of BPR
is shown in Figure 2.
It is clearly shown that BPR are nearly the same no matter with or without the utiliz-
ation step of valerate, and no significant differences of other parameters were observed,
either.
For the mesophilic BWAD the impact of valerate to the whole system is so small that
it can be omitted. In the real situation, valerate concentration in the reactors remains at a
low level, which is around 20–40 g COD/m3 in BW, and in the reactors it is no longer
detectable 3 hours after feeding. As to the second case, without the uptake steps of both
valerate and butyrate the BPR was kept at highest rate for longer time comparing to the
original one, but it is still tolerable. Furthermore, this distortion of BPR curve in the
second case can be compensated by adjusting the uptake kinetics of substrates which
have been successfully done.
On the basis of these two cases studies, one can say that the uptake of valerate and
butyrate are optional steps for BWAD, and they can be included or excluded depending
on their situations or the simulation purpose. Likewise, other intermediates can also be
involved or omitted depending on their essentiality in the specific cases.
Delay phenomenon. When the organisms enter the new environment, they need certain
time to adapt to this change before they start functioning. This kind of delay phenomenon
was limpidly observed in our lab-scale AD plant. The simulated BPR peak is always about
1 hour earlier than reality (Figure 2). This delay cannot be represented by Monod-type
kinetics. Batstone et al. (2003) observed the similar uptake delay of valerate, and tried
compensating it by increasing the decay rate and increasing km. The conjectured reasons
for the delay are also given by Batstone et al. (2003). In our case, the uptake delay cannot
be totally overcome by adjusting km, KS or the decay rates.
Y.F
enget
al.
143
Inhibition
Inhibition is one of the most important aspects of the anaerobic processes. Here the
ammonia and pH inhibition are discussed according as the performance of ADM1 in our
studies.
Ammonia inhibition. It is widely accepted that high levels of free ammonia nitrogen
(FAN) are more inhibitory to the anaerobic processed than the ammonium ion itself, and
the inhibitory effects of FAN influence mostly only methanogenesis (e.g. Stronach et al.,
1986). Nonetheless, many literatures reported the ammonia inhibition as total ammonium
nitrogen (TAN). Meanwhile, the methanogens can be acclimated in the higher TAN
concentration. It is reported that after acclimation to higher level of TAN, the
methanogens become less sensitive to the change of both TAN and pH (Liu and Sung,
2002). This kind of acclimation cannot be simulated by ADM1.
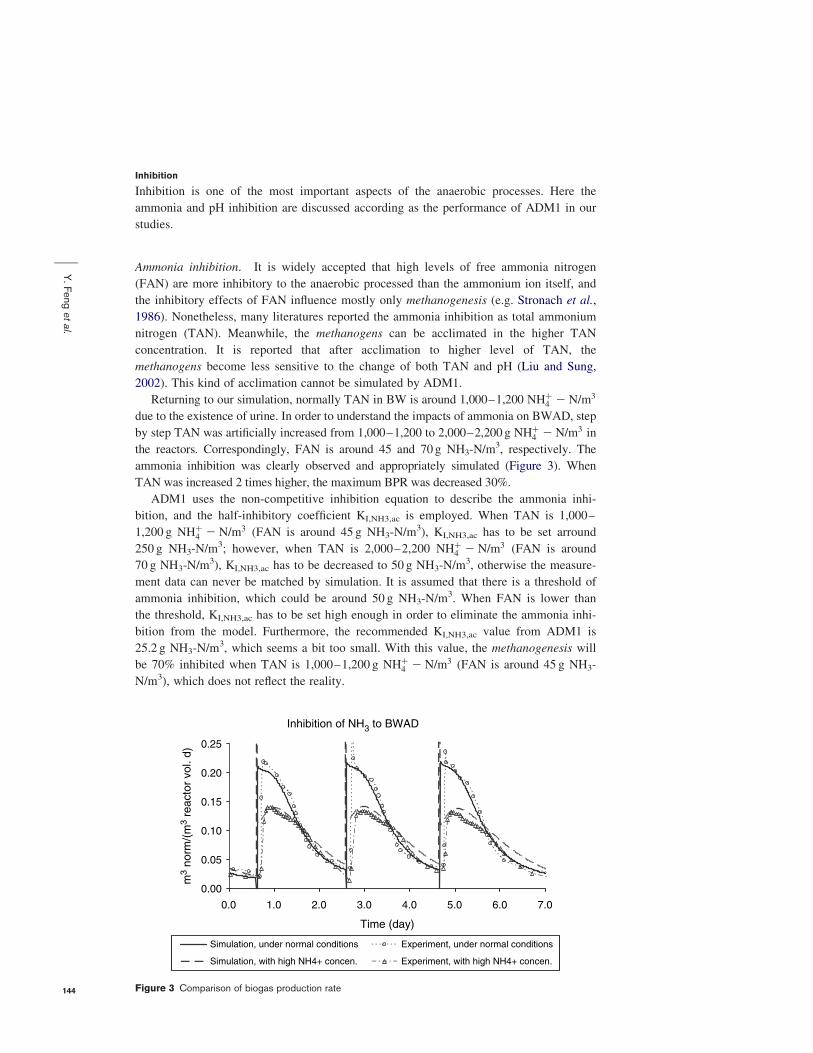
Returning to our simulation, normally TAN in BW is around 1,000–1,200 NHþ4 2 N=m3
due to the existence of urine. In order to understand the impacts of ammonia on BWAD, step
by step TAN was artificially increased from 1,000–1,200 to 2,000–2,200 g NHþ4 2 N=m3 in
the reactors. Correspondingly, FAN is around 45 and 70g NH3-N/m3, respectively. The
ammonia inhibition was clearly observed and appropriately simulated (Figure 3). When
TAN was increased 2 times higher, the maximum BPR was decreased 30%.
ADM1 uses the non-competitive inhibition equation to describe the ammonia inhi-
bition, and the half-inhibitory coefficient KI,NH3,ac is employed. When TAN is 1,000–
1,200 g NHþ4 2 N=m3 (FAN is around 45 g NH3-N/m
3), KI,NH3,ac has to be set arround
250 g NH3-N/m3; however, when TAN is 2,000–2,200 NHþ
4 2 N=m3 (FAN is around
70 g NH3-N/m3), KI,NH3,ac has to be decreased to 50 g NH3-N/m
3, otherwise the measure-
ment data can never be matched by simulation. It is assumed that there is a threshold of
ammonia inhibition, which could be around 50 g NH3-N/m3. When FAN is lower than
the threshold, KI,NH3,ac has to be set high enough in order to eliminate the ammonia inhi-
bition from the model. Furthermore, the recommended KI,NH3,ac value from ADM1 is
25.2 g NH3-N/m3, which seems a bit too small. With this value, the methanogenesis will
be 70% inhibited when TAN is 1,000–1,200 g NHþ4 2 N=m3 (FAN is around 45 g NH3-
N/m3), which does not reflect the reality.
Figure 3 Comparison of biogas production rate
Y.F
enget
al.
144
pH inhibition. In ADM1, two empirical equations are introduced for pH inhibition. One
considers both upper and lower pH inhibition (Angelidaki et al., 1993), and the other
considers only lower pH inhibition (Ramsay, 1997). ADM1 suggests that the second
equation (with only lower pH inhibition) should be used when the ammonia inhibition is
included. It is probably because at high pH level the higher concentration of ammonia
will be formed, so the inhibition will be presented by the ammonia inhibition term. This
could also be the reason that KI,NH3,ac from ADM1 is relatively small. For our simulation
since KI,NH3,ac was modified, the first equation with both upper and lower pH inhibition
was used and reasonable simulation results were gained.
Physicochemical processes
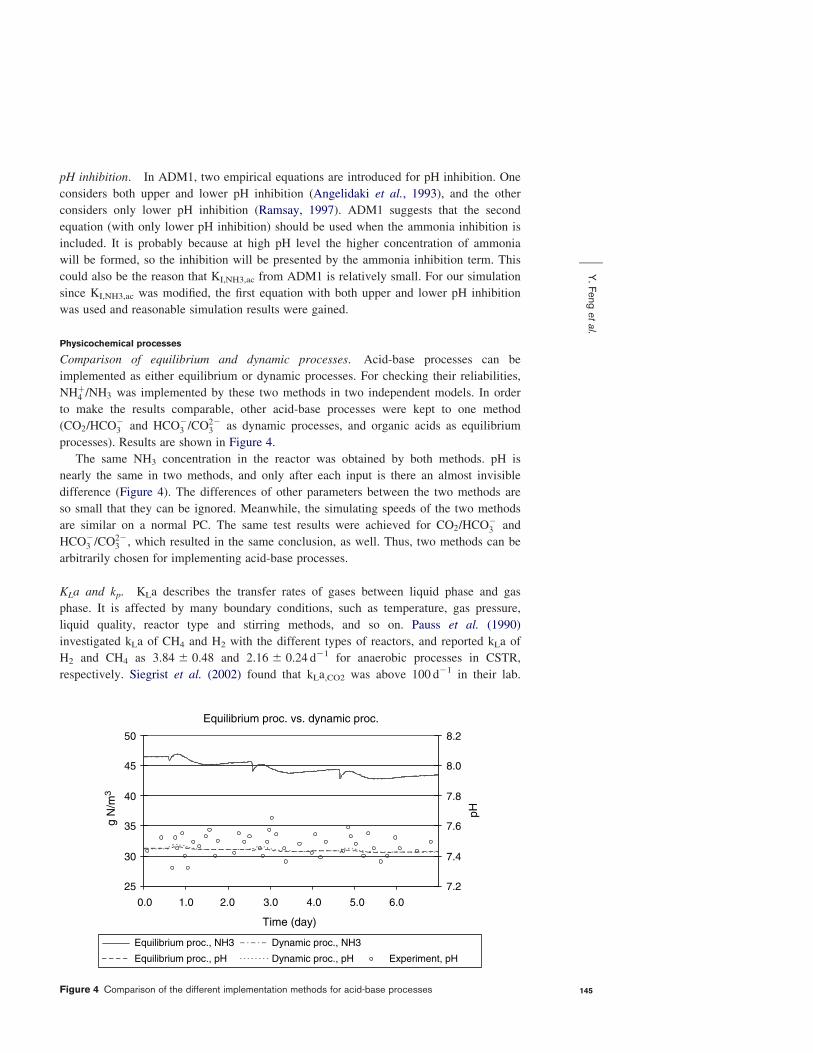
Comparison of equilibrium and dynamic processes. Acid-base processes can be
implemented as either equilibrium or dynamic processes. For checking their reliabilities,
NHþ4 =NH3 was implemented by these two methods in two independent models. In order
to make the results comparable, other acid-base processes were kept to one method
(CO2=HCO23 and HCO2
3 =CO223 as dynamic processes, and organic acids as equilibrium
processes). Results are shown in Figure 4.
The same NH3 concentration in the reactor was obtained by both methods. pH is
nearly the same in two methods, and only after each input is there an almost invisible
difference (Figure 4). The differences of other parameters between the two methods are
so small that they can be ignored. Meanwhile, the simulating speeds of the two methods
are similar on a normal PC. The same test results were achieved for CO2=HCO23 and
HCO23 =CO
223 , which resulted in the same conclusion, as well. Thus, two methods can be
arbitrarily chosen for implementing acid-base processes.
KLa and kp. KLa describes the transfer rates of gases between liquid phase and gas
phase. It is affected by many boundary conditions, such as temperature, gas pressure,
liquid quality, reactor type and stirring methods, and so on. Pauss et al. (1990)
investigated kLa of CH4 and H2 with the different types of reactors, and reported kLa of
H2 and CH4 as 3.84 ^ 0.48 and 2.16 ^ 0.24 d21 for anaerobic processes in CSTR,
respectively. Siegrist et al. (2002) found that kLa,CO2 was above 100 d21 in their lab.
Figure 4 Comparison of the different implementation methods for acid-base processes
Y.F
enget
al.
145
In ADM1 kLa is not sensitive anyhow. The values of kLa from 1.0 to 1,000 d21 result in
the same BPR that all can fit with the measurements. Only when it is smaller than
1.0 d21, does BPR start to be impaired. Therefore, kLa can easily be set up. As also
suggested by ADM1, kLa for all three kinds of gases can have the same value in the
normal case. In our model, kLa of H2, CH4 and CO2 is 20 d21.
kp is the pipe resistance coefficient for calculating the gas flow, when the pressure of
headspace is variable (Batstone et al., 2002). It is not sensitive in the mathematical
model. Only when kp is smaller than 0.5 is the biogas flowrate diminished. In our reac-
tors, the pipe resistance is quite small, so it can be set up optionally as well. In our
model, kp is 100m3/(d·bar).
Cations and anions. Cations (SCatþ ) and anions (SAn2 ) represent ions of strong base and
acid salts in liquid phase. Though they do not contribute any Hþ or OH2, they still
strongly influence pH due to the charge balance. However, the determination of SCatþ and
SAn2 is difficult and sensitive.
Conclusions
The mathematical model is an effective, efficient and economic method to design and
control systems. ADM1 was successfully implemented and applied to the mesophilic
BWAD plant. The model is able to provide valuable solutions and suggestions for
operation and control of BWAD plant by simulating the virtual scenarios. It also allows
us to implement supplementary substrates like KR as additional organic loading. The cal-
culation time of the model is in a tolerable range (using AquaSim 2.1 d on a normal PC)
Based on our studies, it is found that the distribution ratio among carbohydrates,
proteins and lipids is not sensitive, whereas the percentage of SCFA in the input is more
important instead. Fortunately, SCFA are much easier to be characterised than the
composition of composite particulate material. Meanwhile, it is found that in mesophilic
digestion of BW, the disintegration and hydrolysis are not the rate-limiting step (at least
not the sole rate-limiting step), the disintegration rate of BW is ten times higher than
that of KR. For BWAD the C4 metabolism can be integrated in the uptake of LCFA.
Moreover, the uptake delay occurred and it cannot be simulated by ADM1, but it is
tolerable.
A notable inhibitory effect of ammonia is observed and appropriately simulated
by ADM1. But no unique half-inhibitory coefficient (KI,NH3,ac) is found out for all
investigated ammonia concentration ranges, where with higher level of FAN the smaller
inhibition coefficient has to be used. pH inhibition can be partly explained by using HAc
and HPr as substrate. The empirical approach for the pH-inhibition can be changed to an
enzymatic approach.
As to physical-chemical processes, it is verified that equilibrium process and dynamic
processes result in the same simulation, so they can be arbitrarily chosen. The mass
transfer coefficient kLa and the pipe resistance coefficient kP proved not sensitive to the
mathematical model. Cations and anions can influence the pH value significantly, but
they are difficult and sensitive to determine in BW.
In addition, because each cycle of the batch experiment (or discontinuous feeding
operation) goes though nearly all biological status (e.g. high food to biomass ratio (F/M),
low F/M and starving phase, etc.), it is stricter with the mathematical model. Meanwhile,
if a large amount of acetate exists in the input, it also requires a more functional and pre-
cise model. Therefore, these two kinds of circumstance can be the very good benchmarks
or the higher criteria for examining mathematical models.
Y.F
enget
al.
146

Acknowledgements
The first author acknowledges D.J. Batstone for providing invaluable information and
assistance.
ReferencesAngelidaki, I., Ellegaard, L. and Ahring, B.K. (1993). A mathematical model for dynamic simulation of
anaerobic digestion of complex substrates: Focusing on ammonia inhibition. Biotech. Bioeng., 42,
159–166.
Batstone, D.J., Keller, J., Angelidaki, I., Kalyuzhnyi, S., Pavlostathis, S.G., Rozzi, A., Sanders, W., Siegrist, H.
and Vavilin, V. (2002). Anaerobic Digestion Model No. 1 (ADM1), IWA Publishing, London, UK, (IWA
Task Group on Modelling of Anaerobic Digestion Processes).
Batstone, D.J., Pind, P.F. and Angelidaki, I. (2003). Kinetics of thermophilic, anaerobic oxidation of straight
and branched chain butyrate and valerate. Biotech. Bioeng., 84(2), 195–204.
Feng, Y., Behrendt, J., Wendland, C. and Otterpohl, R. (2006). Implementation of the IWA Anaerobic
Digestion Model No.1 (ADM1) for simulating digestion of blackwater from vacuum toilets. Wat. Sci.
Tech., 53(9), 253–263.
Gavala, H.N., Angelidaki, I. and Ahring, B.K. (2003). Kinetics and modeling of anaerobic digestion process.
Adv. Biochem. Eng. Biotechnol., 81, 57–93.
Gossett, J.M. and Belser, R.L. (1982). Anaerobic digestion of waste activated sludge. J. Environ. Eng. ASCE,
108, 1101–1120.
Lema, J.M. and Omil, F. (2001). Anaerobic treatment: a key technology for a sustainable management of
wastes in Europe. Wat. Sci. Tech., 44(8), 133–140.
Liu, T. and Sung, S. (2002). Ammonia inhibition on thermophilic aceticlastic methanogens. Wat. Sci. Tech.,
45(10), 113–120.
Metcalf & Eddy (2003). Wastewater Engineering: Treatment and Reuse, 4th edn, McGraw-Hill, Inc.,
New York, USA.
NRC (1995). The Role of Technology in Environmentally Sustainable Development. National Academy,
NRC Press, Washington DC, USA.
Otterpohl, R., Grottker, M. and Lange, J. (1997). Sustainable water and waste management in urban areas.
Wat. Sci. Tech., 35(9), 121–133.
Otterpohl, R., Albold, A. and Oldenburg, M. (1999). Source control in urban sanitation and waste
management: ten systems with reuse of resources. Wat. Sci. Tech., 39(5), 153–160.
Otterpohl, R. (2001). Black, brown, yellow, grey – the new colours of sanitation. In Water 21, Magazine of
the International Water Association. IWA Publishing, London, UK, pp. 37–41, October, 2001.
Pauss, A., Andre, G., Perrier, M. and Guiot, S.R. (1990). Liquid-to-gas mass transfer in anaerobic processes:
inevitable transfer limitations of methane and hydrogen in the biomethanation process. Appl. Environ.
Microbiol., 56(6), 1636–1644.
Pavlostathis, S.G. and Gossett, J.M. (1986). A kinetic model for anaerobic digestion of biological sludge.
Biotech. Bioeng., 28(10), 1519–1530.
Ramsay, I.R. (1997). Modelling and control of high-rate anaerobic wastewater treatment systems. Ph.D.
thesis, University of Queensland, Brisbane, Australia.
Reichert, P. (1994). Aquasim – a tool for simulation and data-analysis of aquatic systems. Wat. Sci. Tech.,
30(2), 21–30.
Siegrist, H., Vogt, D., Garcia-Heras, J.L. and Gujer, W. (2002). Mathematical model for meso- and
thermophilic anaerobic sewage sludge digestion. Environ. Sci. Technol., 36(5), 1113–1123.
Spieß, A (1991). Anaerobe Abwasserreinigung in neuen Bioreaktoren mit Polyurethan-Schaumstoff- partikeln
zur Immobilisierung der Bakterien. VDI Verlage GmbH, Dusseldorf. Fortschrittberichte, Reihe 15, Nr.
85: Umwelttechnik (in German).
Stronach, S.M., Rudd, T. and Lester, J.N. (1986). Anaerobic Digestion Process in Industrial Wastewater
Treatment, Springer-Verlag, Berlin, Heidelberg, Germany, pp. 74.
Wendland, C., Deegener, S., Behrendt, J. and Otterpohl, R. (2004). Anaerobic digestion of blackwater from
vacuum toilets. In Proc. of the 10th World Congress on Anaerobic Digestion (AD10), Montreal, 29th
August – 3rd September. pp. 255–232.
Y.F
enget
al.
147