paradise in peril: studying & protecting reefs within the ... · paradise in peril: studying...
TRANSCRIPT
EXPEDITION REPORTExpedition dates: 10 March – 5 April 2013
Report published: November 2014
Paradise in peril: studying &protecting reefs within the Tioman
Archipelago Marine Protected Area,
Malaysia.BESTVOLUNTEERINGORGANISATION
UK
BEST FORGREEN-MINDED
TRAVELLERSUK
TOPRESPONSIBLE
HOLIDAYUK
BEST WILDLIFEVOLUNTEERING
HOLIDAYUK
BEST INSUSTAINABLE
TRAVELUSA
TOP HOLIDAYFOR NATURE
Germany
ENVIRONMENTAWARDGermany
Cover
image
(c)
KL
Kw
ang
1
© Biosphere Expeditions, an international not-for-profit conservation organisation registered in England, Germany, France, Australia and the USAOfficially accredited member of the United Nations Environment Programme's Governing Council & Global Ministerial Environment ForumOfficially accredited member of the International Union for the Conservation of Nature
EXPEDITION REPORTParadise in peril: studying & protecting reefs within theTioman Archipelago Marine Protected Area, Malaysia.
Expedition dates:10 March – 5 April 2013
Report published:November 2014
Authors:Alvin Chelliah
Reef Check Malaysia
Matthias HammerBiosphere Expeditions
2
© Biosphere Expeditions, an international not-for-profit conservation organisation registered in England, Germany, France, Australia and the USAOfficially accredited member of the United Nations Environment Programme's Governing Council & Global Ministerial Environment ForumOfficially accredited member of the International Union for the Conservation of Nature
Abstract
Tioman Archipelago has long been a popular tourist destination, especially amongdivers and snorkellers that come to visit the coral reefs in this area. However, littleis known about the coral reefs that surround the island, particularly along the eastcoast of Tioman and Pemanggil Islands. In March and April of 2013, two teams ofvolunteers from Biosphere Expeditions, along with a marine scientist from ReefCheck Malaysia, conducted reef health assessments at various sites around theislands, using the Reef Check methodology. This was part of a continuous studyfirst started in 2012 in collaboration with Biosphere Expeditions. Results showedthat reefs were in ‘good’ condition with a total average of 52.50% live coral cover,which is higher than the national average of 46.37% recorded in 2012 (Reef CheckMalaysia 2013). However, highly valued seafood such as lobsters and commercialfood fish occurred at low densities or were absent during most surveys. Alongsidethe ever-present illegal fishing, coastal development poses the greatest risk to thereefs. Evidence of coastal runoff, such as sedimentation and high nutrient indicatoralgae cover, and sewage pollution was observed at a number of sites surveyed.Improved enforcement of Marine Park laws and better coastal developmentplanning are vital in reducing local threats and building resilience of the reefs withinthe Tioman Archipelago.
Abstrak
Pulau Tioman dan pulau-pulau di rantaunya telah lama menjadi kawasan tarikanpelancong, terutamanya antara penyelam SKUBA yang datang untuk menikmatiterumbu karang di kawasan ini. Walaubagaimanapun hanya sedikit diketahuimengenai keadaan terumbu karang terutamanya di sebelah Timur Pulau Tiomandan Pulau Pemanggil. Pada bulan Mac dan April 2013, dua kumpulan sukarelawandaripada Biosphere Expeditions, bersama dengan seorang saintis marin daripadaReef Check Malaysia, telah menjalankan pemantauan terumbu karang di beberapakawasan di sekitar pulau-pulau tersebut, dengan menggunakan kaedah ReefCheck. Ini merupakan sambungan kajian yang pertama kalinya diadakan padatahun 2012 bersama Biosphere Expeditions. Keputusan menunjukkan bahawaterumbu karang di kawasan tersebut berada dalam keadaan yang ‘baik’ denganpurata litupan karang hidup sebanyak 52.50% dan melebihi purata negara(46.37%) yang dicatat pada tahun 2012 (Reef Check Malaysia 2013). Akan tetapimakanan laut yang bernilai tinggi seperti Udang Galah dan Ikan Mameng tidakdijumpai di kebanyakan kawasan kajian. Selain daripada masalah penangkapanikan secara haram, pembangunan pantai yang tidak terancang merupakanancaman utama kepada terumbu.Buktinya dapat dilihat di beberapa kawasankajian. Peningkatan penguatkuasaan undang-undang Taman Laut danpembangunan kawasan pantai yang lebih terancang adalah mustahak untukmengurangkan ancaman tempatan sambil membina daya ketahanan terumbudikawasan kepulauan Tioman.
3
© Biosphere Expeditions, an international not-for-profit conservation organisation registered in England, Germany, France, Australia and the USAOfficially accredited member of the United Nations Environment Programme's Governing Council & Global Ministerial Environment ForumOfficially accredited member of the International Union for the Conservation of Nature
Contents
Abstract / Abstrak 2
Contents 3
1. Expedition Review 4
1.1. Background 4
1.2. Research area 5
1.3. Dates 5
1.4. Local conditions & support 6
1.5. Expedition scientist 7
1.6. Expedition leader 7
1.7. Expedition team 7
1.8. Partners 8
1.9. Expedition budget 8
1.10. Acknowledgements 9
1.11. Further Information & enquiries 9
2. Reef Check Survey 10
2.1. Introduction 10
2.2. Methods 12
2.3. Results 17
2.4. Discussion & conclusions 47
2.5. Summary & recommendations 50
2.6. Literature cited 52
Appendix I: Expedition diary & reports 54
4
© Biosphere Expeditions, an international not-for-profit conservation organisation registered in England, Germany, France, Australia and the USAOfficially accredited member of the United Nations Environment Programme's Governing Council & Global Ministerial Environment ForumOfficially accredited member of the International Union for the Conservation of Nature
1. Expedition Review
Matthias HammerBiosphere Expeditions
1.1. Background
Biosphere Expeditions runs wildlife conservation research expeditions to all corners of theEarth. Our projects are not tours, photographic safaris or excursions, but genuine researchexpeditions placing ordinary people with no research experience alongside scientists whoare at the forefront of conservation work. Our expeditions are open to all and there are nospecial skills (biological or otherwise) required to join. Our expedition team members arepeople from all walks of life, of all ages, looking for an adventure with a conscience and asense of purpose. More information about Biosphere Expeditions and its researchexpeditions can be found at www.biosphere-expeditions.org.
This report deals with an expedition to Pulau Tioman Marine Park, Malaysia Peninsula thatran from 10 March to 5 April 2013. Its aims included: (1) monitoring the health of the PulauTioman Marine Park’s reefs, its fish and megafauna communities (turtles, sharks,dolphins) so that informed management, education and conservation decisions can bemade by government and NGOs, and (2) contributing to the conservation of Malaysia’svaluable ecological resources. Data collection followed an internationally recognised coralreef monitoring programme, called Reef Check, and will be used to make informedmanagement and conservation decisions within the area. The expedition included trainingparticipants as Reef Check EcoDivers.
Pulau Tioman is located 40 km off the east coast of the Malaysian Peninsula. The reefs ofPulau Tioman Marine Park are some of the healthiest and most diverse around thepeninsula and lie just inside the ‘coral triangle’, an area that has been identified as havingthe highest diversity of coral species anywhere in the world. The reefs in the coral trianglesupport over 600 genera of reef-building corals, over 3000 species of fish and contain 75%of all coral species known to science (The Nature Conservancy 2008). The coral trianglewas identified as a priority area for marine conservation and, during the 2007 UnitedNations Climate Change conference in Bali, a pledge to protect this marine environmentwas drawn up between the countries of Malaysia, Indonesia, the Philippines and PapuaNew Guinea. Pulau Tioman was gazetted as a nature reserve and Marine Park in 1998 toprotect these valuable resources. A Marine Parks division of the government is present onthe island.
However, the island’s growing tourist trade, crown-of-thorns population booms anddevelopments on land are threatening the reefs’ health and so data on the currentbiological status of the reefs and of population levels of key indicator species are crucialfor park management and educational efforts. Tourism development is a priority for thegovernment, but sustainable tourism is being overlooked in favour of cheaper and moredamaging mass tourism. If Malaysia’s government and local populations can see small-scale, responsible tourism development working for them, then the country’s rich naturalresources could be protected more effectively.
5
© Biosphere Expeditions, an international not-for-profit conservation organisation registered in England, Germany, France, Australia and the USAOfficially accredited member of the United Nations Environment Programme's Governing Council & Global Ministerial Environment ForumOfficially accredited member of the International Union for the Conservation of Nature
1.2. Research area
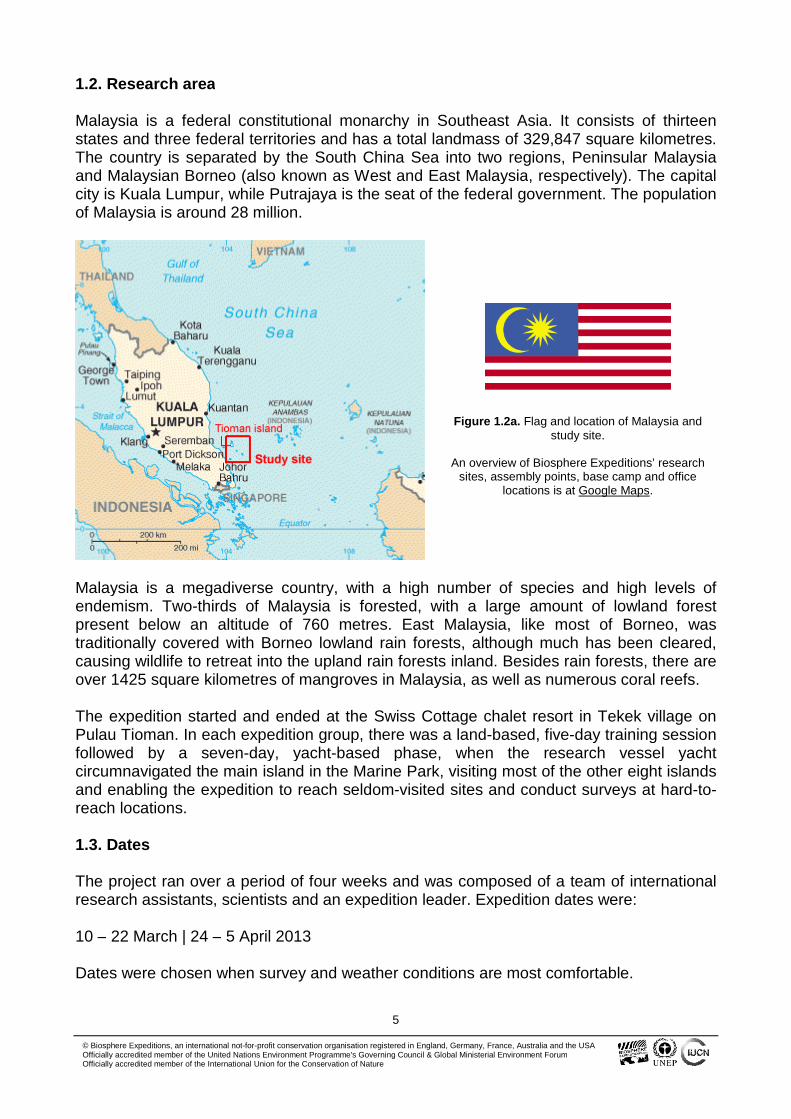
Malaysia is a federal constitutional monarchy in Southeast Asia. It consists of thirteenstates and three federal territories and has a total landmass of 329,847 square kilometres.The country is separated by the South China Sea into two regions, Peninsular Malaysiaand Malaysian Borneo (also known as West and East Malaysia, respectively). The capitalcity is Kuala Lumpur, while Putrajaya is the seat of the federal government. The populationof Malaysia is around 28 million.
Figure 1.2a. Flag and location of Malaysia andstudy site.
An overview of Biosphere Expeditions’ researchsites, assembly points, base camp and office
locations is at Google Maps.
Malaysia is a megadiverse country, with a high number of species and high levels ofendemism. Two-thirds of Malaysia is forested, with a large amount of lowland forestpresent below an altitude of 760 metres. East Malaysia, like most of Borneo, wastraditionally covered with Borneo lowland rain forests, although much has been cleared,causing wildlife to retreat into the upland rain forests inland. Besides rain forests, there areover 1425 square kilometres of mangroves in Malaysia, as well as numerous coral reefs.
The expedition started and ended at the Swiss Cottage chalet resort in Tekek village onPulau Tioman. In each expedition group, there was a land-based, five-day training sessionfollowed by a seven-day, yacht-based phase, when the research vessel yachtcircumnavigated the main island in the Marine Park, visiting most of the other eight islandsand enabling the expedition to reach seldom-visited sites and conduct surveys at hard-to-reach locations.
1.3. Dates
The project ran over a period of four weeks and was composed of a team of internationalresearch assistants, scientists and an expedition leader. Expedition dates were:
10 – 22 March | 24 – 5 April 2013
Dates were chosen when survey and weather conditions are most comfortable.
6
© Biosphere Expeditions, an international not-for-profit conservation organisation registered in England, Germany, France, Australia and the USAOfficially accredited member of the United Nations Environment Programme's Governing Council & Global Ministerial Environment ForumOfficially accredited member of the International Union for the Conservation of Nature
1.4. Local conditions & support
Expedition base
The first five days of each expedition group were based at the Swiss Cottage beach chaletresort on Tioman Island. Expedition participants were divided into pairs and shared twin-bedded rooms for the first six nights.
The next seven days of each group were based on ‘Araliya’, a Colombia 45 ft sloop rigsailing yacht crewed by a yacht captain, divemaster/field scientist and the expeditionleader. The yacht provided the freedom of being able to reach remote parts of the studysite, but not the luxury of a hotel or resort. There were two cabins available, one doubleand one triple and two single berths, mattresses and hammocks.
Weather & water temperature
The climate is tropical and maritime. The average day temperature during the expeditionmonths were 32-40°C. Water temperature during the expedition was 28-31°C.
Field communications
On land, mobile phone reception and Wi-Fi internet connections were available. The yachtwas equipped with radio and telephone communication systems. Mobile phones worked insome parts of the study site, but by no means all. The expedition leader e-mailed andposted a multi-media expedition diary on Wordpress for friends and family to access.Excerpts of the diary also appeared on the Biosphere Expeditions’ social media sites suchas Facebook and Google+.
Transport, vehicles & research boats
Team members made their own way to the Tioman island assembly point. From thereonwards and back to the assembly point all transport and vehicles were provided for theexpedition team, for expedition support and emergency evacuations.
Medical support and insurance
The expedition leader and the expedition scientist were trained first aiders, and theexpedition carried a medical kit. The standard of medical care in Malaysia is good with aclinic in Tekek village and Juara village. There are also recompression chambers inKuantan and Singapore, as well as a large hospital in Mersing, just a couple of hours awayby ferry. Safety and emergency procedures were in place, but did not have to be invoked,as there were no serious medical incidences during the expedition.
Diving
The minimum requirement to take part in this expedition was a PADI Open Water orequivalent qualification. Team members who had not dived for twelve months prior tojoining the expedition were required to complete a PADI Scuba Review before joining theexpedition. Standard PADI diving and safety protocols were followed.
7
© Biosphere Expeditions, an international not-for-profit conservation organisation registered in England, Germany, France, Australia and the USAOfficially accredited member of the United Nations Environment Programme's Governing Council & Global Ministerial Environment ForumOfficially accredited member of the International Union for the Conservation of Nature
Dive groups were divided into different teams, each working on specific areas of surveywork. Divers were allocated to teams based on a mixture of personal preference anddiving skills.
1.5. Expedition scientist
Alvin Chelliah is from Kajang, which is just outside Kuala Lumpur. He has a degree inMarine Science from University Malaysia Sabah and a Masters Degree in the same fieldfrom the National University of Malaysia. He started diving when he was still in high schooland has since been connected to marine life. In between studies he worked at anAquarium in Kuala Lumpur and he joined Reef Check Malaysia after finishing his MSc. Heis a PADI Divemaster and a Reef Check Course Director.
1.6. Expedition leader
Paul O'Dowd was born in Melbourne, Australia. From the beginning, his primary interestshave been natural history and adventure. As a teenager he learned to dive and at 19 yearsold left Victoria to move to Cairns to work on the Great Barrier Reef in the dive industry.Shortly thereafter he was offered a job managing a dive facility in Papua New Guinea. InPNG Paul became involved in expeditionary and documentary film work. Paul has workedfor the BBC’s Natural History Unit and various other companies on documentary projectsas well as with assorted tourism-based expeditions to places such as the Sepik Basin andthe Kokoda Track. Paul also delivers a lecture programme in rainforest ecology,conservation and sustainability for a study abroad programme for American universitystudents. A broad base of scientific literacy and a genuine interest in communication hasled to a career in introducing diverse audiences to the natural world. Diving, rock climbingand just about anything that provides a good opportunity to get into nature and help othersto do the same is Paul’s idea of time well spent.
1.7. Expedition team
The expedition team was recruited by Biosphere Expeditions and consisted of a mixture ofall ages, nationalities and backgrounds. They were (with country of residence):
18 – 22 March 2013: Hermine Eon (UK), Cathy & Dave Johnstone (Switzerland), LizMcLardy (UK), Gail Zalutsky (USA).
24 – 5 April 2013: Georgie Brown (UK), Janne Gitmark (Norway), Renate & StefanPlaumann (Germany), Laurence Romeo (UK).
The skipper throughout the expedition was Chris Salter, a qualified Yachtmaster fromAustralia, with much experience of ocean crossings and skippering charters.
8
© Biosphere Expeditions, an international not-for-profit conservation organisation registered in England, Germany, France, Australia and the USAOfficially accredited member of the United Nations Environment Programme's Governing Council & Global Ministerial Environment ForumOfficially accredited member of the International Union for the Conservation of Nature
1.8. Partners
On this project Biosphere Expeditions is working with Reef Check Malaysia, theDepartment of Marine Parks of Malaysia, local dive centres, businesses & resorts, thelocal community, the National University of Malaysia, University Malaya, as well as sharingdata with the Global Coral Reef Monitoring Network (GCRMN).
Our main logistics partner was the Tioman Dive Centre, a well-established SCUBA divingcentre based on Tioman Island and managed by Rosie Cotton. Tioman Dive Centre staffwere on hand to offer advice and assistance in safety, diving and other local logisticalissues.
1.9. Expedition budget
Each team member paid towards expedition costs a contribution of £1470 per person perslot. The contribution covered accommodation and meals, supervision and induction,special non-personal diving and other equipment and air, and all transport from and to theteam assembly point. It did not cover excess luggage charges, travel insurance, personalexpenses such as telephone bills, souvenirs etc., as well as visa and other travelexpenses to and from the assembly point (e.g. international flights). Details on how thiscontribution was spent are given below.
Income £
Expedition contributions 14,593
Expenditure
Research vessel & accommodationincludes all board & lodging on land & sea, ship’s crew, fuel & oils, diving & otherservices
4,526
Equipment and hardwareincludes research materials & gear hired or purchased in UK & Malaysia
439
StaffIncludes local and international salaries, travel and expenses
5,008
Administrationincludes registration fees & sundries
123
Team recruitment Malaysiaas estimated % of PR costs for Biosphere Expeditions
4,472
Income – Expenditure 25
Total percentage spent directly on project 100%
9
© Biosphere Expeditions, an international not-for-profit conservation organisation registered in England, Germany, France, Australia and the USAOfficially accredited member of the United Nations Environment Programme's Governing Council & Global Ministerial Environment ForumOfficially accredited member of the International Union for the Conservation of Nature
1.10. Acknowledgements
This study was conducted by Biosphere Expeditions, which runs wildlife conservationexpeditions all over the globe. Without our expedition team members (who are listedabove) who provided an expedition contribution and gave up their spare time to work asresearch assistants, none of this research would have been possible. Thank you also toStella Abbas Rowland of Swiss Cottage Chalets who provided accommodation and mealsfor our volunteers and staff. The support team and staff (also mentioned above) werecentral to making it all work on the ground. Thank you to all of you, and the ones we havenot managed to mention by name (you know who you are) for making it all come true.Thank you to all reviewers, anonymous or named, for helpful comments on the drafts ofthis report. Biosphere Expeditions would also like to thank members of the Friends ofBiosphere Expeditions and donors and Swarovski Optik for their sponsorship support.
1.11. Further information & enquiries
More background information on Biosphere Expeditions in general and on this expeditionin particular including pictures, diary excerpts and a copy of this report can be found on theBiosphere Expeditions website www.biosphere-expeditions.org
Enquires should be addressed to Biosphere Expeditions via www.biosphere-expeditions.org.
10
© Biosphere Expeditions, an international not-for-profit conservation organisation registered in England, Germany, France, Australia and the USAOfficially accredited member of the United Nations Environment Programme's Governing Council & Global Ministerial Environment ForumOfficially accredited member of the International Union for the Conservation of Nature
2. Reef Check Survey
2.1. Introduction
Coral Reefs
Coral reefs are part of the intrinsic nature of the tropics, which includes soft sandybeaches, coconut palms, crystal-clear waters and beautiful coral gardens flourishing withcolourful fishes. Coral reefs are sometimes referred to as the flowers of the ocean (Chouet al. 1994) but reefs are not only aesthetically beautiful; they are a vital element of marineecology.
A coral reef is an ecosystem in which stony corals and calcareous algae dominate innumber and volume and provide niches for other animals and plants (Soekarno 1989).Corals and calcareous algae are unique because these marine organisms build their ownbase structures and continue building upwards and outwards as they grow (Chou et al.1994, Wilkinson 1994). Coral reefs have very specific requirements for growth and areusually found in very clean, low-nutrient waters. Ideal conditions are tropical waters wheretemperatures rarely go above 30oC or below 18oC; shallow parts of the photic (sunlight)zone, above a depth of 30 m; low levels of nutrients, sediments and suspended algalplankton concentrations in the water; and low levels of natural physical disturbances(Wilkinson & Ridzwan 1994).
The importance of coral reefs
Coral reefs are a prized natural resource because they support a vast array of benefits,including cultural, social, biological and economic values, otherwise known as ecosystemgoods and services. The value of these goods and services can be measured againsthuman development and economic impacts to assess the long-term benefits ofdevelopments. They are economically beneficial both locally and internationally. Economicbenefits come from the fisheries and pharmaceutical industries as well as and tourismindustry, as they attract SCUBA divers snorkelers and researchers. Locally, coral reefs area source of calcium carbonate and provide important coastal protection, which arecomponents of the reef’s ecological services. Globally, reefs are prized for their extremelyrich ecosystems, for supporting and maintaining high diversity and large marine organismbiomass, for its role in the carbon cycle, for its intrinsic existence value, and for theenjoyment SCUBA divers and other people derive from them (Pendleton 1995).
Status of coral reefs in Southeast Asia
The coral reefs in Southeast Asia have the highest degree of biodiversity and mostextensive coastlines of all the world’s coral reefs, with Indonesia, Malaysia (Sabah) andthe Philippines (together with Papua New Guinea) forming the global epicentre of marinespecies diversity: the Coral Triangle. Total coral reef area is nearly 100,000 km2,comprising nearly 34% of the world’s total coral reef area (Tun et al. 2004). SoutheastAsian coral reefs hold more than 75% of the world’s coral species (over 600 of the world’snearly 800 reef-building coral species) and more than 33% of the world’s reef fish species.They also contain nearly 75% of the world’s mangrove species and more than 45% of seagrass species (Burke et al. 2002, Tun et al. 2004).
11
© Biosphere Expeditions, an international not-for-profit conservation organisation registered in England, Germany, France, Australia and the USAOfficially accredited member of the United Nations Environment Programme's Governing Council & Global Ministerial Environment ForumOfficially accredited member of the International Union for the Conservation of Nature
For thousands of years people have coexisted with coral reef ecosystems in SoutheastAsia, enjoying the goods and services, protection and contribution to coastal culture andlifestyle provided by this diverse ecosystem (Burke et al. 2002). However, Southeast Asiancoral reefs are also the world’s most threatened and damaged reefs, facing unprecedentedthreat from human activities (Tun et al. 2004). The reefs of the Philippines, Vietnam,Singapore, Cambodia and Taiwan are some of the most threatened in Southeast Asia,each with more than 95% of reefs in danger. Indonesia (over 85% of its coral reefsthreatened) and the Philippines together hold 77% of Southeast Asian reefs and 79% ofSoutheast Asian threatened reefs. The reefs off the Nusa Tenggara chain in Indonesia;Okinawa, Japan; and Sabah, East Malaysia are also highly threatened (Burke et al. 2002).According to Wilkinson (2004), there are hardly any encouraging signs of recovery forSoutheast Asian reefs, where human pressures continue to increase. The degradation ofthese resources is coincident with the globalisation of natural resource markets (e.g.fishing, mariculture and tourism) in line with a significant increase in the human populationover the past 30 years.
Status of coral reefs in Malaysia
The 9323 km of coastline in Malaysia is estimated to have about 3600 km2 of fringingreefs, patch reefs and atoll reefs (Tun et al. 2004). Little reef development occurs alongthe heavily sedimented west coast of Peninsular (or West) Malaysia, but the east coast ofWest Malaysia has some fringing reefs along the coast and many oceanic reefs aroundthe offshore islands (Wilkinson 1994, Burke et al. 2002). East Malaysia consists of theMalaysian states of Sabah and Sarawak, and makes up the northern one-third of theisland of Borneo. Due to high sedimentation and land-based pollution, reef developmentaround Sarawak is limited (Burke et al. 2002). However, Sabah has reefs along nearly theentire coastline and surrounding most islands (Pilcher & Cabanban 2000).
A total of 346 hard coral species have been recorded in Malaysia, and many WestMalaysian coral reefs are protected as Marine Parks and Reserves under the Fisheries Act1985 (Wilkinson 1994). In East Malaysia, the coral reefs in northeast and southwestSarawak are protected by the Department of Fisheries Sarawak, and many of the coralreefs in Sabah are protected by Sabah Parks. Studies of coral reefs in Malaysia show thatnearly one-third of the reefs have between 25 and 50% live coral cover, very few reefshave more than 75% live coral cover (Tun et al. 2004), and over 85% of the reefs arethreatened by human activities (Burke et al. 2002).
The Tioman Archipelago
Tioman Island is located some 50 km from Mersing, off the east coast of Pahang,Malaysia. It is the largest island off the east coast of Peninsular Malaysia. The island hasfive villages, with a total population of approximately 3000, most of whom work in tourism,the main industry on the islands. The islands have been gazetted as a Marine Park since1994 (Reef Check Malaysia 2012).
Diving and snorkelling are the main tourist activities. The island has long been a populartourist destination, though in recent years it has been eclipsed by other destinations(particularly Redang and Perhentian). As a result, resort development has been at aslower pace, with no significant new resorts in the last 12 years. There are some 40resorts on the island, mainly small family-run operations, and 15 dive operators (ReefCheck Malaysia 2012).
12
© Biosphere Expeditions, an international not-for-profit conservation organisation registered in England, Germany, France, Australia and the USAOfficially accredited member of the United Nations Environment Programme's Governing Council & Global Ministerial Environment ForumOfficially accredited member of the International Union for the Conservation of Nature
There is a small power generation station on the island, supplying electricity to all areas.The island has abundant fresh water, and a municipal incinerator was constructed sometime ago. The island is served by an airport as well as ferry boat services (Reef CheckMalaysia 2012).
Reefs are mainly fringing offshore reefs, with some submerged reefs (Reef CheckMalaysia 2012).
Pemanggil Island
Pemanggil Island is approximately 45 km east of Mersing off the east coast of PeninsularMalaysia. The island and its surrounding waters were gazetted as Marine Parks in 1994under the Fisheries Act 1985 (Amended 1993) (Reef Check Malaysia 2012).
The island is sparsely populated with few villages and has for many years been a frequentstopover point for fishermen. There are also a small number of resorts on the island (ReefCheck Malaysia 2012).
Project aims
Various researchers and organisations, including Reef Check Malaysia, have carried outstudies in the Tioman Archipelago, but studies have mainly been limited to sites withineasy access of the dive centres fringing the northwest coast of the island. In addition, afew (such as Reef Check Malaysia) have included ecosystem-wide, long-term, repeatedsurveys, which allow changes over time to be assessed.
The research objectives of this project were to: (1) monitor the health of the reefs, (2)assess impacts that may be damaging their health, (3) set up baseline surveys that can becontinued regularly and well into the future and (4) extend studies to sites that have not yetbeen studied. The aims of these objectives are to (1) gain a fuller understanding of thereefs within the Tioman Archipelago, (2) feed this information back to park managementand (3) disseminate ecological information to the scientific community.
2.2. Methods
Reef Check survey
The Reef Check survey methodology was designed to assess the health of coral reefs andfocuses on the abundance of particular coral reef organisms that are widely distributed oncoral reefs, are easy for non-scientists to identify and provide information about the healthof a coral reef.
Using a standardised, easy to learn yet scientifically robust methodology, data fromsurveys in different sites can be compared, whether on an island, regional, national orinternational basis (see www.reefcheck.org for more details).
13
© Biosphere Expeditions, an international not-for-profit conservation organisation registered in England, Germany, France, Australia and the USAOfficially accredited member of the United Nations Environment Programme's Governing Council & Global Ministerial Environment ForumOfficially accredited member of the International Union for the Conservation of Nature
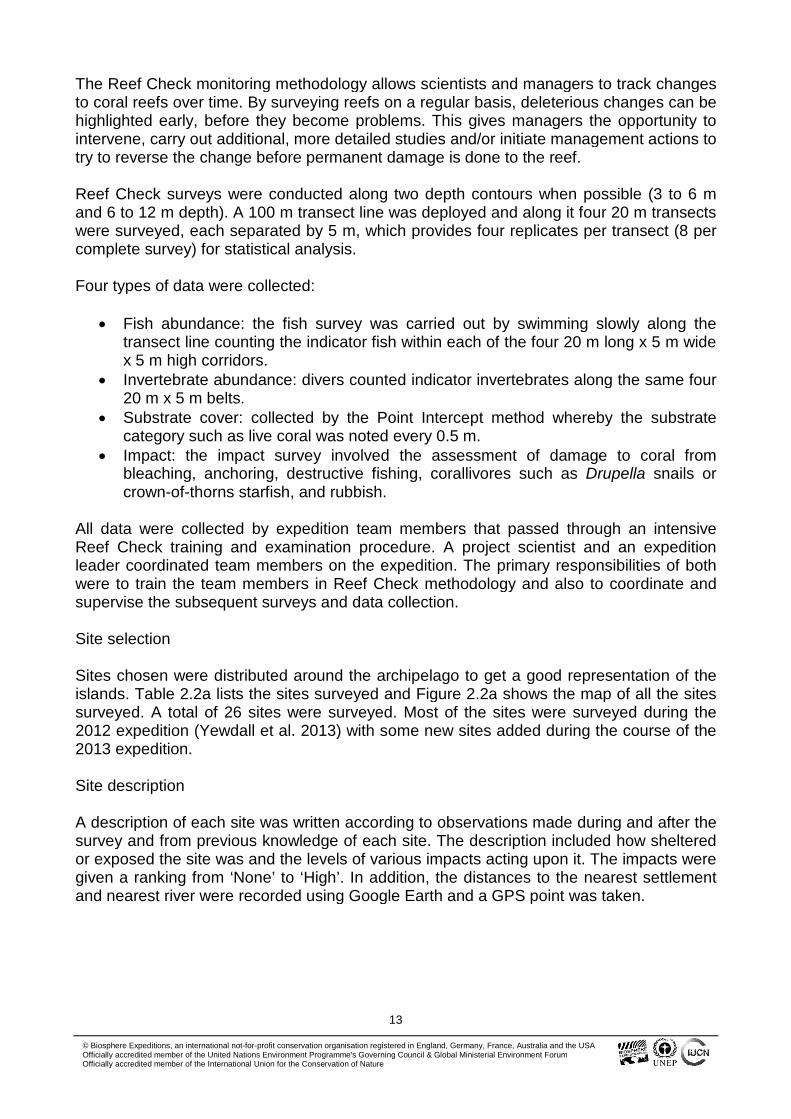
The Reef Check monitoring methodology allows scientists and managers to track changesto coral reefs over time. By surveying reefs on a regular basis, deleterious changes can behighlighted early, before they become problems. This gives managers the opportunity tointervene, carry out additional, more detailed studies and/or initiate management actions totry to reverse the change before permanent damage is done to the reef.
Reef Check surveys were conducted along two depth contours when possible (3 to 6 mand 6 to 12 m depth). A 100 m transect line was deployed and along it four 20 m transectswere surveyed, each separated by 5 m, which provides four replicates per transect (8 percomplete survey) for statistical analysis.
Four types of data were collected:
Fish abundance: the fish survey was carried out by swimming slowly along thetransect line counting the indicator fish within each of the four 20 m long x 5 m widex 5 m high corridors.
Invertebrate abundance: divers counted indicator invertebrates along the same four20 m x 5 m belts.
Substrate cover: collected by the Point Intercept method whereby the substratecategory such as live coral was noted every 0.5 m.
Impact: the impact survey involved the assessment of damage to coral frombleaching, anchoring, destructive fishing, corallivores such as Drupella snails orcrown-of-thorns starfish, and rubbish.
All data were collected by expedition team members that passed through an intensiveReef Check training and examination procedure. A project scientist and an expeditionleader coordinated team members on the expedition. The primary responsibilities of bothwere to train the team members in Reef Check methodology and also to coordinate andsupervise the subsequent surveys and data collection.
Site selection
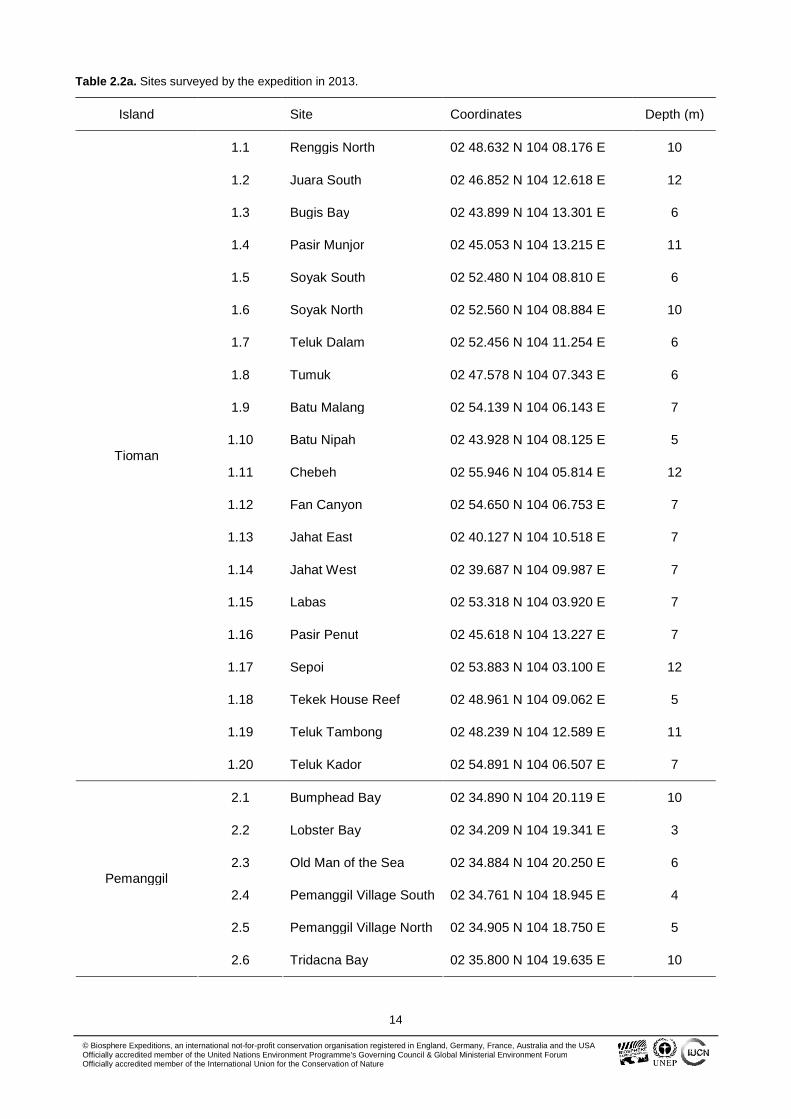
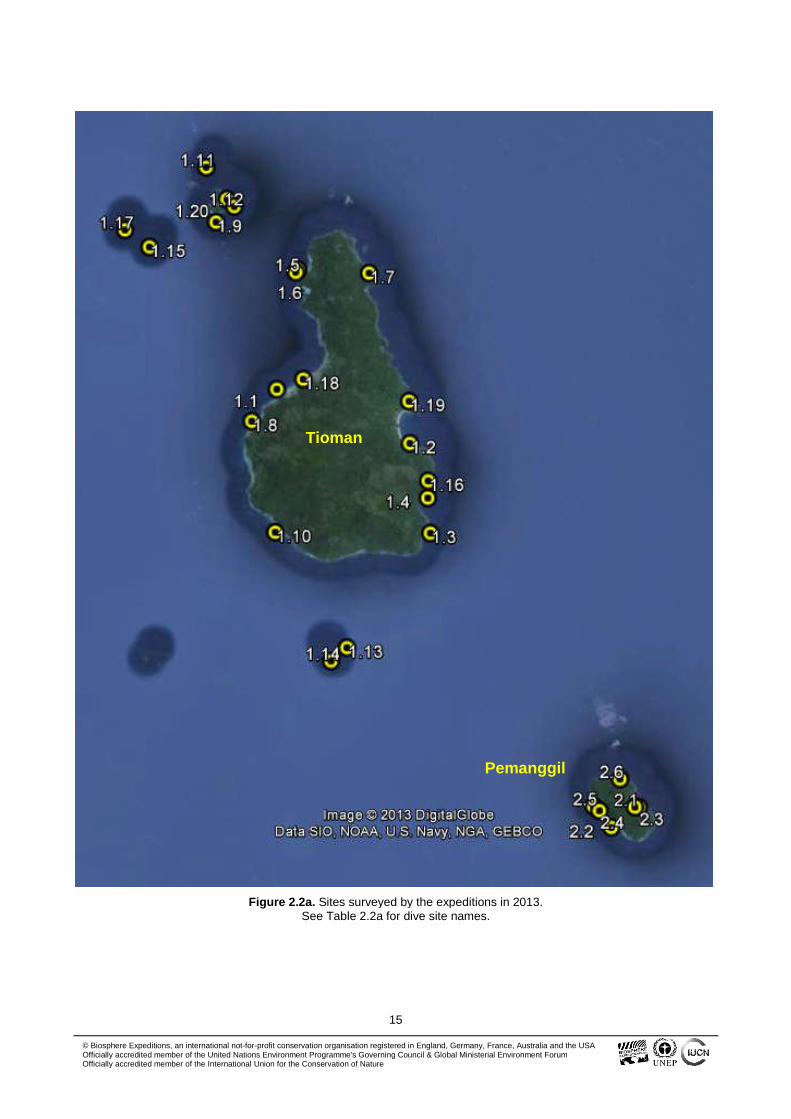
Sites chosen were distributed around the archipelago to get a good representation of theislands. Table 2.2a lists the sites surveyed and Figure 2.2a shows the map of all the sitessurveyed. A total of 26 sites were surveyed. Most of the sites were surveyed during the2012 expedition (Yewdall et al. 2013) with some new sites added during the course of the2013 expedition.
Site description
A description of each site was written according to observations made during and after thesurvey and from previous knowledge of each site. The description included how shelteredor exposed the site was and the levels of various impacts acting upon it. The impacts weregiven a ranking from ‘None’ to ‘High’. In addition, the distances to the nearest settlementand nearest river were recorded using Google Earth and a GPS point was taken.
14
© Biosphere Expeditions, an international not-for-profit conservation organisation registered in England, Germany, France, Australia and the USAOfficially accredited member of the United Nations Environment Programme's Governing Council & Global Ministerial Environment ForumOfficially accredited member of the International Union for the Conservation of Nature
Table 2.2a. Sites surveyed by the expedition in 2013.
Island Site Coordinates Depth (m)
1.1 Renggis North 02 48.632 N 104 08.176 E 10
1.2 Juara South 02 46.852 N 104 12.618 E 12
1.3 Bugis Bay 02 43.899 N 104 13.301 E 6
1.4 Pasir Munjor 02 45.053 N 104 13.215 E 11
1.5 Soyak South 02 52.480 N 104 08.810 E 6
1.6 Soyak North 02 52.560 N 104 08.884 E 10
1.7 Teluk Dalam 02 52.456 N 104 11.254 E 6
1.8 Tumuk 02 47.578 N 104 07.343 E 6
1.9 Batu Malang 02 54.139 N 104 06.143 E 7
1.10 Batu Nipah 02 43.928 N 104 08.125 E 5
1.11 Chebeh 02 55.946 N 104 05.814 E 12
1.12 Fan Canyon 02 54.650 N 104 06.753 E 7
1.13 Jahat East 02 40.127 N 104 10.518 E 7
1.14 Jahat West 02 39.687 N 104 09.987 E 7
1.15 Labas 02 53.318 N 104 03.920 E 7
1.16 Pasir Penut 02 45.618 N 104 13.227 E 7
1.17 Sepoi 02 53.883 N 104 03.100 E 12
1.18 Tekek House Reef 02 48.961 N 104 09.062 E 5
1.19 Teluk Tambong 02 48.239 N 104 12.589 E 11
Tioman
1.20 Teluk Kador 02 54.891 N 104 06.507 E 7
2.1 Bumphead Bay 02 34.890 N 104 20.119 E 10
2.2 Lobster Bay 02 34.209 N 104 19.341 E 3
2.3 Old Man of the Sea 02 34.884 N 104 20.250 E 6
2.4 Pemanggil Village South 02 34.761 N 104 18.945 E 4
2.5 Pemanggil Village North 02 34.905 N 104 18.750 E 5
Pemanggil
2.6 Tridacna Bay 02 35.800 N 104 19.635 E 10
15
© Biosphere Expeditions, an international not-for-profit conservation organisation registered in England, Germany, France, Australia and the USAOfficially accredited member of the United Nations Environment Programme's Governing Council & Global Ministerial Environment ForumOfficially accredited member of the International Union for the Conservation of Nature
Figure 2.2a. Sites surveyed by the expeditions in 2013.See Table 2.2a for dive site names.
Tioman
Pemanggil
16
© Biosphere Expeditions, an international not-for-profit conservation organisation registered in England, Germany, France, Australia and the USAOfficially accredited member of the United Nations Environment Programme's Governing Council & Global Ministerial Environment ForumOfficially accredited member of the International Union for the Conservation of Nature
Fish belt transect
First a 100 m long tape was laid along the reef to define the transect. A lag period of 15minutes before starting the fish visual survey was allowed after tape laying. The waitingperiod is necessary to allow fishes to resume normal behaviour after being disturbed bythe diver laying the transect (Hodgson et al. 2006).
Fish species commonly targeted by fishermen and aquarium collectors seen within 2.5 mof either side of the tape and up to 5 m above the tape were counted. Data were recordedon underwater slates by swimming over the transect tape very slowly. The indicator fishare butterflyfish (Chaetodontidae), sweetlips (Haemulidae), snappers (Lutjanidae),Barramundi cod (Cromileptes altivelis), humphead wrasse (Cheilinus undulatus),bumphead parrotfish (Bolbometopon muricatum), parrotfish (Scaridae) over 20 cm, morayeel (Muraenidae) and grouper (Serranidae) over 30 cm and in 10 cm increments (Hodgsonet al. 2006).
Invertebrate belt transect
The invertebrate survey was similar to the fish visual survey (Hodgson et al. 2006).Invertebrates commonly targeted as food species or collected as curios were counted anddata were recorded on underwater slates. The indicator species were: banded coralshrimp (Stenopus hispidus), long-spined black sea urchin or Diadema urchins (Diademaspp.), pencil urchin (Eucidaris spp.), collector urchin (Tripneustes spp.), sea cucumberspecies Thelenota ananas, Stichopus chloronotus, Holothuria edulis, lobster (all ediblespecies), triton (Charonia tritonis) and crown-of-thorns starfish (Acanthaster planci).
Impact assessment
During the invertebrate survey, human impacts were also assessed. These included coraldamage by boat/anchor, dynamite, ‘other’ damage, and trash by types (fish nets or generaltrash). The scale of these impacts was assessed using a 0 to 3 scale (0 = none 1 = low 2 =medium, 3 = high). The percentage cover of bleaching and coral disease in the coral reef(colony and population) was also assessed during the surveys (Hodgson et al. 2006).
Substrate line transect
Starting from 0 m, at every 0.5 m along the transect tape, the substrate category code wasrecorded on an underwater slate. The categories recorded were according to Reef Checkdefinitions: hard coral (HC), soft coral (SC), recently killed coral (RKC), nutrient indicatoralgae (NIA), sponge (SP), rock (RC), rubble (RB), sand (SD), silt (SI) and other (OT). Alldives were performed with fish recording being conducted just before invertebrate andsubstrate recording, using the same transect tape.
Data analysis
All data were entered on underwater slates and immediately transferred onto Reef CheckExcel sheets after each survey dive. Belt transect data were used to calculate the meanabundance of each fish and invertebrate taxon. The substrate line transect data wereconverted to mean percentage cover of each substratum category. Anthropogenic datawere represented by mean abundance of each impact.
17
© Biosphere Expeditions, an international not-for-profit conservation organisation registered in England, Germany, France, Australia and the USAOfficially accredited member of the United Nations Environment Programme's Governing Council & Global Ministerial Environment ForumOfficially accredited member of the International Union for the Conservation of Nature
2.3. Results
Status of Reefs within the Tioman Archipelago
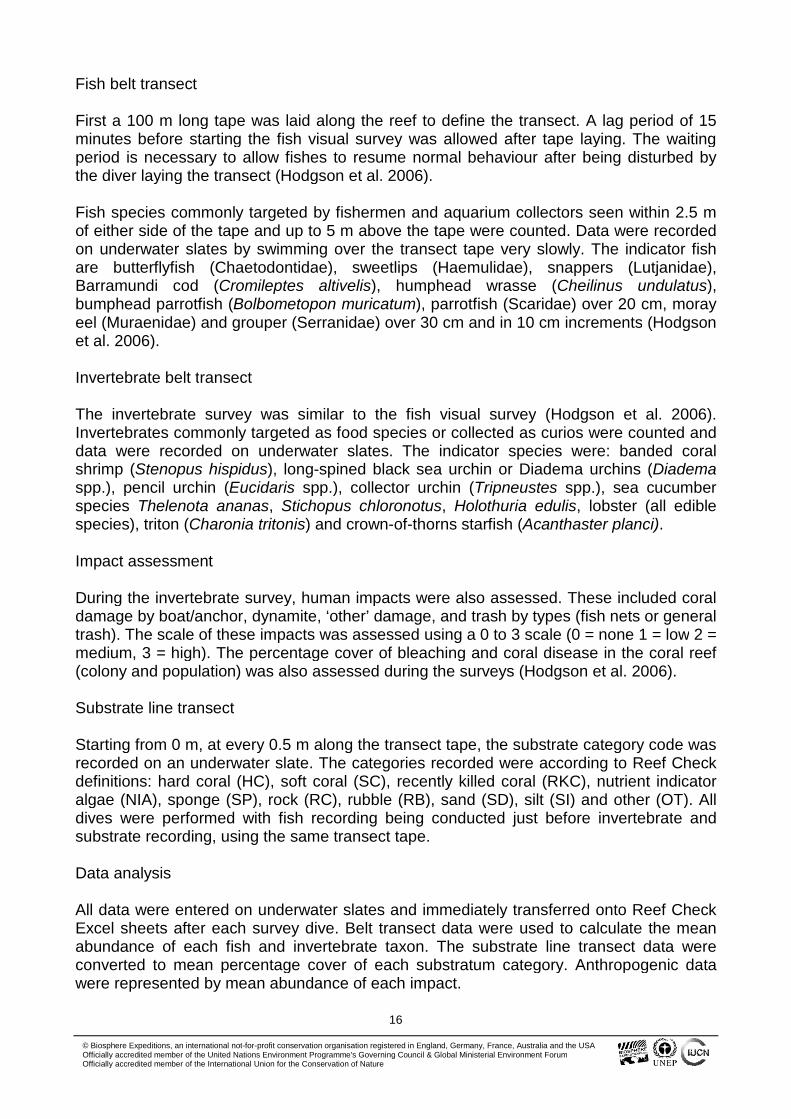
The results from all 26 surveys were compiled to provide an overview of the status of coralreefs within the Tioman Archipelago. Results showed that reefs were in ‘good’ condition(based on the Coral Reef Health Criteria developed by Chou et al. 1994) with a totalaverage of 52.50% live coral (hard coral, HC + soft coral, SC) cover (Fig. 2.3a). Thisaverage is higher than the national average of 46.37% recorded in 2012 (Reef CheckMalaysia 2013).
Figure 2.3a. Average percentage of substrate cover per 100 m within the Tioman Archipelago
At 3.56% (Fig. 2.3a), a higher amount of nutrient indicator algae (NIA) was recordedcompared to the findings of the 2012 expedition (3.18%) (Yewdall et al. 2013) and thenational average of 2.71% (Reef Check Malaysia 2013). This amount is consideredmanageable and not an immediate cause of concern. However, if NIA levels showincreasing trends in the coming years, more attention must be paid to its causes.
Recently killed coral (RKC) results from a variety of natural and human impacts wererecorded at a low level (1.15%), while Rock (RC), which is critical for reef recovery,regeneration and extension, is considered normal at 23.82% (Fig. 2.3a). The average levelof rubble (RB) recorded on reefs in 2013 (11.30%) was similar to the national average in2012 (11.85%) (Reef Check Malaysia 2013).
Sand (SD), a natural component of reefs, can be expected to be found on any surveys.The current level of SD (4.93%) is within normal range. Sponge (SP), another naturalcomponent of reefs and an indicator of nutrient input, appears normal at 1.8% (2.11% in2012). The average level of silt (SI) on reefs within the archipelago is low at 0.14% and theaverage level of other (OT) was 0.65% (Fig. 2.3a).
18
© Biosphere Expeditions, an international not-for-profit conservation organisation registered in England, Germany, France, Australia and the USAOfficially accredited member of the United Nations Environment Programme's Governing Council & Global Ministerial Environment ForumOfficially accredited member of the International Union for the Conservation of Nature
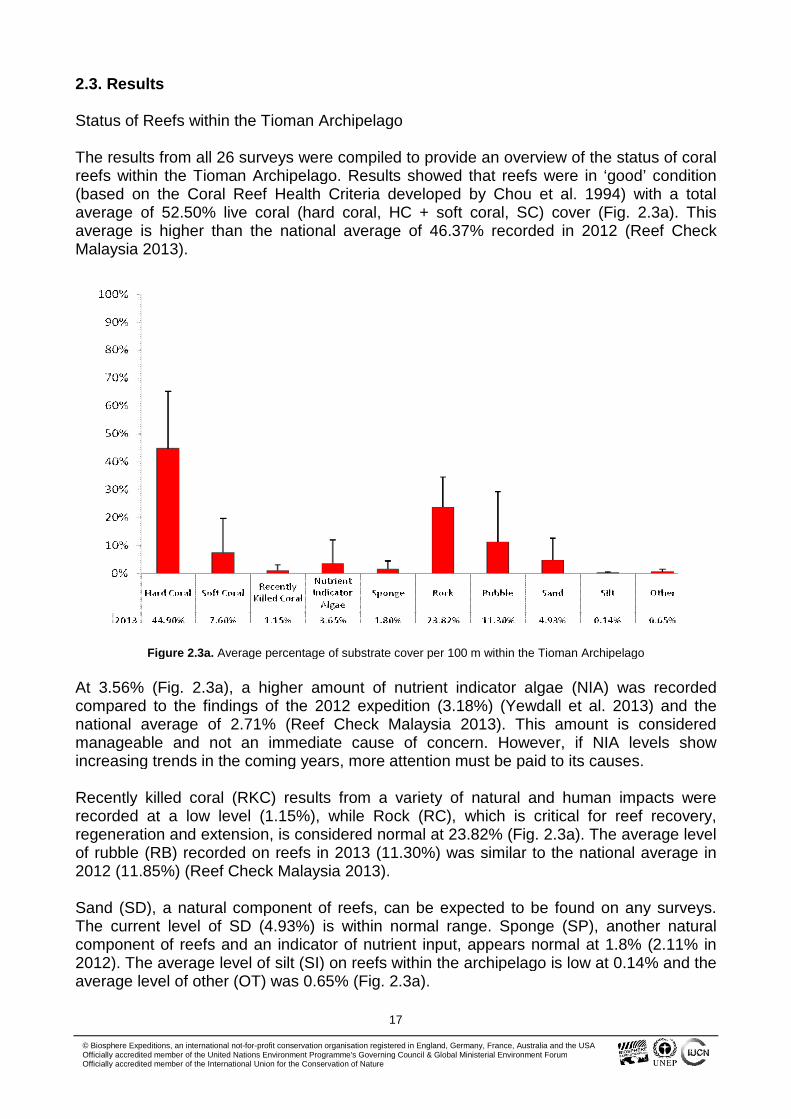
Figure 2.3b. Average number of individuals per 500 m3
within the Tioman Archipelago
Abundance of several fish that are targeted for food is low in most of the areas wheresurveys have been conducted (Fig. 2.3b), with abundance of many being below 1individual per 500 m3 survey transect (including sweetlips, snappers, Barramundi cod,humphead wrasse, bumphead parrotfish and moray eel).
Groupers above 30 cm in length are considered high value food fish and were present invery low numbers (1.08 individuals per 500 m3 survey transect). Equally important arehealthy butterflyfish and parrotfish populations, but both were present in low numbers(3.85 and 3.36 individuals per 500 m3 survey transect respectively).
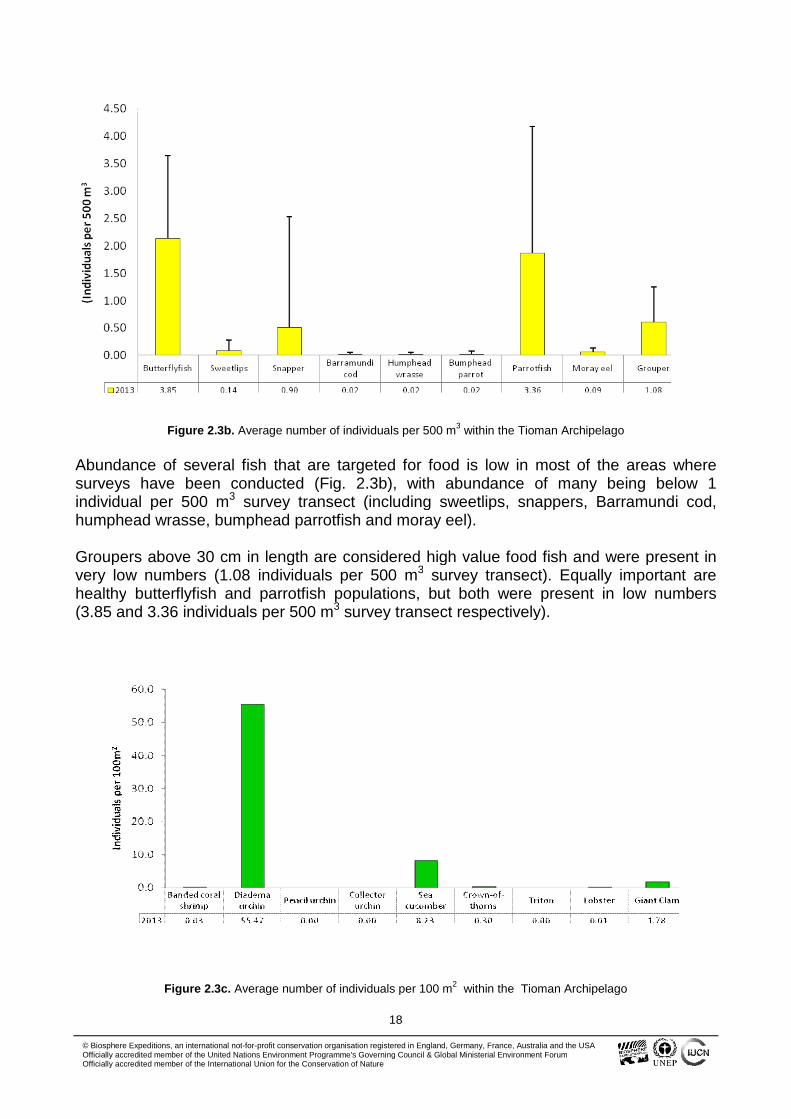
Figure 2.3c. Average number of individuals per 100 m2
within the Tioman Archipelago
19
© Biosphere Expeditions, an international not-for-profit conservation organisation registered in England, Germany, France, Australia and the USAOfficially accredited member of the United Nations Environment Programme's Governing Council & Global Ministerial Environment ForumOfficially accredited member of the International Union for the Conservation of Nature
Tritons, pencil urchins and collector urchins were absent during all surveys (Fig. 2.3c).Lobsters, which are a favourite seafood among tourists, were also absent during mostsurveys, with an average of only 0.01 individuals per 100 m2 survey transect. However,sea cucumber numbers were high, with an average of 8.23 individuals per 100 m2
compared to the national average of only 1.56 individuals per 100 m2 in 2012. Giant clamswere rarely seen, with an average of 1.78 individuals per 100 m2 (Fig. 2.3c).
Diadema urchin numbers were exceptionally high (55.47) compared to the nationalaverage of 35.36 individuals per 100 m2. However, their numbers have decreased inTioman compared to 2012 (70.97). Crown-of-thorns starfish (COTS) feed on corals andcan cause significant damage to coral reefs, destroying large areas in a short period oftime. According to CRC Reef Research Centre (Australia), a healthy coral reef can supporta population of 20-30 COT per hectare (10,000 m2), or 0.2-0.3 per 100 m2 (Harriott et al.2003) The abundance of COTs found during surveys (0.3 per 100 m2) is at the higher endof this range, suggesting that COT numbers are at the border of acceptable limits. Thesenumbers are also higher than the national average in 2012 (0.21 per 100m2).yet lower thanthose recorded in the 2012 surveys (0.46) by Yewdall et al. (2013).
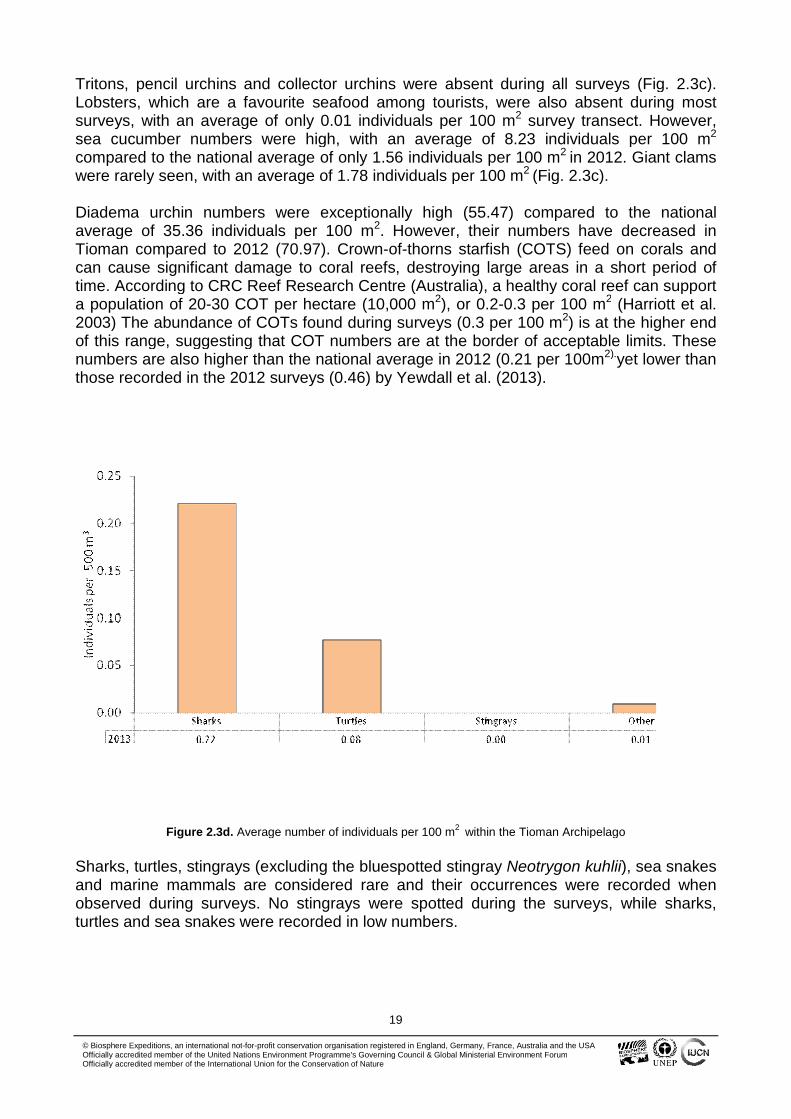
Figure 2.3d. Average number of individuals per 100 m2
within the Tioman Archipelago
Sharks, turtles, stingrays (excluding the bluespotted stingray Neotrygon kuhlii), sea snakesand marine mammals are considered rare and their occurrences were recorded whenobserved during surveys. No stingrays were spotted during the surveys, while sharks,turtles and sea snakes were recorded in low numbers.
20
© Biosphere Expeditions, an international not-for-profit conservation organisation registered in England, Germany, France, Australia and the USAOfficially accredited member of the United Nations Environment Programme's Governing Council & Global Ministerial Environment ForumOfficially accredited member of the International Union for the Conservation of Nature
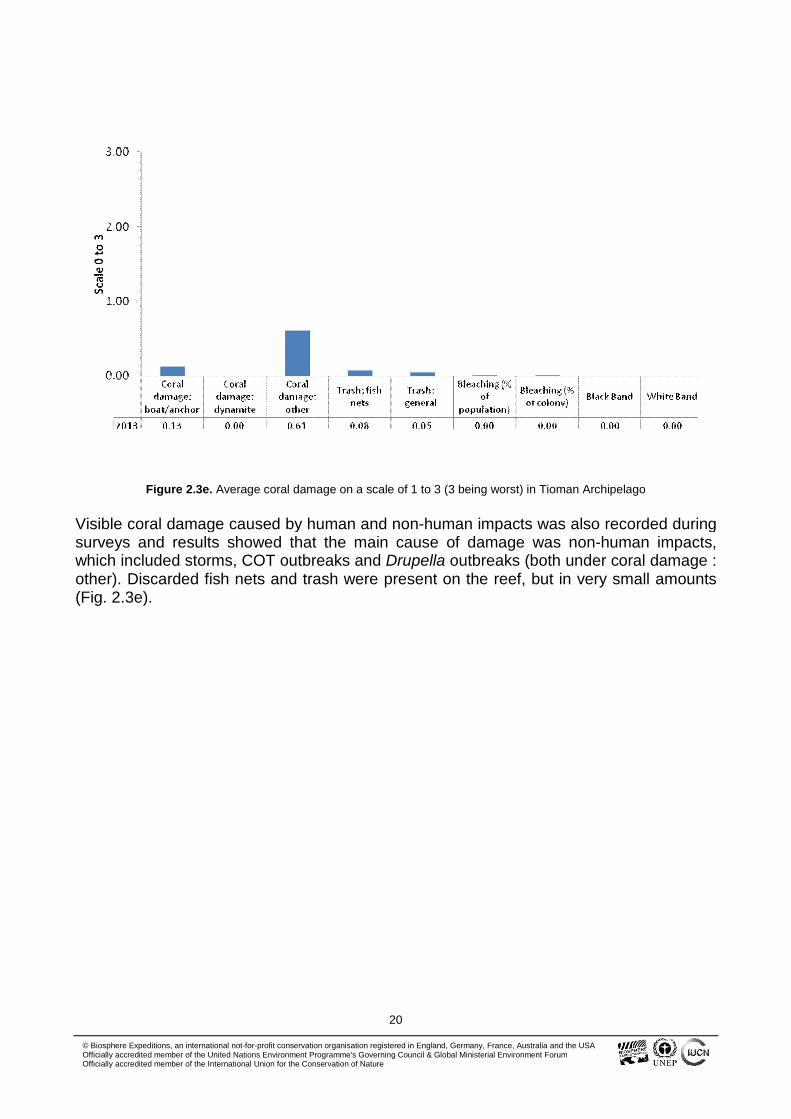
Figure 2.3e. Average coral damage on a scale of 1 to 3 (3 being worst) in Tioman Archipelago
Visible coral damage caused by human and non-human impacts was also recorded duringsurveys and results showed that the main cause of damage was non-human impacts,which included storms, COT outbreaks and Drupella outbreaks (both under coral damage :other). Discarded fish nets and trash were present on the reef, but in very small amounts(Fig. 2.3e).
21
© Biosphere Expeditions, an international not-for-profit conservation organisation registered in England, Germany, France, Australia and the USAOfficially accredited member of the United Nations Environment Programme's Governing Council & Global Ministerial Environment ForumOfficially accredited member of the International Union for the Conservation of Nature
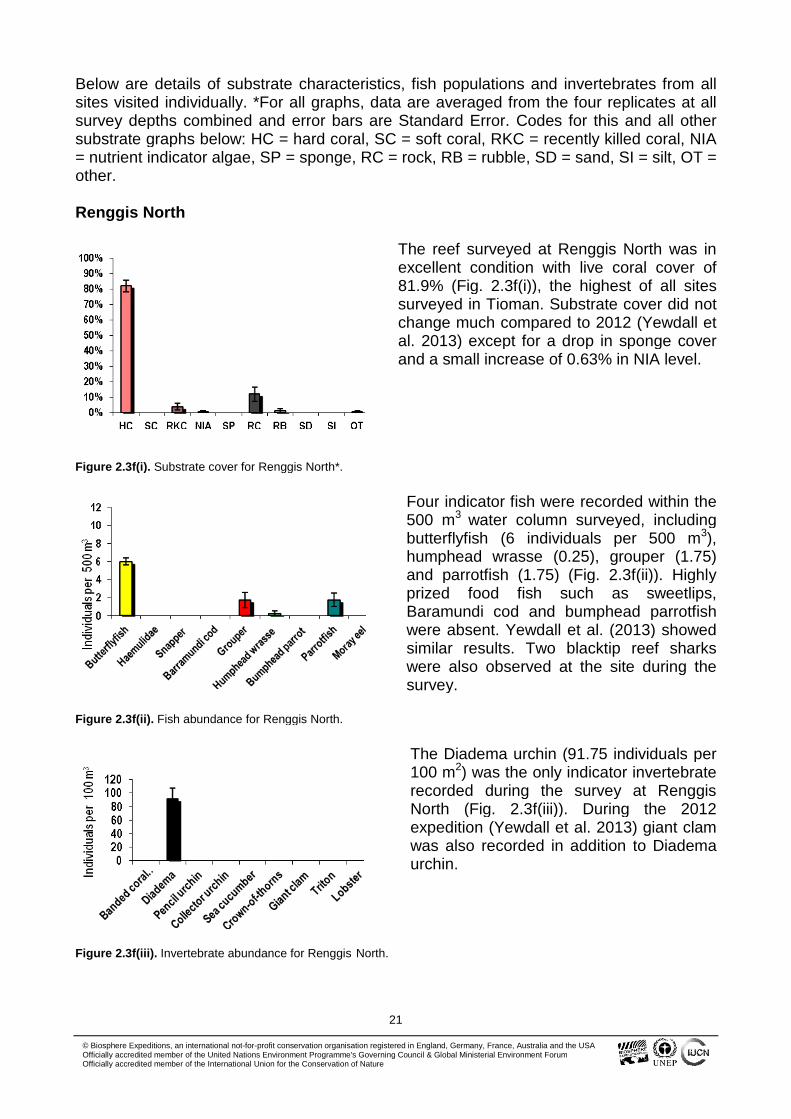
Below are details of substrate characteristics, fish populations and invertebrates from allsites visited individually. *For all graphs, data are averaged from the four replicates at allsurvey depths combined and error bars are Standard Error. Codes for this and all othersubstrate graphs below: HC = hard coral, SC = soft coral, RKC = recently killed coral, NIA= nutrient indicator algae, SP = sponge, RC = rock, RB = rubble, SD = sand, SI = silt, OT =other.
Renggis North
The reef surveyed at Renggis North was inexcellent condition with live coral cover of81.9% (Fig. 2.3f(i)), the highest of all sitessurveyed in Tioman. Substrate cover did notchange much compared to 2012 (Yewdall etal. 2013) except for a drop in sponge coverand a small increase of 0.63% in NIA level.
Figure 2.3f(i). Substrate cover for Renggis North*.
Four indicator fish were recorded within the500 m3 water column surveyed, includingbutterflyfish (6 individuals per 500 m3),humphead wrasse (0.25), grouper (1.75)and parrotfish (1.75) (Fig. 2.3f(ii)). Highlyprized food fish such as sweetlips,Baramundi cod and bumphead parrotfishwere absent. Yewdall et al. (2013) showedsimilar results. Two blacktip reef sharkswere also observed at the site during thesurvey.
Figure 2.3f(ii). Fish abundance for Renggis North.
The Diadema urchin (91.75 individuals per100 m2) was the only indicator invertebraterecorded during the survey at RenggisNorth (Fig. 2.3f(iii)). During the 2012expedition (Yewdall et al. 2013) giant clamwas also recorded in addition to Diademaurchin.
Figure 2.3f(iii). Invertebrate abundance for Renggis North.
22
© Biosphere Expeditions, an international not-for-profit conservation organisation registered in England, Germany, France, Australia and the USAOfficially accredited member of the United Nations Environment Programme's Governing Council & Global Ministerial Environment ForumOfficially accredited member of the International Union for the Conservation of Nature
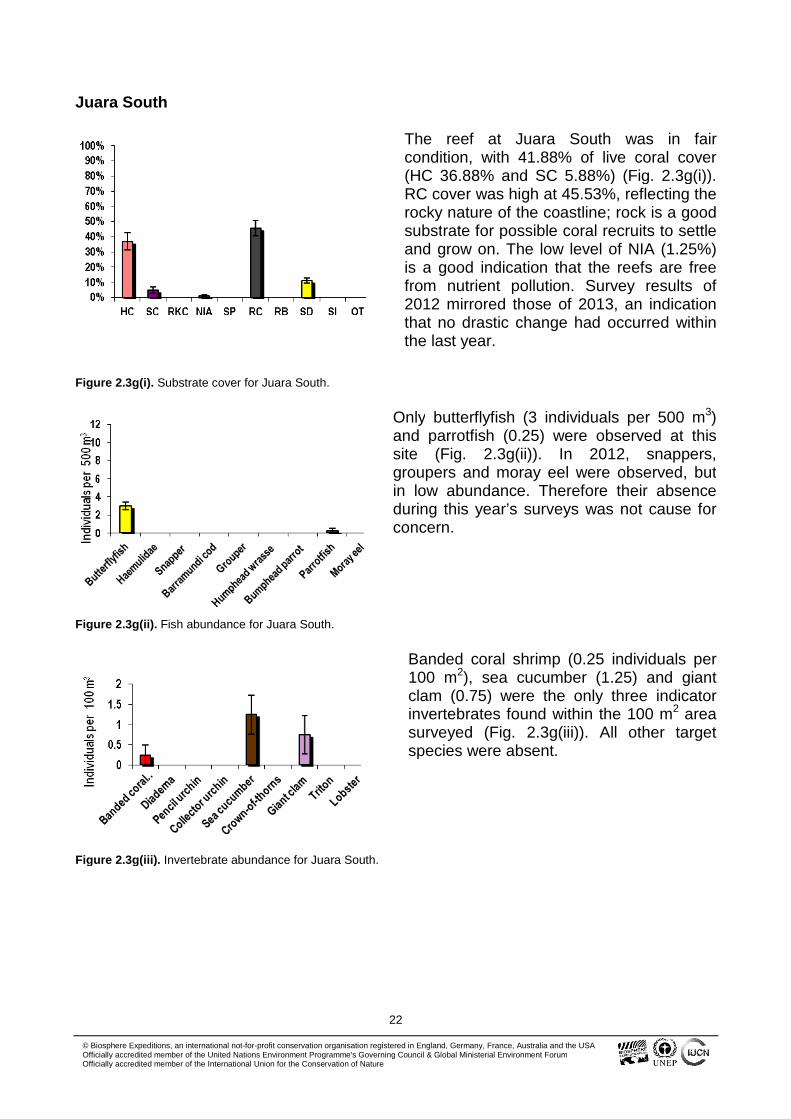
Juara South
The reef at Juara South was in faircondition, with 41.88% of live coral cover(HC 36.88% and SC 5.88%) (Fig. 2.3g(i)).RC cover was high at 45.53%, reflecting therocky nature of the coastline; rock is a goodsubstrate for possible coral recruits to settleand grow on. The low level of NIA (1.25%)is a good indication that the reefs are freefrom nutrient pollution. Survey results of2012 mirrored those of 2013, an indicationthat no drastic change had occurred withinthe last year.
Figure 2.3g(i). Substrate cover for Juara South.
Only butterflyfish (3 individuals per 500 m3)and parrotfish (0.25) were observed at thissite (Fig. 2.3g(ii)). In 2012, snappers,groupers and moray eel were observed, butin low abundance. Therefore their absenceduring this year’s surveys was not cause forconcern.
Figure 2.3g(ii). Fish abundance for Juara South.
Banded coral shrimp (0.25 individuals per100 m2), sea cucumber (1.25) and giantclam (0.75) were the only three indicatorinvertebrates found within the 100 m2 areasurveyed (Fig. 2.3g(iii)). All other targetspecies were absent.
Figure 2.3g(iii). Invertebrate abundance for Juara South.
23
© Biosphere Expeditions, an international not-for-profit conservation organisation registered in England, Germany, France, Australia and the USAOfficially accredited member of the United Nations Environment Programme's Governing Council & Global Ministerial Environment ForumOfficially accredited member of the International Union for the Conservation of Nature
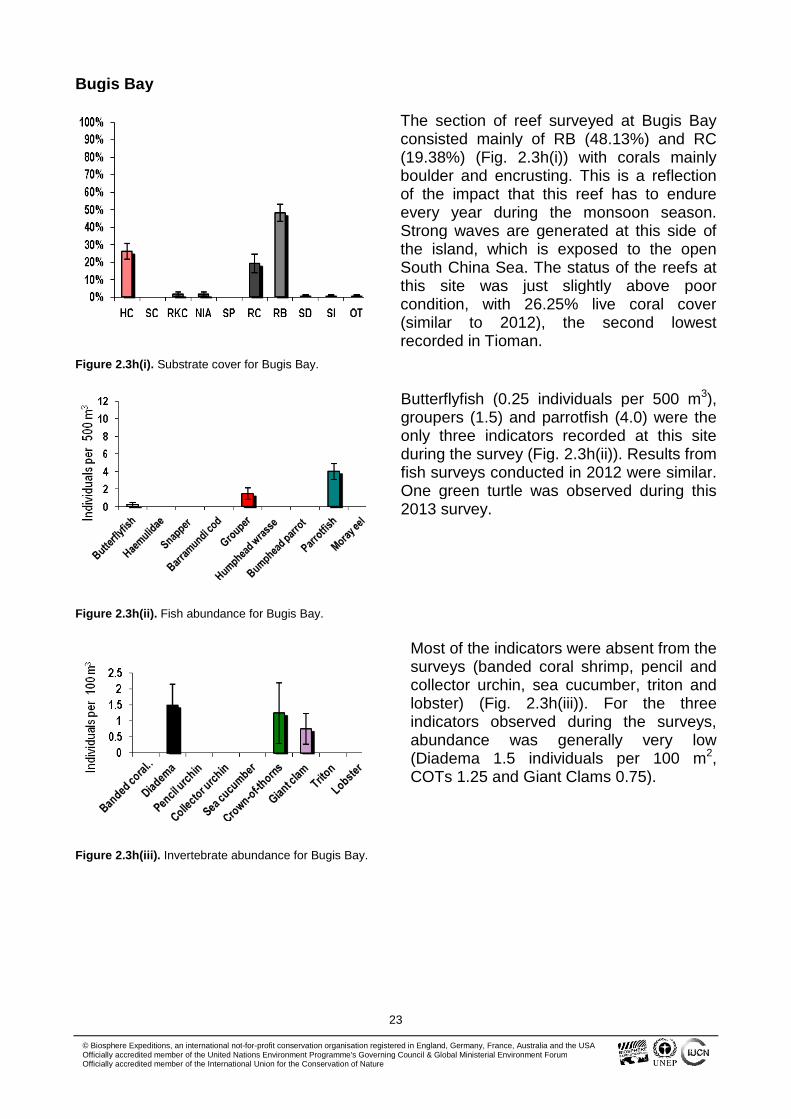
Bugis Bay
The section of reef surveyed at Bugis Bayconsisted mainly of RB (48.13%) and RC(19.38%) (Fig. 2.3h(i)) with corals mainlyboulder and encrusting. This is a reflectionof the impact that this reef has to endureevery year during the monsoon season.Strong waves are generated at this side ofthe island, which is exposed to the openSouth China Sea. The status of the reefs atthis site was just slightly above poorcondition, with 26.25% live coral cover(similar to 2012), the second lowestrecorded in Tioman.
Figure 2.3h(i). Substrate cover for Bugis Bay.
Butterflyfish (0.25 individuals per 500 m3),groupers (1.5) and parrotfish (4.0) were theonly three indicators recorded at this siteduring the survey (Fig. 2.3h(ii)). Results fromfish surveys conducted in 2012 were similar.One green turtle was observed during this2013 survey.
Figure 2.3h(ii). Fish abundance for Bugis Bay.
Most of the indicators were absent from thesurveys (banded coral shrimp, pencil andcollector urchin, sea cucumber, triton andlobster) (Fig. 2.3h(iii)). For the threeindicators observed during the surveys,abundance was generally very low(Diadema 1.5 individuals per 100 m2,COTs 1.25 and Giant Clams 0.75).
Figure 2.3h(iii). Invertebrate abundance for Bugis Bay.
24
© Biosphere Expeditions, an international not-for-profit conservation organisation registered in England, Germany, France, Australia and the USAOfficially accredited member of the United Nations Environment Programme's Governing Council & Global Ministerial Environment ForumOfficially accredited member of the International Union for the Conservation of Nature
Pasir Munjur
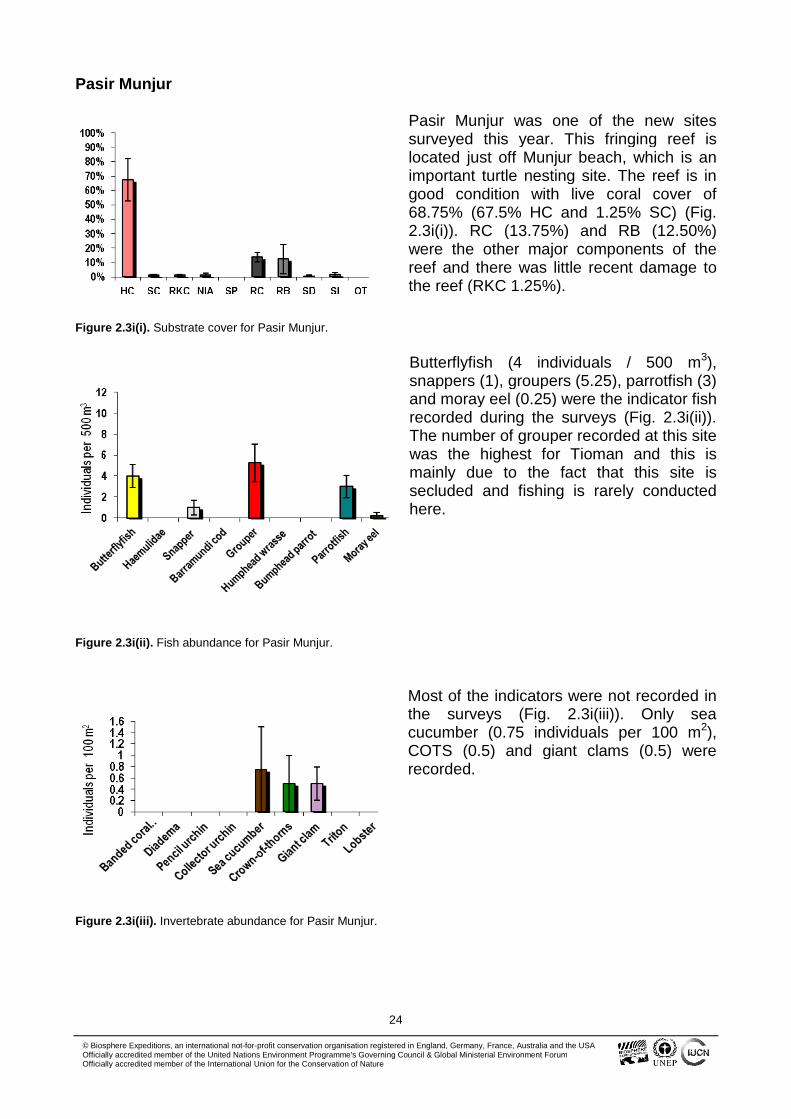
Pasir Munjur was one of the new sitessurveyed this year. This fringing reef islocated just off Munjur beach, which is animportant turtle nesting site. The reef is ingood condition with live coral cover of68.75% (67.5% HC and 1.25% SC) (Fig.2.3i(i)). RC (13.75%) and RB (12.50%)were the other major components of thereef and there was little recent damage tothe reef (RKC 1.25%).
Figure 2.3i(i). Substrate cover for Pasir Munjur.
Butterflyfish (4 individuals / 500 m3),snappers (1), groupers (5.25), parrotfish (3)and moray eel (0.25) were the indicator fishrecorded during the surveys (Fig. 2.3i(ii)).The number of grouper recorded at this sitewas the highest for Tioman and this ismainly due to the fact that this site issecluded and fishing is rarely conductedhere.
Figure 2.3i(ii). Fish abundance for Pasir Munjur.
Most of the indicators were not recorded inthe surveys (Fig. 2.3i(iii)). Only seacucumber (0.75 individuals per 100 m2),COTS (0.5) and giant clams (0.5) wererecorded.
Figure 2.3i(iii). Invertebrate abundance for Pasir Munjur.
25
© Biosphere Expeditions, an international not-for-profit conservation organisation registered in England, Germany, France, Australia and the USAOfficially accredited member of the United Nations Environment Programme's Governing Council & Global Ministerial Environment ForumOfficially accredited member of the International Union for the Conservation of Nature
Soyak South
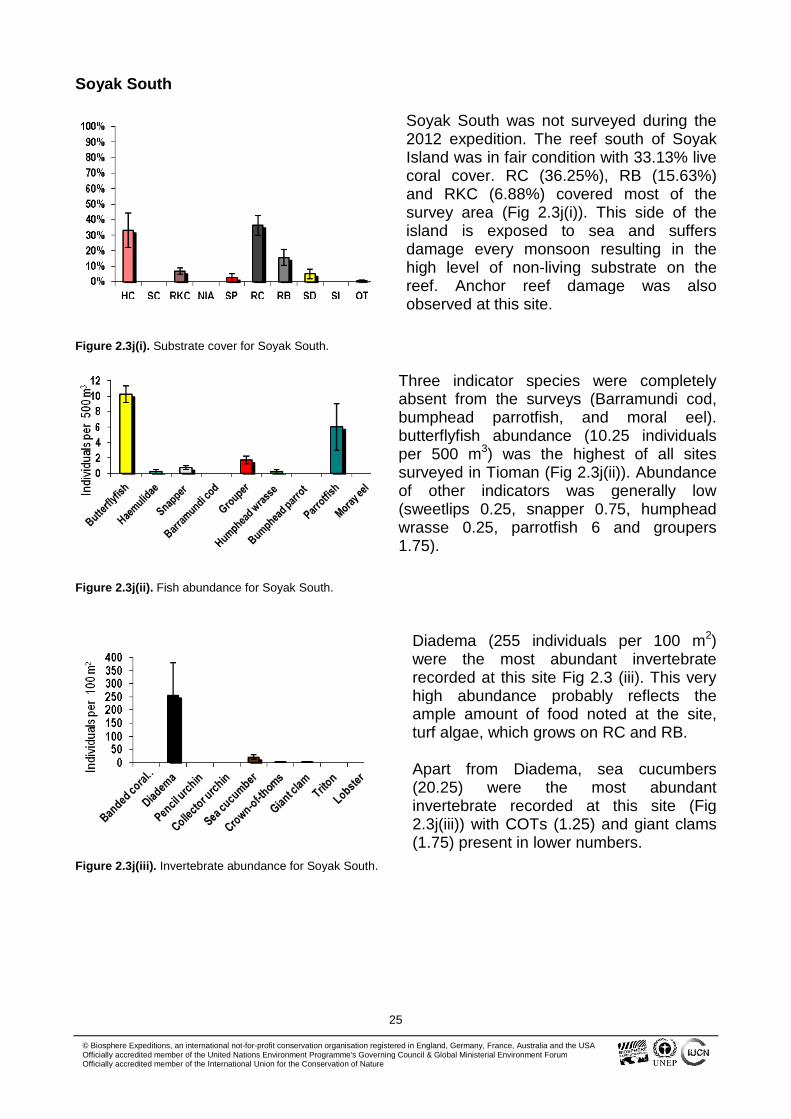
Soyak South was not surveyed during the2012 expedition. The reef south of SoyakIsland was in fair condition with 33.13% livecoral cover. RC (36.25%), RB (15.63%)and RKC (6.88%) covered most of thesurvey area (Fig 2.3j(i)). This side of theisland is exposed to sea and suffersdamage every monsoon resulting in thehigh level of non-living substrate on thereef. Anchor reef damage was alsoobserved at this site.
Figure 2.3j(i). Substrate cover for Soyak South.
Three indicator species were completelyabsent from the surveys (Barramundi cod,bumphead parrotfish, and moral eel).butterflyfish abundance (10.25 individualsper 500 m3) was the highest of all sitessurveyed in Tioman (Fig 2.3j(ii)). Abundanceof other indicators was generally low(sweetlips 0.25, snapper 0.75, humpheadwrasse 0.25, parrotfish 6 and groupers1.75).
Figure 2.3j(ii). Fish abundance for Soyak South.
Diadema (255 individuals per 100 m2)were the most abundant invertebraterecorded at this site Fig 2.3 (iii). This veryhigh abundance probably reflects theample amount of food noted at the site,turf algae, which grows on RC and RB.
Apart from Diadema, sea cucumbers(20.25) were the most abundantinvertebrate recorded at this site (Fig2.3j(iii)) with COTs (1.25) and giant clams(1.75) present in lower numbers.
Figure 2.3j(iii). Invertebrate abundance for Soyak South.
26
© Biosphere Expeditions, an international not-for-profit conservation organisation registered in England, Germany, France, Australia and the USAOfficially accredited member of the United Nations Environment Programme's Governing Council & Global Ministerial Environment ForumOfficially accredited member of the International Union for the Conservation of Nature
Soyak North
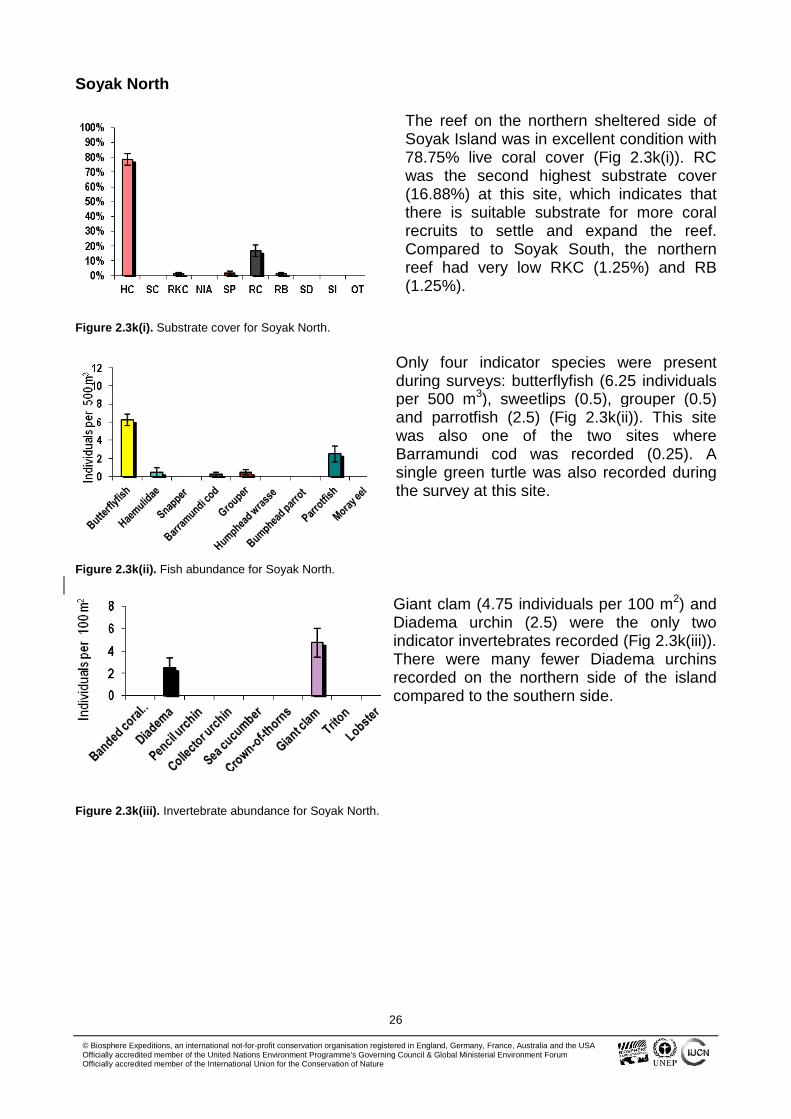
The reef on the northern sheltered side ofSoyak Island was in excellent condition with78.75% live coral cover (Fig 2.3k(i)). RCwas the second highest substrate cover(16.88%) at this site, which indicates thatthere is suitable substrate for more coralrecruits to settle and expand the reef.Compared to Soyak South, the northernreef had very low RKC (1.25%) and RB(1.25%).
Figure 2.3k(i). Substrate cover for Soyak North.
Only four indicator species were presentduring surveys: butterflyfish (6.25 individualsper 500 m3), sweetlips (0.5), grouper (0.5)and parrotfish (2.5) (Fig 2.3k(ii)). This sitewas also one of the two sites whereBarramundi cod was recorded (0.25). Asingle green turtle was also recorded duringthe survey at this site.
Figure 2.3k(ii). Fish abundance for Soyak North.
Giant clam (4.75 individuals per 100 m2) andDiadema urchin (2.5) were the only twoindicator invertebrates recorded (Fig 2.3k(iii)).There were many fewer Diadema urchinsrecorded on the northern side of the islandcompared to the southern side.
Figure 2.3k(iii). Invertebrate abundance for Soyak North.
27
© Biosphere Expeditions, an international not-for-profit conservation organisation registered in England, Germany, France, Australia and the USAOfficially accredited member of the United Nations Environment Programme's Governing Council & Global Ministerial Environment ForumOfficially accredited member of the International Union for the Conservation of Nature
Teluk Dalam
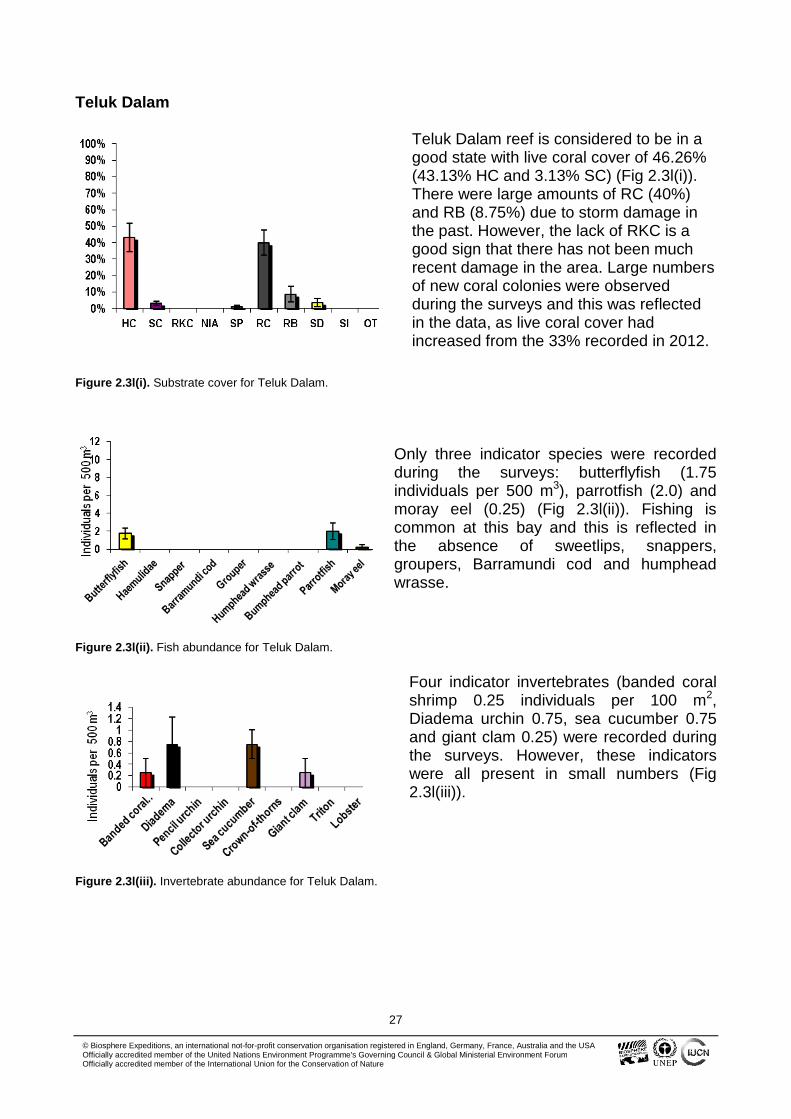
Teluk Dalam reef is considered to be in agood state with live coral cover of 46.26%(43.13% HC and 3.13% SC) (Fig 2.3l(i)).There were large amounts of RC (40%)and RB (8.75%) due to storm damage inthe past. However, the lack of RKC is agood sign that there has not been muchrecent damage in the area. Large numbersof new coral colonies were observedduring the surveys and this was reflectedin the data, as live coral cover hadincreased from the 33% recorded in 2012.
Figure 2.3l(i). Substrate cover for Teluk Dalam.
Only three indicator species were recordedduring the surveys: butterflyfish (1.75individuals per 500 m3), parrotfish (2.0) andmoray eel (0.25) (Fig 2.3l(ii)). Fishing iscommon at this bay and this is reflected inthe absence of sweetlips, snappers,groupers, Barramundi cod and humpheadwrasse.
Figure 2.3l(ii). Fish abundance for Teluk Dalam.
Four indicator invertebrates (banded coralshrimp 0.25 individuals per 100 m2,Diadema urchin 0.75, sea cucumber 0.75and giant clam 0.25) were recorded duringthe surveys. However, these indicatorswere all present in small numbers (Fig2.3l(iii)).
Figure 2.3l(iii). Invertebrate abundance for Teluk Dalam.
28
© Biosphere Expeditions, an international not-for-profit conservation organisation registered in England, Germany, France, Australia and the USAOfficially accredited member of the United Nations Environment Programme's Governing Council & Global Ministerial Environment ForumOfficially accredited member of the International Union for the Conservation of Nature
Tumuk
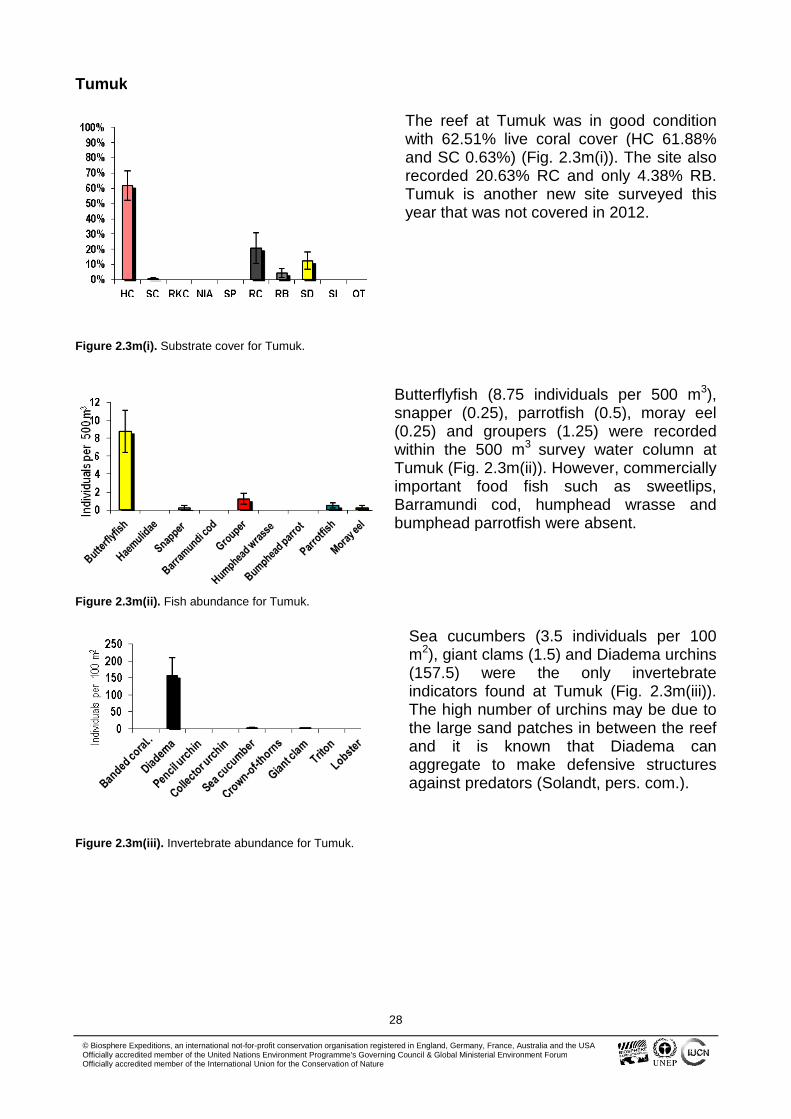
The reef at Tumuk was in good conditionwith 62.51% live coral cover (HC 61.88%and SC 0.63%) (Fig. 2.3m(i)). The site alsorecorded 20.63% RC and only 4.38% RB.Tumuk is another new site surveyed thisyear that was not covered in 2012.
Figure 2.3m(i). Substrate cover for Tumuk.
Butterflyfish (8.75 individuals per 500 m3),snapper (0.25), parrotfish (0.5), moray eel(0.25) and groupers (1.25) were recordedwithin the 500 m3 survey water column atTumuk (Fig. 2.3m(ii)). However, commerciallyimportant food fish such as sweetlips,Barramundi cod, humphead wrasse andbumphead parrotfish were absent.
Figure 2.3m(ii). Fish abundance for Tumuk.
Sea cucumbers (3.5 individuals per 100m2), giant clams (1.5) and Diadema urchins(157.5) were the only invertebrateindicators found at Tumuk (Fig. 2.3m(iii)).The high number of urchins may be due tothe large sand patches in between the reefand it is known that Diadema canaggregate to make defensive structuresagainst predators (Solandt, pers. com.).
Figure 2.3m(iii). Invertebrate abundance for Tumuk.
29
© Biosphere Expeditions, an international not-for-profit conservation organisation registered in England, Germany, France, Australia and the USAOfficially accredited member of the United Nations Environment Programme's Governing Council & Global Ministerial Environment ForumOfficially accredited member of the International Union for the Conservation of Nature
Batu Malang
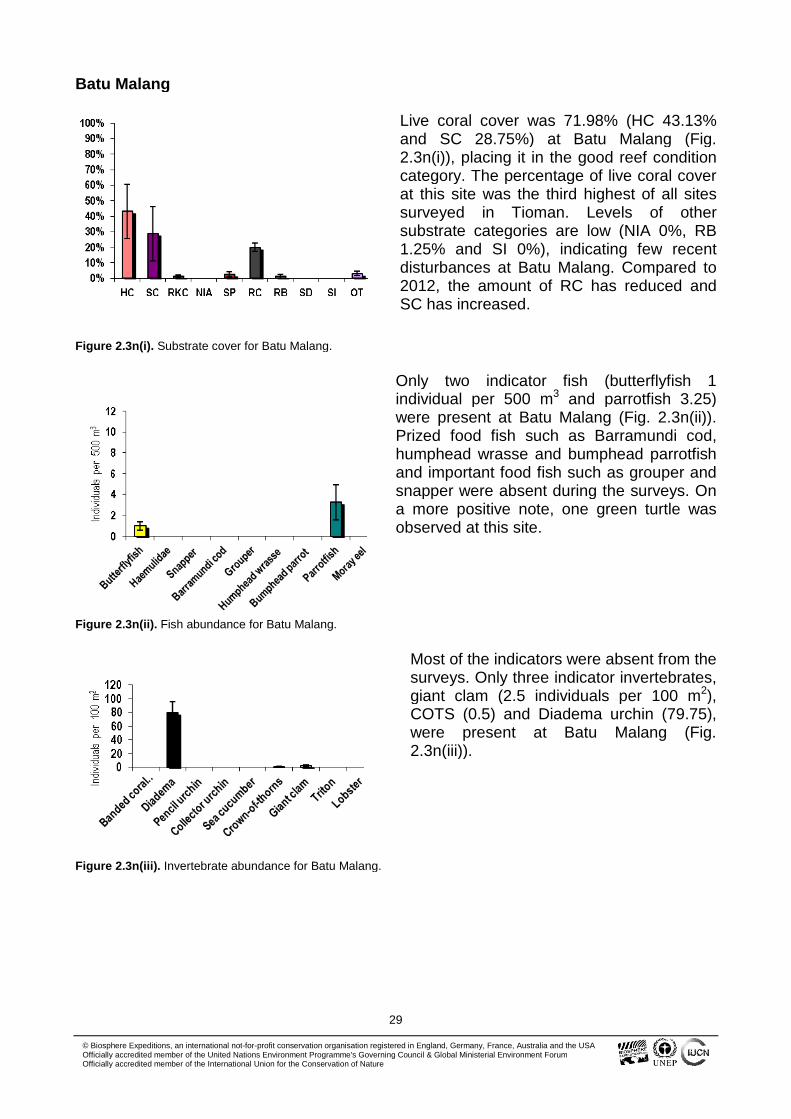
Live coral cover was 71.98% (HC 43.13%and SC 28.75%) at Batu Malang (Fig.2.3n(i)), placing it in the good reef conditioncategory. The percentage of live coral coverat this site was the third highest of all sitessurveyed in Tioman. Levels of othersubstrate categories are low (NIA 0%, RB1.25% and SI 0%), indicating few recentdisturbances at Batu Malang. Compared to2012, the amount of RC has reduced andSC has increased.
Figure 2.3n(i). Substrate cover for Batu Malang.
Only two indicator fish (butterflyfish 1individual per 500 m3 and parrotfish 3.25)were present at Batu Malang (Fig. 2.3n(ii)).Prized food fish such as Barramundi cod,humphead wrasse and bumphead parrotfishand important food fish such as grouper andsnapper were absent during the surveys. Ona more positive note, one green turtle wasobserved at this site.
Figure 2.3n(ii). Fish abundance for Batu Malang.
Most of the indicators were absent from thesurveys. Only three indicator invertebrates,giant clam (2.5 individuals per 100 m2),COTS (0.5) and Diadema urchin (79.75),were present at Batu Malang (Fig.2.3n(iii)).
Figure 2.3n(iii). Invertebrate abundance for Batu Malang.
30
© Biosphere Expeditions, an international not-for-profit conservation organisation registered in England, Germany, France, Australia and the USAOfficially accredited member of the United Nations Environment Programme's Governing Council & Global Ministerial Environment ForumOfficially accredited member of the International Union for the Conservation of Nature
Batu Nipah
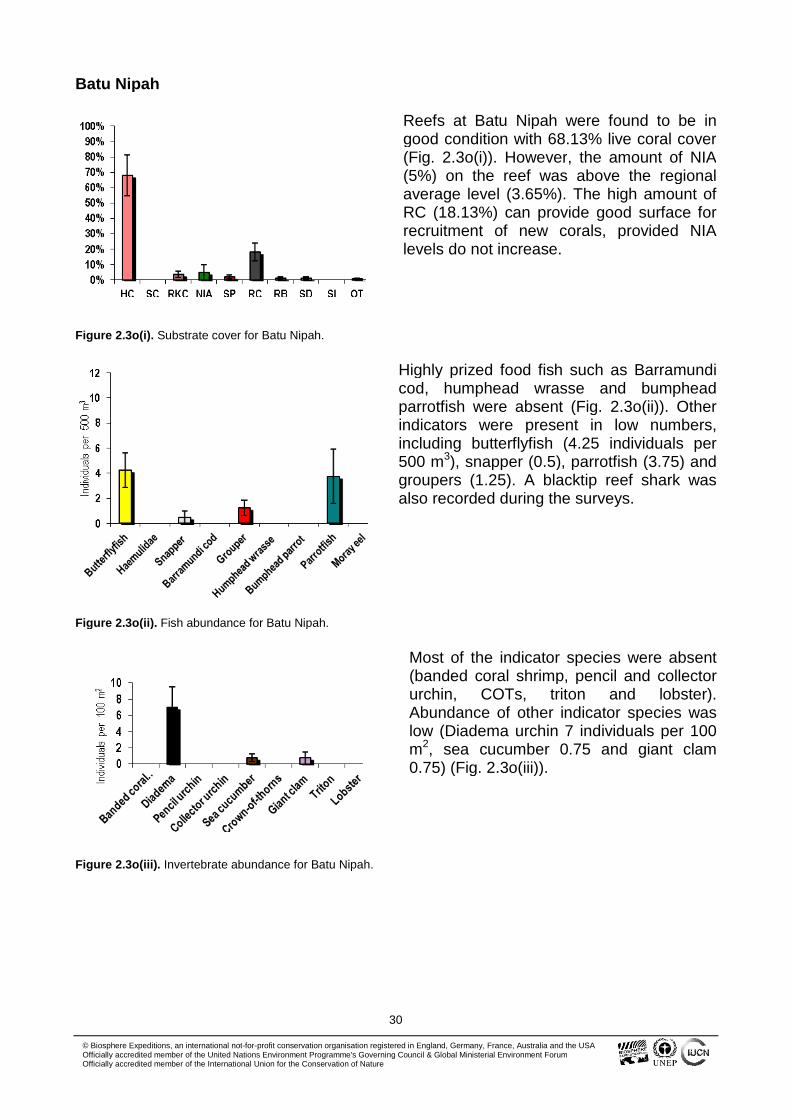
Reefs at Batu Nipah were found to be ingood condition with 68.13% live coral cover(Fig. 2.3o(i)). However, the amount of NIA(5%) on the reef was above the regionalaverage level (3.65%). The high amount ofRC (18.13%) can provide good surface forrecruitment of new corals, provided NIAlevels do not increase.
Figure 2.3o(i). Substrate cover for Batu Nipah.
Highly prized food fish such as Barramundicod, humphead wrasse and bumpheadparrotfish were absent (Fig. 2.3o(ii)). Otherindicators were present in low numbers,including butterflyfish (4.25 individuals per500 m3), snapper (0.5), parrotfish (3.75) andgroupers (1.25). A blacktip reef shark wasalso recorded during the surveys.
Figure 2.3o(ii). Fish abundance for Batu Nipah.
Most of the indicator species were absent(banded coral shrimp, pencil and collectorurchin, COTs, triton and lobster).Abundance of other indicator species waslow (Diadema urchin 7 individuals per 100m2, sea cucumber 0.75 and giant clam0.75) (Fig. 2.3o(iii)).
Figure 2.3o(iii). Invertebrate abundance for Batu Nipah.
31
© Biosphere Expeditions, an international not-for-profit conservation organisation registered in England, Germany, France, Australia and the USAOfficially accredited member of the United Nations Environment Programme's Governing Council & Global Ministerial Environment ForumOfficially accredited member of the International Union for the Conservation of Nature
Chebeh
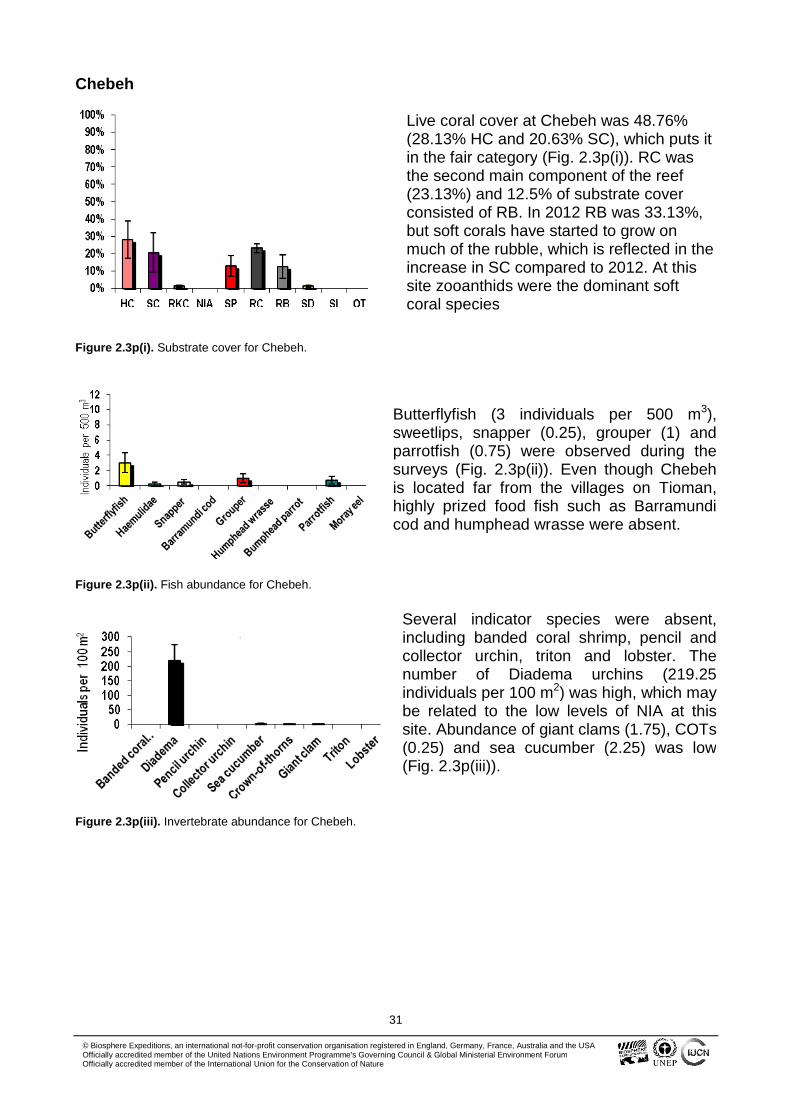
Live coral cover at Chebeh was 48.76%(28.13% HC and 20.63% SC), which puts itin the fair category (Fig. 2.3p(i)). RC wasthe second main component of the reef(23.13%) and 12.5% of substrate coverconsisted of RB. In 2012 RB was 33.13%,but soft corals have started to grow onmuch of the rubble, which is reflected in theincrease in SC compared to 2012. At thissite zooanthids were the dominant softcoral species
Figure 2.3p(i). Substrate cover for Chebeh.
Butterflyfish (3 individuals per 500 m3),sweetlips, snapper (0.25), grouper (1) andparrotfish (0.75) were observed during thesurveys (Fig. 2.3p(ii)). Even though Chebehis located far from the villages on Tioman,highly prized food fish such as Barramundicod and humphead wrasse were absent.
Figure 2.3p(ii). Fish abundance for Chebeh.
Several indicator species were absent,including banded coral shrimp, pencil andcollector urchin, triton and lobster. Thenumber of Diadema urchins (219.25individuals per 100 m2) was high, which maybe related to the low levels of NIA at thissite. Abundance of giant clams (1.75), COTs(0.25) and sea cucumber (2.25) was low(Fig. 2.3p(iii)).
Figure 2.3p(iii). Invertebrate abundance for Chebeh.
32
© Biosphere Expeditions, an international not-for-profit conservation organisation registered in England, Germany, France, Australia and the USAOfficially accredited member of the United Nations Environment Programme's Governing Council & Global Ministerial Environment ForumOfficially accredited member of the International Union for the Conservation of Nature
Fan Canyon
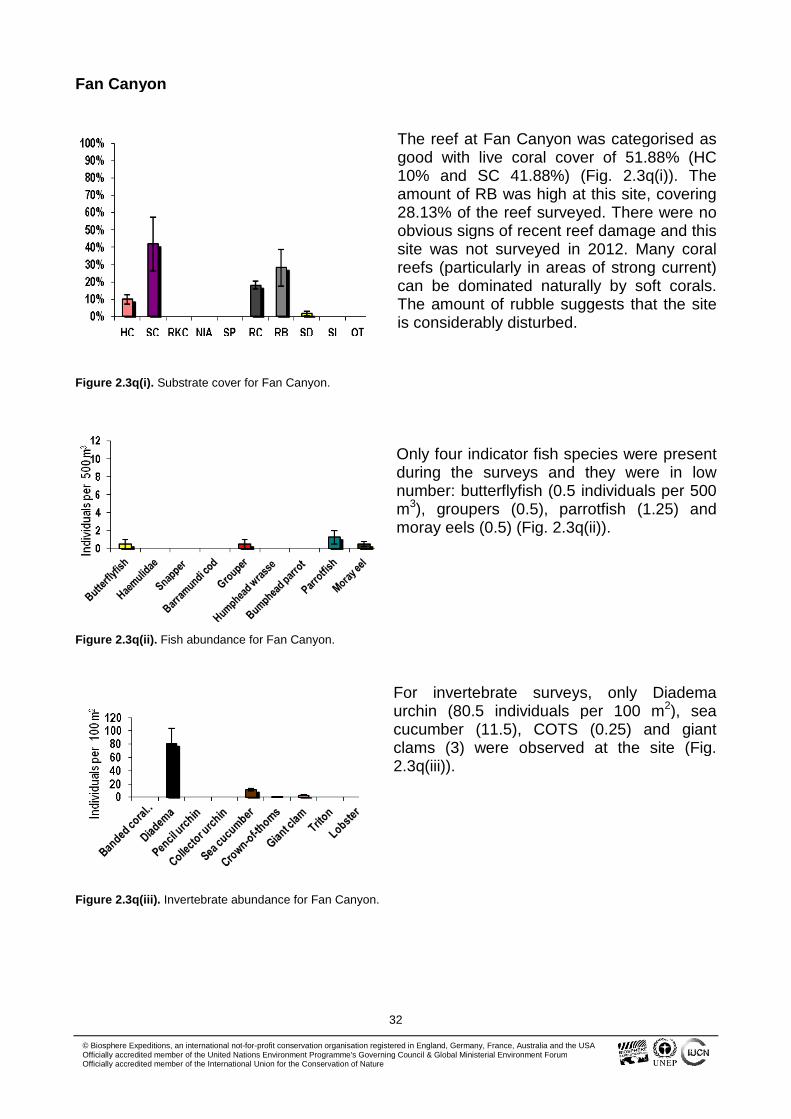
The reef at Fan Canyon was categorised asgood with live coral cover of 51.88% (HC10% and SC 41.88%) (Fig. 2.3q(i)). Theamount of RB was high at this site, covering28.13% of the reef surveyed. There were noobvious signs of recent reef damage and thissite was not surveyed in 2012. Many coralreefs (particularly in areas of strong current)can be dominated naturally by soft corals.The amount of rubble suggests that the siteis considerably disturbed.
Figure 2.3q(i). Substrate cover for Fan Canyon.
Only four indicator fish species were presentduring the surveys and they were in lownumber: butterflyfish (0.5 individuals per 500m3), groupers (0.5), parrotfish (1.25) andmoray eels (0.5) (Fig. 2.3q(ii)).
Figure 2.3q(ii). Fish abundance for Fan Canyon.
For invertebrate surveys, only Diademaurchin (80.5 individuals per 100 m2), seacucumber (11.5), COTS (0.25) and giantclams (3) were observed at the site (Fig.2.3q(iii)).
Figure 2.3q(iii). Invertebrate abundance for Fan Canyon.
33
© Biosphere Expeditions, an international not-for-profit conservation organisation registered in England, Germany, France, Australia and the USAOfficially accredited member of the United Nations Environment Programme's Governing Council & Global Ministerial Environment ForumOfficially accredited member of the International Union for the Conservation of Nature
Jahat East
The reef to the east of Jahat Island is a newsurvey site and was considered to be ingood condition with 53.13% live coral cover(48.75% HC and 4.38% SC) (Fig. 2.3r(i)).This reef also consists of large amounts ofRC (36.88%), providing ample substrate forcoral recruits to settle on. There was littleRB (2.50%) and this was most likely causedby storm damage in the past.
Figure 2.3r(i). Substrate cover for Jahat East.
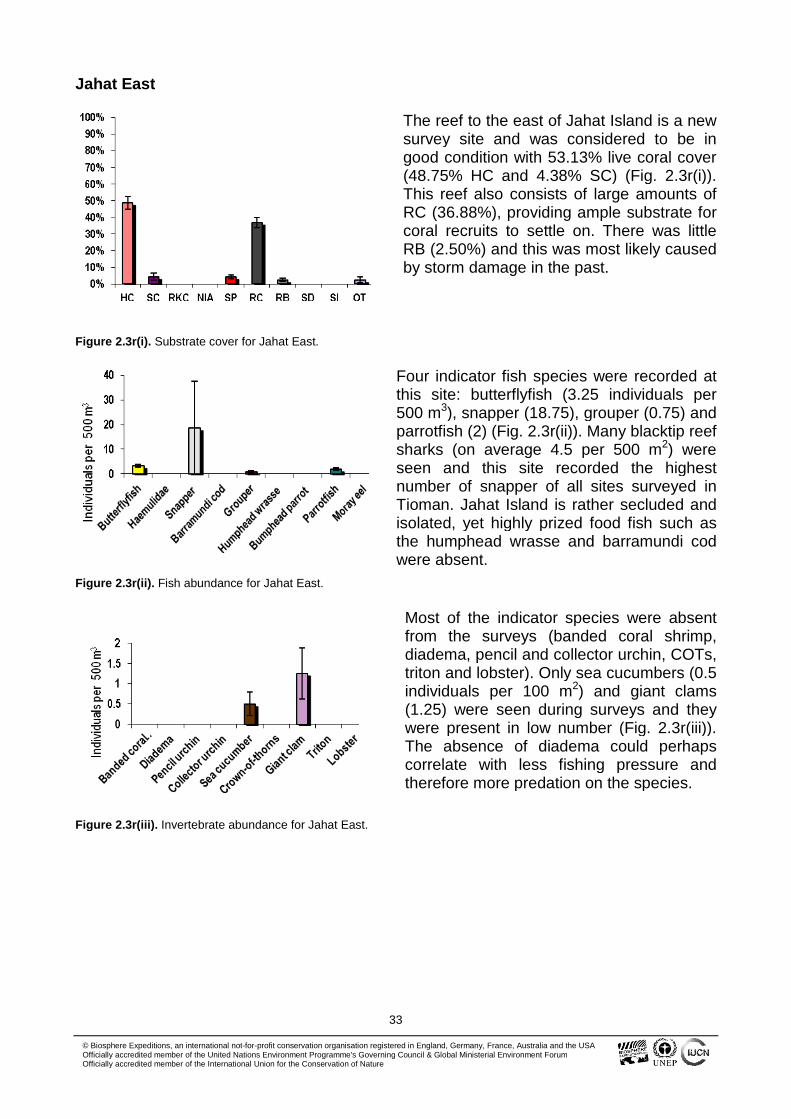
Four indicator fish species were recorded atthis site: butterflyfish (3.25 individuals per500 m3), snapper (18.75), grouper (0.75) andparrotfish (2) (Fig. 2.3r(ii)). Many blacktip reefsharks (on average 4.5 per 500 m2) wereseen and this site recorded the highestnumber of snapper of all sites surveyed inTioman. Jahat Island is rather secluded andisolated, yet highly prized food fish such asthe humphead wrasse and barramundi codwere absent.
Figure 2.3r(ii). Fish abundance for Jahat East.
Most of the indicator species were absentfrom the surveys (banded coral shrimp,diadema, pencil and collector urchin, COTs,triton and lobster). Only sea cucumbers (0.5individuals per 100 m2) and giant clams(1.25) were seen during surveys and theywere present in low number (Fig. 2.3r(iii)).The absence of diadema could perhapscorrelate with less fishing pressure andtherefore more predation on the species.
Figure 2.3r(iii). Invertebrate abundance for Jahat East.
34
© Biosphere Expeditions, an international not-for-profit conservation organisation registered in England, Germany, France, Australia and the USAOfficially accredited member of the United Nations Environment Programme's Governing Council & Global Ministerial Environment ForumOfficially accredited member of the International Union for the Conservation of Nature
Jahat West
The reef to the west of Jahat Island is also anew survey site and was in poor conditionwith only 11.25% live coral cover (5.63% HCand 5.63% SC) (Fig. 2.3s(i)), the lowest of allsites surveyed in Tioman. This site isexposed to the open sea and will always beimpacted by storms during the monsoonseason. Therefore it is not surprising that thissite is covered mostly by RB (80.63%). Thereis no evidence or history of blast fishingaround Tioman.
Figure 2.3s(i). Substrate cover for Jahat West.
Only four indicator fish species wereobserved during the surveys and they were inlow number: butterflyfish (1.25 individuals per500 m3), Barramundi cod (0.25), parrotfish(1.75) and grouper (0.25) (Fig. 2.3s(ii)). JahatWest was one of the two sites whereBarramundi cod was observed during thesurveys.
Figure 2.3s(ii). Fish abundance for Jahat West.
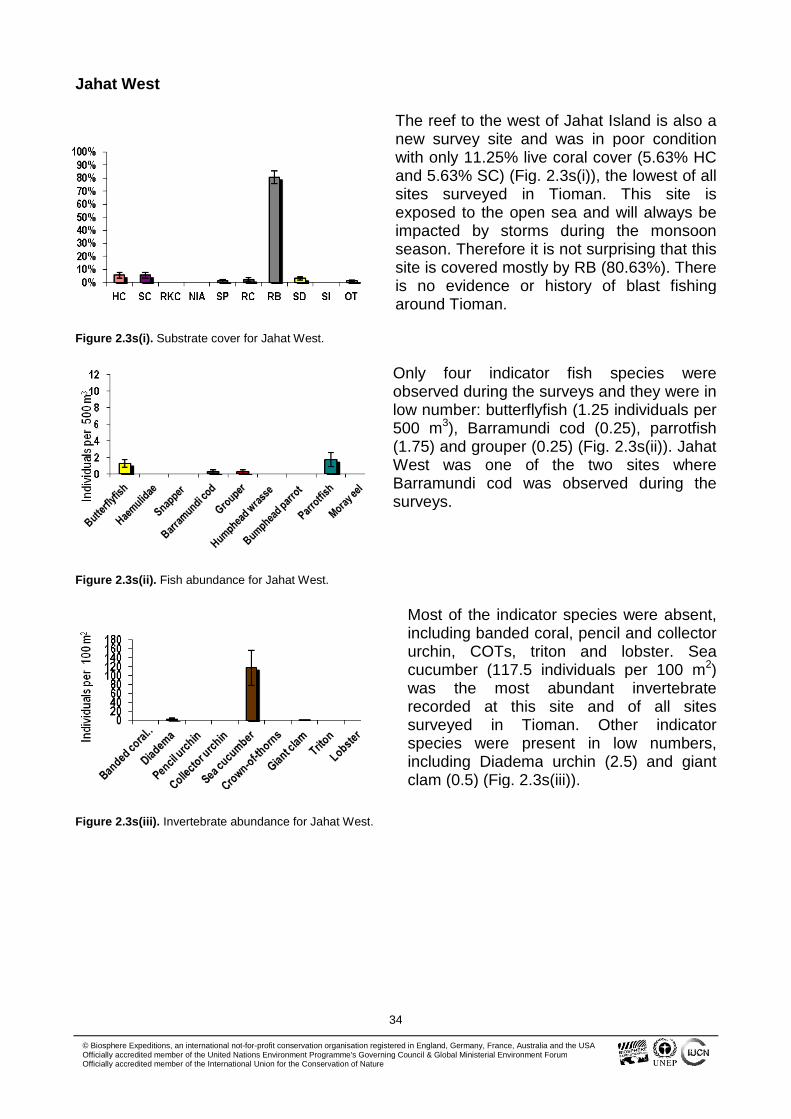
Most of the indicator species were absent,including banded coral, pencil and collectorurchin, COTs, triton and lobster. Seacucumber (117.5 individuals per 100 m2)was the most abundant invertebraterecorded at this site and of all sitessurveyed in Tioman. Other indicatorspecies were present in low numbers,including Diadema urchin (2.5) and giantclam (0.5) (Fig. 2.3s(iii)).
Figure 2.3s(iii). Invertebrate abundance for Jahat West.
35
© Biosphere Expeditions, an international not-for-profit conservation organisation registered in England, Germany, France, Australia and the USAOfficially accredited member of the United Nations Environment Programme's Governing Council & Global Ministerial Environment ForumOfficially accredited member of the International Union for the Conservation of Nature
Labas
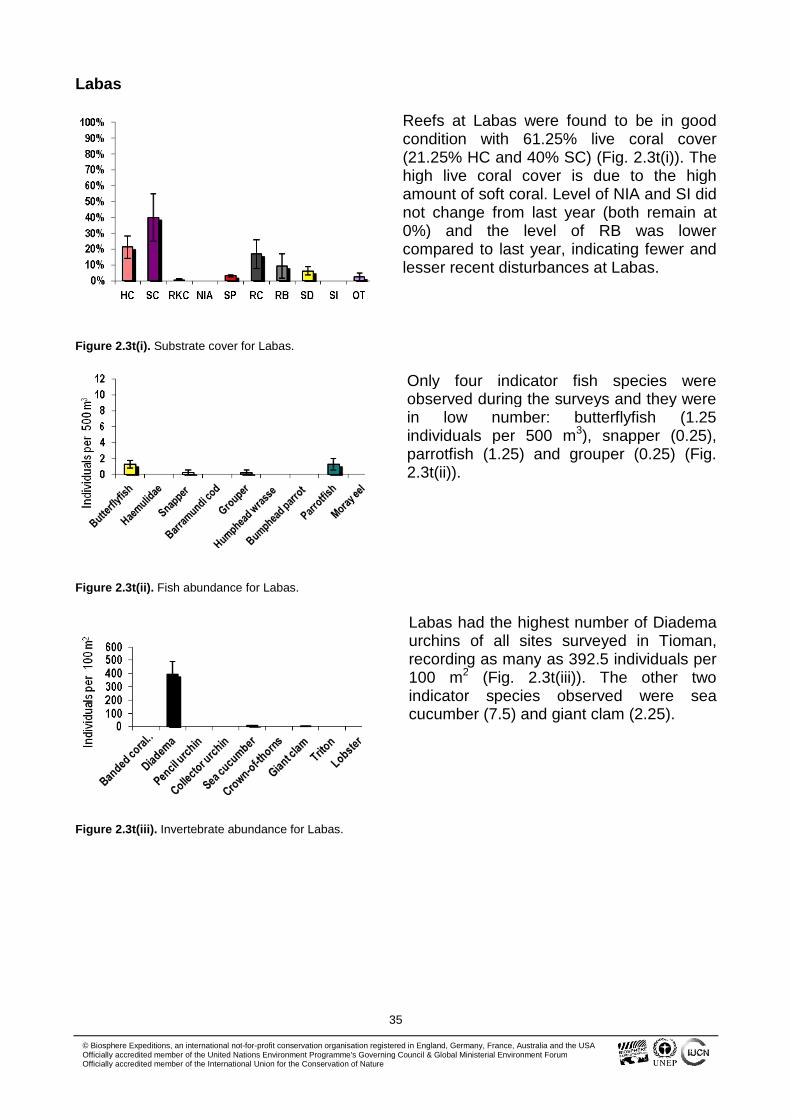
Reefs at Labas were found to be in goodcondition with 61.25% live coral cover(21.25% HC and 40% SC) (Fig. 2.3t(i)). Thehigh live coral cover is due to the highamount of soft coral. Level of NIA and SI didnot change from last year (both remain at0%) and the level of RB was lowercompared to last year, indicating fewer andlesser recent disturbances at Labas.
Figure 2.3t(i). Substrate cover for Labas.
Only four indicator fish species wereobserved during the surveys and they werein low number: butterflyfish (1.25individuals per 500 m3), snapper (0.25),parrotfish (1.25) and grouper (0.25) (Fig.2.3t(ii)).
Figure 2.3t(ii). Fish abundance for Labas.
Labas had the highest number of Diademaurchins of all sites surveyed in Tioman,recording as many as 392.5 individuals per100 m2 (Fig. 2.3t(iii)). The other twoindicator species observed were seacucumber (7.5) and giant clam (2.25).
Figure 2.3t(iii). Invertebrate abundance for Labas.
36
© Biosphere Expeditions, an international not-for-profit conservation organisation registered in England, Germany, France, Australia and the USAOfficially accredited member of the United Nations Environment Programme's Governing Council & Global Ministerial Environment ForumOfficially accredited member of the International Union for the Conservation of Nature
Pasir Penut
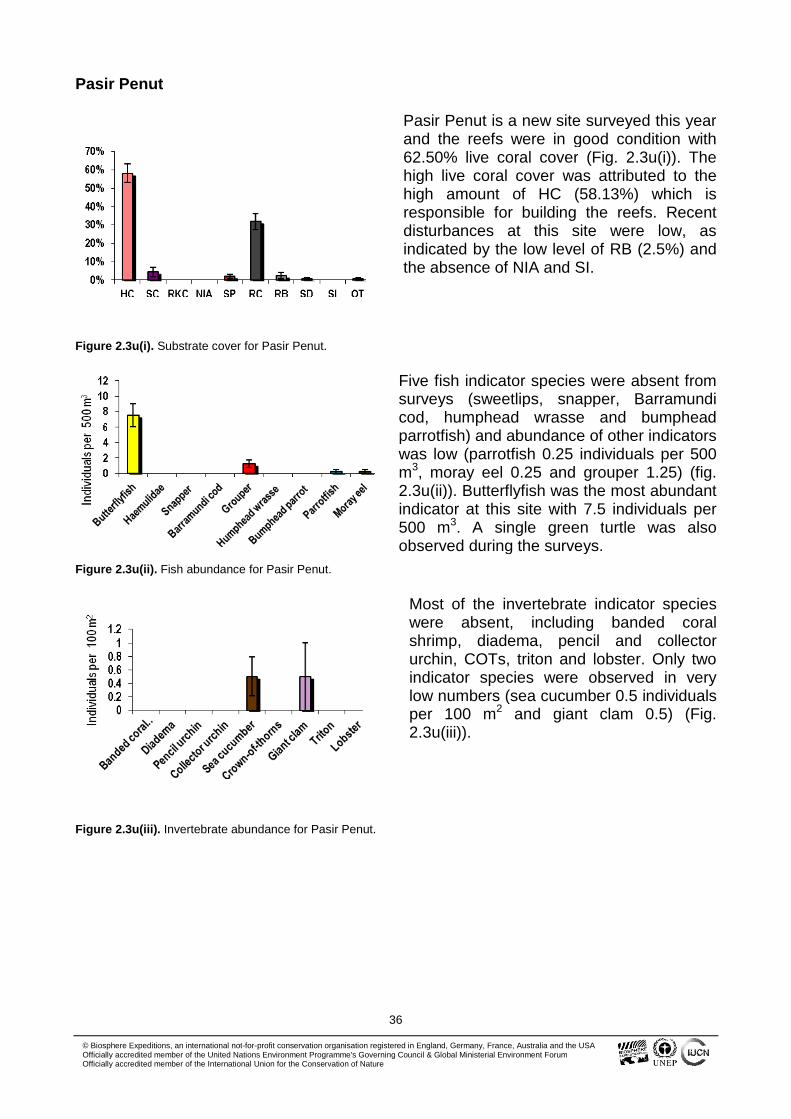
Pasir Penut is a new site surveyed this yearand the reefs were in good condition with62.50% live coral cover (Fig. 2.3u(i)). Thehigh live coral cover was attributed to thehigh amount of HC (58.13%) which isresponsible for building the reefs. Recentdisturbances at this site were low, asindicated by the low level of RB (2.5%) andthe absence of NIA and SI.
Figure 2.3u(i). Substrate cover for Pasir Penut.
Five fish indicator species were absent fromsurveys (sweetlips, snapper, Barramundicod, humphead wrasse and bumpheadparrotfish) and abundance of other indicatorswas low (parrotfish 0.25 individuals per 500m3, moray eel 0.25 and grouper 1.25) (fig.2.3u(ii)). Butterflyfish was the most abundantindicator at this site with 7.5 individuals per500 m3. A single green turtle was alsoobserved during the surveys.
Figure 2.3u(ii). Fish abundance for Pasir Penut.
Most of the invertebrate indicator specieswere absent, including banded coralshrimp, diadema, pencil and collectorurchin, COTs, triton and lobster. Only twoindicator species were observed in verylow numbers (sea cucumber 0.5 individualsper 100 m2 and giant clam 0.5) (Fig.2.3u(iii)).
Figure 2.3u(iii). Invertebrate abundance for Pasir Penut.
37
© Biosphere Expeditions, an international not-for-profit conservation organisation registered in England, Germany, France, Australia and the USAOfficially accredited member of the United Nations Environment Programme's Governing Council & Global Ministerial Environment ForumOfficially accredited member of the International Union for the Conservation of Nature
Sepoi
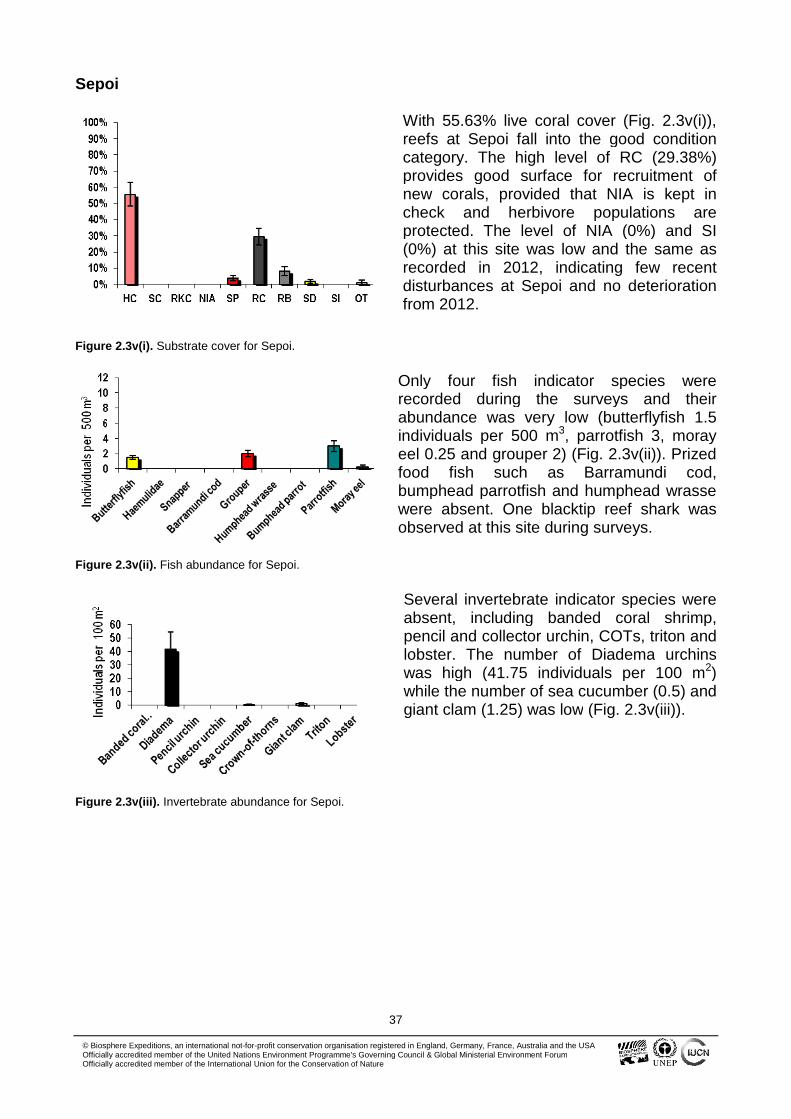
With 55.63% live coral cover (Fig. 2.3v(i)),reefs at Sepoi fall into the good conditioncategory. The high level of RC (29.38%)provides good surface for recruitment ofnew corals, provided that NIA is kept incheck and herbivore populations areprotected. The level of NIA (0%) and SI(0%) at this site was low and the same asrecorded in 2012, indicating few recentdisturbances at Sepoi and no deteriorationfrom 2012.
Figure 2.3v(i). Substrate cover for Sepoi.
Only four fish indicator species wererecorded during the surveys and theirabundance was very low (butterflyfish 1.5individuals per 500 m3, parrotfish 3, morayeel 0.25 and grouper 2) (Fig. 2.3v(ii)). Prizedfood fish such as Barramundi cod,bumphead parrotfish and humphead wrassewere absent. One blacktip reef shark wasobserved at this site during surveys.
Figure 2.3v(ii). Fish abundance for Sepoi.
Several invertebrate indicator species wereabsent, including banded coral shrimp,pencil and collector urchin, COTs, triton andlobster. The number of Diadema urchinswas high (41.75 individuals per 100 m2)while the number of sea cucumber (0.5) andgiant clam (1.25) was low (Fig. 2.3v(iii)).
Figure 2.3v(iii). Invertebrate abundance for Sepoi.
38
© Biosphere Expeditions, an international not-for-profit conservation organisation registered in England, Germany, France, Australia and the USAOfficially accredited member of the United Nations Environment Programme's Governing Council & Global Ministerial Environment ForumOfficially accredited member of the International Union for the Conservation of Nature
Tekek
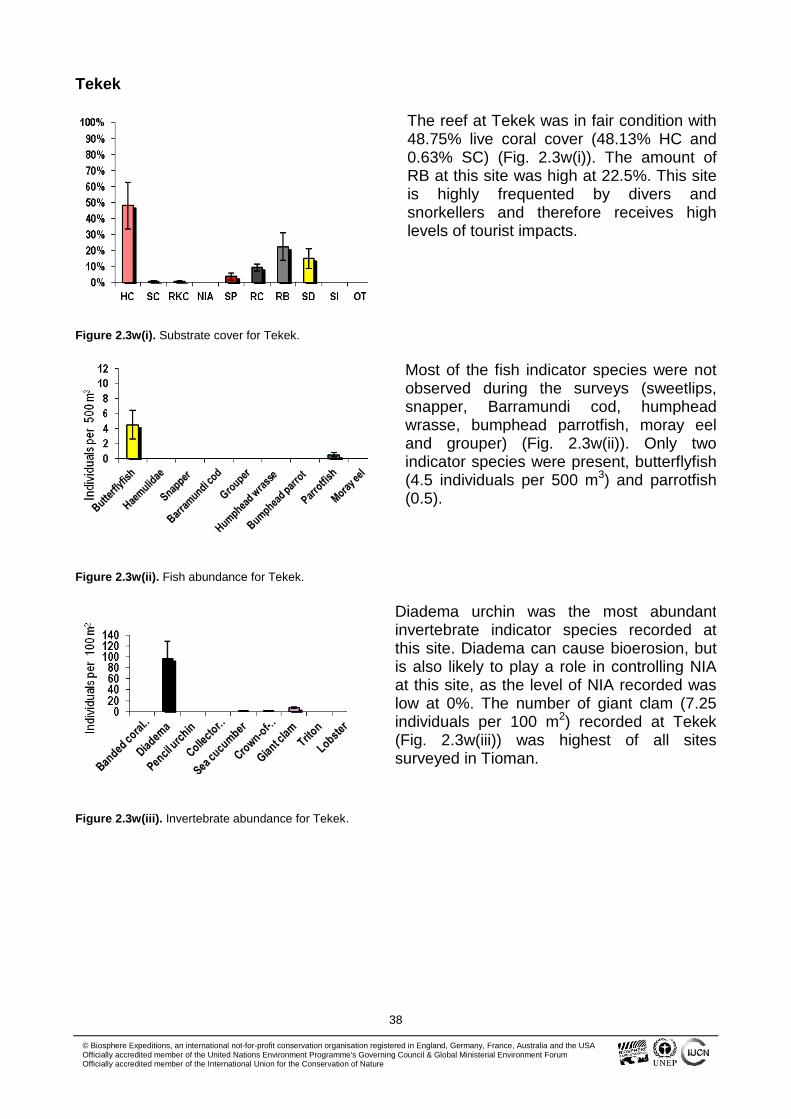
The reef at Tekek was in fair condition with48.75% live coral cover (48.13% HC and0.63% SC) (Fig. 2.3w(i)). The amount ofRB at this site was high at 22.5%. This siteis highly frequented by divers andsnorkellers and therefore receives highlevels of tourist impacts.
Figure 2.3w(i). Substrate cover for Tekek.
Most of the fish indicator species were notobserved during the surveys (sweetlips,snapper, Barramundi cod, humpheadwrasse, bumphead parrotfish, moray eeland grouper) (Fig. 2.3w(ii)). Only twoindicator species were present, butterflyfish(4.5 individuals per 500 m3) and parrotfish(0.5).
Figure 2.3w(ii). Fish abundance for Tekek.
Diadema urchin was the most abundantinvertebrate indicator species recorded atthis site. Diadema can cause bioerosion, butis also likely to play a role in controlling NIAat this site, as the level of NIA recorded waslow at 0%. The number of giant clam (7.25individuals per 100 m2) recorded at Tekek(Fig. 2.3w(iii)) was highest of all sitessurveyed in Tioman.
Figure 2.3w(iii). Invertebrate abundance for Tekek.
39
© Biosphere Expeditions, an international not-for-profit conservation organisation registered in England, Germany, France, Australia and the USAOfficially accredited member of the United Nations Environment Programme's Governing Council & Global Ministerial Environment ForumOfficially accredited member of the International Union for the Conservation of Nature
Teluk Tambong
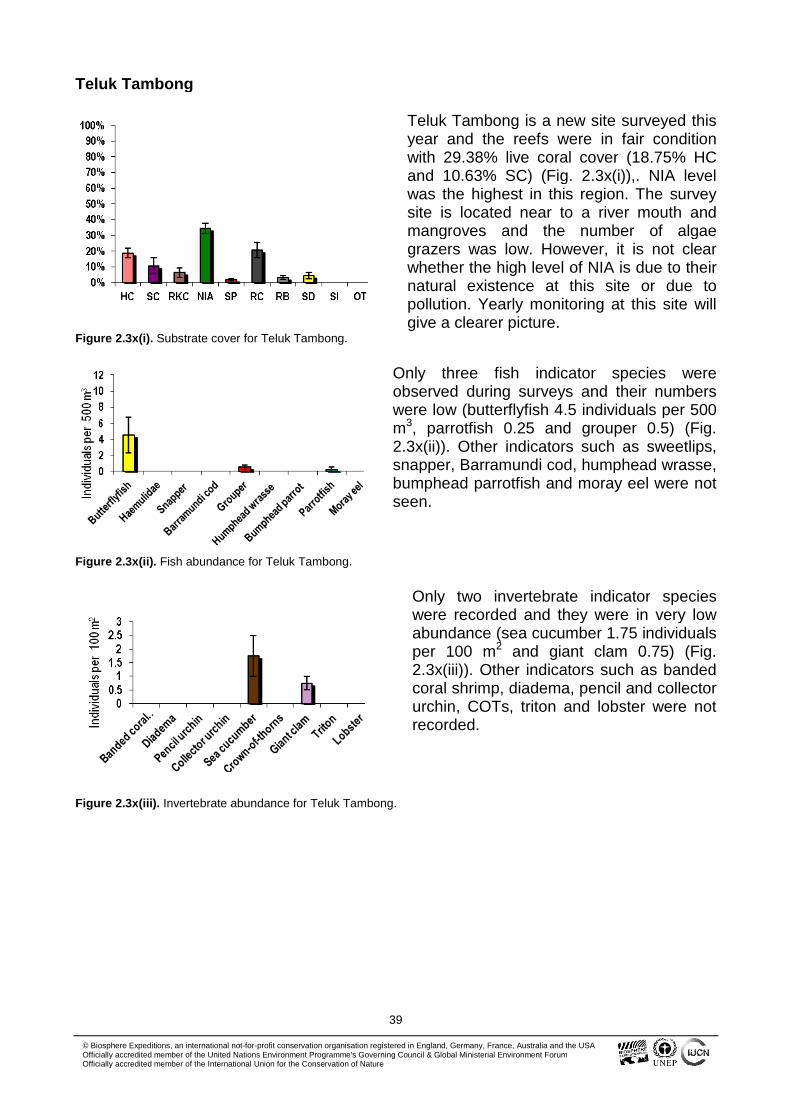
Teluk Tambong is a new site surveyed thisyear and the reefs were in fair conditionwith 29.38% live coral cover (18.75% HCand 10.63% SC) (Fig. 2.3x(i)),. NIA levelwas the highest in this region. The surveysite is located near to a river mouth andmangroves and the number of algaegrazers was low. However, it is not clearwhether the high level of NIA is due to theirnatural existence at this site or due topollution. Yearly monitoring at this site willgive a clearer picture.
Figure 2.3x(i). Substrate cover for Teluk Tambong.
Only three fish indicator species wereobserved during surveys and their numberswere low (butterflyfish 4.5 individuals per 500m3, parrotfish 0.25 and grouper 0.5) (Fig.2.3x(ii)). Other indicators such as sweetlips,snapper, Barramundi cod, humphead wrasse,bumphead parrotfish and moray eel were notseen.
Figure 2.3x(ii). Fish abundance for Teluk Tambong.
Only two invertebrate indicator specieswere recorded and they were in very lowabundance (sea cucumber 1.75 individualsper 100 m2 and giant clam 0.75) (Fig.2.3x(iii)). Other indicators such as bandedcoral shrimp, diadema, pencil and collectorurchin, COTs, triton and lobster were notrecorded.
Figure 2.3x(iii). Invertebrate abundance for Teluk Tambong.
40
© Biosphere Expeditions, an international not-for-profit conservation organisation registered in England, Germany, France, Australia and the USAOfficially accredited member of the United Nations Environment Programme's Governing Council & Global Ministerial Environment ForumOfficially accredited member of the International Union for the Conservation of Nature
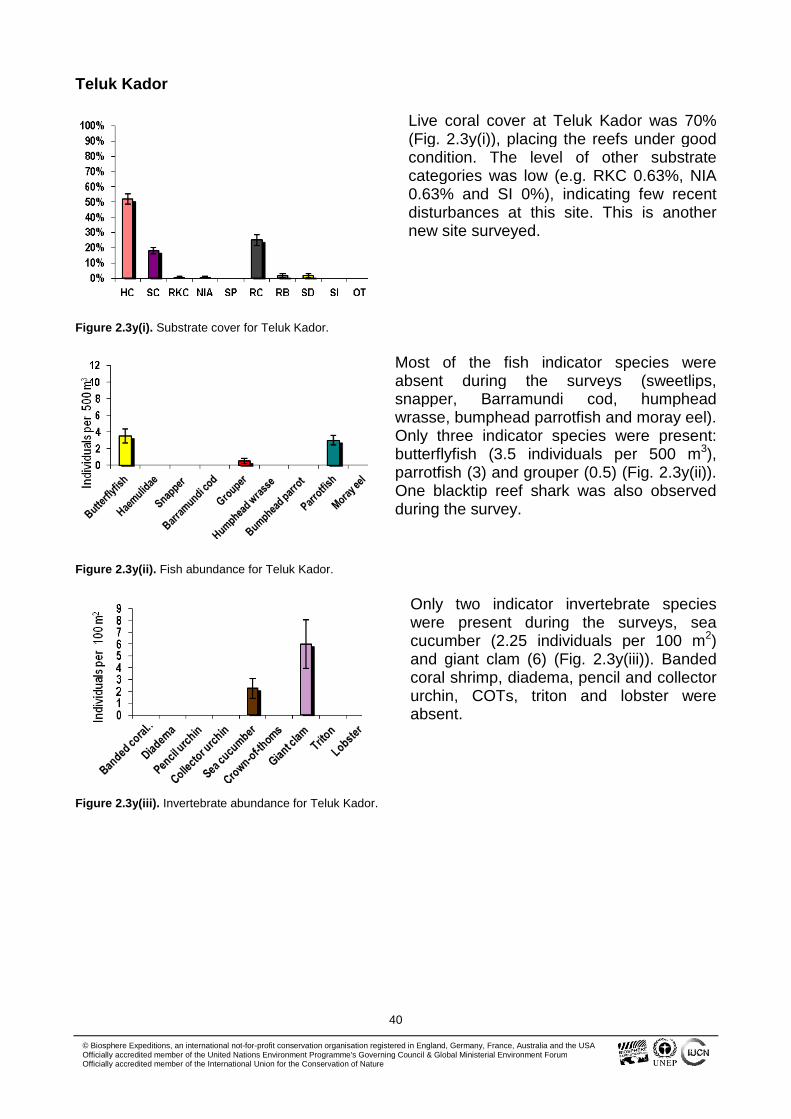
Teluk Kador
Live coral cover at Teluk Kador was 70%(Fig. 2.3y(i)), placing the reefs under goodcondition. The level of other substratecategories was low (e.g. RKC 0.63%, NIA0.63% and SI 0%), indicating few recentdisturbances at this site. This is anothernew site surveyed.
Figure 2.3y(i). Substrate cover for Teluk Kador.
Most of the fish indicator species wereabsent during the surveys (sweetlips,snapper, Barramundi cod, humpheadwrasse, bumphead parrotfish and moray eel).Only three indicator species were present:butterflyfish (3.5 individuals per 500 m3),parrotfish (3) and grouper (0.5) (Fig. 2.3y(ii)).One blacktip reef shark was also observedduring the survey.
Figure 2.3y(ii). Fish abundance for Teluk Kador.
Only two indicator invertebrate specieswere present during the surveys, seacucumber (2.25 individuals per 100 m2)and giant clam (6) (Fig. 2.3y(iii)). Bandedcoral shrimp, diadema, pencil and collectorurchin, COTs, triton and lobster wereabsent.
Figure 2.3y(iii). Invertebrate abundance for Teluk Kador.
41
© Biosphere Expeditions, an international not-for-profit conservation organisation registered in England, Germany, France, Australia and the USAOfficially accredited member of the United Nations Environment Programme's Governing Council & Global Ministerial Environment ForumOfficially accredited member of the International Union for the Conservation of Nature
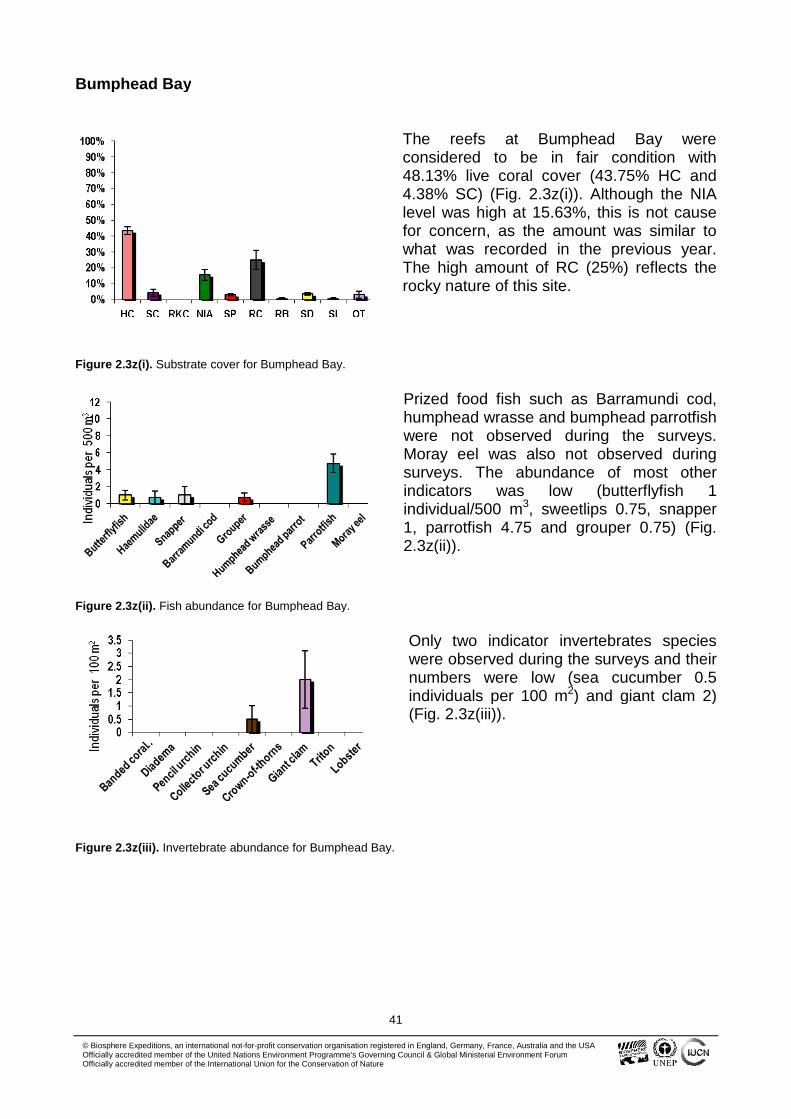
Bumphead Bay
The reefs at Bumphead Bay wereconsidered to be in fair condition with48.13% live coral cover (43.75% HC and4.38% SC) (Fig. 2.3z(i)). Although the NIAlevel was high at 15.63%, this is not causefor concern, as the amount was similar towhat was recorded in the previous year.The high amount of RC (25%) reflects therocky nature of this site.
Figure 2.3z(i). Substrate cover for Bumphead Bay.
Prized food fish such as Barramundi cod,humphead wrasse and bumphead parrotfishwere not observed during the surveys.Moray eel was also not observed duringsurveys. The abundance of most otherindicators was low (butterflyfish 1individual/500 m3, sweetlips 0.75, snapper1, parrotfish 4.75 and grouper 0.75) (Fig.2.3z(ii)).
Figure 2.3z(ii). Fish abundance for Bumphead Bay.
Only two indicator invertebrates specieswere observed during the surveys and theirnumbers were low (sea cucumber 0.5individuals per 100 m2) and giant clam 2)(Fig. 2.3z(iii)).
Figure 2.3z(iii). Invertebrate abundance for Bumphead Bay.
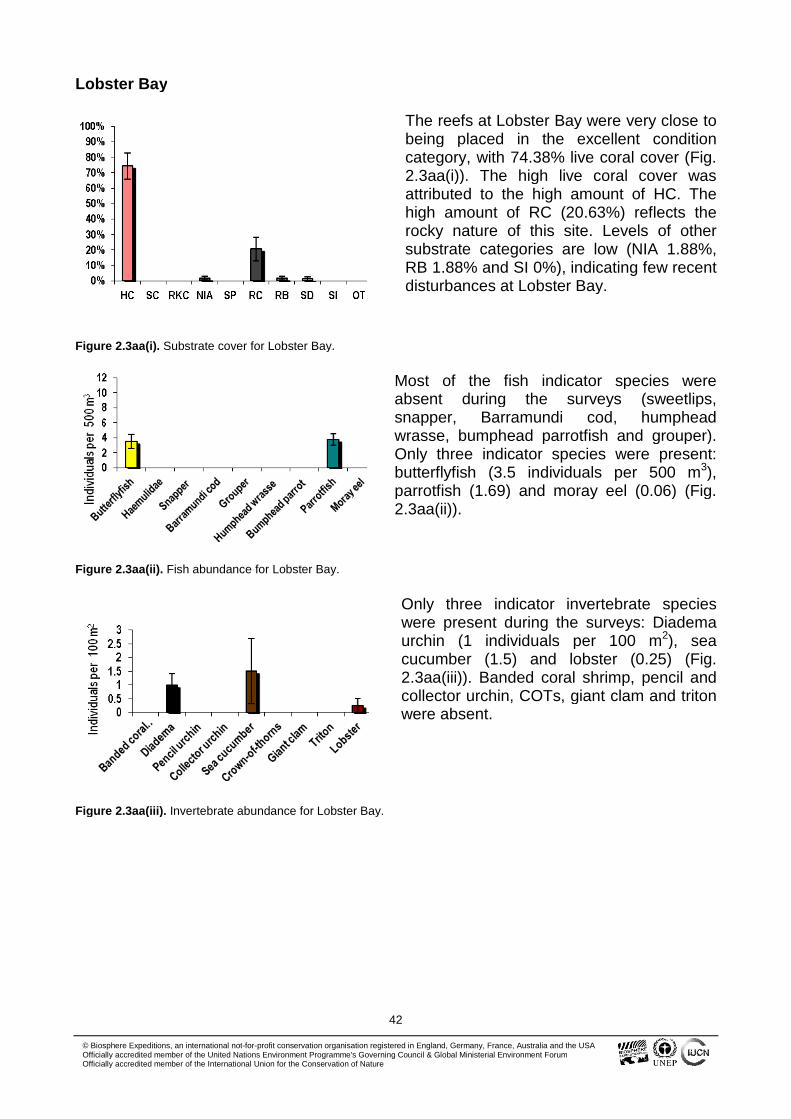
42
© Biosphere Expeditions, an international not-for-profit conservation organisation registered in England, Germany, France, Australia and the USAOfficially accredited member of the United Nations Environment Programme's Governing Council & Global Ministerial Environment ForumOfficially accredited member of the International Union for the Conservation of Nature
Lobster Bay
The reefs at Lobster Bay were very close tobeing placed in the excellent conditioncategory, with 74.38% live coral cover (Fig.2.3aa(i)). The high live coral cover wasattributed to the high amount of HC. Thehigh amount of RC (20.63%) reflects therocky nature of this site. Levels of othersubstrate categories are low (NIA 1.88%,RB 1.88% and SI 0%), indicating few recentdisturbances at Lobster Bay.
Figure 2.3aa(i). Substrate cover for Lobster Bay.
Most of the fish indicator species wereabsent during the surveys (sweetlips,snapper, Barramundi cod, humpheadwrasse, bumphead parrotfish and grouper).Only three indicator species were present:butterflyfish (3.5 individuals per 500 m3),parrotfish (1.69) and moray eel (0.06) (Fig.2.3aa(ii)).
Figure 2.3aa(ii). Fish abundance for Lobster Bay.
Only three indicator invertebrate specieswere present during the surveys: Diademaurchin (1 individuals per 100 m2), seacucumber (1.5) and lobster (0.25) (Fig.2.3aa(iii)). Banded coral shrimp, pencil andcollector urchin, COTs, giant clam and tritonwere absent.
Figure 2.3aa(iii). Invertebrate abundance for Lobster Bay.
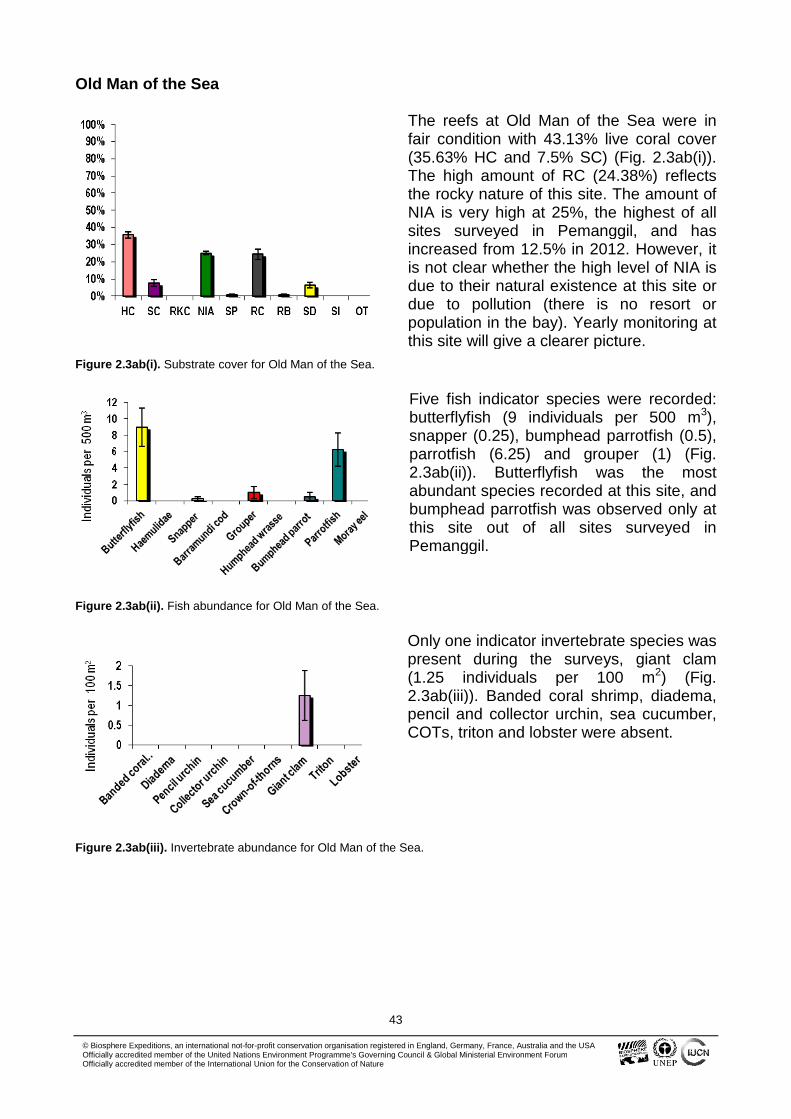
43
© Biosphere Expeditions, an international not-for-profit conservation organisation registered in England, Germany, France, Australia and the USAOfficially accredited member of the United Nations Environment Programme's Governing Council & Global Ministerial Environment ForumOfficially accredited member of the International Union for the Conservation of Nature
Old Man of the Sea
The reefs at Old Man of the Sea were infair condition with 43.13% live coral cover(35.63% HC and 7.5% SC) (Fig. 2.3ab(i)).The high amount of RC (24.38%) reflectsthe rocky nature of this site. The amount ofNIA is very high at 25%, the highest of allsites surveyed in Pemanggil, and hasincreased from 12.5% in 2012. However, itis not clear whether the high level of NIA isdue to their natural existence at this site ordue to pollution (there is no resort orpopulation in the bay). Yearly monitoring atthis site will give a clearer picture.
Figure 2.3ab(i). Substrate cover for Old Man of the Sea.
Five fish indicator species were recorded:butterflyfish (9 individuals per 500 m3),snapper (0.25), bumphead parrotfish (0.5),parrotfish (6.25) and grouper (1) (Fig.2.3ab(ii)). Butterflyfish was the mostabundant species recorded at this site, andbumphead parrotfish was observed only atthis site out of all sites surveyed inPemanggil.
Figure 2.3ab(ii). Fish abundance for Old Man of the Sea.
Only one indicator invertebrate species waspresent during the surveys, giant clam(1.25 individuals per 100 m2) (Fig.2.3ab(iii)). Banded coral shrimp, diadema,pencil and collector urchin, sea cucumber,COTs, triton and lobster were absent.
Figure 2.3ab(iii). Invertebrate abundance for Old Man of the Sea.
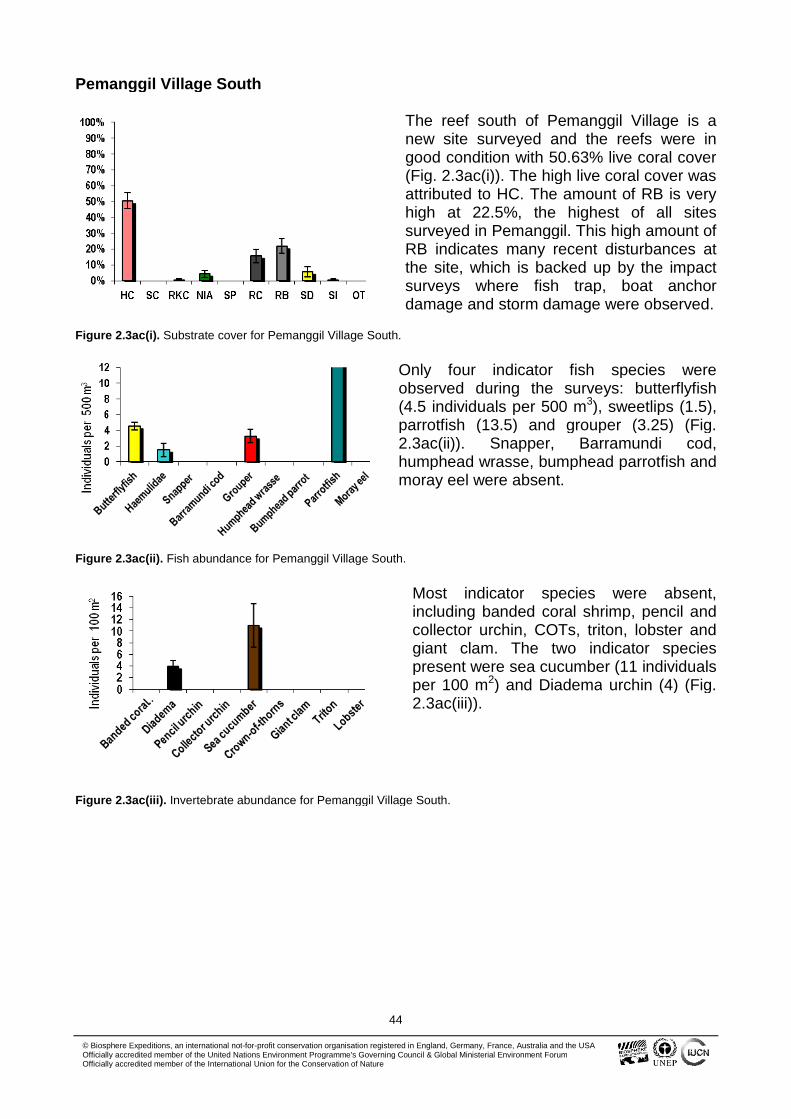
44
© Biosphere Expeditions, an international not-for-profit conservation organisation registered in England, Germany, France, Australia and the USAOfficially accredited member of the United Nations Environment Programme's Governing Council & Global Ministerial Environment ForumOfficially accredited member of the International Union for the Conservation of Nature
Pemanggil Village South
The reef south of Pemanggil Village is anew site surveyed and the reefs were ingood condition with 50.63% live coral cover(Fig. 2.3ac(i)). The high live coral cover wasattributed to HC. The amount of RB is veryhigh at 22.5%, the highest of all sitessurveyed in Pemanggil. This high amount ofRB indicates many recent disturbances atthe site, which is backed up by the impactsurveys where fish trap, boat anchordamage and storm damage were observed.
Figure 2.3ac(i). Substrate cover for Pemanggil Village South.
Only four indicator fish species wereobserved during the surveys: butterflyfish(4.5 individuals per 500 m3), sweetlips (1.5),parrotfish (13.5) and grouper (3.25) (Fig.2.3ac(ii)). Snapper, Barramundi cod,humphead wrasse, bumphead parrotfish andmoray eel were absent.
Figure 2.3ac(ii). Fish abundance for Pemanggil Village South.
Most indicator species were absent,including banded coral shrimp, pencil andcollector urchin, COTs, triton, lobster andgiant clam. The two indicator speciespresent were sea cucumber (11 individualsper 100 m2) and Diadema urchin (4) (Fig.2.3ac(iii)).
Figure 2.3ac(iii). Invertebrate abundance for Pemanggil Village South.
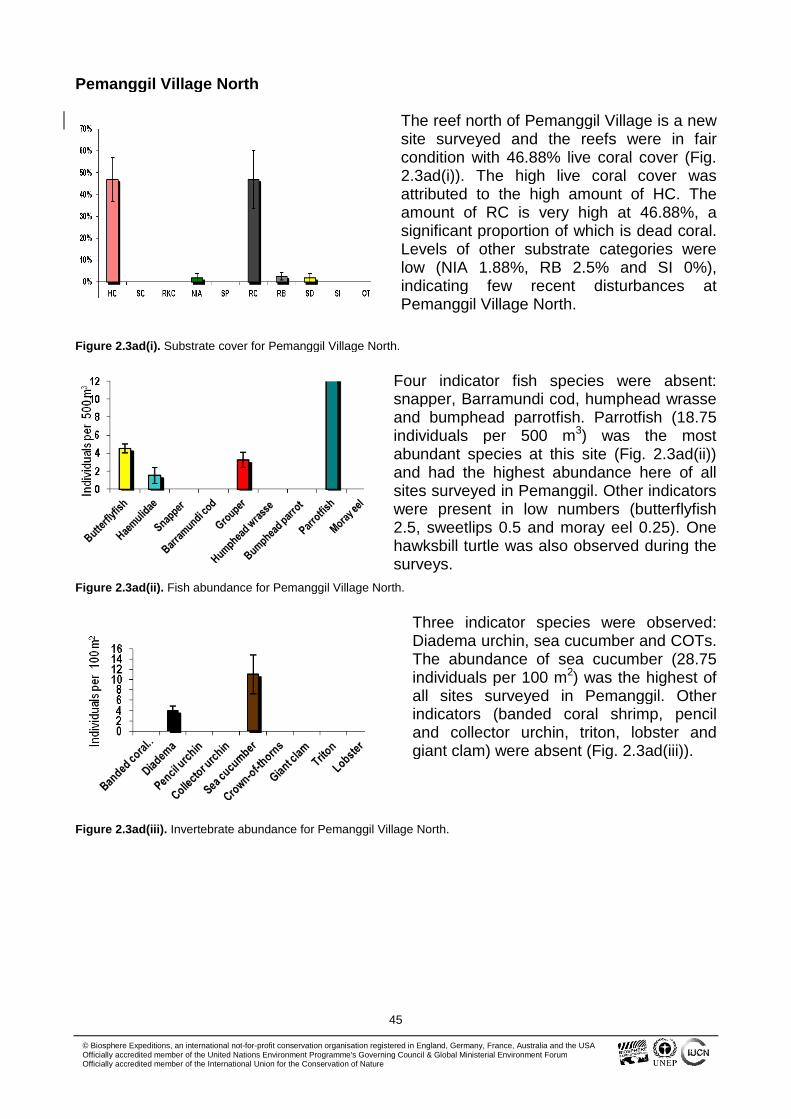
45
© Biosphere Expeditions, an international not-for-profit conservation organisation registered in England, Germany, France, Australia and the USAOfficially accredited member of the United Nations Environment Programme's Governing Council & Global Ministerial Environment ForumOfficially accredited member of the International Union for the Conservation of Nature
Pemanggil Village North
The reef north of Pemanggil Village is a newsite surveyed and the reefs were in faircondition with 46.88% live coral cover (Fig.2.3ad(i)). The high live coral cover wasattributed to the high amount of HC. Theamount of RC is very high at 46.88%, asignificant proportion of which is dead coral.Levels of other substrate categories werelow (NIA 1.88%, RB 2.5% and SI 0%),indicating few recent disturbances atPemanggil Village North.
Figure 2.3ad(i). Substrate cover for Pemanggil Village North.
Four indicator fish species were absent:snapper, Barramundi cod, humphead wrasseand bumphead parrotfish. Parrotfish (18.75individuals per 500 m3) was the mostabundant species at this site (Fig. 2.3ad(ii))and had the highest abundance here of allsites surveyed in Pemanggil. Other indicatorswere present in low numbers (butterflyfish2.5, sweetlips 0.5 and moray eel 0.25). Onehawksbill turtle was also observed during thesurveys.
Figure 2.3ad(ii). Fish abundance for Pemanggil Village North.
Three indicator species were observed:Diadema urchin, sea cucumber and COTs.The abundance of sea cucumber (28.75individuals per 100 m2) was the highest ofall sites surveyed in Pemanggil. Otherindicators (banded coral shrimp, penciland collector urchin, triton, lobster andgiant clam) were absent (Fig. 2.3ad(iii)).
Figure 2.3ad(iii). Invertebrate abundance for Pemanggil Village North.
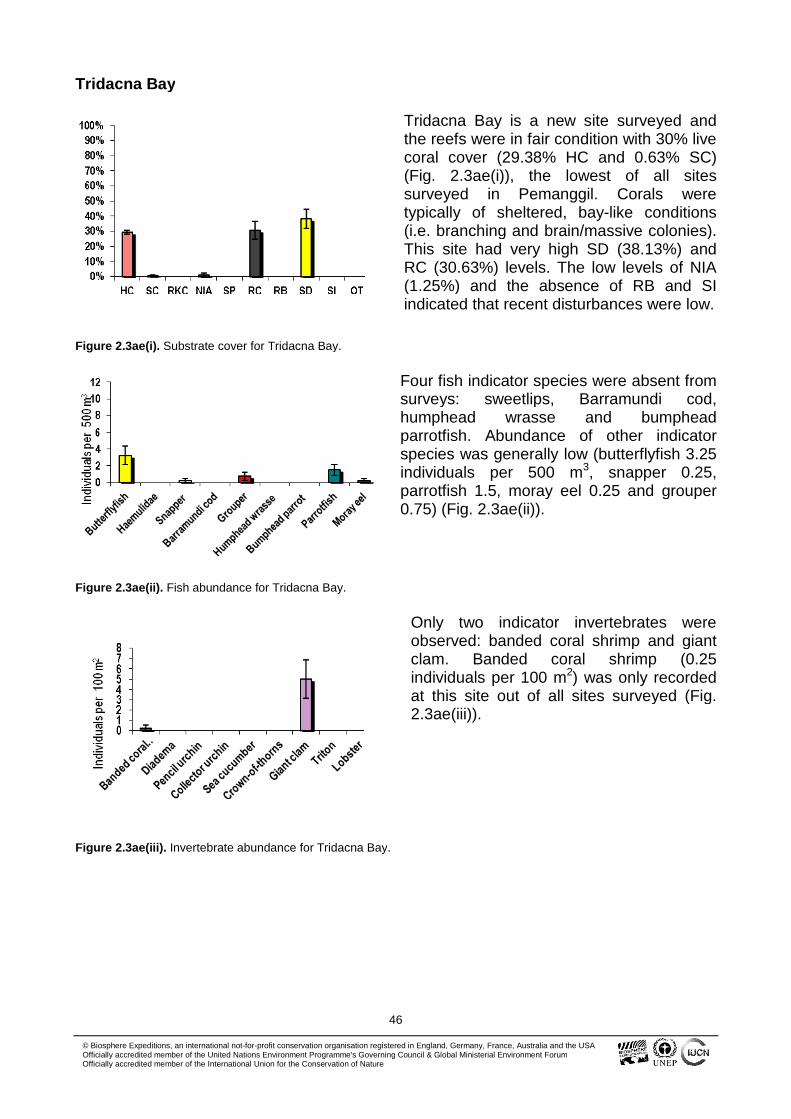
46
© Biosphere Expeditions, an international not-for-profit conservation organisation registered in England, Germany, France, Australia and the USAOfficially accredited member of the United Nations Environment Programme's Governing Council & Global Ministerial Environment ForumOfficially accredited member of the International Union for the Conservation of Nature
Tridacna Bay
Tridacna Bay is a new site surveyed andthe reefs were in fair condition with 30% livecoral cover (29.38% HC and 0.63% SC)(Fig. 2.3ae(i)), the lowest of all sitessurveyed in Pemanggil. Corals weretypically of sheltered, bay-like conditions(i.e. branching and brain/massive colonies).This site had very high SD (38.13%) andRC (30.63%) levels. The low levels of NIA(1.25%) and the absence of RB and SIindicated that recent disturbances were low.
Figure 2.3ae(i). Substrate cover for Tridacna Bay.
Four fish indicator species were absent fromsurveys: sweetlips, Barramundi cod,humphead wrasse and bumpheadparrotfish. Abundance of other indicatorspecies was generally low (butterflyfish 3.25individuals per 500 m3, snapper 0.25,parrotfish 1.5, moray eel 0.25 and grouper0.75) (Fig. 2.3ae(ii)).
Figure 2.3ae(ii). Fish abundance for Tridacna Bay.
Only two indicator invertebrates wereobserved: banded coral shrimp and giantclam. Banded coral shrimp (0.25individuals per 100 m2) was only recordedat this site out of all sites surveyed (Fig.2.3ae(iii)).
Figure 2.3ae(iii). Invertebrate abundance for Tridacna Bay.
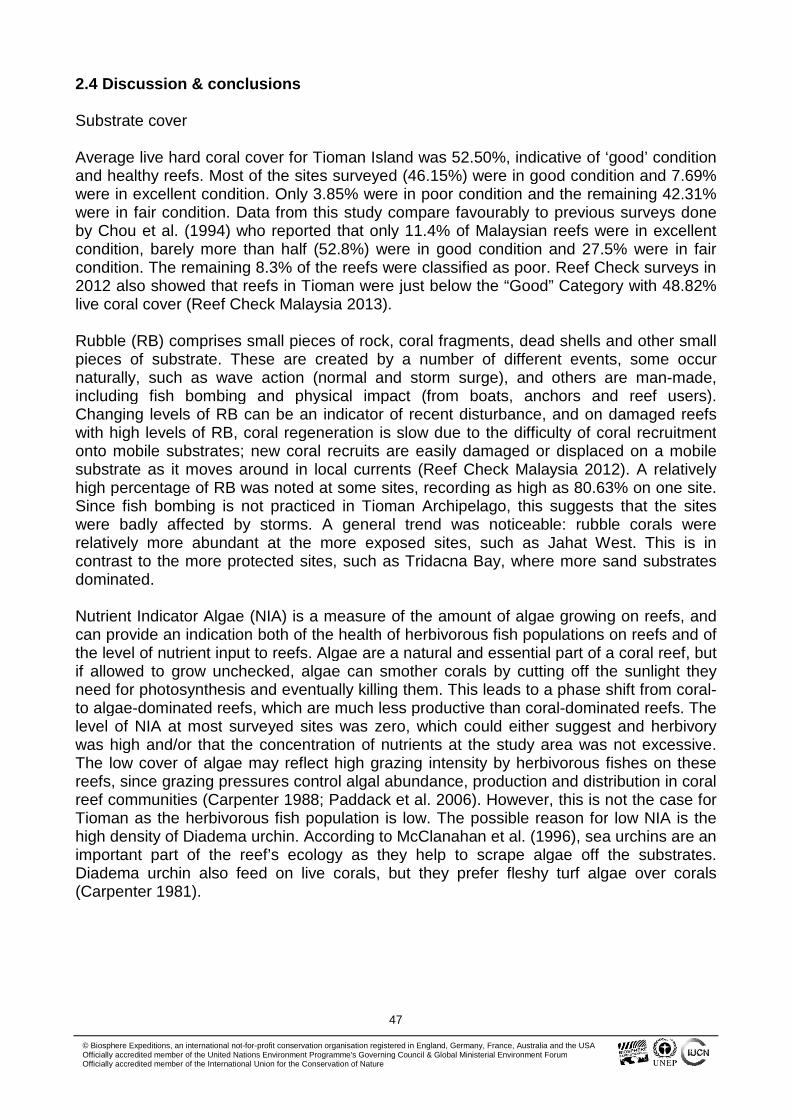
47
© Biosphere Expeditions, an international not-for-profit conservation organisation registered in England, Germany, France, Australia and the USAOfficially accredited member of the United Nations Environment Programme's Governing Council & Global Ministerial Environment ForumOfficially accredited member of the International Union for the Conservation of Nature
2.4 Discussion & conclusions
Substrate cover
Average live hard coral cover for Tioman Island was 52.50%, indicative of ‘good’ conditionand healthy reefs. Most of the sites surveyed (46.15%) were in good condition and 7.69%were in excellent condition. Only 3.85% were in poor condition and the remaining 42.31%were in fair condition. Data from this study compare favourably to previous surveys doneby Chou et al. (1994) who reported that only 11.4% of Malaysian reefs were in excellentcondition, barely more than half (52.8%) were in good condition and 27.5% were in faircondition. The remaining 8.3% of the reefs were classified as poor. Reef Check surveys in2012 also showed that reefs in Tioman were just below the “Good” Category with 48.82%live coral cover (Reef Check Malaysia 2013).
Rubble (RB) comprises small pieces of rock, coral fragments, dead shells and other smallpieces of substrate. These are created by a number of different events, some occurnaturally, such as wave action (normal and storm surge), and others are man-made,including fish bombing and physical impact (from boats, anchors and reef users).Changing levels of RB can be an indicator of recent disturbance, and on damaged reefswith high levels of RB, coral regeneration is slow due to the difficulty of coral recruitmentonto mobile substrates; new coral recruits are easily damaged or displaced on a mobilesubstrate as it moves around in local currents (Reef Check Malaysia 2012). A relativelyhigh percentage of RB was noted at some sites, recording as high as 80.63% on one site.Since fish bombing is not practiced in Tioman Archipelago, this suggests that the siteswere badly affected by storms. A general trend was noticeable: rubble corals wererelatively more abundant at the more exposed sites, such as Jahat West. This is incontrast to the more protected sites, such as Tridacna Bay, where more sand substratesdominated.
Nutrient Indicator Algae (NIA) is a measure of the amount of algae growing on reefs, andcan provide an indication both of the health of herbivorous fish populations on reefs and ofthe level of nutrient input to reefs. Algae are a natural and essential part of a coral reef, butif allowed to grow unchecked, algae can smother corals by cutting off the sunlight theyneed for photosynthesis and eventually killing them. This leads to a phase shift from coral-to algae-dominated reefs, which are much less productive than coral-dominated reefs. Thelevel of NIA at most surveyed sites was zero, which could either suggest and herbivorywas high and/or that the concentration of nutrients at the study area was not excessive.The low cover of algae may reflect high grazing intensity by herbivorous fishes on thesereefs, since grazing pressures control algal abundance, production and distribution in coralreef communities (Carpenter 1988; Paddack et al. 2006). However, this is not the case forTioman as the herbivorous fish population is low. The possible reason for low NIA is thehigh density of Diadema urchin. According to McClanahan et al. (1996), sea urchins are animportant part of the reef’s ecology as they help to scrape algae off the substrates.Diadema urchin also feed on live corals, but they prefer fleshy turf algae over corals(Carpenter 1981).
48
© Biosphere Expeditions, an international not-for-profit conservation organisation registered in England, Germany, France, Australia and the USAOfficially accredited member of the United Nations Environment Programme's Governing Council & Global Ministerial Environment ForumOfficially accredited member of the International Union for the Conservation of Nature
Recently Killed Coral (RKC) results from a variety of impacts, including bleaching,predation (e.g. by crown-of-thorns starfish and Drupella snails) and other local stressors(e.g. sedimentation), while silt (SI) arises from a variety of natural sources (mangroves andmud flats) as well as from land use changes, including agriculture, forestry anddevelopment. The low level of RKC and SI recorded within the archipelago is a good signand it indicates few recent impacts on reefs.
Rock (RC) comprises both bare natural rock and dead consolidated coral that has notdisintegrated into rubble, nor been colonised by algae or invertebrates. RC is critical forreef recovery, regeneration and extension as it forms the base for new corals to recruitonto. Therefore, some amount of RC is important, and the 2013 level of 23.82% is withinnormal range. It should be noted that new coral recruits cannot settle onto RC that hassignificant algae coverage, and under these conditions settlement of new recruits will bereduced. This demonstrates the importance of healthy herbivore populations, which grazeon algae and keep it under control, providing clean surfaces for coral recruits.
Sand (SD) is a natural component of reefs, and can be expected to be found on anysurvey. Increasing amounts of SD in a given coral reef can be an indication of disturbanceas dead coral breaks off and is eroded into fine particles (sand) by wave action. Sponges(SP) are another normal component of coral reefs that, under the right conditions, canproliferate in the presence of high levels of nutrients. Similiarly to NIA, sponge will competefor space with corals and can outgrow the slower growing corals, eventually killing them.At 1.8%, the level of SP does not appear to be a threat.
Fish abundance
Butterflyfish, which are used as bioindicators of reef health (Hodgson et al 2006, Koh et al.2002), were present in low numbers. Though research has shown that the abundance ofthese fish could be directly correlated with the distribution and abundance of the corals(Crosby & Reese 1996) and that a drop in live coral cover can reduce the abundance ofbutterflyfish (Russ & Alcala 1989), others claim that there is no correlation. Koh et al.(2002) documented that there was no relationship between coral cover and the number ofbutterflyfish as not all butterflyfish are coral polyp feeders (Allen et al. 1998). Somebutterflyfish are benthic omnivores and some are planktivores (Crosby & Reese 1996).Hence, butterflyfish abundance cannot provide an accurate sign of reef health. For thisreason, the low numbers of butterflyfish recorded by this expedition do not mean that thereefs were in poor condition. However the lack of butterflyfish can indicate fishing pressureas they are highly sought after for the aquarium trade (Hodgson et al. 2004).
Though the Tioman Archipelago is protected as a Marine Park, illegal fishing clearly stilloccurs within its waters and this is reflected in fish abundance. Besides butterflyfish,parrotfish numbers were also low at most sites (average of 3.58 individuals per 500 m3).Food fish such as grouper, snappers and sweetlips were mostly absent or occurred in lowabundance. It is likely that they are being overfished. Illegal fishing activities and fish trapswere observed throughout the expedition at various sites
49
© Biosphere Expeditions, an international not-for-profit conservation organisation registered in England, Germany, France, Australia and the USAOfficially accredited member of the United Nations Environment Programme's Governing Council & Global Ministerial Environment ForumOfficially accredited member of the International Union for the Conservation of Nature
Three species greatly valued for the live fish trade, the Barramundi cod (also for theaquarium trade), bumphead parrotfish and humphead wrasse, were hardly sightedthroughout the surveys. These findings are predictable as the absence or low number ofthese species is a common finding in many studies since the advent of this fishery, and theincreasing over-fishing related to human population expansion. According to Hodgson etal. (2004), the absence of these three fish implies that they were or are heavily exploited.Exploitation in the past and current illegal fishing has inhibited population recovery evenafter more than 19 years of protection on paper.
The lack of target fish and the presence of illegal fishing within the Tioman Archipelagowere also reported by Yewdall et al (2013). Greater protection (including enforcement ofMarine Park regulations) will be necessary to aid recovery of populations of these species,and ongoing monitoring will help to track their recovery.
Invertebrate abundance
High number of Diadema urchins can result in high bioerosion rates of coral reef substrateand low topographic complexity of reefs (McClanahan & Shafir 1990), causing long-termdetrimental effects on their structure and ecology. However, they are also likely to play amajor role in controlling NIA (see section above). In the absence of fish grazers, loss orremoval of urchins may cause reefs to be dominated by fleshy algae that can outcompetehard corals for light and space (McClanahan et al. 1996). The presence of Diadema urchinin Tioman Archipelago is therefore very important in keeping the reef ecosystem inbalance. Their numbers are concentrated around certain sites corroborating the findings ofYewdall et al. (2013) and Reef Check Malaysia (2013), and indicating that predation onsmall Diadema is not controlling patchy areas of dense populations of the species(McClanahan & Shafir 1990).
Commercially important edible sea cucumbers and giant clam were in low abundance.They are consumed locally and in the past were harvested at a commercial scale for trade.Banded coral shrimp, collector urchin, pencil urchin and triton shells are highly prized bythe curio trade (Hodgson et al. 2004). However, there are no signs of collection or sale ofthese animals on the island and they are rare throughout the country (Reef CheckMalaysia 2013).
The Crown-Of-Thorns starfish (COTS) was present in low number and its scarcityindicates no COTS population outbreaks (Hodgson et al. 2004). Considerable efforts havebeen made by Marine Park authorities and local dive centres to control COTS numbers byorganising regular COTS removal activities to reduce the threat posed by these voraciouspredators of corals. Though their numbers have fallen since 2012 (0.46 individuals per 100m2) (Yewdall et al. 2013), continued monitoring is essential to track and help to managesignificant outbreaks of this dangerous coral predator. Outbreaks of COTS can causeextensive damage to hard coral cover on the reef (Comley et al. 2005) and their number inTioman are higher compared to all other islands in the region (Reef Check Malaysia 2013).It appears (from recent research on the Great Barrier Reef) that population explosions ofthe species are linked to increased levels of nutrients making planktonic survival andsettlement more successful.
50
© Biosphere Expeditions, an international not-for-profit conservation organisation registered in England, Germany, France, Australia and the USAOfficially accredited member of the United Nations Environment Programme's Governing Council & Global Ministerial Environment ForumOfficially accredited member of the International Union for the Conservation of Nature
2.5. Summary & recommendations
Reef health
The reefs around the Tioman Archipelago were generally in good, healthy condition, with52.50% live coral cover (44.90% HC and 7.60% SC). The amount of live coral at mostsites was attributed to hard coral cover and this is good as hard coral is the builder of thereef structure as opposed to soft corals, which lack the hard calcium carbonate skeletalstructure and are therefore not reef builders. Fish and invertebrate abundance wasrelatively low and the lack of herbivorous fish and invertebrates on reefs can lead toexcessive growth of algae, which in some cases can result in a phase shift from a coraldominated reef to an algal dominated reef (Paddack et al. 2006). .
Impacts damaging reef health and suggestions for management
Storm damage
Quite a few factors could have contributed to damage on the reefs of the TiomanArchipelago. Based on the results gathered during the expedition, storm disturbanceemerged as the most common cause of damage. The annual monsoon damages reefsevery year and the evidence of the damage was witnessed on most reefs around thearchipelago.
Tourist impacts
Tourism is the main economic driver on Tioman. The continuous increase in touristsvisiting the island each year has resulted in an increase in infrastructure construction.Some of these constructions are poorly planned and do not have appropriate mitigationmeasures to protect the environment (for example no sewage treatment). This can thenresult in sedimentation and nutrification of nearby reefs. Infrastructure development shouldbe strictly monitored to ensure minimum land clearing and proper mitigation measures arein place. If properly managed, such developments will not have significant impacts on thereefs.
Divers and snorkellers visiting Tioman can have a variety of physical impacts on the reefs,including touching, standing on corals, littering and boat anchoring. Boat anchor damagewas recorded at Soyak South, Tumuk, and Tekek House Reef, which are all sitescommonly visited by snorkellers, divers and yachts. It is recommended that awarenesscampaigns are implemented to educate all reef users on correct reef etiquette to minimisetheir impacts. These should be targeted both directly at tourists and at tourist operators. Itis also recommended that the Department of Marine Parks Malaysia provide adequatemooring buoys at sites frequently visited by tourists to avoid anchoring on reefs.
51
© Biosphere Expeditions, an international not-for-profit conservation organisation registered in England, Germany, France, Australia and the USAOfficially accredited member of the United Nations Environment Programme's Governing Council & Global Ministerial Environment ForumOfficially accredited member of the International Union for the Conservation of Nature
Illegal fishing
There are regular reports of illegal fishing inside the 2 nm (nautical miles) protected areaand a few instances were observed during the expedition. These often occur early in themorning and late in the evening when there are fewer tourists at the sites. Fish nets andtraps were also observed during surveys, but were generally found at isolated sites. Illegalfishing within the MPA is likely to be one of the main reasons for the low abundance of fishobserved during surveys. MPA rules must be enforced and locals must be made aware ofwhy a no-take area is important in ensuring fish stocks survive. They must also be madeaware of the benefits of no-take areas to their community.
Solid waste disposal
The high number of tourists visiting Tioman generates a huge amount of waste, puttingsignificant strain on waste collection and disposal systems. There is an incinerator at themain village, but it is not the ideal solution, as the incinerator cannot handle the amount ofwaste currently being generated. There is a need to promote waste segregation amongresorts and the local villagers, to allow easier recycling of wastes, composting of organicwastes and separation of hazardous and toxic wastes (such as used engine oil andbatteries). Though solid waste was not commonly witnessed on reefs during surveys, theamount of trash witnessed on shore along beaches and roads was high. Wastesegregation and recycling will reduce the load on the incinerator as well as instil a sense ofcaring for the environment within the community. Education and awareness campaignsshould be implemented to promote better waste management and reduce littering,particularly among the village communities, as well as resort operators. Local towncouncils should also provide the facilities to promote recycling on the island. Governmentmust put in laws that tax resorts in order to free up funds for waste disposal systems.
Sewage treatment
High levels of NIA recorded at some sites indicate that there are excess nutrients in thewater, most likely originating from land. Most resorts and households on the islands rely onseptic tanks to treat their sewage. However, many are not correctly designed andmaintained, so overflow, releasing sewage effluent into the sea. It is recommended thatthe state governments establish a system for regular de-sludging of septic tanks, to ensurethey operate effectively. This will be a lower cost and less disruptive solution than theconstruction of large-scale, centralised sewage treatment facilities. It should also bemandatory that all resorts are fitted with septic tanks that meet the required specifications.
Future expeditions
It is recommended that in the future Pulau Tengah, Pulau Besar and Pulau Kecil areincluded in the survey sites. These islands were not covered in past expeditions and theconditions of their reefs are unknown. However, new sites should only be added if all theold sites can also be monitored. Although it is important to understand the condition ofreefs at as many sites as possible, Reef Check data makes most sense when it iscontinuous and repeated over long periods of time.
52
© Biosphere Expeditions, an international not-for-profit conservation organisation registered in England, Germany, France, Australia and the USAOfficially accredited member of the United Nations Environment Programme's Governing Council & Global Ministerial Environment ForumOfficially accredited member of the International Union for the Conservation of Nature
There is also a need for more sites to be surveyed along the east of Tioman. Currentlymost of the sites surveyed are located to the west of Tioman. Covering more sites to theeast will give a better representation of the island’s reefs.
It is also advised that more permanent transects need to be placed to ensure monitoring ofthe same reef areas, which will then give more accurate data on changes occurring on thereef.
2.6. Literature cited
Allen, G. R. 1991. Damselfishes of the World. Mergus Publishers, Melle, Germany.
Allen, G. R., Steene, R., and Allen, M. 1998. A Guide to Angelfishes and Butterflyfishes. OdysseyPublishing/ Tropical Reef Research. Kallaroo, West Australia pp. 250.
Burke, L., Selig, E., and Spalding, M. 2002. Reefs at Risk in South East Asia. World ResourcesInstitute, Washington, D.C.
Carpenter, R. C. 1981. Grazing by Diadema antillarum (Philippi) and its effects on the benthic algalcommunity. Journal of Marine Research 39, pp. 749-765.
Carpenter, R. C. 1988. Mass mortality of a Caribbean sea urchin: immediate effects on communitymetabolism and other herbivores. Proceedings of the National Academy of Sciences USA 85, pp.511-514.
Chou, L. M., Wilkinson, C., Gomez, E., and Sudara, S. 1994. Status of Coral Reefs in the AsianRegion. In: Wilkinson, C. (ed). Report of the Consultative Forum: Third ASEAN-AustraliaSymposium on Living Coastal Resources of Southeast Asia: Status and Management, Bangkok,Thailand, May 1994. Australian Institute of Marine Science, Australia, pp. 8-12.
Comley, J., Allen, D., Ramsay, A., Smith, I., and Raines, P. 2005. Malaysia Coral ReefConservation Project: Pulau Payar. Report to the Department of Marine Parks, Malaysia.
Crosby, M. P. and Reese, E. S. 1996. A Manual for Monitoring Coral Reefs with Indicator Species:Butterflyfishes as Indicators of Change on Indo-Pacific Reefs. Office of Ocean and CoastalResource Management, National Oceanic and Atmospheric Administration, Silver Spring, MD.
Harriet, V., Goggin, L., and Sweatman, H. 2003. Crown-of-thorns Starfish on the Great BarrierReef. Current State of Knowledge November 2003 (Revised Edition). CRC Reef Research CentreLtd., Queensland, Australia.
Hodgson, G., Kiene, W., Mihaly, J., Liebeler, J., Shuman, C., and Maun, L. 2004. Reef CheckInstruction Manual: A Guide to Reef Check Coral Reef Monitoring. Reef Check, Institute of theEnvironment, University of California, Los Angeles.
Hodgson, G., Hill, J., Kiene, W., Maun, L., Mihaly, J., Liebeler, J., Shuman, C., and Torres, R.2006. Reef Check Instruction Manual: A Guide to Reef Check Coral Reef Monitoring. Reef CheckInstitute of the Environment, University of California, Los Angeles, pp. 86.
Koh, L. L., Chou, L. M., and Tun, K. P. P. 2002. The Status of Coral Reefs of Pulau Banggi and itsVicinity, Sabah, Based on Surveys in June 2002. Reef Ecology Study Team (REST) Report 2/02.Department of Biological Sciences, National University of Singapore.
53
© Biosphere Expeditions, an international not-for-profit conservation organisation registered in England, Germany, France, Australia and the USAOfficially accredited member of the United Nations Environment Programme's Governing Council & Global Ministerial Environment ForumOfficially accredited member of the International Union for the Conservation of Nature
McClanahan, T. R. and Shafir, S. H. 1990. Causes and consequences of sea urchin abundanceand diversity in Kenyan coral reef lagoons. Oecologia 83, pp. 362-370.McClanahan, T. R., Kamukuru, A. T., Muthiga, N. A., Gilagabher Yebio, M., and Obura, D. 1996.Effect of sea urchin reductions on algae, coral and fish populations. Conservation Biology 10, pp.136-154.
Paddack, M. J., Cowen, R. K., and Sponaugle, S. 2006. Grazing pressure of herbivorous coral reeffishes on low coral-cover reefs. Coral Reefs 25, pp. 461-472.
Pendleton, L. H. 1995. Valuing coral reef protection. Ocean & Coastal Management 26 (2), pp.119-131.
Pilcher, N. and Cabanban, A. 2000. The Status of Coral Reefs in Eastern Malaysia. Report forGlobal Coral Reef Monitoring Network, Australian Institute of Marine Science, Townsville.
Reef Check Malaysia 2013. Status of Coral Reefs in Malaysia 2012. Reef Check Malaysia SurveyReport, Reef Check Malaysia.
Russ, G. R. and Alcala, A. C. 1989. Effects of intense fishing pressure on an assemblage of coralreef fishes. Marine Ecology Progress Series 56, pp. 13-27.
Soekarno, R. 1989. Comparative studies in the status of Indonesian coral reefs. NetherlandsJournal of Sea Research 23 (2), pp. 215-222.
Tebano, T. and Riinga, T. 2002. Some Deep Water Eels of Tarawa Atoll, Kiribati: the Gymnothoraxsp. (Muraenidae) and Their Spawning Season. USP Marine Studies Programme, Suva.
Tun, K., Chou, L. M., Cabanban, A., Tuan, V. S., Philreefs, Yeemin, T., Suharsono, Sour, K., andLane, D. 2004. Status of Coral Reefs, Coral Reef Monitoring and Management in Southeast Asia.In: Wilkinson, C. (ed). Status of Coral Reefs of the World 2004. Volume 1. Australian Institute ofMarine Science, Australia, pp. 235-275.
Wilkinson, C. 1994. Report of the Consultative Forum: Third ASEAN-Australia Symposium onLiving Coastal Resources of Southeast Asia: Status and Management, Bangkok Thailand, May1994. Australian Institute of Marine Science, Australia, pp. 7, 37-41.
Wilkinson, C. and Ridzwan, R. A. 1994. Causes of Coral Reef Degradation within Southeast Asia.In: Wilkinson, C. (ed). Report of the Consultative Forum: Third ASEAN-Australia Symposium onLiving Coastal Resources of Southeast Asia: Status and Management, Bangkok, Thailand, May1994. Australian Institute of Marine Science, Australia, pp. 18-24.
Yewdall, K., Hammer, M. and Stickler, A. 2013. Paradise in peril: studying & protecting reefs,sharks, dolphins and turtles of the Pulau Tioman Marine Park, Malaysia. Biosphere Expeditions,Norwich, UK. Expedition report available via www.biosphere-expeditions.org/reports.
54
© Biosphere Expeditions, an international not-for-profit conservation organisation registered in England, Germany, France, Australia and the USAOfficially accredited member of the United Nations Environment Programme's Governing Council & Global Ministerial Environment ForumOfficially accredited member of the International Union for the Conservation of Nature
Appendix I: Expedition diary and reports
A multimedia expedition diary is available athttp://biosphereexpeditions.wordpress.com/category/expedition-blogs/malaysia-2013/.
All expedition reports, including this and previous expeditionreports, are available at www.biosphere-expeditions.org/reports.