palaeomagnetic, geochronological and geochemical … söderlund h, jennifer a. tait a, kamleshwar...
TRANSCRIPT

Lithos 174 (2013) 125–143
Contents lists available at SciVerse ScienceDirect
Lithos
j ourna l homepage: www.e lsev ie r .com/ locate / l i thos
Palaeomagnetic, geochronological and geochemical study of MesoproterozoicLakhna Dykes in the Bastar Craton, India: Implications for theMesoproterozoic supercontinent
Sergei A. Pisarevsky a,b,c,⁎, Tapas Kumar Biswal d, Xuan-Ce Wang b,c, Bert De Waele e, Richard Ernst f,g,Ulf Söderlund h, Jennifer A. Tait a, Kamleshwar Ratre d, Yengkhom Kesorjit Singh d, Mads Cleve h
a The Grant Institute, School of Geosciences, University of Edinburgh, King's Buildings, Edinburgh, EH9 3JW, UKb ARC Centre of Excellence for Core to Crust Fluid Systems (CCFS), Department of Applied Geology, Curtin University, GPO Box U1987, Perth, WA 6845, Australiac The Institute for Geoscience Research (TIGeR), Department of Applied Geology, Curtin University, GPO Box U1987, Perth, WA 6845, Australiad Department of Earth Sciences, Indian Institute of Technology Bombay, Powai, Mumbai, 400076, Indiae SRK Consulting, 10 Richardson Street, WA6005 West Perth, Australiaf Department of Earth Sciences, Carleton University, Ottawa, K1S 5B6, Canadag Ernst Geosciences,43 Margrave Avenue, Ottawa, K1T 3Y2, Canadah Department of Geology, Lund University, Sölvegatan 12, SE-223 62 Lund, Sweden
⁎ Corresponding author at: School of Earth and EnviroAustralia, 35 Stirling Highway, Crawley, WA 6009, Ausfax: +61 8 6488 1037.
E-mail addresses: [email protected],(S.A. Pisarevsky), [email protected] (T.K. Biswal).
0024-4937/$ – see front matter © 2012 Elsevier B.V. Allhttp://dx.doi.org/10.1016/j.lithos.2012.07.015
a b s t r a c t
a r t i c l e i n f oArticle history:Received 23 February 2012Accepted 18 July 2012Available online 25 July 2012
Keywords:PaleomagnetismDykesSupercontinentColumbiaProterozoicIndia
Palaeomagnetic analysis of the Lakhna Dykes (Bastar Craton, India) yields a palaeopole at 36.6°N, 132.8°E,dp=12.4°, dm=15.9°, and the U\Pb zircon age obtained from one of the rhyolitic dykes is 1466.4±2.6 Ma (MSWD=0.21, concordia age based on two analyses with identical Pb/U ages), similar to previouslypublished U\Pb ages. Major and trace element analyses of the Lakhna Dykes show shoshonitic and high-Kcalc-alkaline affinities consistent with a subduction related characteristics suggesting an active continentalmargin setting. This is in keeping with the Palaeo- to Mesoproterozoic tectonic environments in the easternIndian margin. The new 1460 Ma Indian palaeopole was used to test possible palaeopositions of India withinthe Mesoproterozoic supercontinent Columbia. Of the four palaeomagnetically permissible reconstructions,juxtaposing western India against south-west Baltica is geologically the most reliably constrained and bestfitting model. Our preferred reconstruction implies a long Palaeo- to Mesoproterozoic accretionary orogenstretching from south-eastern Laurentia through south-western Baltica to south-eastern India. Breakup ofIndia and Baltica probably occurred in the Late Mesoproterozoic, but additional constraints are needed.
© 2012 Elsevier B.V. All rights reserved.
1. Introduction
An increasing number of publications indicates a growing interest inthe Mesoproterozoic palaeogeography and to a hypothetic pre-Rodiniansupercontinent variously called Nuna, or Columbia, or Hudsonland(e.g., Condie, 2000; Evans and Mitchell, 2011; Hoffman, 1996; Meert,2002, 2012; Pesonen et al., 2003; Pisarevsky and Bylund, 2010; Rogersand Santosh, 2002, 2009; Wingate et al., 2009; Zhao et al., 2004). One ofthe main reasons for the Columbia hypothesis lies in the widespreadevidence for 2.1-1.8 Ga orogens in the majority of Mesoproterozoiccontinents (e.g., Condie, 2000; Zhao et al., 2004 and references there-in) and the suggestion that some or all of these orogens resultedfrom a supercontinental assembly. Unfortunately, most Columbia
nment, University of Westerntralia. Tel.: +61 8 6488 5076;
rights reserved.
reconstructions are highly speculative and sometimes technically in-correct mostly due to a deficit of high quality Late Palaeoproterozoicand Mesoproterozoic palaeomagnetic data. For example, Evans andPisarevsky (2008) argue that out of 600 published 1600–1200 Mapalaeopoles (Pisarevsky, 2005) for all Precambrian cratons, only eight sat-isfy all necessary reliability criteria. A few more recently reportedpalaeomagnetic poles (e.g., Bispo-Santos et al., 2008, 2012; Hallset al., 2006; Lubnina et al., 2010; Pisarevsky and Bylund, 2010;Salminen and Pesonen, 2007) have improved the situation some-what, but there are still not enough poles to construct an adequateApparent Polar Wander Path (APWP) for any one craton, let alonethe globally disparate cratons. However, the presence of pairs ofprecisely coeval palaeopoles from the same two cratonic blockscan provide a palaeomagnetic test of the assumption that thesetwo continents drifted together as parts of a larger supercontinent(Buchan, 2007; Evans and Pisarevsky, 2008). Luckily there are afew such pairs between 1800 and 1000 Ma: there are reliablepalaeopoles from both Laurentia and Baltica at 1780–1740 Ma,1480–1460 Ma and 1270–1260 Ma (see Table 2 of Pisarevsky and
(a)
(b)
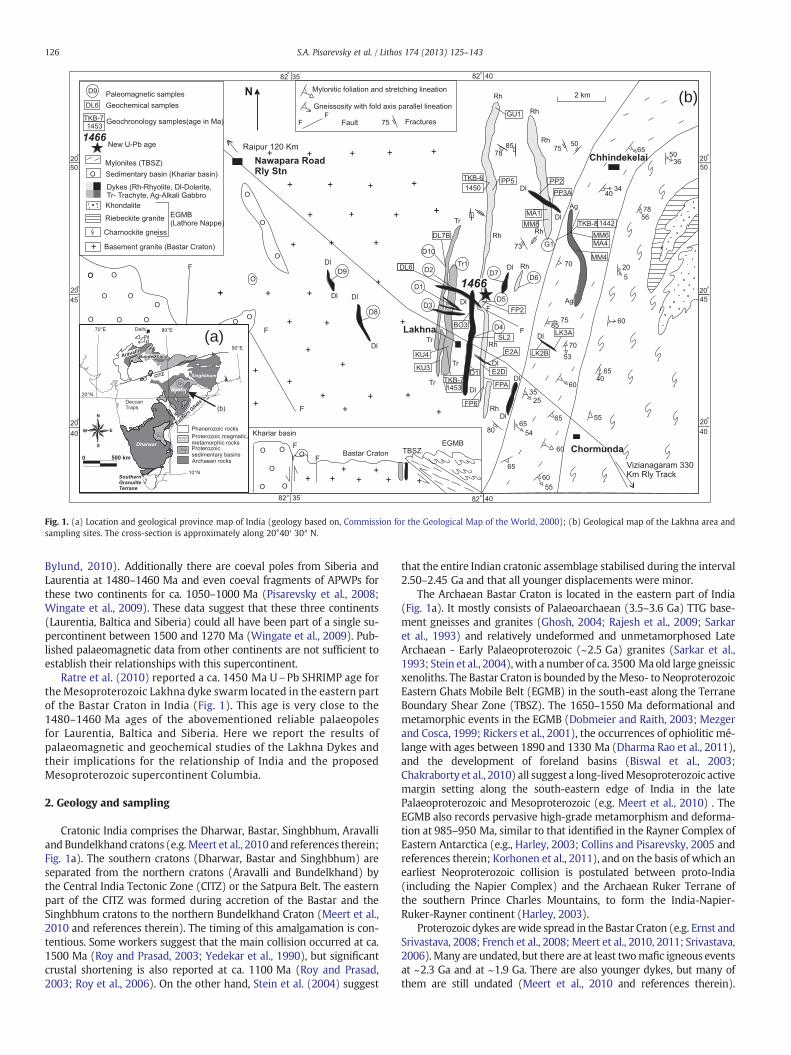
Fig. 1. (a) Location and geological province map of India (geology based on, Commission for the Geological Map of the World, 2000); (b) Geological map of the Lakhna area andsampling sites. The cross-section is approximately along 20°40′ 30″ N.
126 S.A. Pisarevsky et al. / Lithos 174 (2013) 125–143
Bylund, 2010). Additionally there are coeval poles from Siberia andLaurentia at 1480–1460 Ma and even coeval fragments of APWPs forthese two continents for ca. 1050–1000 Ma (Pisarevsky et al., 2008;Wingate et al., 2009). These data suggest that these three continents(Laurentia, Baltica and Siberia) could all have been part of a single su-percontinent between 1500 and 1270 Ma (Wingate et al., 2009). Pub-lished palaeomagnetic data from other continents are not sufficient toestablish their relationships with this supercontinent.
Ratre et al. (2010) reported a ca. 1450 Ma U\Pb SHRIMP age forthe Mesoproterozoic Lakhna dyke swarm located in the eastern partof the Bastar Craton in India (Fig. 1). This age is very close to the1480–1460 Ma ages of the abovementioned reliable palaeopolesfor Laurentia, Baltica and Siberia. Here we report the results ofpalaeomagnetic and geochemical studies of the Lakhna Dykes andtheir implications for the relationship of India and the proposedMesoproterozoic supercontinent Columbia.
2. Geology and sampling
Cratonic India comprises the Dharwar, Bastar, Singhbhum, Aravalliand Bundelkhand cratons (e.g.Meert et al., 2010 and references therein;Fig. 1a). The southern cratons (Dharwar, Bastar and Singhbhum) areseparated from the northern cratons (Aravalli and Bundelkhand) bythe Central India Tectonic Zone (CITZ) or the Satpura Belt. The easternpart of the CITZ was formed during accretion of the Bastar and theSinghbhum cratons to the northern Bundelkhand Craton (Meert et al.,2010 and references therein). The timing of this amalgamation is con-tentious. Some workers suggest that the main collision occurred at ca.1500 Ma (Roy and Prasad, 2003; Yedekar et al., 1990), but significantcrustal shortening is also reported at ca. 1100 Ma (Roy and Prasad,2003; Roy et al., 2006). On the other hand, Stein et al. (2004) suggest
that the entire Indian cratonic assemblage stabilised during the interval2.50–2.45 Ga and that all younger displacements were minor.
The Archaean Bastar Craton is located in the eastern part of India(Fig. 1a). It mostly consists of Palaeoarchaean (3.5–3.6 Ga) TTG base-ment gneisses and granites (Ghosh, 2004; Rajesh et al., 2009; Sarkaret al., 1993) and relatively undeformed and unmetamorphosed LateArchaean - Early Palaeoproterozoic (~2.5 Ga) granites (Sarkar et al.,1993; Stein et al., 2004),with a number of ca. 3500 Maold large gneissicxenoliths. The Bastar Craton is bounded by theMeso- to NeoproterozoicEastern Ghats Mobile Belt (EGMB) in the south-east along the TerraneBoundary Shear Zone (TBSZ). The 1650–1550 Ma deformational andmetamorphic events in the EGMB (Dobmeier and Raith, 2003; Mezgerand Cosca, 1999; Rickers et al., 2001), the occurrences of ophiolitic mé-lange with ages between 1890 and 1330 Ma (Dharma Rao et al., 2011),and the development of foreland basins (Biswal et al., 2003;Chakraborty et al., 2010) all suggest a long-livedMesoproterozoic activemargin setting along the south-eastern edge of India in the latePalaeoproterozoic and Mesoproterozoic (e.g. Meert et al., 2010) . TheEGMB also records pervasive high-grade metamorphism and deforma-tion at 985–950 Ma, similar to that identified in the Rayner Complex ofEastern Antarctica (e.g., Harley, 2003; Collins and Pisarevsky, 2005 andreferences therein; Korhonen et al., 2011), and on the basis of which anearliest Neoproterozoic collision is postulated between proto-India(including the Napier Complex) and the Archaean Ruker Terrane ofthe southern Prince Charles Mountains, to form the India-Napier-Ruker-Rayner continent (Harley, 2003).
Proterozoic dykes arewide spread in the Bastar Craton (e.g. Ernst andSrivastava, 2008; French et al., 2008; Meert et al., 2010, 2011; Srivastava,2006).Many are undated, but there are at least twomafic igneous eventsat ~2.3 Ga and at ~1.9 Ga. There are also younger dykes, but many ofthem are still undated (Meert et al., 2010 and references therein).

Fig. 2. Photomicrographs in transmitted (a–d) and reflected (e–h) light: (a) rhyolite showing quartz (Q) and feldsdpar phenocrysts (Or) in a fine to medium grainedquartzofeldspathic groundmass; (b) trachyte with single or multiple feldspars phenocrysts (Or — Orthoclase, Plg — Plagioclase); (c) dolerite showing augite (Px) (colored mineral)and plagioclase (Plg) (white and grey shade) crystals with irregular grain margin; (d) alkali gabbro showing intergrowth between alkali (Or) and plagioclase feldspars (Plg); mag-netite (Mag) with martite (Mar) minerals of the different dyke sections (e) dolerite (DL6–D2); (f) trachyte (DL7B–D10); (g) rhyolite porphyry (MA1); (h) rhyolite porphyry withhigher magnification (MA1).
127S.A. Pisarevsky et al. / Lithos 174 (2013) 125–143

Fig. 3. Analysis of Curie points using magnetic susceptibility versus temperaturecurves.
128 S.A. Pisarevsky et al. / Lithos 174 (2013) 125–143
Dykes which are chemically comparable with the Wai Subgroup of theDeccan flood basalts, have been found near Raipur. Two of them havebeen recently dated at 63.7±2.7 Ma and 66.6±2.2 Ma (whole rock40Ar/39Ar, 2σ), which suggests an extension of the Deccan Large IgneousProvince far beyond its present exposure (Chalapathi Rao et al., 2011).
Several dykes of mafic to felsic composition (Nanda et al., 1998)collectively called the Lakhna dyke swarm are emplaced into theBastar basement near the EGMB front in the Lakhna area (Fig. 1b).Most trend roughly N-S and the swarm includes rhyolite bodies,trachytes and some dolerite dykes with thicknesses of 10–30 m(Fig. 1b). Several smaller dolerite dykes of an EW to NW-SE trendcut the N-S dykes in several places. Two coarse-grained NNW-SSEtrending mafic dykes are found in the western part of the studiedarea (Fig. 1b). One coarse-grained deformed gabbro intrusion withinthe TBSZ is provisionally included into the Lakhna swarm. Ratre etal. (2010) reported zircon U\Pb SHRIMP ages for three LakhnaDykes Tr (TKB-7), D5 (TKB-6) and G1 (TKB-8): 1442±30 Ma,1450±22 Ma and 1453±19 Ma respectively (Fig. 1b). In 2009 wecollected 131 oriented cores for palaeomagnetic analyses fromdykes D1-D10, Tr1 and G1 (Fig. 1b). Parts of these cores were usedfor geochronological and geochemical studies. Dykes are exposed ei-ther on the hill slopes, or in small pits. Unfortunately we could notfind exposed cross-cuts or well preserved contacts with countryrocks, so it was not possible to carry out any baked contact tests. Ad-ditionally, 22 samples were collected specifically for geochemicalstudies. All sampling sites are shown in Fig. 1b.
3. Analytical methods
3.1. Palaeomagnetism
Remanence behaviour was determined by detailed stepwise alter-nating field (AF) demagnetisation (≤20 steps, up to 100 mT), using anAGICO LDA-3A tumbling demagnetiser. Thermal demagnetisation(≤20 steps, to 600 °C) was also applied using a Magnetic Measure-ments MMTD1 furnace and the 2 G cryogenic magnetometer in theUniversity of Edinburgh. Magnetic mineralogy was investigated fromdemagnetisation characteristics and, in selected samples, from detailedvariation of susceptibility versus temperature (20 to 700 °C) obtainedusing the Bartington meter in conjunction with an automatedBartington furnace. Parts of the collection were studied in thepalaeomagnetic laboratories of Oxford University (UK), Utrecht Uni-versity (Netherlands), University of Western Australia, University ofBergen (Norway) and Luleå University of Technology (Sweden).Magnetisation vectors were identified using Principal ComponentAnalysis (Kirschvink, 1980).
3.2. Geochronology
Approximately 100 grams of sample from the Lakhna dyke D5 wasprocessed for U\Pb geochronology at the Department of Geology atLund University, Sweden, using standard procedures. The ca. b200 μmfraction of crushed material was carefully mixed with water beforebeing loaded in portions (ca. 50 g per portion) on a Wilfley table(for details see Söderlund and Johansson, 2002). U\Pb TIMS analy-ses were performed at the Laboratory of Isotope Geology (LIG) andat the Natural History Museum of Stockholm. Further details ofmass spectrometry analysis, data reduction and regression aregiven by Nilsson et al. (2013-this issue).
3.3. Geochemistry
After petrographic examination, the least-altered samples wereselected for whole-rock geochemical analyses. The rocks werecrushed into small fragments (b0.5 cm in diameter) before being fur-ther cleaned and powdered in a tungsten mill. Quartz was crushedand the mill cleaned using compressed air between each sample toavoid contamination. A small amount of ca. 30 grams was takenfrom each sample and transferred to plastic containers and sent tothe Acme Analytical Laboratories Ltd (Canada) for major and trace el-ement analyses (Acme codes 4A-4B and 1DX). Total abundances ofthe major oxides and several minor elements were determined on a0.2 g sample analysed by ICP-emission spectrometry following a Lith-ium metaborate/tetraborate fusion and dilute nitric digestion, whilerare earth and refractory elements were determined by ICP massspectrometry following a Lithium metaborate/tetraborate fusion andnitric acid digestion of a 0.2 g sample aliquot. In addition, a separate0.5 g split was digested in Aqua Regia and analysed by ICP Mass Spec-trometry for Mo, Cu, Pb, Zn, Ni, As, Cd, Sb and Bi. Based on repeatedanalyses (n=21) of an in-house reference sample prepared byGEUS (Geological Survey of Denmark and Greenland) the analytical1 sigma uncertainties are between ±0.4% and ±1.1% for SiO2,Al2O3, Fe2O3, MgO, Na2O, and Ti2O and between ±2.4 and ±4.8%for K2O, TiO2, CaO, MnO and P2O5 (Kokfelt, pers. comm., 2012). Re-sults are presented in Table 3.
The geochemical analyses of 22 additional dyke samples repre-sentative of this swarm, were carried out using ICP-AES analysis(Jobin-Vyon Horiba, model: Ultima-2), X-ray fluorescence spectrom-eter (XRF) and ICP-emission spectrometry at the Department ofEarth Sciences, Indian Institute of Technology, Bombay. 0.25 gramsof powdered sample were fused with 0.75-gram lithium metaborateand 0.25-gram lithium tetraborate in platinum crucibles at a temper-ature of 1050 °C in a muffle furnace. After cooling, the crucible wasimmersed in 80 ml of 1 M HCl contained in a 150 ml glass beakerand then magnetically stirred until the fusion bead had dissolvedcompletely. Then the sample volume was made up to 100 ml in astandard volumetric flask. The same procedure was adopted tomake standard solutions and blank sample. The standards used forthe analyses include JSy-1 (syenite), JGb-2 (Basalt), JR- 3 (Rhyolite),JG-2 (Rhyolite), JG-1a (Granodiorite) (GSJ Reference standards,1998). Major, trace and LOI elements were estimated from theabove solution by ICP-emission spectrometry. Results are presentedin Table 4. The 2σ uncertainties are between 0.004% and 0.3% forSiO2, Al2O3, Fe2O3, MgO, CaO, Na2O and K2O and between 0.001%and 0.1% for TiO2, MnO and P2O5. Repeated runs give b10% RSD(relative standard deviation) for most trace elements analysed.Results of standard analyses for both laboratories are provided inAppendix C.
4. Transmitted and reflected light microscopy
The studied rhyolites are pink coloured, fine to medium grainedrocks consisting of phenocrysts of rounded to amoeboid quartz and

(a)
(b)
(c)
Fig. 4. Stereoplots and examples of demagnetisation behaviour for studied dykes. In orthogonal plots, open (closed) symbols show magnetisation vector endpoints in the vertical(horizontal) plane; curves show changes in intensity during demagnetisation. Stereoplots show upwards (downwards) pointing palaeomagnetic directions with open (closed)symbols. (a) Rhyolite; (b) dolerite; (c) trachytes.
129S.A. Pisarevsky et al. / Lithos 174 (2013) 125–143
euhedral to subhedral alkali feldspar grains (Fig. 2a). The matrix isfine to medium grained and exhibits extensive graphic intergrowth.Magnetite, zircon and green biotite occur as accessory minerals.
The trachytes are fine tomediumgrained, light greenish to very darkcoloured rocks with aphanitic and mesocratic textures (Fig. 2b). Well-developed flow layers, defined by needle-shaped alkali feldspar grains,are present in the rock. Glomeroporphyritic textures are developed dueto segregation ofmultiple feldspar phenocrysts, with flow layers swerv-ing around these aggregates.
The dolerites are dark to greenish coloured medium grained rocks,consisting of plagioclase, augite, opaques (magnetite) and amygdales(Fig. 2c). An intergranular texture is prominently developed, with au-gite crystals packed within triangular arrays of plagioclase crystals.
An intersertal texture is also present where glass occurs inside thearrays.
The alkali gabbros are coarse grained, dark coloured rocks and con-tain crude mylonitic foliations close to the TBSZ. In the less deformedunits, a cumulus texture between plagioclase, orthoclase, hornblendeand relict augites has been observed (Fig. 2d). Ophitic and subophitictextures are prominent with randomly oriented euhedral laths of pla-gioclase embedded fully or partly in larger pyroxene (or hornblendeafter augite) crystals. Inmore deformed portions, a low grademetamor-phism has transformed the augites to hornblende.
A reflected microsopy study of the dykes reveals that the opaquesare dominantly magnetite which are martitised to varying extent.Magnetite grains in dolerite and trachyte cores are coarse, euhedral

(a)
(b)
Fig. 5. Stereoplots of the site mean palaeomagnetic directions. (a) 10 dykes; (b) 8 dykes(D4 and D8 are excluded.
130 S.A. Pisarevsky et al. / Lithos 174 (2013) 125–143
to subhedral with polygonal crystalline forms. These have been vari-ously altered to martite along cubic, octahedral planes, fractures andgrain boundaries (Fig. 2e — for dolerite dyke D2, Fig. 2f — for trachytedyke D10). Fig. 2g (rhyolite dyke MA1) shows a photomicrograph of arhyolite sample where the magnetite occurs as very fine grained crys-tals disseminated throughout the rock. With larger magnification(Fig. 2h) magnetite grains in the rhyolite are found to occur insidequartz and feldspar phenocrysts. The form and mode of occurrenceof all these grains indicate the primary nature of magnetite in all stud-ied rock types.
Table 1Paleomagnetic directions of Lakhna dykes.
# Location E n/N D
N (°)
D1 20°44.957′ 82°38.951′ 10/13 50.6D2 20°45.086′ 82°39.001′ 4/4 96.0D3 20°44.890′ 82°38.937′ 10/16 57.1D4 20°43.981′ 82°39.520′ 6/11 338.5D5 20°45.114′ 82°39.853′ 7/9 64.9D6 20°45.534′ 82°40.810′ 5/5 42.2D7 20°45.533′ 82°40.341′ 6/9 293.6D8 20°44.360′ 82°36.596′ 6/8 93.8D10 20°45.153′ 82°38.924′ 14/18 51.7Tr1 20°43.840′ 82°38.785′ 11/12 19.7All mean 10/79 48.5Mean without D4,D8 8/60 58.7 62.5
N/n=number of samples/specimens; D, I=sample mean declination, inclination; k=bestcone of confidence; Plat, Plong=latitude, longitude of the palaeopole; dp ,dm=the semi‐a
5. Palaeomagnetism
Natural remanent magnetisation (NRM) intensities of samplesrange from 0.1 to 8.7 A/m for the dolerites, from 1 to 90 mA/m for thetrachyte dykes, and from 1 to 200 mA/m for the rhyolite dykes. Mag-netic susceptibilities are within 0.5–30×10−3, 1.5–3.9×10⁻⁴ and4.0–94.0×10⁻⁵ SI units correspondingly. Twenty samples provedto be very strongly magnetised with chaotic palaeomagnetic direc-tions and are interpreted as having been subjected to lightningstrikes. These samples have been excluded from further discussion.
Thermomagnetic curves (low-field magnetic susceptibility versustemperature) for dolerite samples show Hopkinson peaks close to550 °C (Fig. 3), confirming the presence of fine-grained single-domaintitanium-poor titanomagnetite.
In the greatmajority of samples both thermal andAFdemagnetisationisolated a single stable bipolar remanence component carried by low-titanium titanomagnetite with unblocking temperatures between500 °C and 580 °C. After removal of low-stability, randomly orientedoverprints, ten dykes exhibit either a medium to steep downward(D1–D6, D10, Tr1), or upward (D7, D8) direction of remanence(Figs. 4, 5; Table 1). There were no cases of mixed magnetic polaritywithin one dyke which supports a primary bipolar origin of the rem-anence. The magnetic remanence of samples from the dolerite dykeD9 and from the alkali gabbro G1 is chaotic and the results fromthese dykes were excluded from the interpretations.
In the absence of contact tests we used the following lines of evidencefor the primary origin of the stable remanence. First, the study of polishedsections and thermomagnetic analysis (Figs. 2 and 3) indicates the pres-ence of small grains of magnetite including single-domain (SD) grains.Single domain magnetite is a highly stable palaeomagnetic recorder,and must be heated close to 580 °C to reset its remanence (e.g. Pullaiahet al., 1975; Walton, 1980). As the dykes have not been metamor-phosed, such reheating is considered unlikely. Second, the presenceof polarity reversals between, but not within, intrusions is support-ive of a primary remanence. Third, the mean high-temperatureremanence direction (both polarities) is different from all youngerreliable Indian data (see discussion and McElhinny et al., 2003).
The remanence directions (Table 1) show no correlation withdyke trends nor with rock types, which suggests a relatively short in-terval of dyke emplacement, which is also supported by the similarages of the dated dykes. On the other hand, the presence of two polar-ities indicates that at least one geomagnetic reversal occurred duringthis interval, which gives an adequate time for averaging out the geo-magnetic secular variations. Remanence directions of two doleritedykes (D4 and D8, the latter–after polarity inversion) fall a bit outsidethe main group of directions (Table 1), so their exclusion improves
I K α95 Plat Plong dp dm
(°) (°) (°N) (°E) (°) (°)
58.4 19.1 11.4 43.2 137.9 12.5 16.961.6 43.4 14.1 9.7 130.4 16.8 21.859.5 11.0 15.3 38.1 137.0 17.3 23.067.1 21.2 14.9 56.3 57.4 20.5 24.756.6 19.0 14.2 32.0 141.0 14.9 20.655.1 48.6 11.1 50.3 141.4 11.2 15.8
−67.0 31.7 12.1 1.6 119.1 16.6 20.0−67.6 24.2 13.9 17.9 40.7 19.4 23.2
65.2 17.8 9.7 40.8 127.4 12.7 15.754.7 38.8 7.4 67.2 127.7 7.4 10.568.7 14.4 13.2 41.3 120.5 18.9 22.330.7 10.2 36.6 132.8 12.4 15.9
estimate of the precision parameter of Fisher (1953); α95=the semi‐angle of the 95%xes of the cone of confidence about the pole at the 95% probability level.
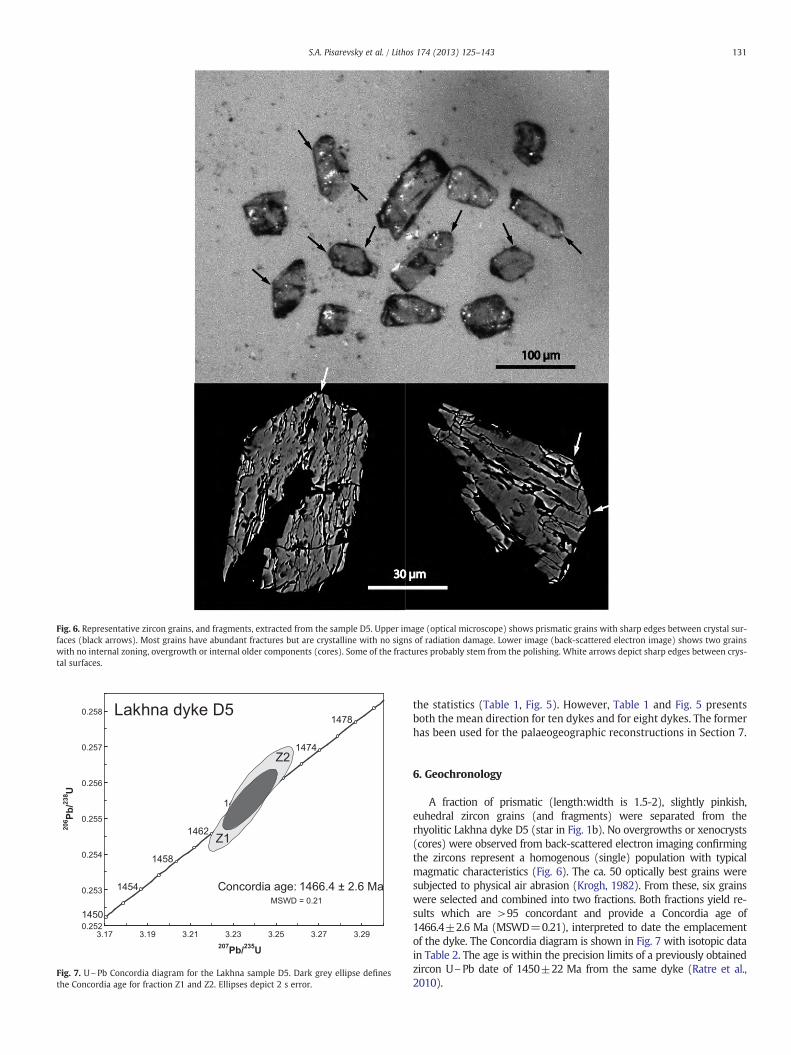
Fig. 6. Representative zircon grains, and fragments, extracted from the sample D5. Upper image (optical microscope) shows prismatic grains with sharp edges between crystal sur-faces (black arrows). Most grains have abundant fractures but are crystalline with no signs of radiation damage. Lower image (back-scattered electron image) shows two grainswith no internal zoning, overgrowth or internal older components (cores). Some of the fractures probably stem from the polishing. White arrows depict sharp edges between crys-tal surfaces.
Fig. 7. U\Pb Concordia diagram for the Lakhna sample D5. Dark grey ellipse definesthe Concordia age for fraction Z1 and Z2. Ellipses depict 2 s error.
131S.A. Pisarevsky et al. / Lithos 174 (2013) 125–143
the statistics (Table 1, Fig. 5). However, Table 1 and Fig. 5 presentsboth the mean direction for ten dykes and for eight dykes. The formerhas been used for the palaeogeographic reconstructions in Section 7.
6. Geochronology
A fraction of prismatic (length:width is 1.5-2), slightly pinkish,euhedral zircon grains (and fragments) were separated from therhyolitic Lakhna dyke D5 (star in Fig. 1b). No overgrowths or xenocrysts(cores) were observed from back-scattered electron imaging confirmingthe zircons represent a homogenous (single) population with typicalmagmatic characteristics (Fig. 6). The ca. 50 optically best grains weresubjected to physical air abrasion (Krogh, 1982). From these, six grainswere selected and combined into two fractions. Both fractions yield re-sults which are >95 concordant and provide a Concordia age of1466.4±2.6 Ma (MSWD=0.21), interpreted to date the emplacementof the dyke. The Concordia diagram is shown in Fig. 7 with isotopic datain Table 2. The age is within the precision limits of a previously obtainedzircon U\Pb date of 1450±22 Ma from the same dyke (Ratre et al.,2010).
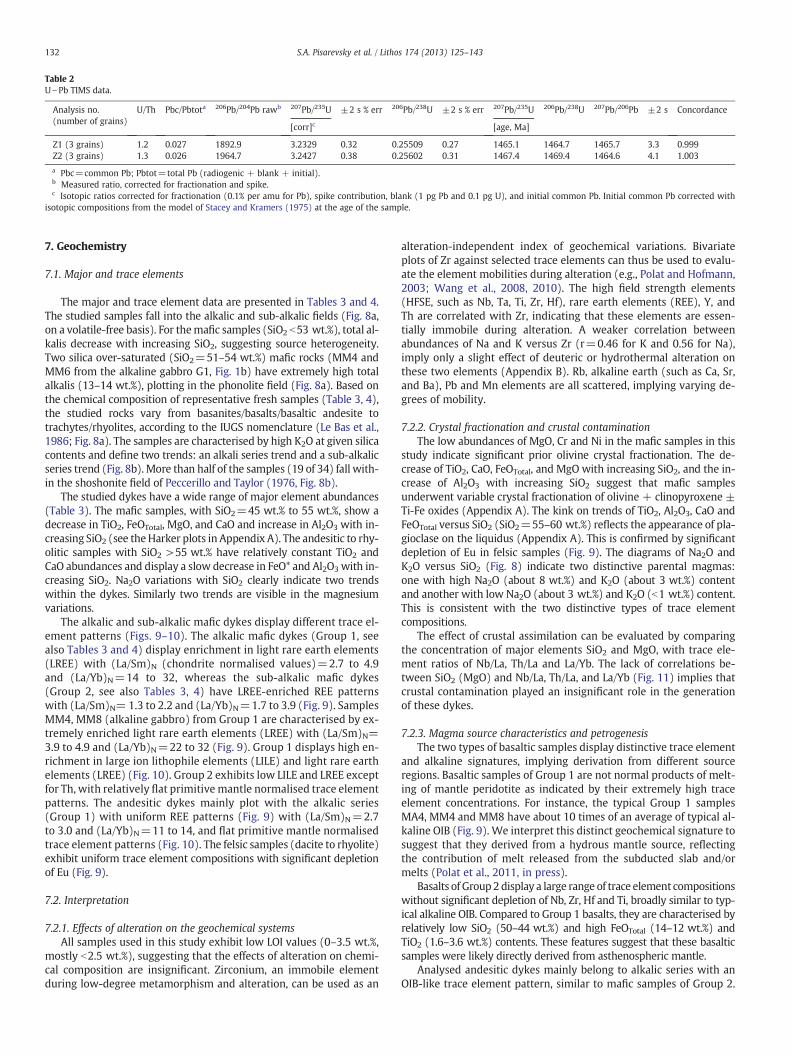
Table 2U\Pb TIMS data.
Analysis no.(number of grains)
U/Th Pbc/Pbtota 206Pb/204Pb rawb 207Pb/235U ±2 s % err 206Pb/238U ±2 s % err 207Pb/235U 206Pb/238U 207Pb/206Pb ±2 s Concordance
[corr]c [age, Ma]
Z1 (3 grains) 1.2 0.027 1892.9 3.2329 0.32 0.25509 0.27 1465.1 1464.7 1465.7 3.3 0.999Z2 (3 grains) 1.3 0.026 1964.7 3.2427 0.38 0.25602 0.31 1467.4 1469.4 1464.6 4.1 1.003
a Pbc=common Pb; Pbtot=total Pb (radiogenic + blank + initial).b Measured ratio, corrected for fractionation and spike.c Isotopic ratios corrected for fractionation (0.1% per amu for Pb), spike contribution, blank (1 pg Pb and 0.1 pg U), and initial common Pb. Initial common Pb corrected with
isotopic compositions from the model of Stacey and Kramers (1975) at the age of the sample.
132 S.A. Pisarevsky et al. / Lithos 174 (2013) 125–143
7. Geochemistry
7.1. Major and trace elements
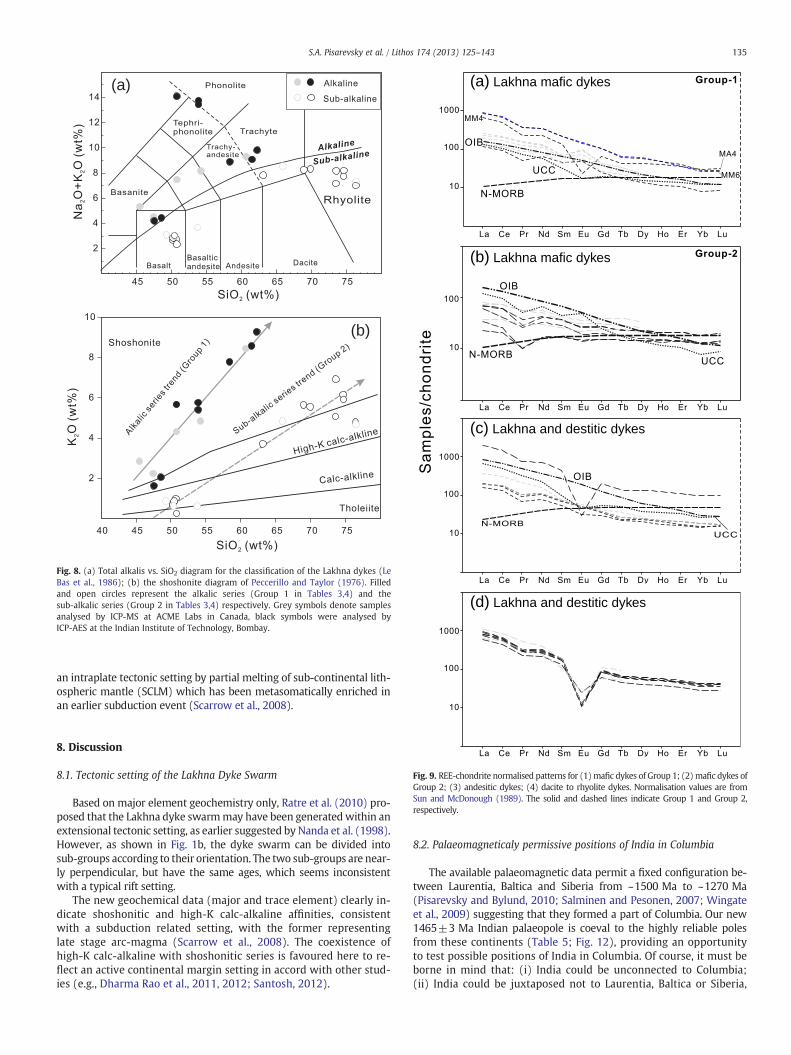
The major and trace element data are presented in Tables 3 and 4.The studied samples fall into the alkalic and sub-alkalic fields (Fig. 8a,on a volatile-free basis). For themafic samples (SiO2 b53 wt.%), total al-kalis decrease with increasing SiO2, suggesting source heterogeneity.Two silica over-saturated (SiO2=51–54 wt.%) mafic rocks (MM4 andMM6 from the alkaline gabbro G1, Fig. 1b) have extremely high totalalkalis (13–14 wt.%), plotting in the phonolite field (Fig. 8a). Based onthe chemical composition of representative fresh samples (Table 3, 4),the studied rocks vary from basanites/basalts/basaltic andesite totrachytes/rhyolites, according to the IUGS nomenclature (Le Bas et al.,1986; Fig. 8a). The samples are characterised by high K2O at given silicacontents and define two trends: an alkali series trend and a sub-alkalicseries trend (Fig. 8b). More than half of the samples (19 of 34) fall with-in the shoshonite field of Peccerillo and Taylor (1976, Fig. 8b).
The studied dykes have a wide range of major element abundances(Table 3). The mafic samples, with SiO2=45 wt.% to 55 wt.%, show adecrease in TiO2, FeOTotal, MgO, and CaO and increase in Al2O3 with in-creasing SiO2 (see theHarker plots in Appendix A). The andesitic to rhy-olitic samples with SiO2 >55 wt.% have relatively constant TiO2 andCaO abundances and display a slow decrease in FeO* and Al2O3 with in-creasing SiO2. Na2O variations with SiO2 clearly indicate two trendswithin the dykes. Similarly two trends are visible in the magnesiumvariations.
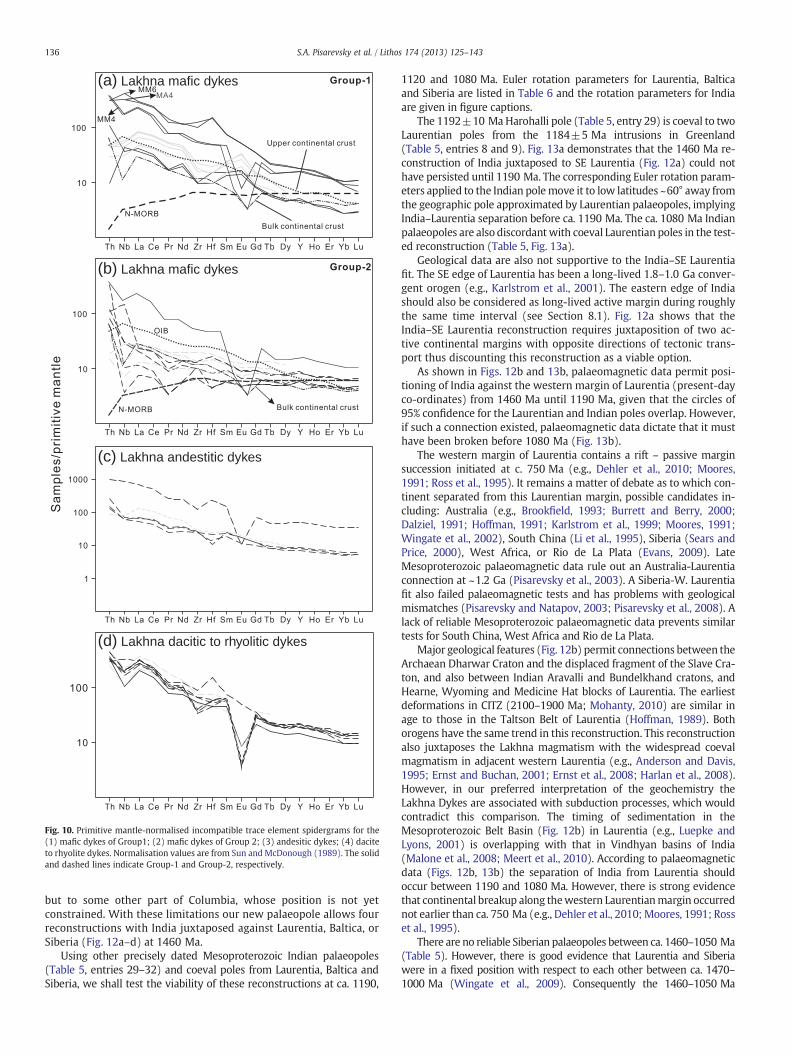
The alkalic and sub-alkalic mafic dykes display different trace el-ement patterns (Figs. 9–10). The alkalic mafic dykes (Group 1, seealso Tables 3 and 4) display enrichment in light rare earth elements(LREE) with (La/Sm)N (chondrite normalised values)=2.7 to 4.9and (La/Yb)N=14 to 32, whereas the sub-alkalic mafic dykes(Group 2, see also Tables 3, 4) have LREE-enriched REE patternswith (La/Sm)N= 1.3 to 2.2 and (La/Yb)N=1.7 to 3.9 (Fig. 9). SamplesMM4, MM8 (alkaline gabbro) from Group 1 are characterised by ex-tremely enriched light rare earth elements (LREE) with (La/Sm)N=3.9 to 4.9 and (La/Yb)N=22 to 32 (Fig. 9). Group 1 displays high en-richment in large ion lithophile elements (LILE) and light rare earthelements (LREE) (Fig. 10). Group 2 exhibits low LILE and LREE exceptfor Th, with relatively flat primitive mantle normalised trace elementpatterns. The andesitic dykes mainly plot with the alkalic series(Group 1) with uniform REE patterns (Fig. 9) with (La/Sm)N=2.7to 3.0 and (La/Yb)N=11 to 14, and flat primitive mantle normalisedtrace element patterns (Fig. 10). The felsic samples (dacite to rhyolite)exhibit uniform trace element compositions with significant depletionof Eu (Fig. 9).
7.2. Interpretation
7.2.1. Effects of alteration on the geochemical systemsAll samples used in this study exhibit low LOI values (0–3.5 wt.%,
mostly b2.5 wt.%), suggesting that the effects of alteration on chemi-cal composition are insignificant. Zirconium, an immobile elementduring low-degree metamorphism and alteration, can be used as an
alteration-independent index of geochemical variations. Bivariateplots of Zr against selected trace elements can thus be used to evalu-ate the element mobilities during alteration (e.g., Polat and Hofmann,2003; Wang et al., 2008, 2010). The high field strength elements(HFSE, such as Nb, Ta, Ti, Zr, Hf), rare earth elements (REE), Y, andTh are correlated with Zr, indicating that these elements are essen-tially immobile during alteration. A weaker correlation betweenabundances of Na and K versus Zr (r=0.46 for K and 0.56 for Na),imply only a slight effect of deuteric or hydrothermal alteration onthese two elements (Appendix B). Rb, alkaline earth (such as Ca, Sr,and Ba), Pb and Mn elements are all scattered, implying varying de-grees of mobility.
7.2.2. Crystal fractionation and crustal contaminationThe low abundances of MgO, Cr and Ni in the mafic samples in this
study indicate significant prior olivine crystal fractionation. The de-crease of TiO2, CaO, FeOTotal, and MgO with increasing SiO2, and the in-crease of Al2O3 with increasing SiO2 suggest that mafic samplesunderwent variable crystal fractionation of olivine + clinopyroxene ±Ti-Fe oxides (Appendix A). The kink on trends of TiO2, Al2O3, CaO andFeOTotal versus SiO2 (SiO2=55–60 wt.%) reflects the appearance of pla-gioclase on the liquidus (Appendix A). This is confirmed by significantdepletion of Eu in felsic samples (Fig. 9). The diagrams of Na2O andK2O versus SiO2 (Fig. 8) indicate two distinctive parental magmas:one with high Na2O (about 8 wt.%) and K2O (about 3 wt.%) contentand another with low Na2O (about 3 wt.%) and K2O (b1 wt.%) content.This is consistent with the two distinctive types of trace elementcompositions.
The effect of crustal assimilation can be evaluated by comparingthe concentration of major elements SiO2 and MgO, with trace ele-ment ratios of Nb/La, Th/La and La/Yb. The lack of correlations be-tween SiO2 (MgO) and Nb/La, Th/La, and La/Yb (Fig. 11) implies thatcrustal contamination played an insignificant role in the generationof these dykes.
7.2.3. Magma source characteristics and petrogenesisThe two types of basaltic samples display distinctive trace element
and alkaline signatures, implying derivation from different sourceregions. Basaltic samples of Group 1 are not normal products of melt-ing of mantle peridotite as indicated by their extremely high traceelement concentrations. For instance, the typical Group 1 samplesMA4, MM4 and MM8 have about 10 times of an average of typical al-kaline OIB (Fig. 9). We interpret this distinct geochemical signature tosuggest that they derived from a hydrous mantle source, reflectingthe contribution of melt released from the subducted slab and/ormelts (Polat et al., 2011, in press).
Basalts of Group2 display a large range of trace element compositionswithout significant depletion of Nb, Zr, Hf and Ti, broadly similar to typ-ical alkaline OIB. Compared to Group 1 basalts, they are characterised byrelatively low SiO2 (50–44 wt.%) and high FeOTotal (14–12 wt.%) andTiO2 (1.6–3.6 wt.%) contents. These features suggest that these basalticsamples were likely directly derived from asthenospheric mantle.
Analysed andesitic dykes mainly belong to alkalic series with anOIB-like trace element pattern, similar to mafic samples of Group 2.

Table 3Major and trace elements (Acme Analytical Laboratories Ltd, Canada).
Sample Sample 1 Sample 2 Sample 3 Sample 4 Sample 5 Sample 6 Sample 7 Sample 8 Sample 9 Sample 10
Dyke # (palaeomagnetic) D1 D2 D3 D4 D5 D6 D7 D8 D9 D10
Group 1 2 1 1 2 1 1 2 2 1
Major elements (%)SiO2 49.20 48.40 53.00 46.20 75.00 64.40 44.20 49.40 52.70 58.80TiO2 2.72 2.18 2.06 2.96 0.25 0.79 3.83 1.38 1.49 1.05Al2O3 14.40 13.00 14.80 14.30 12.10 14.80 13.80 13.60 14.40 15.60Fe2O3 total 13.00 15.20 11.70 14.20 2.36 6.48 16.30 16.00 15.30 7.37MgO 2.92 6.26 2.14 5.50 0.80 1.50 4.51 5.20 2.61 3.72CaO 5.87 9.58 4.93 8.68 0.38 0.85 7.81 9.11 7.46 0.91Na2O 3.06 2.17 3.24 2.21 2.56 3.79 2.42 2.31 3.00 0.84K2O 4.19 0.86 4.74 2.19 4.60 4.73 2.77 0.62 0.61 8.19P2O5 1.23 0.26 0.95 0.93 0.03 0.23 1.34 0.17 0.29 0.32MnO 0.23 0.23 0.21 0.19 b0.01 0.09 0.22 0.21 0.19 0.06LOI 2.40 1.50 1.60 2.00 1.40 2.00 2.20 1.60 1.70 2.80Sum 99.30 99.60 99.40 99.40 99.60 99.70 99.40 99.70 99.80 99.70
Trace elements (ppm)Cr 13.7 130.0 13.7 88.9 13.7 13.7 13.7 75.3 20.5 13.7Be 1.00 b1 b1 b1 2.00 3.00 2.00 b1 b1 b1Sc 23.0 47.0 21.0 29.0 b1 7.0 26.0 39.0 28.0 19.0V 98 373 40 274 b8 20 242 361 161 b8Co 53 57 24 53 33 24 53 64 53 9Ni 7 30 4 38 3 6 15 24 11 2Cu 13.9 64.0 8.4 51.1 0.9 11.1 20.4 178.0 83.7 1.4Zn 94 72 83 65 44 118 96 48 77 65Ga 19.8 19.2 19.5 17.3 27.7 30.7 19.1 18.6 19.9 22.6As 0.90 0.90 b0.5 0.60 0.70 0.70 1.60 b0.5 b0.5 0.60Se b0.5 b0.5 b0.5 b0.5 1.00 b0.5 b0.5 b0.5 b0.5 b0.5Rb 71 36 84 96 154 167 71 26 20 213Sr 606 282 593 780 14 80 796 141 163 41Y 30.3 36.0 30.6 20.6 99.8 58.4 25.5 33.0 52.4 38.1Zr 206 150 247 116 823 565 177 108 220 307Nb 38.4 19.7 41.9 22.4 157.0 77.1 32.4 5.1 9.2 59.1Mo 1.00 0.70 1.10 0.50 0.80 2.40 0.80 0.50 0.60 1.70Ag b0.1 0.10 0.10 0.10 b0.1 0.20 0.10 b0.1 b0.1 b0.1Cd b0.1 b0.1 b0.1 b0.1 b0.1 0.10 b0.1 0.10 0.10 b0.1Sn 1.00 2.00 b1 b1 6.00 7.00 b1 1.00 2.00 2.00Sb b0.1 b0.1 b0.1 b0.1 b0.1 b0.1 b0.1 b0.1 b0.1 b0.1Cs 0.80 0.40 1.30 1.30 0.60 0.20 0.50 0.10 0.20 0.40Ba 3793 383 3583 2287 127 520 2314 199 293 1029La 55.3 18.9 59.0 32.2 254.0 151.0 44.8 8.9 17.0 88.7Ce 123.0 43.9 129.0 72.4 506.0 315.0 103.0 22.3 43.8 190.0Pr 14.20 5.34 15.00 8.38 50.30 30.90 11.80 2.83 5.39 19.80Nd 59.4 23.4 63.4 39.0 184.0 110.0 50.9 13.8 26.2 74.5Sm 10.60 5.36 10.40 6.63 28.40 16.50 9.28 3.92 6.35 11.70Eu 5.41 1.77 5.59 3.29 0.72 1.45 4.33 1.27 2.05 3.36Gd 8.97 6.21 8.69 5.55 22.30 11.70 7.89 4.81 7.98 8.62Tb 1.22 1.08 1.25 0.80 3.48 1.93 1.11 0.89 1.46 1.34Dy 6.23 6.53 6.05 4.11 18.70 9.84 5.43 5.29 8.67 7.07Ho 1.00 1.21 1.03 0.70 3.36 1.84 0.91 1.15 1.84 1.29Er 2.67 3.51 2.89 1.75 9.16 5.34 2.18 3.51 5.43 3.45Tm 0.39 0.57 0.43 0.29 1.44 0.91 0.37 0.54 0.89 0.58Yb 2.25 3.35 2.41 1.48 8.36 5.01 1.86 3.33 5.34 3.53Lu 0.35 0.55 0.39 0.23 1.26 0.78 0.31 0.54 0.83 0.56Hf 4.60 4.50 6.10 3.00 23.60 13.70 4.80 2.50 5.70 7.40Ta 2.40 1.20 2.50 1.30 9.10 4.70 2.40 0.40 0.80 3.60W 79.7 86.3 84.4 53.2 357.0 167.0 68.2 112.0 172.0 58.4Au 3.80 3.00 4.50 1.80 1.90 2.00 1.00 3.50 2.50 1.60Hg b0.01 b0.01 0.02 b0.01 b0.01 0.02 b0.01 0.02 0.02 b0.01Tl b0.1 b0.1 b0.1 0.20 0.20 0.20 b0.1 b0.1 b0.1 b0.1Pb 1.90 1.30 2.40 1.50 4.30 23.40 2.40 0.80 1.50 2.40Bi b0.1 b0.1 b0.1 b0.1 b0.1 b0.1 b0.1 b0.1 b0.1 b0.1Th 3.70 1.60 4.00 2.50 39.80 21.10 3.90 1.30 3.00 7.50U 0.70 0.50 0.70 0.50 5.50 3.30 0.70 0.40 0.80 1.80
133S.A. Pisarevsky et al. / Lithos 174 (2013) 125–143
Thus, the Group 2 basalts may be the parental magma of these andes-itic samples. The trachytic to rhyolitic samples exhibit relatively uni-form trace element patterns. These felsic dykes are characterised byenrichment of potassium and plot within the fields ranging fromhigh-K calc-alkaline to shoshonitic series. Shoshonitic series generallyhave restricted spatial and temporal distribution, and the ultimate
origin of the magmatism has commonly been related to thermalevents in the mantle, usually related to collision events, such as slabbreak-off (e.g., Aldanmaz et al., 2000; Kay and Mahlburg Kay, 1993;Morrison, 1980; Pe-Piper et al., 2009). The generation of shoshonitesis generally thought to be related to incorporation of subducted sedi-ments in the active continentalmargin, but also can be producedwithin
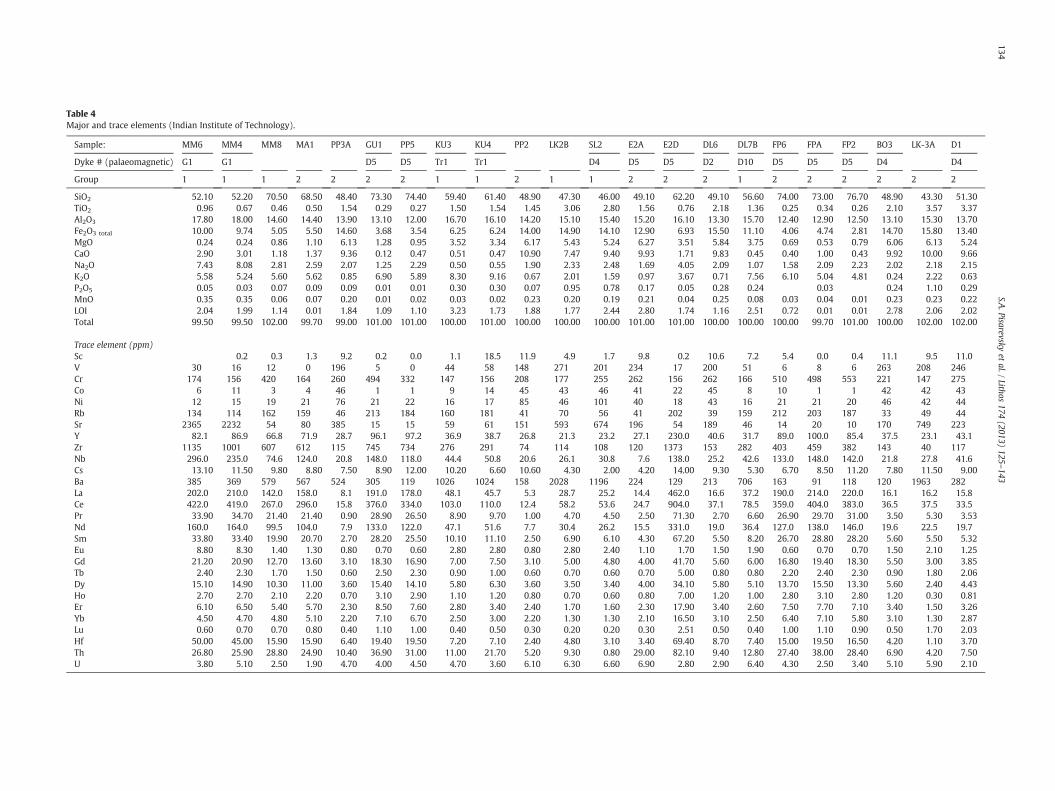
Table 4Major and trace elements (Indian Institute of Technology).
Sample: MM6 MM4 MM8 MA1 PP3A GU1 PP5 KU3 KU4 PP2 LK2B SL2 E2A E2D DL6 L7B FP6 FPA FP2 BO3 LK-3A D1
Dyke # (palaeomagnetic) G1 G1 D5 D5 Tr1 Tr1 D4 D5 D5 D2 10 D5 D5 D5 D4 D4
Group 1 1 1 2 2 2 2 1 1 2 1 1 2 2 2 2 2 2 2 2 2
SiO2 52.10 52.20 70.50 68.50 48.40 73.30 74.40 59.40 61.40 48.90 47.30 46.00 49.10 62.20 49.10 56.60 74.00 73.00 76.70 48.90 43.30 51.30TiO2 0.96 0.67 0.46 0.50 1.54 0.29 0.27 1.50 1.54 1.45 3.06 2.80 1.56 0.76 2.18 1.36 0.25 0.34 0.26 2.10 3.57 3.37Al2O3 17.80 18.00 14.60 14.40 13.90 13.10 12.00 16.70 16.10 14.20 15.10 15.40 15.20 16.10 13.30 15.70 12.40 12.90 12.50 13.10 15.30 13.70Fe2O3 total 10.00 9.74 5.05 5.50 14.60 3.68 3.54 6.25 6.24 14.00 14.90 14.10 12.90 6.93 15.50 11.10 4.06 4.74 2.81 14.70 15.80 13.40MgO 0.24 0.24 0.86 1.10 6.13 1.28 0.95 3.52 3.34 6.17 5.43 5.24 6.27 3.51 5.84 3.75 0.69 0.53 0.79 6.06 6.13 5.24CaO 2.90 3.01 1.18 1.37 9.36 0.12 0.47 0.51 0.47 10.90 7.47 9.40 9.93 1.71 9.83 0.45 0.40 1.00 0.43 9.92 10.00 9.66Na2O 7.43 8.08 2.81 2.59 2.07 1.25 2.29 0.50 0.55 1.90 2.33 2.48 1.69 4.05 2.09 1.07 1.58 2.09 2.23 2.02 2.18 2.15K2O 5.58 5.24 5.60 5.62 0.85 6.90 5.89 8.30 9.16 0.67 2.01 1.59 0.97 3.67 0.71 7.56 6.10 5.04 4.81 0.24 2.22 0.63P2O5 0.05 0.03 0.07 0.09 0.09 0.01 0.01 0.30 0.30 0.07 0.95 0.78 0.17 0.05 0.28 0.24 0.03 0.24 1.10 0.29MnO 0.35 0.35 0.06 0.07 0.20 0.01 0.02 0.03 0.02 0.23 0.20 0.19 0.21 0.04 0.25 0.08 0.03 0.04 0.01 0.23 0.23 0.22LOI 2.04 1.99 1.14 0.01 1.84 1.09 1.10 3.23 1.73 1.88 1.77 2.44 2.80 1.74 1.16 2.51 0.72 0.01 0.01 2.78 2.06 2.02Total 99.50 99.50 102.00 99.70 99.00 101.00 101.00 100.00 101.00 100.00 100.00 100.00 101.00 101.00 100.00 00.00 100.00 99.70 101.00 100.00 102.00 102.00
Trace element (ppm)Sc 0.2 0.3 1.3 9.2 0.2 0.0 1.1 18.5 11.9 4.9 1.7 9.8 0.2 10.6 7.2 5.4 0.0 0.4 11.1 9.5 11.0V 30 16 12 0 196 5 0 44 58 148 271 201 234 17 200 51 6 8 6 263 208 246Cr 174 156 420 164 260 494 332 147 156 208 177 255 262 156 262 66 510 498 553 221 147 275Co 6 11 3 4 46 1 1 9 14 45 43 46 41 22 45 8 10 1 1 42 42 43Ni 12 15 19 21 76 21 22 16 17 85 46 101 40 18 43 16 21 21 20 46 42 44Rb 134 114 162 159 46 213 184 160 181 41 70 56 41 202 39 59 212 203 187 33 49 44Sr 2365 2232 54 80 385 15 15 59 61 151 593 674 196 54 189 46 14 20 10 170 749 223Y 82.1 86.9 66.8 71.9 28.7 96.1 97.2 36.9 38.7 26.8 21.3 23.2 27.1 230.0 40.6 31.7 89.0 100.0 85.4 37.5 23.1 43.1Zr 1135 1001 607 612 115 745 734 276 291 74 114 108 120 1373 153 82 403 459 382 143 40 117Nb 296.0 235.0 74.6 124.0 20.8 148.0 118.0 44.4 50.8 20.6 26.1 30.8 7.6 138.0 25.2 42.6 133.0 148.0 142.0 21.8 27.8 41.6Cs 13.10 11.50 9.80 8.80 7.50 8.90 12.00 10.20 6.60 10.60 4.30 2.00 4.20 14.00 9.30 5.30 6.70 8.50 11.20 7.80 11.50 9.00Ba 385 369 579 567 524 305 119 1026 1024 158 2028 1196 224 129 213 06 163 91 118 120 1963 282La 202.0 210.0 142.0 158.0 8.1 191.0 178.0 48.1 45.7 5.3 28.7 25.2 14.4 462.0 16.6 37.2 190.0 214.0 220.0 16.1 16.2 15.8Ce 422.0 419.0 267.0 296.0 15.8 376.0 334.0 103.0 110.0 12.4 58.2 53.6 24.7 904.0 37.1 78.5 359.0 404.0 383.0 36.5 37.5 33.5Pr 33.90 34.70 21.40 21.40 0.90 28.90 26.50 8.90 9.70 1.00 4.70 4.50 2.50 71.30 2.70 6.60 26.90 29.70 31.00 3.50 5.30 3.53Nd 160.0 164.0 99.5 104.0 7.9 133.0 122.0 47.1 51.6 7.7 30.4 26.2 15.5 331.0 19.0 36.4 127.0 138.0 146.0 19.6 22.5 19.7Sm 33.80 33.40 19.90 20.70 2.70 28.20 25.50 10.10 11.10 2.50 6.90 6.10 4.30 67.20 5.50 8.20 26.70 28.80 28.20 5.60 5.50 5.32Eu 8.80 8.30 1.40 1.30 0.80 0.70 0.60 2.80 2.80 0.80 2.80 2.40 1.10 1.70 1.50 1.90 0.60 0.70 0.70 1.50 2.10 1.25Gd 21.20 20.90 12.70 13.60 3.10 18.30 16.90 7.00 7.50 3.10 5.00 4.80 4.00 41.70 5.60 6.00 16.80 19.40 18.30 5.50 3.00 3.85Tb 2.40 2.30 1.70 1.50 0.60 2.50 2.30 0.90 1.00 0.60 0.70 0.60 0.70 5.00 0.80 0.80 2.20 2.40 2.30 0.90 1.80 2.06Dy 15.10 14.90 10.30 11.00 3.60 15.40 14.10 5.80 6.30 3.60 3.50 3.40 4.00 34.10 5.80 5.10 13.70 15.50 13.30 5.60 2.40 4.43Ho 2.70 2.70 2.10 2.20 0.70 3.10 2.90 1.10 1.20 0.80 0.70 0.60 0.80 7.00 1.20 1.00 2.80 3.10 2.80 1.20 0.30 0.81Er 6.10 6.50 5.40 5.70 2.30 8.50 7.60 2.80 3.40 2.40 1.70 1.60 2.30 17.90 3.40 2.60 7.50 7.70 7.10 3.40 1.50 3.26Yb 4.50 4.70 4.80 5.10 2.20 7.10 6.70 2.50 3.00 2.20 1.30 1.30 2.10 16.50 3.10 2.50 6.40 7.10 5.80 3.10 1.30 2.87Lu 0.60 0.70 0.70 0.80 0.40 1.10 1.00 0.40 0.50 0.30 0.20 0.20 0.30 2.51 0.50 0.40 1.00 1.10 0.90 0.50 1.70 2.03Hf 50.00 45.00 15.90 15.90 6.40 19.40 19.50 7.20 7.10 2.40 4.80 3.10 3.40 69.40 8.70 7.40 15.00 19.50 16.50 4.20 1.10 3.70Th 26.80 25.90 28.80 24.90 10.40 36.90 31.00 11.00 21.70 5.20 9.30 0.80 29.00 82.10 9.40 12.80 27.40 38.00 28.40 6.90 4.20 7.50U 3.80 5.10 2.50 1.90 4.70 4.00 4.50 4.70 3.60 6.10 6.30 6.60 6.90 2.80 2.90 6.40 4.30 2.50 3.40 5.10 5.90 2.10
134S.A
.Pisarevskyet
al./Lithos
174(2013)
125–143
D
D
1
1
1
1
2
7
(a)
(b)
Fig. 8. (a) Total alkalis vs. SiO2 diagram for the classification of the Lakhna dykes (LeBas et al., 1986); (b) the shoshonite diagram of Peccerillo and Taylor (1976). Filledand open circles represent the alkalic series (Group 1 in Tables 3,4) and thesub-alkalic series (Group 2 in Tables 3,4) respectively. Grey symbols denote samplesanalysed by ICP-MS at ACME Labs in Canada, black symbols were analysed byICP-AES at the Indian Institute of Technology, Bombay.
(a) Lakhna mafic dykes
(b) Lakhna mafic dykes
(c) Lakhna and destitic dykes
(d) Lakhna and destitic dykes
135S.A. Pisarevsky et al. / Lithos 174 (2013) 125–143
an intraplate tectonic setting by partial melting of sub-continental lith-ospheric mantle (SCLM) which has been metasomatically enriched inan earlier subduction event (Scarrow et al., 2008).
Fig. 9. REE-chondrite normalised patterns for (1)mafic dykes of Group 1; (2)mafic dykes ofGroup 2; (3) andesitic dykes; (4) dacite to rhyolite dykes. Normalisation values are fromSun and McDonough (1989). The solid and dashed lines indicate Group 1 and Group 2,respectively.
8. Discussion
8.1. Tectonic setting of the Lakhna Dyke Swarm
Based on major element geochemistry only, Ratre et al. (2010) pro-posed that the Lakhna dyke swarmmay have been generated within anextensional tectonic setting, as earlier suggested by Nanda et al. (1998).However, as shown in Fig. 1b, the dyke swarm can be divided intosub-groups according to their orientation. The two sub-groups are near-ly perpendicular, but have the same ages, which seems inconsistentwith a typical rift setting.
The new geochemical data (major and trace element) clearly in-dicate shoshonitic and high-K calc-alkaline affinities, consistentwith a subduction related setting, with the former representinglate stage arc-magma (Scarrow et al., 2008). The coexistence ofhigh-K calc-alkaline with shoshonitic series is favoured here to re-flect an active continental margin setting in accord with other stud-ies (e.g., Dharma Rao et al., 2011, 2012; Santosh, 2012).
8.2. Palaeomagneticaly permissive positions of India in Columbia
The available palaeomagnetic data permit a fixed configuration be-tween Laurentia, Baltica and Siberia from ~1500 Ma to ~1270 Ma(Pisarevsky and Bylund, 2010; Salminen and Pesonen, 2007; Wingateet al., 2009) suggesting that they formed a part of Columbia. Our new1465±3 Ma Indian palaeopole is coeval to the highly reliable polesfrom these continents (Table 5; Fig. 12), providing an opportunityto test possible positions of India in Columbia. Of course, it must beborne in mind that: (i) India could be unconnected to Columbia;(ii) India could be juxtaposed not to Laurentia, Baltica or Siberia,
(a) Lakhna mafic dykes
(b) Lakhna mafic dykes
(c) Lakhna andestitic dykes
(d) Lakhna dacitic to rhyolitic dykes
Fig. 10. Primitive mantle-normalised incompatible trace element spidergrams for the(1) mafic dykes of Group1; (2) mafic dykes of Group 2; (3) andesitic dykes; (4) daciteto rhyolite dykes. Normalisation values are from Sun and McDonough (1989). The solidand dashed lines indicate Group-1 and Group-2, respectively.
136 S.A. Pisarevsky et al. / Lithos 174 (2013) 125–143
but to some other part of Columbia, whose position is not yetconstrained. With these limitations our new palaeopole allows fourreconstructions with India juxtaposed against Laurentia, Baltica, orSiberia (Fig. 12a–d) at 1460 Ma.
Using other precisely dated Mesoproterozoic Indian palaeopoles(Table 5, entries 29–32) and coeval poles from Laurentia, Baltica andSiberia, we shall test the viability of these reconstructions at ca. 1190,
1120 and 1080 Ma. Euler rotation parameters for Laurentia, Balticaand Siberia are listed in Table 6 and the rotation parameters for Indiaare given in figure captions.
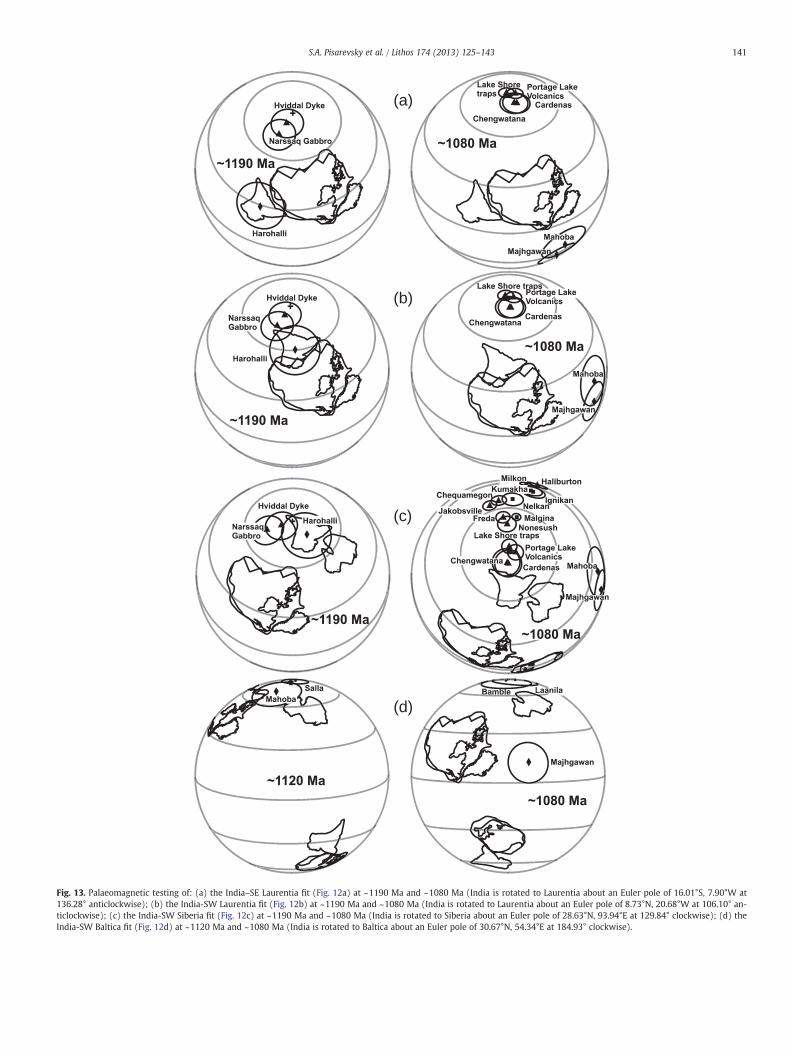
The 1192±10 Ma Harohalli pole (Table 5, entry 29) is coeval to twoLaurentian poles from the 1184±5 Ma intrusions in Greenland(Table 5, entries 8 and 9). Fig. 13a demonstrates that the 1460 Ma re-construction of India juxtaposed to SE Laurentia (Fig. 12a) could nothave persisted until 1190 Ma. The corresponding Euler rotation param-eters applied to the Indian polemove it to low latitudes ~60° away fromthe geographic pole approximated by Laurentian palaeopoles, implyingIndia–Laurentia separation before ca. 1190 Ma. The ca. 1080 Ma Indianpalaeopoles are also discordantwith coeval Laurentian poles in the test-ed reconstruction (Table 5, Fig. 13a).
Geological data are also not supportive to the India–SE Laurentiafit. The SE edge of Laurentia has been a long-lived 1.8–1.0 Ga conver-gent orogen (e.g., Karlstrom et al., 2001). The eastern edge of Indiashould also be considered as long-lived active margin during roughlythe same time interval (see Section 8.1). Fig. 12a shows that theIndia–SE Laurentia reconstruction requires juxtaposition of two ac-tive continental margins with opposite directions of tectonic trans-port thus discounting this reconstruction as a viable option.
As shown in Figs. 12b and 13b, palaeomagnetic data permit posi-tioning of India against the western margin of Laurentia (present-dayco-ordinates) from 1460 Ma until 1190 Ma, given that the circles of95% confidence for the Laurentian and Indian poles overlap. However,if such a connection existed, palaeomagnetic data dictate that it musthave been broken before 1080 Ma (Fig. 13b).
The western margin of Laurentia contains a rift – passive marginsuccession initiated at c. 750 Ma (e.g., Dehler et al., 2010; Moores,1991; Ross et al., 1995). It remains a matter of debate as to which con-tinent separated from this Laurentian margin, possible candidates in-cluding: Australia (e.g., Brookfield, 1993; Burrett and Berry, 2000;Dalziel, 1991; Hoffman, 1991; Karlstrom et al., 1999; Moores, 1991;Wingate et al., 2002), South China (Li et al., 1995), Siberia (Sears andPrice, 2000), West Africa, or Rio de La Plata (Evans, 2009). LateMesoproterozoic palaeomagnetic data rule out an Australia-Laurentiaconnection at ~1.2 Ga (Pisarevsky et al., 2003). A Siberia-W. Laurentiafit also failed palaeomagnetic tests and has problems with geologicalmismatches (Pisarevsky and Natapov, 2003; Pisarevsky et al., 2008). Alack of reliable Mesoproterozoic palaeomagnetic data prevents similartests for South China, West Africa and Rio de La Plata.
Major geological features (Fig. 12b) permit connections between theArchaean Dharwar Craton and the displaced fragment of the Slave Cra-ton, and also between Indian Aravalli and Bundelkhand cratons, andHearne, Wyoming and Medicine Hat blocks of Laurentia. The earliestdeformations in CITZ (2100–1900 Ma; Mohanty, 2010) are similar inage to those in the Taltson Belt of Laurentia (Hoffman, 1989). Bothorogens have the same trend in this reconstruction. This reconstructionalso juxtaposes the Lakhna magmatism with the widespread coevalmagmatism in adjacent western Laurentia (e.g., Anderson and Davis,1995; Ernst and Buchan, 2001; Ernst et al., 2008; Harlan et al., 2008).However, in our preferred interpretation of the geochemistry theLakhna Dykes are associated with subduction processes, which wouldcontradict this comparison. The timing of sedimentation in theMesoproterozoic Belt Basin (Fig. 12b) in Laurentia (e.g., Luepke andLyons, 2001) is overlapping with that in Vindhyan basins of India(Malone et al., 2008; Meert et al., 2010). According to palaeomagneticdata (Figs. 12b, 13b) the separation of India from Laurentia shouldoccur between 1190 and 1080 Ma. However, there is strong evidencethat continental breakup along thewestern Laurentianmargin occurrednot earlier than ca. 750 Ma (e.g., Dehler et al., 2010; Moores, 1991; Rosset al., 1995).
There are no reliable Siberian palaeopoles between ca. 1460–1050 Ma(Table 5). However, there is good evidence that Laurentia and Siberiawere in a fixed position with respect to each other between ca. 1470–1000 Ma (Wingate et al., 2009). Consequently the 1460–1050 Ma
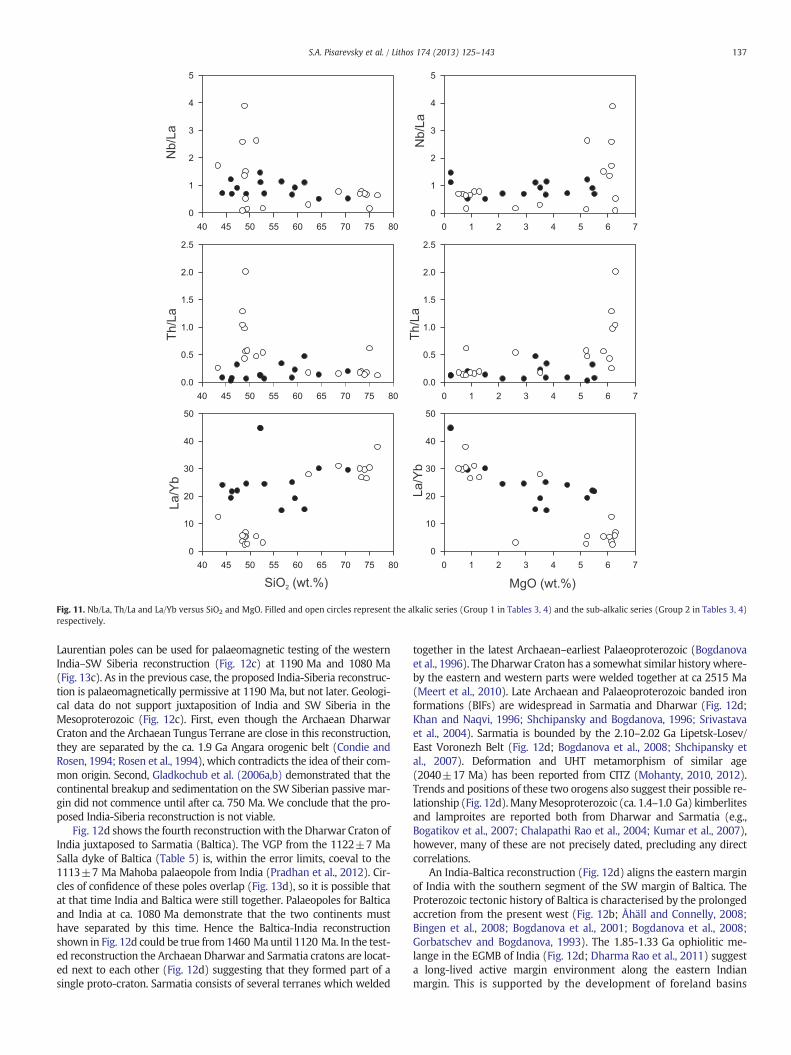
Fig. 11. Nb/La, Th/La and La/Yb versus SiO2 and MgO. Filled and open circles represent the alkalic series (Group 1 in Tables 3, 4) and the sub-alkalic series (Group 2 in Tables 3, 4)respectively.
137S.A. Pisarevsky et al. / Lithos 174 (2013) 125–143
Laurentian poles can be used for palaeomagnetic testing of the westernIndia–SW Siberia reconstruction (Fig. 12c) at 1190 Ma and 1080 Ma(Fig. 13c). As in the previous case, the proposed India-Siberia reconstruc-tion is palaeomagnetically permissive at 1190 Ma, but not later. Geologi-cal data do not support juxtaposition of India and SW Siberia in theMesoproterozoic (Fig. 12c). First, even though the Archaean DharwarCraton and the Archaean Tungus Terrane are close in this reconstruction,they are separated by the ca. 1.9 Ga Angara orogenic belt (Condie andRosen, 1994; Rosen et al., 1994), which contradicts the idea of their com-mon origin. Second, Gladkochub et al. (2006a,b) demonstrated that thecontinental breakup and sedimentation on the SW Siberian passive mar-gin did not commence until after ca. 750 Ma. We conclude that the pro-posed India-Siberia reconstruction is not viable.
Fig. 12d shows the fourth reconstructionwith the Dharwar Craton ofIndia juxtaposed to Sarmatia (Baltica). The VGP from the 1122±7 MaSalla dyke of Baltica (Table 5) is, within the error limits, coeval to the1113±7 Ma Mahoba palaeopole from India (Pradhan et al., 2012). Cir-cles of confidence of these poles overlap (Fig. 13d), so it is possible thatat that time India and Baltica were still together. Palaeopoles for Balticaand India at ca. 1080 Ma demonstrate that the two continents musthave separated by this time. Hence the Baltica-India reconstructionshown in Fig. 12d could be true from1460 Ma until 1120 Ma. In the test-ed reconstruction the Archaean Dharwar and Sarmatia cratons are locat-ed next to each other (Fig. 12d) suggesting that they formed part of asingle proto-craton. Sarmatia consists of several terranes which welded
together in the latest Archaean–earliest Palaeoproterozoic (Bogdanovaet al., 1996). The Dharwar Craton has a somewhat similar historywhere-by the eastern and western parts were welded together at ca 2515 Ma(Meert et al., 2010). Late Archaean and Palaeoproterozoic banded ironformations (BIFs) are widespread in Sarmatia and Dharwar (Fig. 12d;Khan and Naqvi, 1996; Shchipansky and Bogdanova, 1996; Srivastavaet al., 2004). Sarmatia is bounded by the 2.10–2.02 Ga Lipetsk-Losev/East Voronezh Belt (Fig. 12d; Bogdanova et al., 2008; Shchipansky etal., 2007). Deformation and UHT metamorphism of similar age(2040±17 Ma) has been reported from CITZ (Mohanty, 2010, 2012).Trends and positions of these two orogens also suggest their possible re-lationship (Fig. 12d).ManyMesoproterozoic (ca. 1.4–1.0 Ga) kimberlitesand lamproites are reported both from Dharwar and Sarmatia (e.g.,Bogatikov et al., 2007; Chalapathi Rao et al., 2004; Kumar et al., 2007),however, many of these are not precisely dated, precluding any directcorrelations.
An India-Baltica reconstruction (Fig. 12d) aligns the eastern marginof India with the southern segment of the SW margin of Baltica. TheProterozoic tectonic history of Baltica is characterised by the prolongedaccretion from the present west (Fig. 12b; Åhäll and Connelly, 2008;Bingen et al., 2008; Bogdanova et al., 2001; Bogdanova et al., 2008;Gorbatschev and Bogdanova, 1993). The 1.85-1.33 Ga ophiolitic me-lange in the EGMB of India (Fig. 12d; Dharma Rao et al., 2011) suggesta long-lived active margin environment along the eastern Indianmargin. This is supported by the development of foreland basins
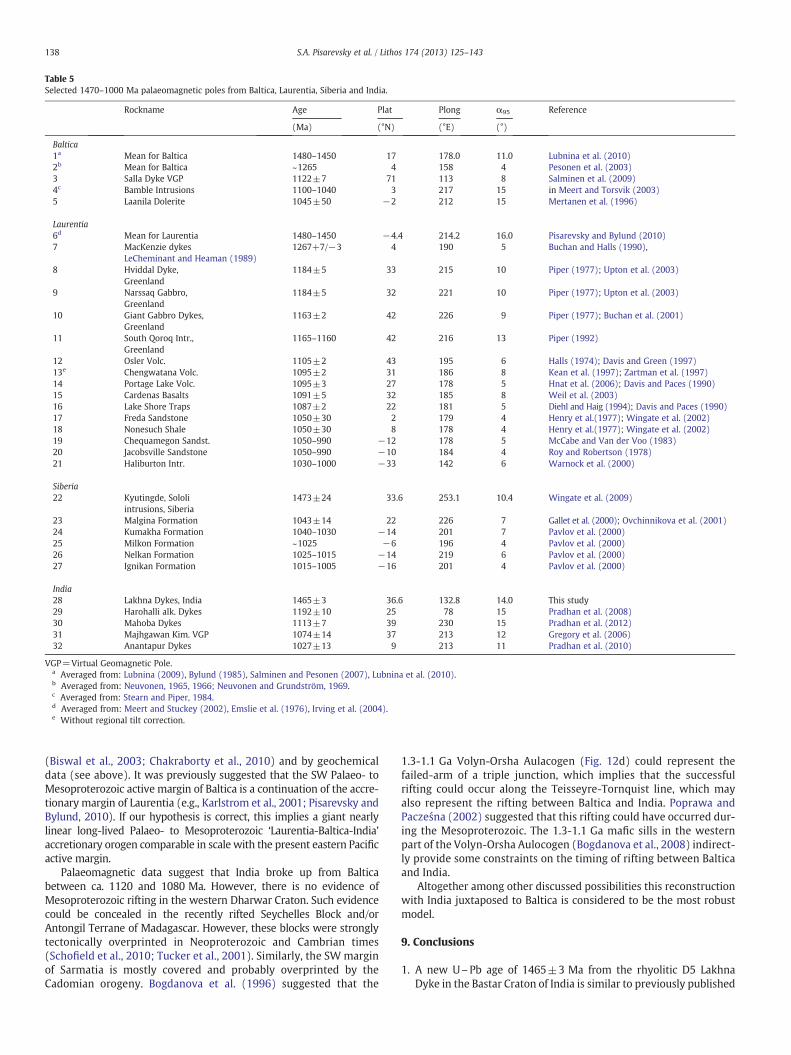
Table 5Selected 1470–1000 Ma palaeomagnetic poles from Baltica, Laurentia, Siberia and India.
Rockname Age Plat Plong α95 Reference
(Ma) (°N) (°E) (°)
Baltica1a Mean for Baltica 1480–1450 17 178.0 11.0 Lubnina et al. (2010)2b Mean for Baltica ~1265 4 158 4 Pesonen et al. (2003)3 Salla Dyke VGP 1122±7 71 113 8 Salminen et al. (2009)4c Bamble Intrusions 1100–1040 3 217 15 in Meert and Torsvik (2003)5 Laanila Dolerite 1045±50 −2 212 15 Mertanen et al. (1996)
Laurentia6d Mean for Laurentia 1480–1450 −4.4 214.2 16.0 Pisarevsky and Bylund (2010)7 MacKenzie dykes 1267+7/−3 4 190 5 Buchan and Halls (1990),
LeCheminant and Heaman (1989)8 Hviddal Dyke, 1184±5 33 215 10 Piper (1977); Upton et al. (2003)
Greenland9 Narssaq Gabbro, 1184±5 32 221 10 Piper (1977); Upton et al. (2003)
Greenland10 Giant Gabbro Dykes, 1163±2 42 226 9 Piper (1977); Buchan et al. (2001)
Greenland11 South Qoroq Intr., 1165–1160 42 216 13 Piper (1992)
Greenland12 Osler Volc. 1105±2 43 195 6 Halls (1974); Davis and Green (1997)13e Chengwatana Volc. 1095±2 31 186 8 Kean et al. (1997); Zartman et al. (1997)14 Portage Lake Volc. 1095±3 27 178 5 Hnat et al. (2006); Davis and Paces (1990)15 Cardenas Basalts 1091±5 32 185 8 Weil et al. (2003)16 Lake Shore Traps 1087±2 22 181 5 Diehl and Haig (1994); Davis and Paces (1990)17 Freda Sandstone 1050±30 2 179 4 Henry et al.(1977); Wingate et al. (2002)18 Nonesuch Shale 1050±30 8 178 4 Henry et al.(1977); Wingate et al. (2002)19 Chequamegon Sandst. 1050–990 −12 178 5 McCabe and Van der Voo (1983)20 Jacobsville Sandstone 1050–990 −10 184 4 Roy and Robertson (1978)21 Haliburton Intr. 1030–1000 −33 142 6 Warnock et al. (2000)
Siberia22 Kyutingde, Sololi 1473±24 33.6 253.1 10.4 Wingate et al. (2009)
intrusions, Siberia23 Malgina Formation 1043±14 22 226 7 Gallet et al. (2000); Ovchinnikova et al. (2001)24 Kumakha Formation 1040–1030 −14 201 7 Pavlov et al. (2000)25 Milkon Formation ~1025 −6 196 4 Pavlov et al. (2000)26 Nelkan Formation 1025–1015 −14 219 6 Pavlov et al. (2000)27 Ignikan Formation 1015–1005 −16 201 4 Pavlov et al. (2000)
India28 Lakhna Dykes, India 1465±3 36.6 132.8 14.0 This study29 Harohalli alk. Dykes 1192±10 25 78 15 Pradhan et al. (2008)30 Mahoba Dykes 1113±7 39 230 15 Pradhan et al. (2012)31 Majhgawan Kim. VGP 1074±14 37 213 12 Gregory et al. (2006)32 Anantapur Dykes 1027±13 9 213 11 Pradhan et al. (2010)
VGP=Virtual Geomagnetic Pole.a Averaged from: Lubnina (2009), Bylund (1985), Salminen and Pesonen (2007), Lubnina et al. (2010).b Averaged from: Neuvonen, 1965, 1966; Neuvonen and Grundström, 1969.c Averaged from: Stearn and Piper, 1984.d Averaged from: Meert and Stuckey (2002), Emslie et al. (1976), Irving et al. (2004).e Without regional tilt correction.
138 S.A. Pisarevsky et al. / Lithos 174 (2013) 125–143
(Biswal et al., 2003; Chakraborty et al., 2010) and by geochemicaldata (see above). It was previously suggested that the SW Palaeo- toMesoproterozoic active margin of Baltica is a continuation of the accre-tionary margin of Laurentia (e.g., Karlstrom et al., 2001; Pisarevsky andBylund, 2010). If our hypothesis is correct, this implies a giant nearlylinear long-lived Palaeo- to Mesoproterozoic ‘Laurentia-Baltica-India’accretionary orogen comparable in scale with the present eastern Pacificactive margin.
Palaeomagnetic data suggest that India broke up from Balticabetween ca. 1120 and 1080 Ma. However, there is no evidence ofMesoproterozoic rifting in the western Dharwar Craton. Such evidencecould be concealed in the recently rifted Seychelles Block and/orAntongil Terrane of Madagascar. However, these blocks were stronglytectonically overprinted in Neoproterozoic and Cambrian times(Schofield et al., 2010; Tucker et al., 2001). Similarly, the SW marginof Sarmatia is mostly covered and probably overprinted by theCadomian orogeny. Bogdanova et al. (1996) suggested that the
1.3-1.1 Ga Volyn-Orsha Aulacogen (Fig. 12d) could represent thefailed-arm of a triple junction, which implies that the successfulrifting could occur along the Teisseyre-Tornquist line, which mayalso represent the rifting between Baltica and India. Poprawa andPacześna (2002) suggested that this rifting could have occurred dur-ing the Mesoproterozoic. The 1.3-1.1 Ga mafic sills in the westernpart of the Volyn-Orsha Aulocogen (Bogdanova et al., 2008) indirect-ly provide some constraints on the timing of rifting between Balticaand India.
Altogether among other discussed possibilities this reconstructionwith India juxtaposed to Baltica is considered to be the most robustmodel.
9. Conclusions
1. A new U\Pb age of 1465±3 Ma from the rhyolitic D5 LakhnaDyke in the Bastar Craton of India is similar to previously published
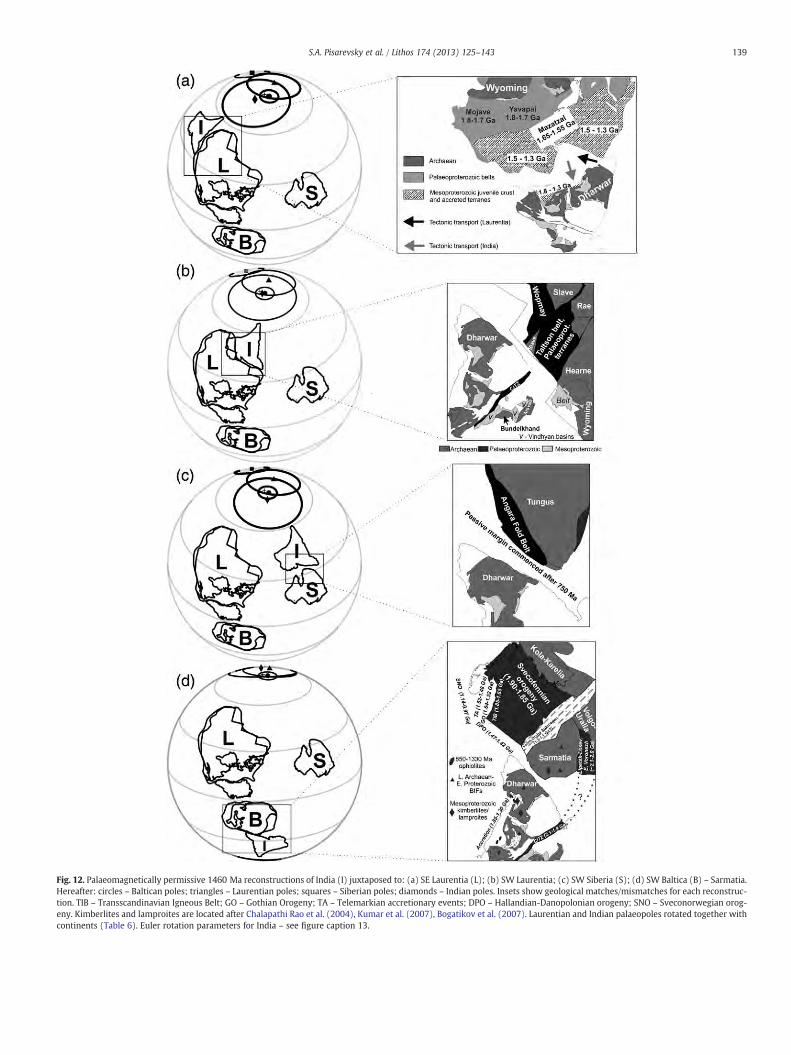
Fig. 12. Palaeomagnetically permissive 1460 Ma reconstructions of India (I) juxtaposed to: (a) SE Laurentia (L); (b) SW Laurentia; (c) SW Siberia (S); (d) SW Baltica (B) – Sarmatia.Hereafter: circles – Baltican poles; triangles – Laurentian poles; squares – Siberian poles; diamonds – Indian poles. Insets show geological matches/mismatches for each reconstruc-tion. TIB – Transscandinavian Igneous Belt; GO – Gothian Orogeny; TA – Telemarkian accretionary events; DPO – Hallandian-Danopolonian orogeny; SNO – Sveconorwegian orog-eny. Kimberlites and lamproites are located after Chalapathi Rao et al. (2004), Kumar et al. (2007), Bogatikov et al. (2007). Laurentian and Indian palaeopoles rotated together withcontinents (Table 6). Euler rotation parameters for India – see figure caption 13.
139S.A. Pisarevsky et al. / Lithos 174 (2013) 125–143
Table 6Euler rotation parameters for Laurentia, Baltica and Siberia at 1460–1080 Ma (recon-structions in Figs. 11–15).
Craton Age Pole Angle
(Ma) Lat(°) Lon(°) (°)
Laurentia to absolute framework 1460 −48.68 48.60 166.261770 10.77 −17.29 −76.771750 14.27 −14.48 −71.781460 8.65 136.16 88.081265 21.42 122.39 89.97
Baltica to Laurentia 1460–1270 44.99 7.45 44.931120 −18.06 −126.33 −176.751080 50.07 −83.97 −45.93
Greenland to Laurentia 1460–1080 67.50 241.52 −14.00Siberia to Laurentia 1460–1080 66.60 139.30 134.80
140 S.A. Pisarevsky et al. / Lithos 174 (2013) 125–143
U\Pb zircon dates of this and two other dykes of the Lakhna DykeSwarm.
2. Geochemical data from the Lakhna Dykes indicate shoshonitic andhigh-K calc-alkaline affinities suggesting that they are related tosubduction in an active continental margin setting.
3. A palaeomagnetic study of the Lakhna dykes has provided a newrobust 1460 Ma palaeopole for India, which is coeval to reliablepalaeopoles from Laurentia, Baltica and Siberia.
4. Indian geology andPrecambrian geological data fromLaurentia, Balticaand Siberia suggest that, among four palaeomagnetically permissivepositions of India, the reconstruction of western India attached tosouth-west Baltica (Sarmatia) is geologically and palaeomagneticallythe most permissible model. The reconstruction implies a long-livednearly linear Palaeo- to Mesoproterozoic mega-accretionary orogenalong south-eastern Laurentia, south-western Baltica and easternIndia. This orogen was comparable in terms of scale with the presentCordillieran-Andean orogen in America.
Supplementary data to this article can be found online at http://dx.doi.org/10.1016/j.lithos.2012.07.015.
Acknowledgements
We are grateful to Andrew Kerr and two anonymous reviewers fortheir valuable comments that helped to improve the first version ofour manuscript. Palaeogeographic reconstructions are made with freeGPLATES software (http://www.gplates.org/). This is contribution 195from the ARC Centre of Excellence for Core to Crust Fluid Systems(http://www.ccfs.mq.edu.au), and TIGeR publication #425 and alsopublication #19 of the LIPs-Supercontinent Reconstruction Project(http://www.supercontinent.org). SP and JT gratefully acknowledgefunding from the Marie Curie FP6 Excellence Grant scheme.
References
Åhäll, K.-I., Connelly, J.N., 2008. Long-term convergence along SW Fennoscandia: 330m.y. of Proterozoic crustal growth. Precambrian Research 163, 402–421.
Aldanmaz, E., Pearce, J.A., Thirlwall, M.F., Mitchell, J.G., 2000. Petrogenetic evolution oflate Cenozoic, post-collision volcanism in western Anatolia, Turkey. Journal of Vol-canology and Geothermal Research 102 (1–2), 67–95.
Anderson, H.E., Davis, D.W., 1995. U\Pb geochronology of the Moyie sills, Purcell Super-group, southeastern British Columbia: Implications for the Mesoproterozoic geologicalhistory of the Purcell (Belt) basin. Canadian Journal of Earth Sciences 32, 1180–1193.
Bingen, B., Andersson, J., Söderlund, U., Möller, C., 2008. The Mesoproterozoic in theNordic countries. Episodes 31 (1), 29–34.
Bispo-Santos, F., D'Agrella-Filho, M.S., Pacca, I.I.G., Janikian, L., Trindade, R.I.F., Elming, S.-Å.,Silva, J.A., Barros, M.A.S., Pinho, F.E.C., 2008. Columbia revisited: Paleomagnetic resultsfrom the 1790 Ma colider volcanics (SW Amazonian Craton, Brazil). Precambrian Re-search 164, 40–49.
Bispo-Santos, F., D'Agrella-Filho, M.S., Trindade, R.I.F., Elming, S.-Å., Joinikian, L.,Vasconcelos, P.M., Perillo, B.M., Pacca, I.I.G., da Silva, J.A., Barros, M.A.S., 2012. Tec-tonic implications of the 1419 Ma Nova Guarita mafic intrusive paleomagnetic pole(Amazon Craton) on the longevity of Nuna. Precambrian Research 196–197, 1–22.
Biswal, T.K., Sinha, S., Mandal, A., Ahuja, H., Das, M.K., 2003. Deformation pattern ofBastar craton adjoining Eastern Ghat mobile belt, NW Orissa. Gondwana GeologicalMagazine, Special Publication 7, 101–108.
Bogatikov, O.A., Kononova, V.A., Nosova, A.A., Kondrashov, I.A., 2007. Kimberlites andlamproites of the east European Platform: petrology and geochemistry. Petrology15 (4), 315–334.
Bogdanova, S.V., Pashkevich, I.K., Gorbatschev, R., Orlyuk, M., 1996. Riphean rifting andmajor Paleoproterozoic boundaries in the East European Craton: geology and geo-physics. Tectonophysics 268, 1–22.
Bogdanova, S.V., Page, L.M., Skridlaite, G., Taran, L.N., 2001. Proterozoic tectonothermalhistory in the western part of the East European Craton: 40Ar/39Ar geochronolog-ical constraints. Tectonophysics 339, 39–66. http://dx.doi.org/10.1016/S0040-1951(01)00033-6.
Bogdanova, S.V., Bingen, B., Gorbatschev, R., Kheraskova, T.N., Kozlov, V.I., Puchkov,V.N., Volozh, Yu.A., 2008. The Eastern European Craton (Baltica) before and duringthe assembly of Rodinia. Precambrian Research 160, 23–45.
Brookfield, M.E., 1993. Neoproterozoic Laurentia-Australia fit. Geology 21, 683–686.Buchan, K.L., 2007. Pole, key paleomagmetic. In: Gibbins, D., Herrero-Bervera, E. (Eds.),
Encyclopedia of Geomagnetism and Paleomagnetism. Springer, Dordrecht, Nether-lands, pp. 839–840.
Buchan, K.L., Halls, H.C., 1990. Paleomagnetism of Proterozoic mafic dyke swarms ofthe Canadian Shield. In: Parker, A.J., Rickwood, P.C., Tucker, D.H. (Eds.), MaficDykes and Emplacement Mechanism. A. A. Balkema, Rotterdam, pp. 209–230.
Buchan, K., Ernst, R., Hamilton, M., Mertanen, S., Pesonen, L.J., Elming, S.-Å., 2001.Rodinia: the evidence from integrated paleomagnetism and U–Pb geochronology.Precambrian Research 110, 9–32.
Burrett, C., Berry, R., 2000. Proterozoic Australia-Western United States (AUSWUS) fitbetween Laurentia and Australia. Geology 28, 103–106.
Bylund, G., 1985. Palaeomagnetism of middle Proterozoic basic intrusives in centralSweden and the Fennoscandian apparent polar wander path. Precambrian Re-search 28, 283–310. http://dx.doi.org/10.1016/0301-9268(85)90035-X.
Chakraborty, P.P., Dey, S., Mohanty, S.P., 2010. Proterozoic platform sequences in Pen-insular India: Implications towards basin evolution and supercontinent assembly.Journal of Asian Earth Sci ences 39, 589–607.
Chalapathi Rao, N.V., Gibson, S.A., Pyle, D.M., Dickin, A.P., 2004. Petrogenesis of Prote-rozoic Lamproites and Kimberlites from the Cuddapah Basin and Dharwar Craton,Southern India. Journal of Petrology 54, 907–948.
Chalapathi Rao, N.V., Burgess, R., Lehmann, B., Mainkar, D., Pande, S.K., Hari, K.R.,Bodhankar, N., 2011. 40Ar/39Ar ages of mafic dykes from the MesoproterozoicChhattisgarh basin, Bastar craton, Central India: Implication for the origin and spa-tial extent of the Deccan Large Igneous Province. Lithos 125, 994–1005.
Collins, A.S., Pisarevsky, S.A., 2005. Amalgamating Eastern Gondwana: the evolution ofthe Circum-Indian orogens. Earth-Science Reviews 71, 229–270. http://dx.doi.org/10.1016/j.earscirev.2005.02.004.
Commission for the Geological Map of the World, 2000. Geological Map of the World at1:25,000,000. CGMW and UNESCO.
Condie, K.C., 2000. Episodic continental growth models: afterthoughts and extensions.Tectonophysics 322, 153–162.
Condie, K.C., Rosen, O.M., 1994. Laurentia–Siberia connection revisited. Geology 22, 168–170.Dalziel, I.W.D., 1991. Pacific margins of Laurentia and East Antarctica–Australia as a
conjugate rift pair: evidence and implications for an Eocambrian supercontinent.Geology 19, 598–601.
Davis, D., Green, J., 1997. Geochronology of the North American Midcontinent rift inwestern Lake Superior and implications for its geodynamic evolution. CanadianJournal of Earth Sciences 34, 476–488.
Davis, D.W., Paces, J.B., 1990. Time resolution of geologic events on the Keweenaw Peninsulaand applications for development of the Midcontinent Rift system. Earth and PlanetaryScience Letters 97, 54–64.
Dehler, C.M., Fanning, C.M., Link, P.K., Kingsbury, E.M., Rybczynski, D., 2010. Maximumdepositional age and provenance of the Uinta Mountain Group and Big Cotton-wood Formation, northern Utah: Paleogeography of rifting western Laurentia.Geological Society of America Bulletin 122, 1686–1699.
Dharma Rao, C.V., Santosh, M., Wu, Y.-B., 2011. Mesoproterozoic ophiolitic mélangefrom the SE periphery of the Indian plate: U\Pb zircon ages and tectonic implica-tions. Gondwana Research 19, 384–401.
Dharma Rao, C.V., Santosh, M., Dong, Y., 2012. U–Pb zircon chronology of the Pangidi–Kondapalle layered intrusion, Eastern Ghats belt, India: Constraints on Mesoproterozoicarc magmatism in a convergent margin setting. Journal of Asian Earth Sciences 49,362–375.
Diehl, J.F., Haig, T.D., 1994. A paleomagnetic study of the lava flows within the CopperHarbor Conglomerate, Michigan: new results and implications. Canadian Journal ofEarth Sciences 31, 369–380.
Dobmeier, C.J., Raith, M.M., 2003. Crustal architecture and evolution of the EasternGhats Belt and adjacent regions of India. In: Yoshida, M., Windley, B.F., Dasgupta,S. (Eds.), Proterozoic East Gondwana: Supercontinent Assembly and Breakup: Spe-cial Publication Geological Society of London, vol. 206, pp. 145–168.
Emslie, R.F., Irving, E., Park, J.K., 1976. Further paleomagnetic results from the Michikamauintrusion, Labrador. Canadian Journal of Earth Sciences 13, 1052–1057.
Ernst, R.E., Buchan, K.L., 2001. Large mafic magmatic events through time and links tomantle plume heads. In: Ernst, R.E., Buchan, K.L. (Eds.), Mantle Plumes: Their Iden-tification Through Time: Geological Society of America Special Paper, 352,pp. 483–575.
Ernst, R.E., Srivastava, R.K., 2008. India's place in the Proterozoic world: constraintsfrom the large igneous provinces (LIP) record. In: Srivastava, R.K., Sivaji, Ch,Chalapathi Rao, N.V. (Eds.), Indian Dykes: Geochemistry, Geophysics, and Geochro-nology. Narosa Publishing House Pvt. Ltd, New Delhi, India, pp. 41–56.
(a)
(b)
(c)
(d)
Fig. 13. Palaeomagnetic testing of: (a) the India–SE Laurentia fit (Fig. 12a) at ~1190 Ma and ~1080 Ma (India is rotated to Laurentia about an Euler pole of 16.01°S, 7.90°W at136.28° anticlockwise); (b) the India-SW Laurentia fit (Fig. 12b) at ~1190 Ma and ~1080 Ma (India is rotated to Laurentia about an Euler pole of 8.73°N, 20.68°W at 106.10° an-ticlockwise); (c) the India-SW Siberia fit (Fig. 12c) at ~1190 Ma and ~1080 Ma (India is rotated to Siberia about an Euler pole of 28.63°N, 93.94°E at 129.84° clockwise); (d) theIndia-SW Baltica fit (Fig. 12d) at ~1120 Ma and ~1080 Ma (India is rotated to Baltica about an Euler pole of 30.67°N, 54.34°E at 184.93° clockwise).
141S.A. Pisarevsky et al. / Lithos 174 (2013) 125–143
142 S.A. Pisarevsky et al. / Lithos 174 (2013) 125–143
Ernst, R.E., Wingate, M.T.D., Buchan, K.L., Li, Z.X., 2008. Global record of 1600–700 MaLarge Igneous Provinces (LIPs): implications for the reconstruction of the proposedNuna (Columbia) and Rodinia supercontinents. Precambrian Research 160,159–178.
Evans, D.A.D., 2009. The palaeomagnetically viable, long-lived and all-inclusive Rodiniasupercontinent reconstruction. In: Murphy, J.B., Keppie, J.D., Hynes, A. (Eds.), An-cient Orogens and Modern Analogues: Geological Society of London Special Publi-cation, vol. 327, pp. 371–404.
Evans, D.A.D., Mitchell, R.N., 2011. Assembly and breakup of the core of Paleoproterozoic–Mesoproterozoic supercontinent Nuna. Geology 39, 443–446.
Evans, D.A.D., Pisarevsky, S.A., 2008. Plate tectonics on the early Earth?-weighing thepaleomagnetic evidence. In: Condie, K., Pease, V. (Eds.), When Did Plate TectonicsBegin: Geological Society of America Special Paper, 440, pp. 249–263.
Fisher, R.A., 1953. Dispersion on a sphere. Proceedings of the Royal Society of London217, 295–305.
French, J.E., Heaman, L.M., Chacko, T., Srivastava, R.K., 2008. 1891–1883 Ma SouthernBastar-Cuddapah mafic igneous events, India: a newly recognised large igneousprovince. Precambrian Research 160, 308–322.
Gallet, Y., Pavlov, V.E., Semikhatov, M.A., Petrov, P.Yu., 2000. Late Mesoproterozoicmagnetostratigraphic results from Siberia: paleogeographic implications and mag-netic field behaviour. Journal of Geophysical Research 105, 16481–16499.
Geological survey of Japan, Geochemical Reference samples DataBase,1998. (http://www.aist.go.jp/RIODB/geostand/welcome.html).
Ghosh, J.G., 2004. 3.56 Ga tonalite in the central part of the Bastar craton, India: oldestIndian date. Journal of Asian Earth Sciences 23, 359–364.
Gladkochub, D., Pisarevsky, S.A., Donskaya, T., Natapov, L.M., Mazukabzov, A., Stanevich,A.M., Slkyarov, E., 2006a. Siberian Craton and its evolution in terms of Rodinia hy-pothesis. Episodes 29 (3), 169–174.
Gladkochub, D.P., Wingate, M.T.D., Pisarevsky, S.A., Donskaya, T.V., Mazukabzov, A.M.,Ponomarchuk, V.A., Stanevich, A.M., 2006b. Mafic intrusions in southwestern Sibe-ria and implications for a Neoproterozoic connection with Laurentia. PrecambrianResearch 147, 260–278.
Gorbatschev, R., Bogdanova, S., 1993. Frontiers in the Baltic Shield. Precambrian Re-search 64, 3–21. http://dx.doi.org/10.1016/0301-9268(93)90066-B.
Gregory, L.C., Meert, J.G., Pradhan, V., Pandit, M.K., Tamrat, E., Malone, S.J., 2006. A paleo-magnetic and geochronological study of the Majhgawan Kimberlite, India: implica-tions for the age of the Vindhyan SuperGroup. Precambrian Research 149, 65–75.
Halls, H.C., 1974. A paleomagnetic reversal in the Osler Volcanic Group, northern LakeSuperior. Canadian Journal of Earth Sciences 11, 1200–1207.
Halls, H.C., Kumar, A., Srinivasan, R., Hamilton, M.A., 2006. A Mesoproterozoic paleo-magnetic pole from the Yangzhuang Formation, North China and its tectonics im-plications. Precambrian Research 151, 1–13.
Harlan, S.S., Geissman, J.W., Snee, L.W., 2008. Paleomagnetism of Proterozoic maficdikes from the Tobacco Root Mountains, southwest Montana. Precambrian Re-search 163, 239–264.
Harley, S.L., 2003. Archaean–Cambrian crustal development of East Antarctica: meta-morphic characteristics and tectonic implications. In: Yoshida, M., Windley, B.F.,Dasgupta, S. (Eds.), Proterozoic East Gondwana: Supercontinent Assembly andBreakup: Special Publication Geological Society of London, vol. 203, pp. 203–230.
Henry, S.G., Mauk, E.J., Van der Voo, R., 1977. Paleomagnetism of the upper Keweenawansediments: the Nonesuch Shale and Freda Sandstone. Canadian Journal of Earth Sci-ences 14, 1128–1138.
Hnat, J.S., Van der Pluijm, B.A., Van der Voo, R., 2006. Primary curvature in the Mid-Continent Rift: Paleomagnetism of the Portage Lake Volcanics (northern Michigan,USA). Tectonophysics 425, 71–82.
Hoffman, P.F., 1989. Precambrian geology and tectonic history of North America. In: Bally,A.W., Palmer, A.R. (Eds.), The Geology of North America – an overview. : The Geologyof North America. Geological Society of America, Boulder, Colorado, pp. 447–512.
Hoffman, P.F., 1991. Did the breakout of Laurentia turn Gondwana inside out? Science252, 1409–1412.
Hoffman, P.F., 1996. Tectonic genealogy of North America. In: van der Pliujm, B.A.,Marshak, S. (Eds.), Earth structure: An introduction to structural geology and tec-tonics. W.W. Norton & Company, New York, pp. 607–614.
Irving, E., Baker, J., Hamilton, M., Wynne, P.J., 2004. Early Proterozoic geomagnetic field inwestern Laurentia: implications for paleolatitudes, local rotations and stratigraphy. Pre-cambrian Research 129, 251–270. http://dx.doi.org/10.1016/j.precamres.2003.10.002.
Karlstrom, K.E., Harlan, S.S., Williams, M.L., McLelland, J., Geissman, J.W., Åhäll, K.-I.,1999. Refining Rodinia: geologic evidence for the Australia-Western U.S. connec-tion in the Proterozoic. GSA Today 9 (10), 1–7.
Karlstrom, K.E., Åhäll, K.I., Harlan, S.S., Williams, M.L., McLelland, J., Geissman, J.W.,2001. Long-lived (1.8–1.0 Ga) convergent orogen in southern Laurentia, its exten-sions to Australia and Baltica, and implications for refining Rodinia. PrecambrianResearch 111, 5–30.
Kay, R.W., Mahlburg Kay, S., 1993. Delamination and delamination magmatism.Tectonophysics 219 (1–3), 177–189.
Kean, W.F., Williams, I., Chan, L., Feeney, J., 1997. Magnetism of the Keweenawan ageChengwatana lava flows, northwest Wisconsin. Geophysical Research Letters 24,1523–1526.
Khan, R.M.K., Naqvi, S.M., 1996. Geology, geochemistry and genesis of BIF of Kushtagischist belt, Archaean Dharwar Craton, India. Mineralium Deposita 31, 123–133.
Kirschvink, J.L., 1980. The least squares line and plane and the analysis of palaeomagneticdata. Geophysical Journal of the Royal Astronomic Society 62, 699–718.
Korhonen, F.J., Saw, A.K., Clark, C., Brown, M., Bhattacharya, S., 2011. New constraintson UHT metamorphism in the Eastern Ghats Province through the application ofphase equilibria modelling and in situ geochronology. Gondwana Research 20,764–781.
Krogh, T.G., 1982. Improved accuracy of U\Pb zircon ages by the creation of more con-cordant systems using an air abrasion technique. Geochimica et CosmochimicaActa 46, 637–649.
Kumar, A., Heaman, L.M., Manikyamba, C., 2007.Mesoproterozoic kimberlites in south India:a possible link to 1.1 Ga global magmatism. Precambrian Research 154, 192–204.
Le Bas, M.J., Le Maitre, R.W., Streckeisen, A., Zanettin, B., 1986. A Chemical Classificationof Volcanic Rocks Based on the Total Alkali-Silica Diagram. Journal of Petrology 27(3), 745–750.
LeCheminant, A.N., Heaman, L.M., 1989. Mackenzie igneous events, Canada: MiddleProterozoic hotspot magmatism associated with ocean opening. Earth and Plane-tary Science Letters 96, 38–48. http://dx.doi.org/10.1016/0012-821X(89)90122-2.
Li, Z.X., Zhang, L., Powell, C.M., 1995. South China in Rodinia: part of the missing linkbetween Australia–East Antarctica and Laurentia? Geology 23, 407–410.
Lubnina, N., 2009. The East-European Craton from NeoArchean to Palaeozoic accordingto the palaeomagnetic data. Unpublished Dr. Sci. Thesis. Moscow State University,Moscow, 44 pp.
Lubnina, N.V., Mertanen, S., Soderlund, U., Bogdanova, S.V., Vasilieva, T.I., Frank-Kamenetsky, D., 2010. A new key pole for the East European Craton at 1452 Ma:Palaeomagnetic and geochronological constraints from mafic rocks in the LakeLadoga region. Precambrian Research 183, 442–462.
Luepke, J.J., Lyons, T.W., 2001. Pre-Rodinian (Mesoproterozoic) supercontinental riftingalong the western margin of Laurentia: geochemical evidence from the Belt-PurcellSupergroup. Precambrian Research 111, 79–90.
Malone, S.J., Meert, J.G., Banerjee, D.M., Pandit, M.K., Tamrat, E., Kamenov, G.D., Pradhan,V.R., Sohl, L.E., 2008. Paleomagnetism and detrital zircon geochronology of the UpperVindhyan sequence, Son Valley and Rajasthan, India: a ca. 1000 Ma closure age forthe Purana basins. Precambrian Research 164, 137–159.
McCabe, C., Van der Voo, R., 1983. Paleomagnetic results from the upper KeweenawanChequamegon Sandstone: implications for red bed diagenesis and Late Precambrian ap-parent polar wander of North America. Canadian Journal of Earth Sciences 20, 105–112.
McElhinny, M.W., Powell, C.M., Pisarevsky, S.A., 2003. Paleozoic terranes of easternAustralia and the drift history of Gondwana. Tectonophysics 362, 41–65.
Meert, J.G., 2002. Paleomagnetic evidence for a Paleo-Mesoproterozoic supercontinentColumbia. Gondwana Research 5, 207–215.
Meert, J.G., 2012. What's in a name? The Columbia (Paleopangaea/Nuna) superconti-nent. Gondwana Research 21, 987–993.
Meert, J.G., Stuckey, W., 2002. Revisiting the paleomagnetism of the 1.476 Ga St. FrancoisMountains igneous province, Missouri. Tectonics 21, 1007. http://dx.doi.org/10.1029/2000TC001265.
Meert, J.G., Torsvik, T.H., 2003. The making and unmaking of a supercontinent: Rodiniarevisited. Tectonophysics 375, 261–288.
Meert, J.G., Pandit, M.K., Pradhan, V.R., Banks, J., Sirianni, R., Stroud, M., Newstead, B.,Gifford, J., 2010. Precambrian crustal evolution of Peninsular India: 3.0 billionyear odyssey. Journal of Asian Earth Sciences 39, 483–515.
Meert, J.G., Pandit, M.K., Pradhan, V.R., Kamenov, G., 2011. Preliminary report on thepaleomagnetism of 1.8 Ga dykes from the Bastar and Dharwar cratons, PeninsularIndia. Gondwana Research 20, 335–343.
Mertanen, S., Pesonen, L.J., Huhma, H., 1996. Palaeomagnetism and Sm-Nd ages of theNeoproterozoic diabase dykes in Laanila and Kautokeino, northern Fennoscandia.In: Brewer, T.S. (Ed.), Precambrian Crustal Evolution in the North Atlantic region:Geological Society of London Special Publication, vol. 112, pp. 331–358.
Mezger, K., Cosca, M., 1999. The thermal history of the Eastern Ghats Belt (India), as re-vealed by U–Pb and 40Ar/39Ar dating of metamorphic and magmatic minerals: im-plications for the SWEAT hypothesis. Precambrian Research 94, 251–271.
Mohanty, S., 2010. Tectonic evolution of the Satpura Mountain Belt: a critical evaluation andimplication on supercontinent assembly. Journal of Asian Earth Sciences 39, 516–526.
Mohatny, S., 2012. Spatio-temporal evolution of the Satpura Mountain Belt of India: Acomparison with the Capricorn Orogen of Western Australia and implication forevolution of the supercontinent Columbia. Geoscience Frontiers 3, 241–267.
Moores, E.M., 1991. Southwest US–East Antarctic (SWEAT) connection: a hypothesis.Geology 19, 425–428.
Morrison, G.W., 1980. Characteristics and tectonic setting of the shoshonite rock asso-ciation. Lithos 13, 97–108.
Nanda, J.K., Rath, S.C., Behera, S.N., 1998. Alkaline and Ultramafic Magmatism in theContact Zone between High and Low Grade Terrains: Example from NW Orissa,India: Precambrian Crust in Eastern and Central India. Geological Survey of IndiaPublication, Bhubaneswar, India, pp. 122–130.
Neuvonen, K.J., 1965. Palaeomagnetism of the dike systems in Finland: I. Remanentmagnetization of Jotnian olivine dolerites in southwestern Finland. ComptesRendus de la Société Géologique de Finlande 37, 153–168.
Neuvonen, K.J., 1966. Palaeomagnetism of the dike systems in Finland: II. Remanentmagnetization of dolerites in the Vaasa archipelago. Comptes Rendus de la SociétéGéologique de Finlande 38, 275–281.
Neuvonen, K.J., Grundström, L., 1969. Paleomagnetism of the dike systems in Finland,IV. Remanent magnetization of the dolerite and related dikes in the ? Land archi-pelago. Bulletin of the Geological Society of Finland 41, 57–63.
Nilsson, M.K.M., Klausen, M.B., Söderlund, U., Ernst, R.E., 2013. Precise U\Pb ages andgeochemistry of Paleoproterozoic mafic dykes from southern West Greenland:Linking the North Atlantic and the Dharwar Cratons 174, 255–270 (this issue).
Ovchinnikova, G.V., Semikhatov, M.A., Vasil'eva, I.M., Gorokhov, I.M., Kaurova, O.K.,Podkovyrov, V.N., Gorokhovskii, B.M., 2001. Pb–Pb age of limestones of the middleRiphean Malgina Formation, the Uchur –Maya region of East Siberia. Stratigraphyand Geological Correlation 9, 490–502.
Pavlov, V.E., Gallet, Y., Shatsillo, A.V., 2000. Palaeomagnetism of the upper RipheanLakhanda Group of the Uchur–Maya area and the hypothesis of the late Proterozoicsupercontinent. Izvestia Fizika Zemli 8, 23–34 (in Russian).
143S.A. Pisarevsky et al. / Lithos 174 (2013) 125–143
Peccerillo, A., Taylor, S.R., 1976. Geochemistry of eocene calc-alkaline volcanic rocksfrom the Kastamonu area, Northern Turkey. Contributions to Mineralogy andPetrology 58 (1), 63–81.
Pe-Piper, G., Piper, D.J.W., Koukouvelas, I., Dolansky, L.M., Kokkalas, S., 2009. Postorogenicshoshonitic rocks and their origin by melting underplated basalts: The Miocene ofLimnos, Greece. Geological Society of America Bulletin 121 (1–2), 39–54.
Pesonen, L.J., Elming, S.-A., Mertanen, S., Pisarevsky, S.A., D'Agrella-Filho, M.S., Meert, J.,Schmidt, P.W., Abrahamsen, N., Bylund, G., 2003. Palaeomagnetic configuration ofcontinents during the Proterozoic. Tectonophysics 375, 289–324.
Piper, J.D.A., 1977. Palaeomagnetism of the giant dykes of Tugtutoq and Narssaq Gab-bro, Gardar Igneous Province, South Greenland. Bulletin of the Geological Societyof Denmark 26, 85–94.
Piper, J.D.A., 1992. The palaeomagnetism of major (Middle Proterozoic) igneous com-plexes, South Greenland and the Gardar apparent polar wander track. PrecambrianResearch 54, 153–172.
Pisarevsky, S.A., 2005. New edition of the Global Paleomagnetic Database. EOS transac-tions 86 (17), 170.
Pisarevsky, S.A., Bylund, G., 2010. Paleomagnetism of 1780–1770 Ma mafic and com-posite intrusions of Småland (Sweden): implications for the Mesoproterozoic su-percontinent. American Journal of Science 310, 1168–1186.
Pisarevsky, S.A., Natapov, L.M., 2003. Siberia and Rodinia. Tectonophysics 375, 221–245.Pisarevsky, S.A., Wingate, M.T.D., Harris, L.B., 2003. Late Mesoproterozoic (ca 1.2 Ga)
palaeomagnetism of the Albany-Fraser orogen: no pre-Rodinia Australia-Laurentiaconnection. Geophysical Journal International 155, F6–F11.
Pisarevsky, S.A., Natapov, L.M., Donskaya, T.V., Gladkochub, D.P., Vernikovsky, V.A., 2008.Proterozoic Siberia: a promontory of Rodinia. Precambrian Research 160, 66–76.
Polat, A., Hofmann, A.W., 2003. Alteration and geochemical patterns in the 3.7–3.8 GaIsua greenstone belt, West Greenland. Precambrian Research 126, 197–218.
Polat, A., Appel, P.W.U., Fryer, B.J., 2011. An overview of the geochemistry of Eoarcheanto Mesoarchean ultramafic to mafic volcanic rocks, SW Greenland: Implications formantle depletion and petrogenetic processes at subduction zones in the earlyEarth. Gondwana Research 20, 255–283.
Polat, A., Fryer, B.J., Samson, I.M., Weisener, C., Appel, P.W.U., Frei, R., Windley, B.F., inpress. Geochemistry of ultramafic rocks and hornblendite veins in theFiskenæsset layered anorthosite complex, SW Greenland: Evidence for hydrousupper mantle in the Archean. Precambrian Research. http://dx.doi.org/10.1016/j.precamres.2011.11.013.
Poprawa, P., Pacześna, J., 2002. Late Neoproterozoic to Early Palaeozoic developmentof a rift at the Lublin-Podlasie slope of the East European Craton – analysis ofsubsidence and facies record (eastern Poland). Przeglad Geologiczny 50 (1),49–63 (in Polish).
Pradhan, V.R., Pandit, M.K., Meert, J.G., 2008. A cautionary note of the age of the paleo-magnetic pole obtained from the Harohalli dyke swarms, Dharwar craton, south-ern India. In: Srivastava, R.K., Sivaji, Ch., Chalapati Rao, N.V. (Eds.), Indian Dykes:Geochemistry, Geophysics, and Geochronology. Narosa Publishing Ltd., NewDelhi, India, pp. 339–352.
Pradhan, V.R., Meert, J.G., Pandit, M.K., Kamenov, G., Gregory, L.C., Malone, S., 2010. India'schanging place in global Proterozoic reconstructions: new geochronologic con-straints on key paleomagnetic poles from the Dharwar and Aravalli/BundelkhandCratons. Journal of Geodynamics 50, 224–242.
Pradhan, V.R., Meert, J.G., Pandit, M.K., Kamenov, G., Mondal, M.E.A., 2012. Paleomag-netic and geochronological studies of the mafic dyke swarms of Bundelkhand cra-ton, central India: implications for the tectonic evolution and paleogeographicreconstructions. Precambrian Research 198–199, 51–76.
Pullaiah, G., Irving, E., Buchan, K.L., Dunlop, D.J., 1975. Magnetisation changes caused byburial and uplift. Earth and Planetary Science Letters 28, 133–143.
Rajesh, H.M., Mukhopadhyay, J., Beukes, N.J., Gutzmer, J., Belyanin, G.A., Armstrong,R.A., 2009. Evidence for an Early Archaean granite from Bastar craton, India. Journalof the Geological Society 166, 193–196.
Ratre, K., De Waele, B., Biswal, T.K., Sinha, S., 2010. SHRIMP geochronology for the 1450Ma Lakhna dyke swarm: Its implication for the presence of Eoarchaean crust in theBastar Craton and 1450–517 Ma depositional age for Purana basin (Khariar), East-ern Indian Peninsula. Journal of Asian Earth Sciences 39, 565–577.
Rickers, K., Mezger, K., Raith, M., 2001. Evolution of the continental crust in the Protero-zoic Eastern Ghats Belt, India and new constraints for Rodinia reconstruction: impli-cations from Sm–Nd, Rb–Sr and Pb–Pb isotopes. Precambrian Res. 112, 183–210.
Rogers, J.W.J., Santosh, M., 2002. Configuration of Columbia, a Mesoproterozoic Super-continent. Gondwana Research 5, 5–22.
Rogers, J.J.W., Santosh, M., 2009. Tectonics and surface effects of the supercontinent Co-lumbia. Gondwana Research 15, 373–380.
Rosen, O.M., Condie, K.C., Natapov, L.M., Nozhkin, A.D., 1994. Archean and Early Prote-rozoic evolution of the Siberian craton: a preliminary assessment. In: Condie, K.C.(Ed.), Archean Crustal Evolution. Elsevier, Amsterdam, pp. 411–459.
Ross, G.M., Bloch, J.D., Krouse, H.R., 1995. Neoproterozoic strata of the southern Cana-dian Cordillera and the isotopic evolution of seawater sulfate. Precambrian Re-search 73, 71–99.
Roy, A., Prasad, M.H., 2003. Tectonothermal events in Central Indian Tectonic Zone(CITZ) and its implications in Rodinian crustal assembly. Journal of Asian EarthSciences 22, 115–129.
Roy, J.L., Robertson, W.A., 1978. Paleomagnetism of the Jacobsville Formation and theapparent polar path for the interval −1100 to −670 m.y. for North America. Jour-nal of Geophysical Research 83, 1289–1304.
Roy, A., Kagami, H., Yoshida, M., Roy, A., Bandyopadhyay, B.K., Chattopadhyay, A., 2006.Rb/Sr and Sm/Nd dating of different metamorphic events from the Sausar mobilebelt, central India; implications for Proterozoic crustal evolution. Journal of AsianEarth Sciences 26, 61–76.
Salminen, J., Pesonen, L.J., 2007. Paleomagnetic and rock magnetic study of theMesoproterozoic sill, Valaam island, Russian Karelia. Precambrian Research 159,212–230.
Salminen, J., Pesonen, L.J., Mertanen, S., Vuollo, J., Airo, M.-L., 2009. Palaeomagnetism ofthe Salla Diabase Dyke, northeastern Finland, and its implication for the Baltica–Laurentia entity during the Mesoproterozoic. In: Reddy, S.M., Mazumder, R.,Evans, D.A.D., Collins, A.S. (Eds.), Palaeoproterozoic Supercontinents and GlobalEvolution: Geological Society, London, Special Publications, vol. 323, pp. 199–217.
Santosh, M., 2012. India's Palaeoproterozoic legacy. Geological Society of LondonSpecial Publications vol. 365, 263–288.
Sarkar, G., Corfu, F., Paul, D.K., McNaughton, N.J., Gupta, S.N., Bishui, P.K., 1993. EarlyArchean crust in Bastar craton, central India – a geochemical and isotopic study.Precambrian Research 62, 127–137.
Scarrow, J.H., Bea, F., Montero, P., Molina, J.F., 2008. Shoshonites, vaugnerites and po-tassic lamprophyres: similarities and differences between ‘ultra’-high-K rocks.Earth and Environmental Science Transactions of the Royal Society of Edinburgh99, 159–175.
Schofield, D.I., Thomas, R.J., Goodenough, K.M., De Waele, B., Pitfield, P.E.J., Key, R.M.,Bauer, W., Walsh, G.J., Lidke, D.J., Ralison, A.V., Rabarimanana, M., Rafahatelo,J.M., Randriamananjara, T., 2010. Geological evolution of the Antongil Craton, NEMadagascar. Precambrian Research 182, 187–203.
Sears, J.W., Price, R.A., 2000. New look at the Siberian connection: no SWEAT. Geology28, 423–426.
Shchipansky, A.A., Bogdanova, S.V., 1996. The Sarmatian crustal segment: Precambriancorrelation between the Voronezh Massif and the Ukrainian Shield across theDniepr-Donets aulocogen. Tectonophysics 268, 109–125.
Shchipansky, A.A., Samsonov, A.V., Petrova, A.Y., Larionova, Y.O., 2007. Geodynamics ofthe Eastern Margin of Sarmatia in the Paleoproterozoic. Geotectonics 41 (1),38–62.
Söderlund, U., Johansson, L., 2002. A simple way to extract baddeleyite (ZrO2). Geochem-istry Geophysics Geosystems 3 (2). http://dx.doi.org/10.1029/2001GC000212.
Srivastava, R.K., 2006. Precambrian mafic dyke swarms from the central Indian Bastarcraton: Temporal evolution of the subcontinental mantle. In: Hanski, E.,Mertanen, S., Rämö, T., Vuollo, J. (Eds.), Dyke swarms – time markers of crustalevolution. Taylor & Francis Group, London. ISBN: 0 415 39899 1, pp. 147–159.
Srivastava, R.K., Singh, R.K., Verma, S.P., 2004. Neoarchaean mafic volcanic rocks fromthe southern Bastar greenstone belt, Central India: petrological and tectonic signif-icance. Precambrian Research 131, 305–322.
Stacey, J.S., Kramers, J.D., 1975. Approximation of Terrestrial lead isotope evolution by atwo-stage model. Earth and Planetary Science Letters 26, 207–221.
Stearn, J.E.F., Piper, J.D.A., 1984. Palaeomagnetism of the Sveconorwegian mobile belt ofthe Fennoscandian Shield. Precambrian Research 23, 201–246. http://dx.doi.org/10.1016/0301-9268(84)90045-7.
Stein, H.J., Hannah, J.L., Zimmerman, A., Markey, R.J., Sarkar, S.C., Pal, A.B., 2004. A 2.5 Gaporphyry Cu–Mo–Au deposit at Malanjkhand, central India; implications for lateArchean continental assembly. Precambrian Research 134, 189–226.
Sun, S.S., McDonough, W.F., 1989. Chemical and isotope systematics of oceanic basalts:implication for mantle composition and processes. In: Saunders, A.D., Norry, M.J.(Eds.), Magmatism in the Ocean Basins: Geological Society Special Publication,42, pp. 313–345.
Tucker, R.D., Ashwal, L.D., Torsvik, T.H., 2001. U\Pb geochronology of Seychellesgranitoids: a Neoproterozoic continental arc fragment. Earth and Planetary ScienceLetters 187, 27–38.
Upton, B.G.J., Emeleus, C.H., Heaman, L.M., Goodenough, K.M., Finch, A.A., 2003.Magmatism of the mid-Proterozoic Gardar Province, South Greenland: chronology,petrogenesis and geological setting. Lithos 68, 43–65.
Walton, D., 1980. Time-temperature relations in the magnetisation of assembles ofsingle-domain grains. Nature 286, 245–247.
Wang, X.-C., Li, X.-H., Li, W.-X., Li, Z.X., Liu, Y., Yang, Y.-H., Liang, X.-R., Tu, X.-L., 2008.The Bikou basalts in the northwestern Yangtze block, South China: Remnants of820–810 Ma continental flood basalts? Geological Society of America Bulletin120 (11–12), 1478–1492.
Wang, X.-C., Li, X.-H., Li, Z.-X., Liu, Y., Yang, Y.-H., 2010. The Willouran basic province ofSouth Australia: Its relation to the Guibei large igneous province in South Chinaand the breakup of Rodinia. Lithos 119 (3–4), 569–584.
Warnock, A.C., Kodama, K.P., Zeitler, P.K., 2000. Using thermochronometry and low-temperature demagnetization to accurately date Precambrian paleomagneticpoles. Journal of Geophysical Research 105, 19435–19453.
Weil, A.B., Geissman, J.W., Heizler, M., Van der Voo, R., 2003. Paleomagnetism of MiddleProterozoic mafic intrusions and Upper Proterozoic (Nankoweap) red beds fromthe Lower Grand Canyon Supergroup, Arisona. Tectonophysics 375, 199–220.
Wingate, M.T.D., Pisarevsky, S.A., Evans, D.A.D., 2002. A revised Rodinia superconti-nent: no SWEAT, no AUSWUS. Terra Nova 14, 121–128.
Wingate, M.T.D., Pisarevsky, S.A., Gladkochub, D.P., Donskaya, T.V., Konstantinov, K.M.,Mazukabzov, A.M., Stanevich, A.M., 2009. Geochronology and paleomagnetism ofmafic igneous rocks in the Olenek Uplift, northern Siberia: implications forMesoproterozoic supercontinents and paleogeography. Precambrian Research170, 256–266.
Yedekar, D.B., Jain, S.C., Nair, K.K.K., Dutta, K.K., 1990. The central Indian collision su-ture, Precambrian of Central India. Geological Society of India Special Publication57, 9–25.
Zartman, R.E., Nicholson, S.W., Cannon, W.F., Morey, G.B., 1997. U-Th-Pb zircon ages ofsome Keweenawan Supergroup rocks from the south shore of Lake Superior.Canadian Journal of Earth Sciences 34, 549–567.
Zhao, G., Sun, M., Wilde, S.A., Li, S., 2004. A Paleo-Mesoproterozoic supercontinent: as-sembly, growth and breakup. Earth-Science Reviews 67, 91–123.