page left blank intentionally - ideas first
TRANSCRIPT
2 | P a g e www.ideasfirst.in
PAGE LEFT BLANK INTENTIONALLY
Ferrochrome Industry
March 2010 3 | P a g e
Summary Demand for chromium is primarily driven by the metallurgical industry which consumes 94% of the
chrome ore being produced world‐over, out of which 90% of chrome ore is consumed by stainless
steel. Being one of the most basic commodities with versatile applications throughout the economic
value chain demand for stainless steel and in turn chromium is likely to remain on the higher side.
While demand is one side of the story the other and most important facet that drives the overall
dynamics of any industry is the supply side. On this front, at the end of 2008 global reserves of chrome
ore stood at 11 billion tonnes against which only 24.4 million tonnes had been extracted. Considering
this, the potential that the industry offers is huge. The concentration of chrome ore reserves and
resources are largely spread over three key regions ‐ South Africa, Zimbabwe and Kazakhstan – which
together account for more than 95% of the reserves and 90% of the global resources.
On the demand front, the market for ferrochrome has historically been very cyclical. The result has
been an increased production of chromite by vertically integrated producers with access to chromite
mines and who have set up factories for the production of chromium chemicals, ferrochromium and
chromite.
A highly power‐intensive process, ferrochrome manufacturing needs easy and ample supply of
electricity. Though globally South Africa is the largest producer of chrome ore and ferrochrome, one of
the major issues that South Africa faces is the availability of power. This has led to supply shortages
against a rising demand and consequently higher ferrochrome prices.
Another scenario that has emerged out of this power shortage in South Africa is the export of raw
chrome ore (unbeneficated) particularly to China. China imports almost 50% of its total requirement
from South Africa. With demand for stainless steel on the rise in China, thanks to its robust economic
growth year after year over the past two decades its requirement of ferrochrome has also been equally
high. This has created a geographical shift in the demand‐supply equation of ferrochrome.
Ferrochrome Industry
4 | P a g e www.ideasfirst.in
What is essentially driving demand for the commodity and provides a strong backing to its investment
rationale is the absence of any known substitute for it in the stainless steel production chain. So how
does one essentially ride the chromium boom?
As an investor, owning physical Chromium is of no use. The virgin metal is neither used by the stainless
steel industry nor is it traded on a public exchange. There is no large independent chrome ore mining
companies in the listed space. The best way to benefit from the chromium boom is to invest in large
publicly listed ferrochrome producers.
Ferrochrome Industry
March 2010 5 | P a g e
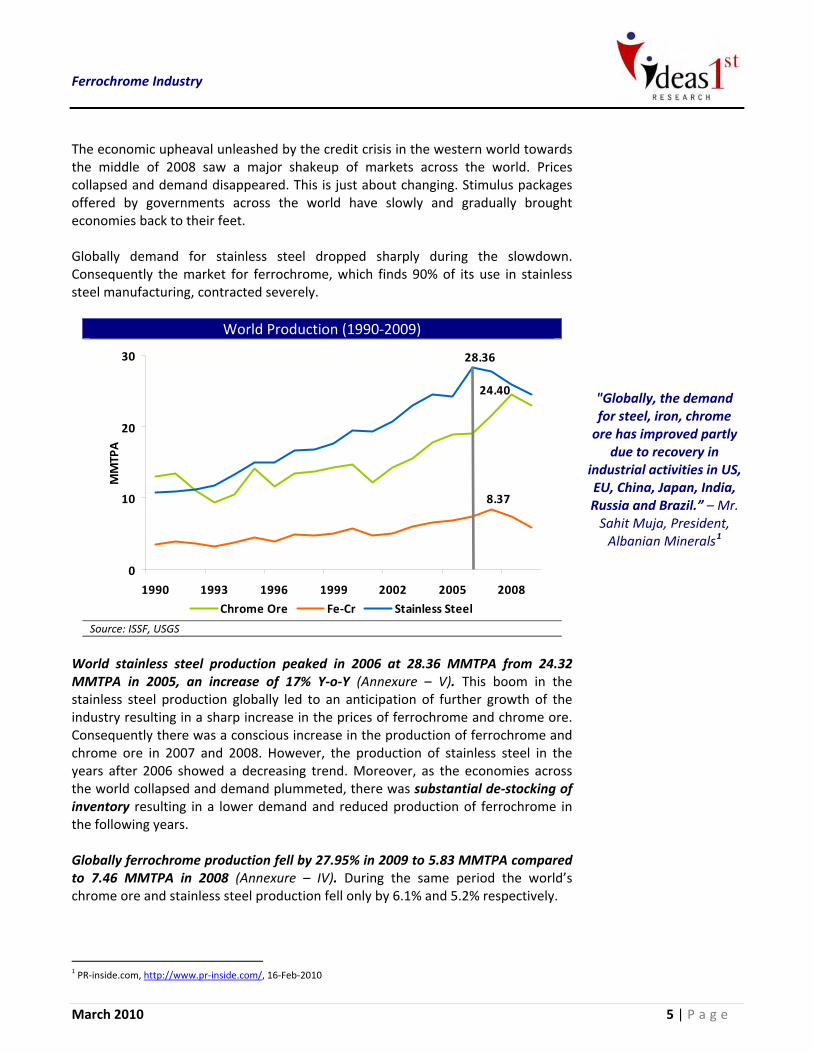
The economic upheaval unleashed by the credit crisis in the western world towards the middle of 2008 saw a major shakeup of markets across the world. Prices collapsed and demand disappeared. This is just about changing. Stimulus packages offered by governments across the world have slowly and gradually brought economies back to their feet. Globally demand for stainless steel dropped sharply during the slowdown. Consequently the market for ferrochrome, which finds 90% of its use in stainless steel manufacturing, contracted severely.
World Production (1990‐2009)
8.37
0
10
1990 1993 1996 1999 2002 2005 2008
28.36
20
30
MMTPA
Chrome Ore Fe‐Cr Stainless Steel
24.40
Source: ISSF, USGS
World stainless steel production peaked in 2006 at 28.36 MMTPA from 24.32 MMTPA in 2005, an increase of 17% Y‐o‐Y (Annexure – V). This boom in the stainless steel production globally led to an anticipation of further growth of the industry resulting in a sharp increase in the prices of ferrochrome and chrome ore. Consequently there was a conscious increase in the production of ferrochrome and chrome ore in 2007 and 2008. However, the production of stainless steel in the years after 2006 showed a decreasing trend. Moreover, as the economies across the world collapsed and demand plummeted, there was substantial de‐stocking of inventory resulting in a lower demand and reduced production of ferrochrome in the following years. Globally ferrochrome production fell by 27.95% in 2009 to 5.83 MMTPA compared to 7.46 MMTPA in 2008 (Annexure – IV). During the same period the world’s chrome ore and stainless steel production fell only by 6.1% and 5.2% respectively.
"Globally, the demand for steel, iron, chrome ore has improved partly
due to recovery in industrial activities in US, EU, China, Japan, India, Russia and Brazil.” – Mr. Sahit Muja, President, Albanian Minerals1
1 PR‐inside.com, http://www.pr‐inside.com/, 16‐Feb‐2010
Ferrochrome Industry
6 | P a g e www.ideasfirst.in
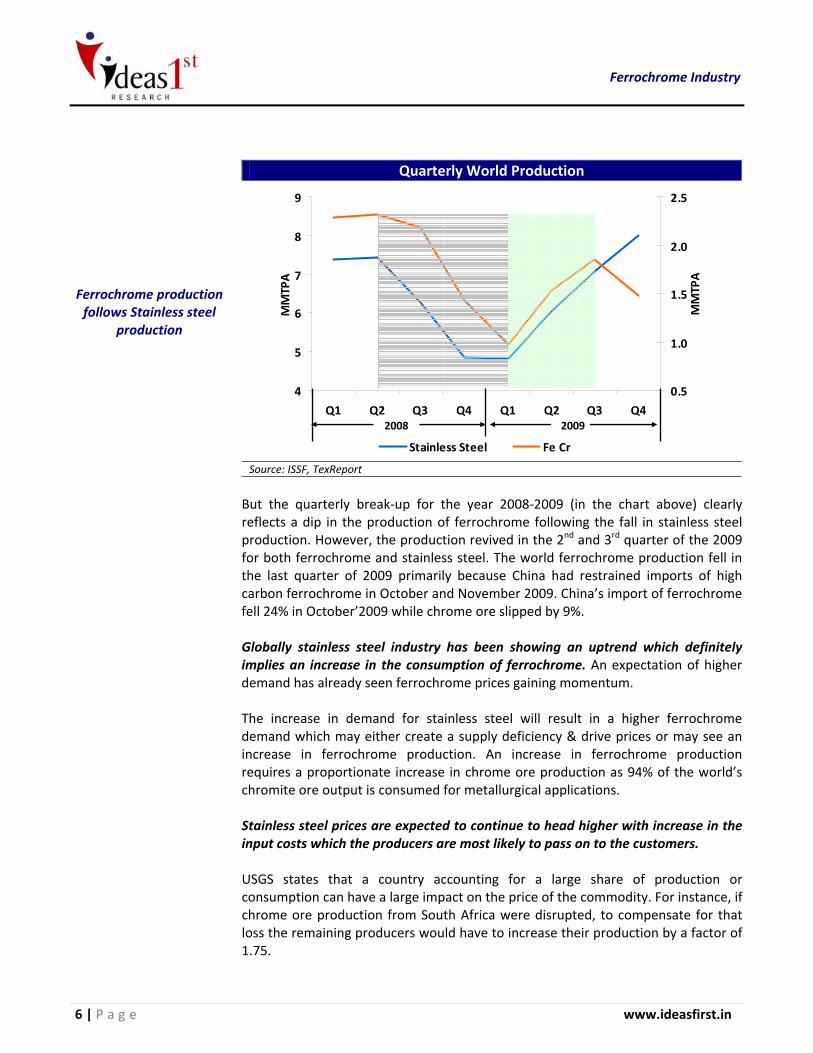
Ferrochrome production follows Stainless steel
production
Quarterly World Production
4
5
Q1 Q2 Q3 Q4 Q1 Q2 Q3 Q4
0.5
1.0
6
7
8
9
MMTPA
1.5
2.0
2.5
MMTPA
Stainless Steel Fe Cr
2008 2009
Source: ISSF, TexReport
But the quarterly break‐up for the year 2008‐2009 (in the chart above) clearly reflects a dip in the production of ferrochrome following the fall in stainless steel production. However, the production revived in the 2nd and 3rd quarter of the 2009 for both ferrochrome and stainless steel. The world ferrochrome production fell in the last quarter of 2009 primarily because China had restrained imports of high carbon ferrochrome in October and November 2009. China’s import of ferrochrome fell 24% in October’2009 while chrome ore slipped by 9%. Globally stainless steel industry has been showing an uptrend which definitely implies an increase in the consumption of ferrochrome. An expectation of higher demand has already seen ferrochrome prices gaining momentum. The increase in demand for stainless steel will result in a higher ferrochrome demand which may either create a supply deficiency & drive prices or may see an increase in ferrochrome production. An increase in ferrochrome production requires a proportionate increase in chrome ore production as 94% of the world’s chromite ore output is consumed for metallurgical applications. Stainless steel prices are expected to continue to head higher with increase in the input costs which the producers are most likely to pass on to the customers. USGS states that a country accounting for a large share of production or consumption can have a large impact on the price of the commodity. For instance, if chrome ore production from South Africa were disrupted, to compensate for that loss the remaining producers would have to increase their production by a factor of 1.75.
Ferrochrome Industry
March 2010 7 | P a g e
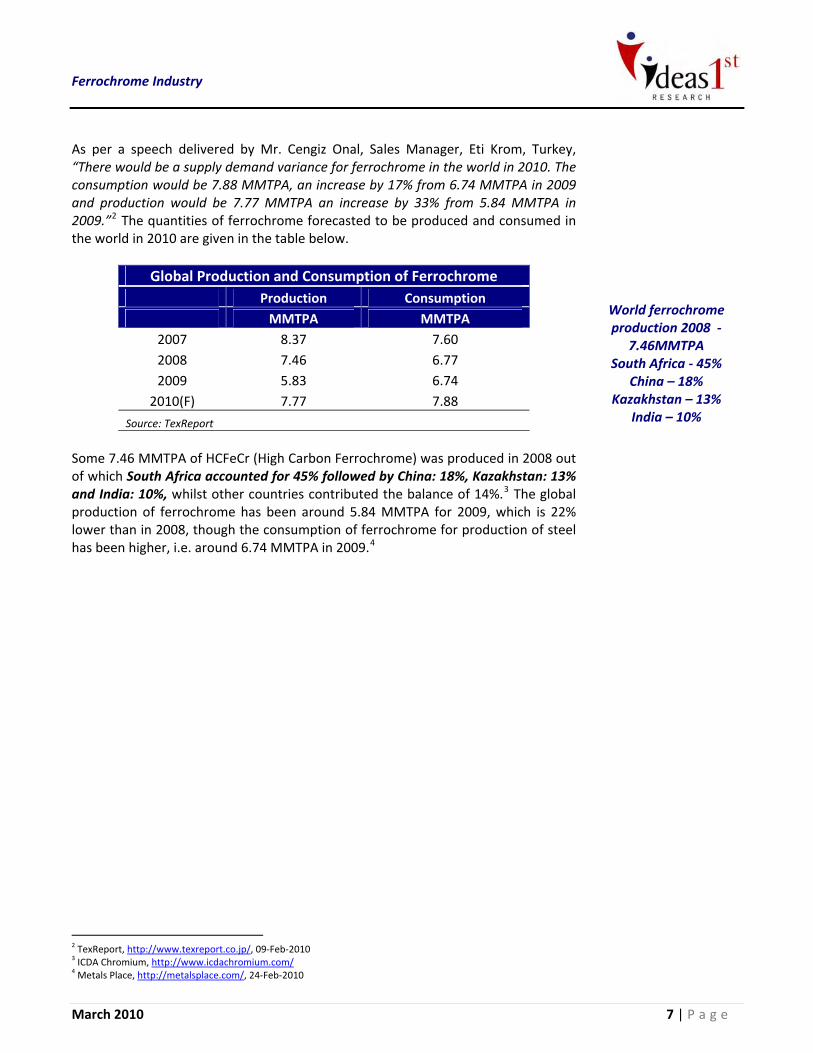
As per a speech delivered by Mr. Cengiz Onal, Sales Manager, Eti Krom, Turkey, “There would be a supply demand variance for ferrochrome in the world in 2010. The consumption would be 7.88 MMTPA, an increase by 17% from 6.74 MMTPA in 2009 and production would be 7.77 MMTPA an increase by 33% from 5.84 MMTPA in 2009.”2 The quantities of ferrochrome forecasted to be produced and consumed in the world in 2010 are given in the table below.
Global Production and Consumption of Ferrochrome Production Consumption MMTPA MMTPA
2007 8.37 7.60 2008 7.46 6.77 2009 5.83 6.74
2010(F) 7.77 7.88
Source: TexReport
Some 7.46 MMTPA of HCFeCr (High Carbon Ferrochrome) was produced in 2008 out of which South Africa accounted for 45% followed by China: 18%, Kazakhstan: 13% and India: 10%, whilst other countries contributed the balance of 14%.3 The global production of ferrochrome has been around 5.84 MMTPA for 2009, which is 22% lower than in 2008, though the consumption of ferrochrome for production of steel has been higher, i.e. around 6.74 MMTPA in 2009.4
World ferrochrome production 2008 ‐
7.46MMTPA South Africa ‐ 45%
China – 18% Kazakhstan – 13%
India – 10%
2 TexReport, http://www.texreport.co.jp/, 09‐Feb‐2010 3 ICDA Chromium, http://www.icdachromium.com/ 4 Metals Place, http://metalsplace.com/, 24‐Feb‐2010
Ferrochrome Industry
8 | P a g e www.ideasfirst.in
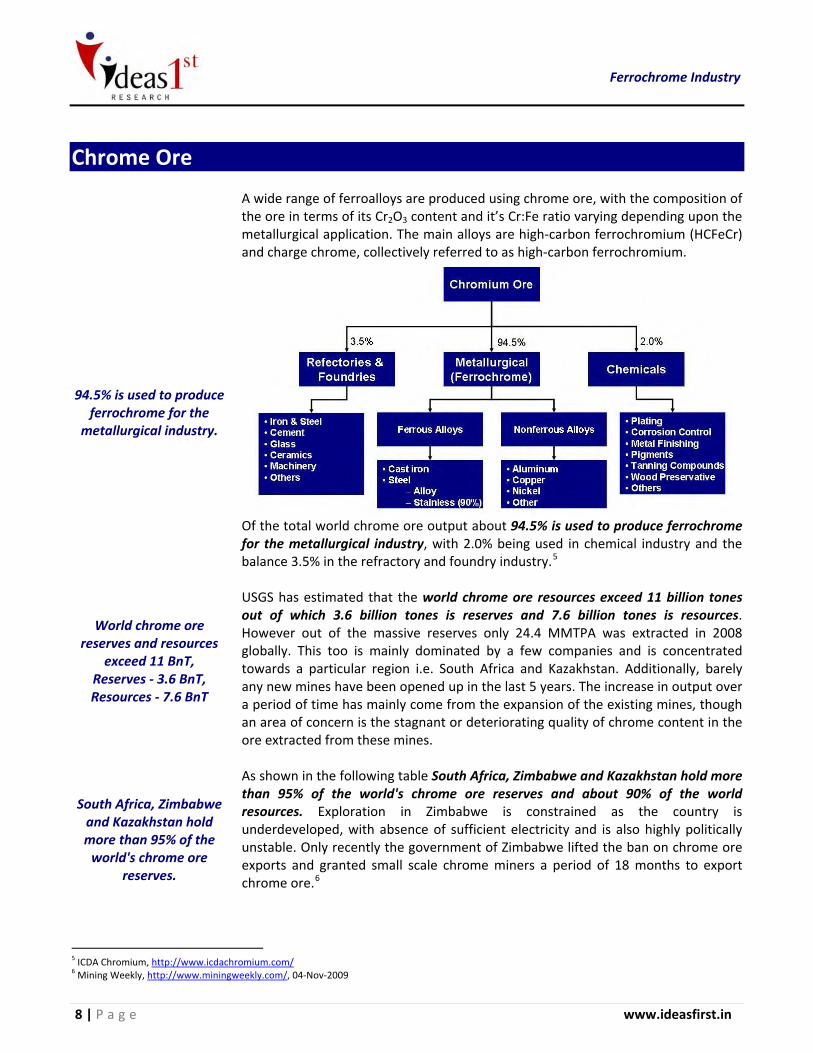
Chrome Ore
94.5% is used to produce ferrochrome for the
metallurgical industry.
World chrome ore reserves and resources
exceed 11 BnT, Reserves ‐ 3.6 BnT, Resources ‐ 7.6 BnT
South Africa, Zimbabwe and Kazakhstan hold more than 95% of the world's chrome ore
reserves.
A wide range of ferroalloys are produced using chrome ore, with the composition of the ore in terms of its Cr2O3 content and it’s Cr:Fe ratio varying depending upon the metallurgical application. The main alloys are high‐carbon ferrochromium (HCFeCr) and charge chrome, collectively referred to as high‐carbon ferrochromium.
Of the total world chrome ore output about 94.5% is used to produce ferrochrome for the metallurgical industry, with 2.0% being used in chemical industry and the balance 3.5% in the refractory and foundry industry.5 USGS has estimated that the world chrome ore resources exceed 11 billion tones out of which 3.6 billion tones is reserves and 7.6 billion tones is resources. However out of the massive reserves only 24.4 MMTPA was extracted in 2008 globally. This too is mainly dominated by a few companies and is concentrated towards a particular region i.e. South Africa and Kazakhstan. Additionally, barely any new mines have been opened up in the last 5 years. The increase in output over a period of time has mainly come from the expansion of the existing mines, though an area of concern is the stagnant or deteriorating quality of chrome content in the ore extracted from these mines. As shown in the following table South Africa, Zimbabwe and Kazakhstan hold more than 95% of the world's chrome ore reserves and about 90% of the world resources. Exploration in Zimbabwe is constrained as the country is underdeveloped, with absence of sufficient electricity and is also highly politically unstable. Only recently the government of Zimbabwe lifted the ban on chrome ore exports and granted small scale chrome miners a period of 18 months to export chrome ore.6
5 ICDA Chromium, http://www.icdachromium.com/ 6 Mining Weekly, http://www.miningweekly.com/, 04‐Nov‐2009
Ferrochrome Industry
March 2010 9 | P a g e
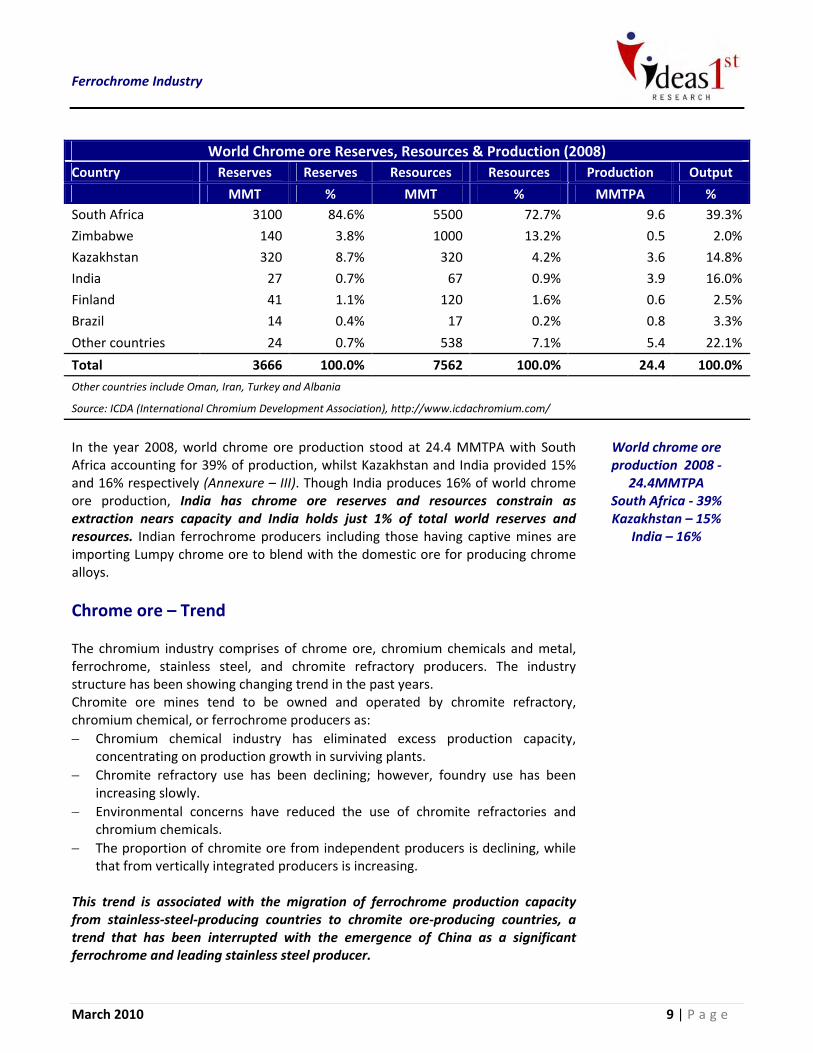
World Chrome ore Reserves, Resources & Production (2008)
Country Reserves Reserves Resources Resources Production Output
MMT % MMT % MMTPA % South Africa 3100 84.6% 5500 72.7% 9.6 39.3%
Zimbabwe 140 3.8% 1000 13.2% 0.5 2.0%
Kazakhstan 320 8.7% 320 4.2% 3.6 14.8%
India 27 0.7% 67 0.9% 3.9 16.0%
Finland 41 1.1% 120 1.6% 0.6 2.5%
Brazil 14 0.4% 17 0.2% 0.8 3.3%
Other countries 24 0.7% 538 7.1% 5.4 22.1%
Total 3666 100.0% 7562 100.0% 24.4 100.0%Other countries include Oman, Iran, Turkey and Albania
Source: ICDA (International Chromium Development Association), http://www.icdachromium.com/
In the year 2008, world chrome ore production stood at 24.4 MMTPA with South Africa accounting for 39% of production, whilst Kazakhstan and India provided 15% and 16% respectively (Annexure – III). Though India produces 16% of world chrome ore production, India has chrome ore reserves and resources constrain as extraction nears capacity and India holds just 1% of total world reserves and resources. Indian ferrochrome producers including those having captive mines are importing Lumpy chrome ore to blend with the domestic ore for producing chrome alloys.
Chrome ore – Trend The chromium industry comprises of chrome ore, chromium chemicals and metal, ferrochrome, stainless steel, and chromite refractory producers. The industry structure has been showing changing trend in the past years. Chromite ore mines tend to be owned and operated by chromite refractory, chromium chemical, or ferrochrome producers as: − Chromium chemical industry has eliminated excess production capacity,
concentrating on production growth in surviving plants. − Chromite refractory use has been declining; however, foundry use has been
increasing slowly. − Environmental concerns have reduced the use of chromite refractories and
chromium chemicals. − The proportion of chromite ore from independent producers is declining, while
that from vertically integrated producers is increasing. This trend is associated with the migration of ferrochrome production capacity from stainless‐steel‐producing countries to chromite ore‐producing countries, a trend that has been interrupted with the emergence of China as a significant ferrochrome and leading stainless steel producer.
World chrome ore production 2008 ‐
24.4MMTPA South Africa ‐ 39% Kazakhstan – 15%
India – 16%
Ferrochrome Industry
10 | P a g e www.ideasfirst.in
Ferrochrome
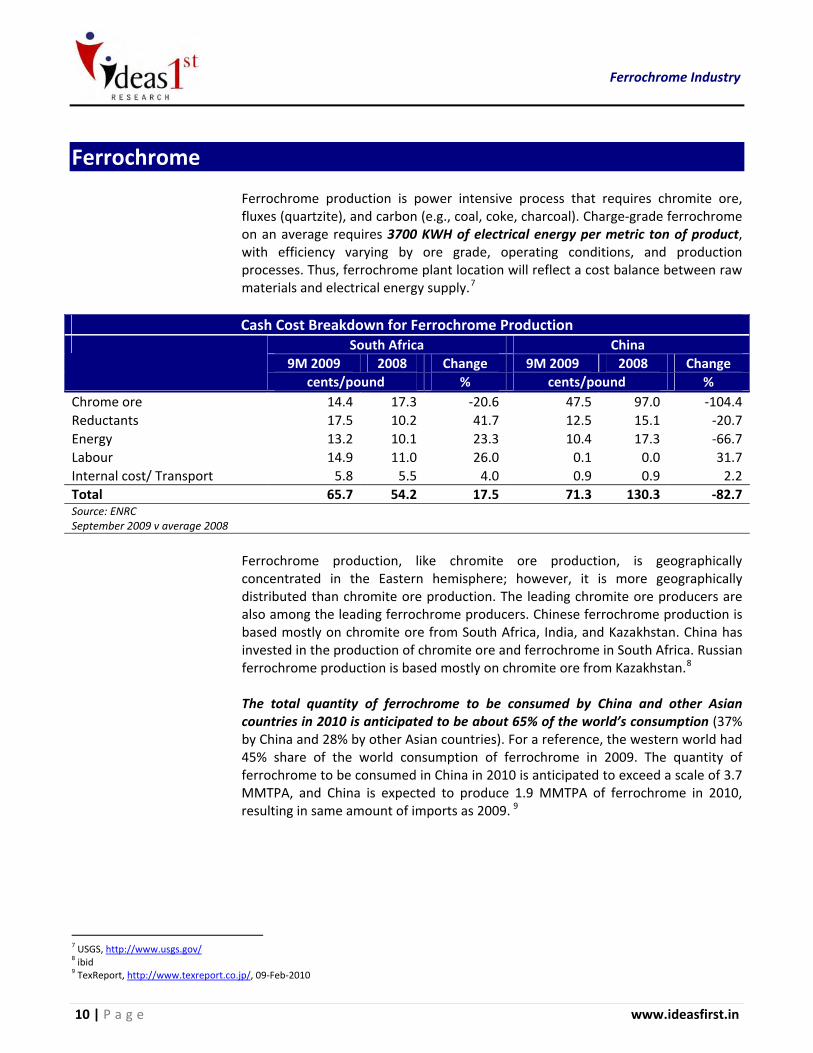
Ferrochrome production is power intensive process that requires chromite ore, fluxes (quartzite), and carbon (e.g., coal, coke, charcoal). Charge‐grade ferrochrome on an average requires 3700 KWH of electrical energy per metric ton of product, with efficiency varying by ore grade, operating conditions, and production processes. Thus, ferrochrome plant location will reflect a cost balance between raw materials and electrical energy supply.7
Cash Cost Breakdown for Ferrochrome Production
South Africa China 9M 2009 2008 Change 9M 2009 2008 Change
cents/pound % cents/pound % Chrome ore 14.4 17.3 ‐20.6 47.5 97.0 ‐104.4Reductants 17.5 10.2 41.7 12.5 15.1 ‐20.7Energy 13.2 10.1 23.3 10.4 17.3 ‐66.7Labour 14.9 11.0 26.0 0.1 0.0 31.7Internal cost/ Transport 5.8 5.5 4.0 0.9 0.9 2.2Total 65.7 54.2 17.5 71.3 130.3 ‐82.7Source: ENRC September 2009 v average 2008
Ferrochrome production, like chromite ore production, is geographically
concentrated in the Eastern hemisphere; however, it is more geographically distributed than chromite ore production. The leading chromite ore producers are also among the leading ferrochrome producers. Chinese ferrochrome production is based mostly on chromite ore from South Africa, India, and Kazakhstan. China has invested in the production of chromite ore and ferrochrome in South Africa. Russian ferrochrome production is based mostly on chromite ore from Kazakhstan.8 The total quantity of ferrochrome to be consumed by China and other Asian countries in 2010 is anticipated to be about 65% of the world’s consumption (37% by China and 28% by other Asian countries). For a reference, the western world had 45% share of the world consumption of ferrochrome in 2009. The quantity of ferrochrome to be consumed in China in 2010 is anticipated to exceed a scale of 3.7 MMTPA, and China is expected to produce 1.9 MMTPA of ferrochrome in 2010, resulting in same amount of imports as 2009. 9
7 USGS, http://www.usgs.gov/ 8 ibid 9 TexReport, http://www.texreport.co.jp/, 09‐Feb‐2010
Ferrochrome Industry
March 2010 11 | P a g e
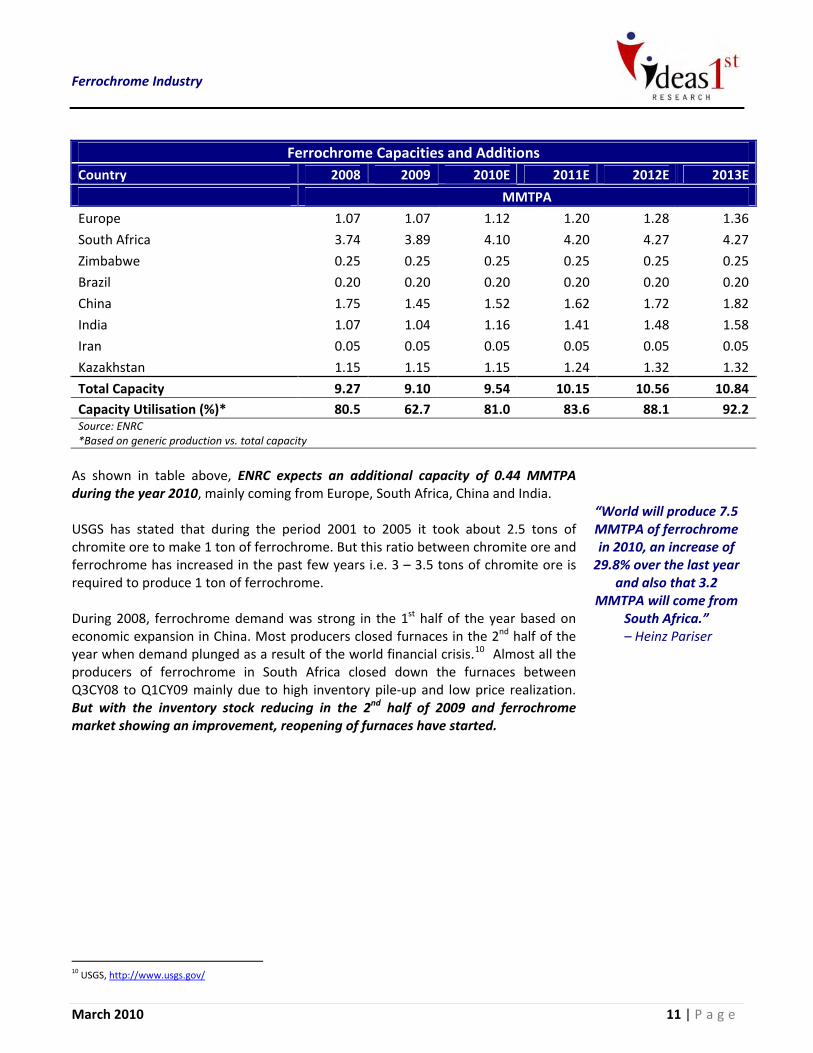
Ferrochrome Capacities and Additions Country 2008 2009 2010E 2011E 2012E 2013E
MMTPA
Europe 1.07 1.07 1.12 1.20 1.28 1.36
South Africa 3.74 3.89 4.10 4.20 4.27 4.27
Zimbabwe 0.25 0.25 0.25 0.25 0.25 0.25
Brazil 0.20 0.20 0.20 0.20 0.20 0.20
China 1.75 1.45 1.52 1.62 1.72 1.82
India 1.07 1.04 1.16 1.41 1.48 1.58
Iran 0.05 0.05 0.05 0.05 0.05 0.05
Kazakhstan 1.15 1.15 1.15 1.24 1.32 1.32
Total Capacity 9.27 9.10 9.54 10.15 10.56 10.84Capacity Utilisation (%)* 80.5 62.7 81.0 83.6 88.1 92.2Source: ENRC *Based on generic production vs. total capacity
As shown in table above, ENRC expects an additional capacity of 0.44 MMTPA during the year 2010, mainly coming from Europe, South Africa, China and India. USGS has stated that during the period 2001 to 2005 it took about 2.5 tons of chromite ore to make 1 ton of ferrochrome. But this ratio between chromite ore and ferrochrome has increased in the past few years i.e. 3 – 3.5 tons of chromite ore is required to produce 1 ton of ferrochrome. During 2008, ferrochrome demand was strong in the 1st half of the year based on economic expansion in China. Most producers closed furnaces in the 2nd half of the year when demand plunged as a result of the world financial crisis.10 Almost all the producers of ferrochrome in South Africa closed down the furnaces between Q3CY08 to Q1CY09 mainly due to high inventory pile‐up and low price realization. But with the inventory stock reducing in the 2nd half of 2009 and ferrochrome market showing an improvement, reopening of furnaces have started.
“World will produce 7.5 MMTPA of ferrochrome in 2010, an increase of 29.8% over the last year
and also that 3.2 MMTPA will come from
South Africa.” – Heinz Pariser
10 USGS, http://www.usgs.gov/
Ferrochrome Industry
12 | P a g e www.ideasfirst.in
Stainless Steel: Largest consumer of Ferrochrome
“Stainless steel prices are likely to continue to head higher because of the increase in input costs which the producers are going to pass on to the
customers” – MEPS.
“World stainless steel demand to grow by 10%
in 2010” – MEPS.
“World production of stainless steel will rise by 18.3% in 2010 to 29.9
MMTPA.” – Forecast by Heinz
Pariser.11
The stainless steel industry is the largest consumer of ferrochrome and the revival in stainless steel production has been remarkable in Europe, the USA, Japan and South Korea. In addition, China has been increasing its production of stainless steel since 2009 and this whole aspect is multiplying the world consumption of ferrochrome.12 As per USGS, if all of the chromium in stainless steel comes from ferrochrome, one ton of ferrochrome would be required to produce 3 to 3.5 tons of stainless steel. However, since some chromium comes from recycled stainless steel scrap, the actual requirement of ferrochrome is little less.
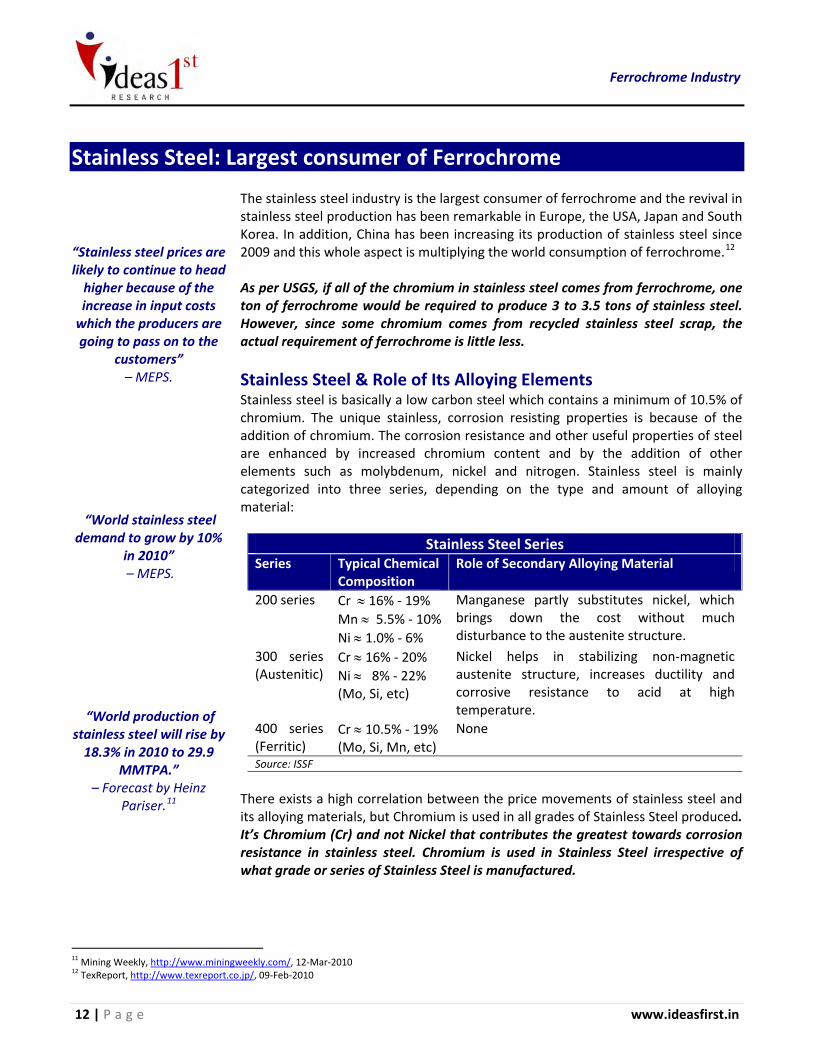
Stainless Steel & Role of Its Alloying Elements Stainless steel is basically a low carbon steel which contains a minimum of 10.5% of chromium. The unique stainless, corrosion resisting properties is because of the addition of chromium. The corrosion resistance and other useful properties of steel are enhanced by increased chromium content and by the addition of other elements such as molybdenum, nickel and nitrogen. Stainless steel is mainly categorized into three series, depending on the type and amount of alloying material:
Stainless Steel Series Series Typical Chemical
Composition Role of Secondary Alloying Material
200 series Cr ≈ 16% ‐ 19% Mn ≈ 5.5% ‐ 10% Ni ≈ 1.0% ‐ 6%
Manganese partly substitutes nickel, which brings down the cost without much disturbance to the austenite structure.
300 series (Austenitic)
Cr ≈ 16% ‐ 20% Ni ≈ 8% ‐ 22% (Mo, Si, etc)
Nickel helps in stabilizing non‐magnetic austenite structure, increases ductility and corrosive resistance to acid at high temperature.
400 series (Ferritic)
Cr ≈ 10.5% ‐ 19% (Mo, Si, Mn, etc)
None
Source: ISSF
There exists a high correlation between the price movements of stainless steel and its alloying materials, but Chromium is used in all grades of Stainless Steel produced. It’s Chromium (Cr) and not Nickel that contributes the greatest towards corrosion resistance in stainless steel. Chromium is used in Stainless Steel irrespective of what grade or series of Stainless Steel is manufactured.
11 Mining Weekly, http://www.miningweekly.com/, 12‐Mar‐2010 12 TexReport, http://www.texreport.co.jp/, 09‐Feb‐2010
Ferrochrome Industry
March 2010 13 | P a g e
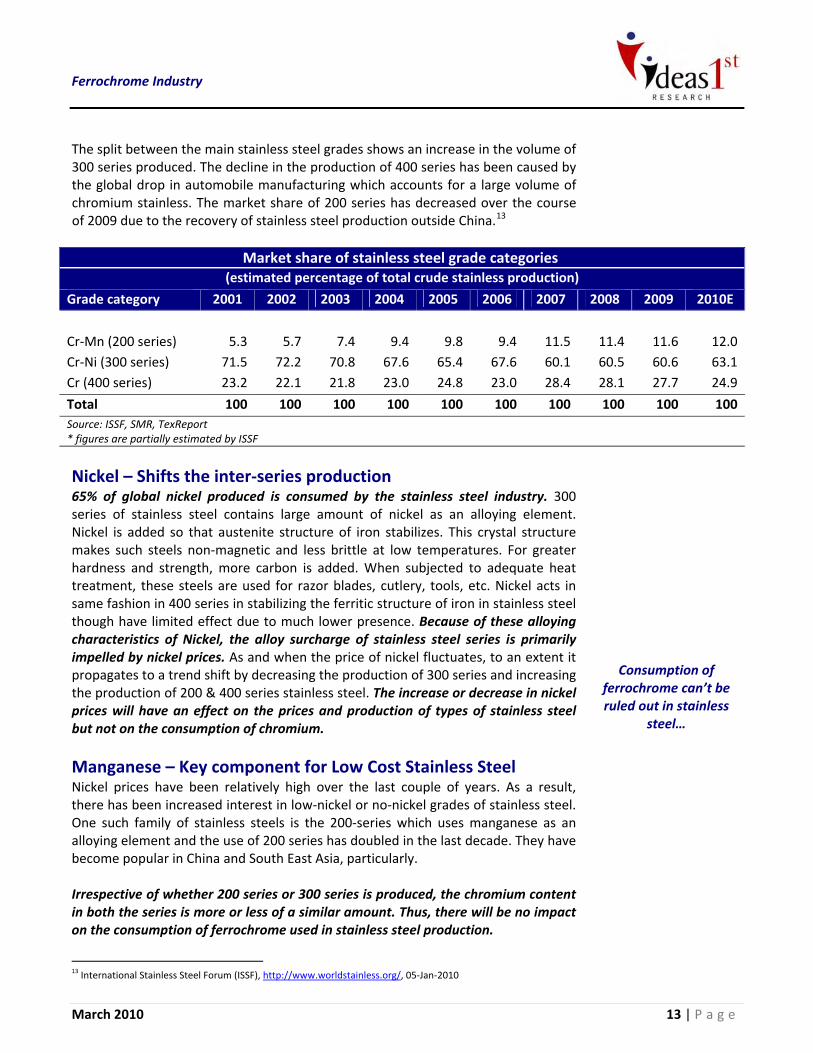
The split between the main stainless steel grades shows an increase in the volume of 300 series produced. The decline in the production of 400 series has been caused by the global drop in automobile manufacturing which accounts for a large volume of chromium stainless. The market share of 200 series has decreased over the course of 2009 due to the recovery of stainless steel production outside China.13
Market share of stainless steel grade categories
(estimated percentage of total crude stainless production)
Grade category 2001 2002 2003 2004 2005 2006 2007 2008 2009 2010E
Cr‐Mn (200 series) 5.3 5.7 7.4 9.4 9.8 9.4 11.5 11.4 11.6 12.0Cr‐Ni (300 series) 71.5 72.2 70.8 67.6 65.4 67.6 60.1 60.5 60.6 63.1Cr (400 series) 23.2 22.1 21.8 23.0 24.8 23.0 28.4 28.1 27.7 24.9
Total 100 100 100 100 100 100 100 100 100 100Source: ISSF, SMR, TexReport * figures are partially estimated by ISSF
Nickel – Shifts the inter‐series production 65% of global nickel produced is consumed by the stainless steel industry. 300 series of stainless steel contains large amount of nickel as an alloying element. Nickel is added so that austenite structure of iron stabilizes. This crystal structure makes such steels non‐magnetic and less brittle at low temperatures. For greater hardness and strength, more carbon is added. When subjected to adequate heat treatment, these steels are used for razor blades, cutlery, tools, etc. Nickel acts in same fashion in 400 series in stabilizing the ferritic structure of iron in stainless steel though have limited effect due to much lower presence. Because of these alloying characteristics of Nickel, the alloy surcharge of stainless steel series is primarily impelled by nickel prices. As and when the price of nickel fluctuates, to an extent it propagates to a trend shift by decreasing the production of 300 series and increasing the production of 200 & 400 series stainless steel. The increase or decrease in nickel prices will have an effect on the prices and production of types of stainless steel but not on the consumption of chromium.
Manganese – Key component for Low Cost Stainless Steel Nickel prices have been relatively high over the last couple of years. As a result, there has been increased interest in low‐nickel or no‐nickel grades of stainless steel. One such family of stainless steels is the 200‐series which uses manganese as an alloying element and the use of 200 series has doubled in the last decade. They have become popular in China and South East Asia, particularly. Irrespective of whether 200 series or 300 series is produced, the chromium content in both the series is more or less of a similar amount. Thus, there will be no impact on the consumption of ferrochrome used in stainless steel production.
Consumption of ferrochrome can’t be ruled out in stainless
steel…
13 International Stainless Steel Forum (ISSF), http://www.worldstainless.org/, 05‐Jan‐2010
Ferrochrome Industry
14 | P a g e www.ideasfirst.in
Triggers and Concerns
Power supply shortages have stung the South African ferrochrome
producers…
Power Shortage in South Africa Power is a key element in the production and conversion of chromium ore into ferrochrome. A shortage or inadequate supply of power hits the industry very badly. This is exactly what has happened in South Africa which is the largest producer of ferrochrome. The country which supplies about 40% to 45% of the world's ferrochrome, procures its electricity requirement from the state owned electricity firm Eskom. Eskom produces over 95% of the electricity consumed in South Africa. It has been supplying electricity at an average cost of 3 U.S. cents per kilowatt‐hour for the past financial year, compared with 8‐9 U.S. cents power cost in OECD countries.14 Eskom has a clear and unchallengeable mandate to increase power prices over the next three years. It has secured an agreement for rate hikes of 24.8% in 2010, 25.8% in 2011 and 25.9% in 2012. If compounded these rate hikes will double cost of power by 2013.15 According to Mr. Steve Phiri CEO of Merafe, “No major ferrochrome expansion is expected in South Africa for the next three years mainly due to power shortage.” Mr. Phiri said that the lack of expansion in South Africa was one of the factors underpinning the favorable outlook for the ferrochrome market, which was one of rising demand and tight supply. He added that "South Africa hosts more than 75% of the world’s chrome reserves. Any serious growth in supply has to come from South Africa." 16 Mr. Robert Yuskel Yildirim, President and CEO of Eti Krom Inc. commented, “The supply situation of electric power in South Africa is an anxious matter. In particular, the World Soccer Games is scheduled to be held by FIFA in June of 2010 at Cape Town of South Africa and, therefore, a possibility to reach once a peak of electric power consumption in that period is supposed to exist. The reduced supply of electric power will put a certain influence on production of ferrochrome in South Africa. The output of ferrochrome in that time has a possibility to be reduced by a scale of 300,000 tons.”17 As the largest producer, world ferrochrome prices in the short to medium term are more likely to be influenced by producers of the commodity in South Africa. Even at 6 cents per kilowatt‐hour (double the rates last year) South African producers will probably be on a par with negotiated rates at western smelters.
14 Metal Miner, http://agmetalminer.com/, 02‐Mar‐2010 15 ibid 16 ibid 17 TexReport, http://www.texreport.co.jp/, 26‐Feb‐2010
Ferrochrome Industry
March 2010 15 | P a g e
Their challenge will come from China, where although the cost of power is high they do have a precedent for subsidizing power costs when it suits them.18 To overcome the electricity shortage faced by South Africa, Eskom has planned two power projects named Medupi and Kusile. Medupi will comprise of 6 units totaling at 4788 MW of installed capacity. The first unit is scheduled to be commissioned in 2012, with the last unit scheduled for commissioning by 2015. On the other hand, Kusile will also comprise of 6 units giving total installed capacity of 4800 MW. The first unit is scheduled to be commissioned in 2014, with the last unit scheduled for commissioning by 2018.19 Eskom’s total existing capacity stands at 40,503 MW20 and it is amongst the top 10 utility providers in the world. Even then researchers indicate that Eskom’s power station building program has slowed in pace.21 This clearly highlights that there is no room for private players as Eskom being a government entity is facing a road block in providing the additional power facility to South Africa. Therefore the power supply scenario in South Africa seems bleak. The prevailing situation in South Africa has led to a squeezed supply against the rising global demand for ferrochrome. Thus, the ferrochrome prices could rise sharply in 2010 because of higher electricity costs in South Africa and increased production of stainless steel world over. A rise in stainless steel demand could snowball and result in massive ferrochrome re‐stocking.
Compelled to export Chrome ore Exports of raw ore from India to China were down 24.7% year‐on‐year in 2009, because of an export duty imposed by the Indian government to discourage ore exports. This is primarily because when chrome ore is smelted into ferrochrome, there is significant value upliftment and employment creation. The dynamics of exports shifted with this move of Indian ferrochrome industry and the exports to China were met by South Africa. But a similar situation has risen in South Africa where the exports of ore is reducing the edge South Africa has in production of ferrochrome. Therefore during 2008, out of the total 7.46 MMTPA of HCFeCr produced, South Africa accounted for 45% followed by China: 18%, making it an immediate competitor to South Africa.22
Eskom’s total existing capacity ‐ 40,503 MW, amongst the top 10
utility providers in the world.
China an immediate competitor to South
Africa…
18 Metal Miner, http://agmetalminer.com/, 02‐Mar‐2010 19 Eskom, http://www.eskom.co.za/ 20 Nominal capacity of 44,193 MW, http://www.eskom.co.za/ 21 Mining Weekly, http://www.miningweekly.com/, 12‐Mar‐2010 22 ICDA Chromium, http://www.icdachromium.com/
Ferrochrome Industry
16 | P a g e www.ideasfirst.in
China has achieved 18% of total ferrochrome production as it is importing more
than 40% of its chrome ore requirement from South Africa at a very low price, i.e. around USD 215/tonne CIF as compared to India which is receiving around USD 360/tonne CIF for a similar quantity of chrome ore. Thus South Africa is helping high‐cost Chinese ferrochrome producers, which may not otherwise survive, to compete.23 South Africa may export a greater volume of raw chrome ore due to its inability to beneficiate the ore because of insufficient electricity. Though ferrochrome producers are very bullish on the future demand, availability of power remains a key concern.
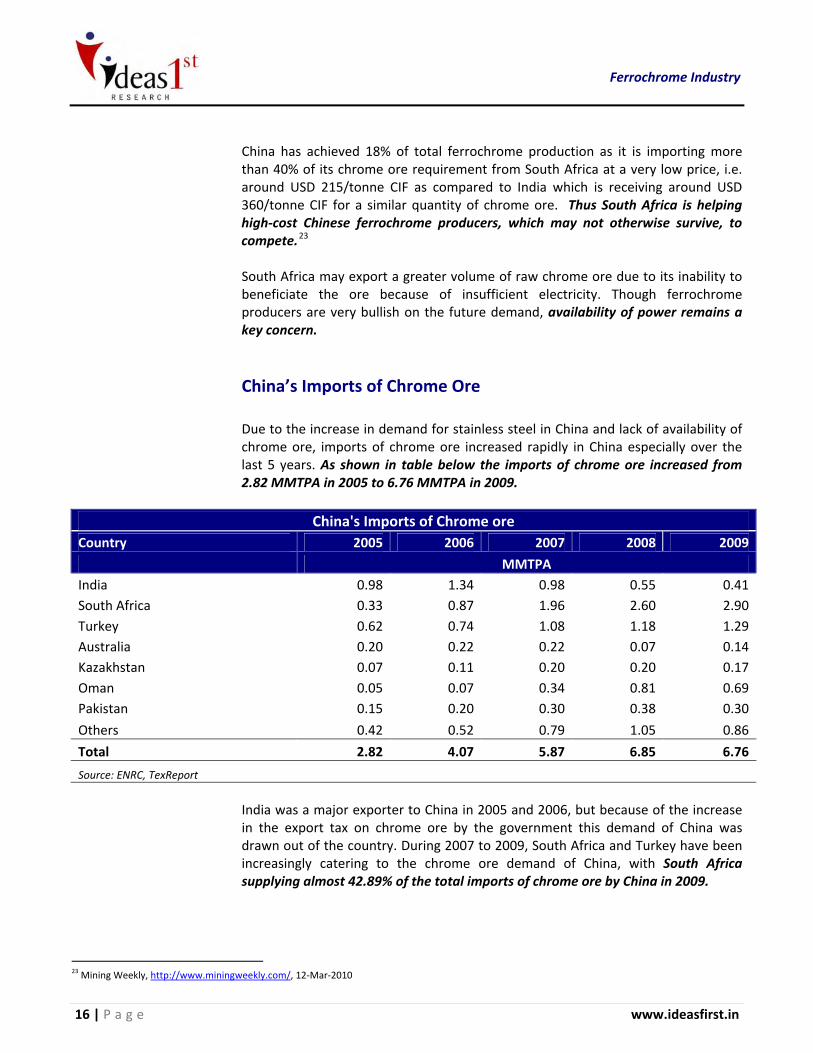
China’s Imports of Chrome Ore Due to the increase in demand for stainless steel in China and lack of availability of chrome ore, imports of chrome ore increased rapidly in China especially over the last 5 years. As shown in table below the imports of chrome ore increased from 2.82 MMTPA in 2005 to 6.76 MMTPA in 2009.
China's Imports of Chrome ore Country 2005 2006 2007 2008 2009
MMTPA India 0.98 1.34 0.98 0.55 0.41South Africa 0.33 0.87 1.96 2.60 2.90Turkey 0.62 0.74 1.08 1.18 1.29Australia 0.20 0.22 0.22 0.07 0.14Kazakhstan 0.07 0.11 0.20 0.20 0.17Oman 0.05 0.07 0.34 0.81 0.69Pakistan 0.15 0.20 0.30 0.38 0.30
Others 0.42 0.52 0.79 1.05 0.86
Total 2.82 4.07 5.87 6.85 6.76
Source: ENRC, TexReport
India was a major exporter to China in 2005 and 2006, but because of the increase
in the export tax on chrome ore by the government this demand of China was drawn out of the country. During 2007 to 2009, South Africa and Turkey have been increasingly catering to the chrome ore demand of China, with South Africa supplying almost 42.89% of the total imports of chrome ore by China in 2009.
23 Mining Weekly, http://www.miningweekly.com/, 12‐Mar‐2010
Ferrochrome Industry
March 2010 17 | P a g e
Tax Regime – To curb chrome ore export Stainless steel production reached record levels in China and India in the year 2008. Following this chromite ore and ferrochrome prices reached record levels that led to governments and businesses looking for ways to reduce prices and costs. Tariffs were scrutinized and changed in some places; however, in countries where chromite ore, ferrochrome, and stainless steel were produced and consumed, there were conflicting pressures. Chromite ore producers wanted to export more ore, while ferrochromium producers wanted to limit chromite ore exports to secure their source of ore. As a result, ferrochromium producers promoted chromite ore export taxes and quotas that chromite ore producers sought to reduce. Stainless steel producers promoted reduced import duties on ferrochromium, while promoting increased import duties on stainless steel mill products.24 The Government of Kazakhstan, South Africa and India has imposed export tax on chrome ore and plan to increase the same to curb the export of chrome ore without much value addition. Thus imposition of tax; higher on exports and lower on imports by various countries, will protect the interest of the local producers and increase the cost of exports generating revenues for various countries.
Rand – Dollar Exchange While South Africa’s exports have become increasingly diversified over time, commodities continue to be a major contributor to export earnings. Changes in commodity prices accordingly have a significant impact on the foreign‐exchange value of the Rand (ZAR), not only through the resultant changes in the supply of foreign currency flowing into the market but also more immediately through expectations based on the observed spot prices of commodities. South Africa is the largest exporter of Platinum and the second largest exporter of Gold. For much of 2009, the Rand has been the world’s best performing currency, largely due to strong rallies in Gold & Platinum. As the outlook for Platinum and Gold remains favourable along with the structural weaknesses in the USD which feeds directly into the strength in precious metals, it seems that the Rand will continue to remain strong in short‐to‐medium term. Besides the Rand is also a high‐yield currency, currently paying 7.0% interest. The average South African Rand exchange rate is a potentially significant factor in the price of chrome ore and ferrochrome because South Africa has been a leading producer of these materials.
Taxes to curb the export of chrome ore
without much value addition.
24 USGS, http://www.usgs.gov/
Ferrochrome Industry
18 | P a g e www.ideasfirst.in
ENRC is the only totally vertically integrated producer in the world.
Coking coal – Used as a reductant, majorly influenced by
steel industry dynamics.
Kazakhstan – Gains Muscle Kazakhstan’s cash–rich ferrochrome producer ENRC, which is the largest HCFeCr producer in the world (by chrome content) with the highest grade of ferrochrome, has signaled its desire to expand outside the country. ENRC provides the widest range of products including special ferroalloy grades and is positioned to realize premium pricing from a diversified customer base all over the world. Moreover, it’s the lowest cost producer in the world giving competitors an experience of rising costs. The company is positioned to benefit from South African power capacity constraint. ENRC is the only totally vertically integrated producer in the world and has a location advantage to access the growing demand from the Chinese market. ENRC has already started investments oversees with one of its purchase being of 50% interest in Xinjiang Tuoli Taihang Ferro‐Alloy Co. (China) for $15 million. Touli had a ferrochromium production capacity of 0.12 MMTPA. Some replacement ferrochrome capacity is scheduled to come on stream in Kazakhstan, but that will serve only to ensure that the supply side does not slide.25 Thus, the low cost ferrochrome producing country along with location advantage and cushioned with funds tends to gain dominance in the ferrochrome industry which is capital intensive industry driven by stainless steel demand.
Coking Coal Prices – On a rising trend Ferrochrome production requires a particular grade of coking coal (low ash and low phosphorus) as a reductant, which makes coking coal availability a cause of concern for producers. Moreover, coking coal markets are not regulated and therefore over supply or shortages may break out anytime resulting in an enormous price fluctuation. In addition, prices of coking coal are majorly influenced by the steel industry dynamics. South Africa and Kazakhstan have enough supplies of coking coal, whereas India and China are dependent on imports as the grade of coking coal available in these two countries have a high content of ash and phosphorous which does not suffice ferrochrome production. Also, China, the world's biggest coal miner, changed into a net importer of coal during 2009.
25 Mining Weekly, http://www.miningweekly.com/, 12‐Mar‐2010
Ferrochrome Industry
March 2010 19 | P a g e
BHP Billiton, the world's biggest producer of seaborne coking coal, has announced that it has settled quarterly contracts "with a range of steel producing customers throughout Europe, China, India and Japan", without confirming numbers, but probably around USD 200 a tonne, 55% higher than prevailing contract rates applicable to 31 March 2010.26 BHP Billiton had offered two options for coking coal contracts – annual contract at USD 250/tonne (previous year USD129) and quarterly contract at USD 200/tonne to a Japanese mill, wherein they selected the latter contract option.27 Ferrochrome producers have a hard time struggling to procure the required grade of coking coal to produce ferrochrome. Over the past few years, 50%‐60% of the coking coal requirement is being met through long‐term contracts and rest on spot basis. Low ash and low phosphorus grade of coking coal comes with a premium, which makes it difficult for the ferrochrome producers to have an edge in price negotiation of coking coal. This clearly states that going forward the price of coking coal will have an impact on ferrochrome production and ferrochrome prices.
Stainless Steel Scrap Stainless steel scrap is an important additional source of chromium to the stainless steel industry. Stainless steel scraps recycling accounts for a significant, but undocumented, fraction of world stainless steel production.28 Basically Chromium is used and not consumed for alloying with steel to make it stainless. Thus, it is a matter of time, though pretty long, before this material comes back for almost 100% recycling. An important fact about stainless steel is that its life ranges between 30 to 50 years which might give hiccups in the availability of stainless steel scrap from time to time. Though Chromium is an important alloying element the prices of stainless steel scrap are directly linked to the percentage of Nickel content in the scrap and the then current price of Nickel. U.S. is the largest exporter and China is the largest importer of stainless steel scrap. Adding 5%‐15% of scrap is an integral part of stainless steel manufacturing but due to constraint in availability and quality, the industry is deferring usage of stainless steel scrap only till virgin chrome is available and Nickel prices are affordable.
Scrap is an integral part of stainless steel manufacturing…
26 Proactive Investors, http://www.proactiveinvestors.com.au/ , 09‐Mar‐2010 27 Business Standard, http://www.business‐standard.com/, 17‐Mar‐2010 28 USGS, http://www.usgs.gov/
Ferrochrome Industry
20 | P a g e www.ideasfirst.in
China to dominate Stainless Steel Industry
China produced 11 MMTPA of stainless steel in 2009, up 30% from 2008. By 2015, Chinese melt capacity is expected to reach 21.7 MMTPA which is 50% higher than 14.5 MMTPA achieved in 2009. Conservatively, Chinese melt production could rise between 16 to 18 MMTPA by 2015 (+5 to +7 MMTPA compared to 2009). With this capacity, theoretically China would be producing 55% of the world’s stainless steel. To meet the forecast numbers, China needs to import heavily. Almost 4.5 to 9 MMTPA of chrome ore or 1.5 to 2.5 MMTPA of ferrochrome needs to import by China every year. This is because its resources are not enough to cater to such a huge demand of raw material required to produce stainless steel. Thus, China’s growing consumption of stainless steel will definitely drive the demand for chrome ore and ferrochrome.
Ferrochrome Industry
March 2010 21 | P a g e
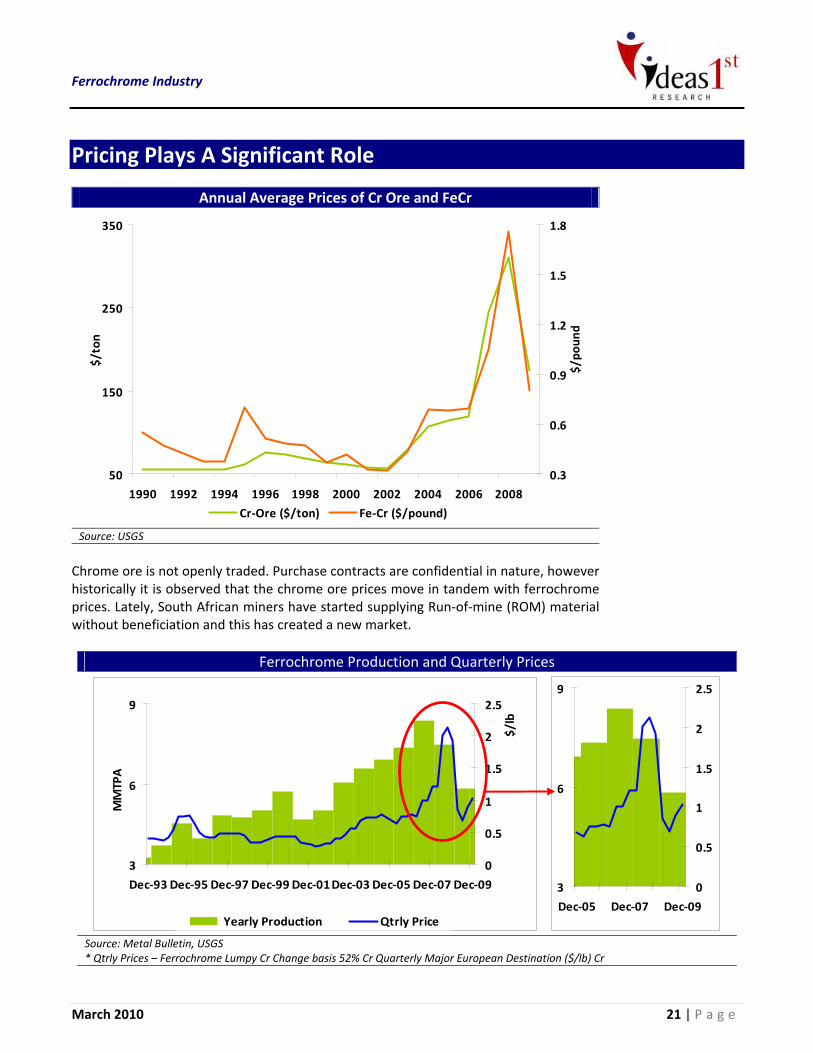
Pricing Plays A Significant Role
Annual Average Prices of Cr Ore and FeCr
50
150
250
350
1990 1992 1994 1996 1998 2000 2002 2004 2006 2008
$/ton
0.3
0.6
0.9
1.2
1.5
1.8
$/po
und
Cr‐Ore ($/ton) Fe‐Cr ($/pound)
Source: USGS
Chrome ore is not openly traded. Purchase contracts are confidential in nature, however historically it is observed that the chrome ore prices move in tandem with ferrochrome prices. Lately, South African miners have started supplying Run‐of‐mine (ROM) material without beneficiation and this has created a new market.
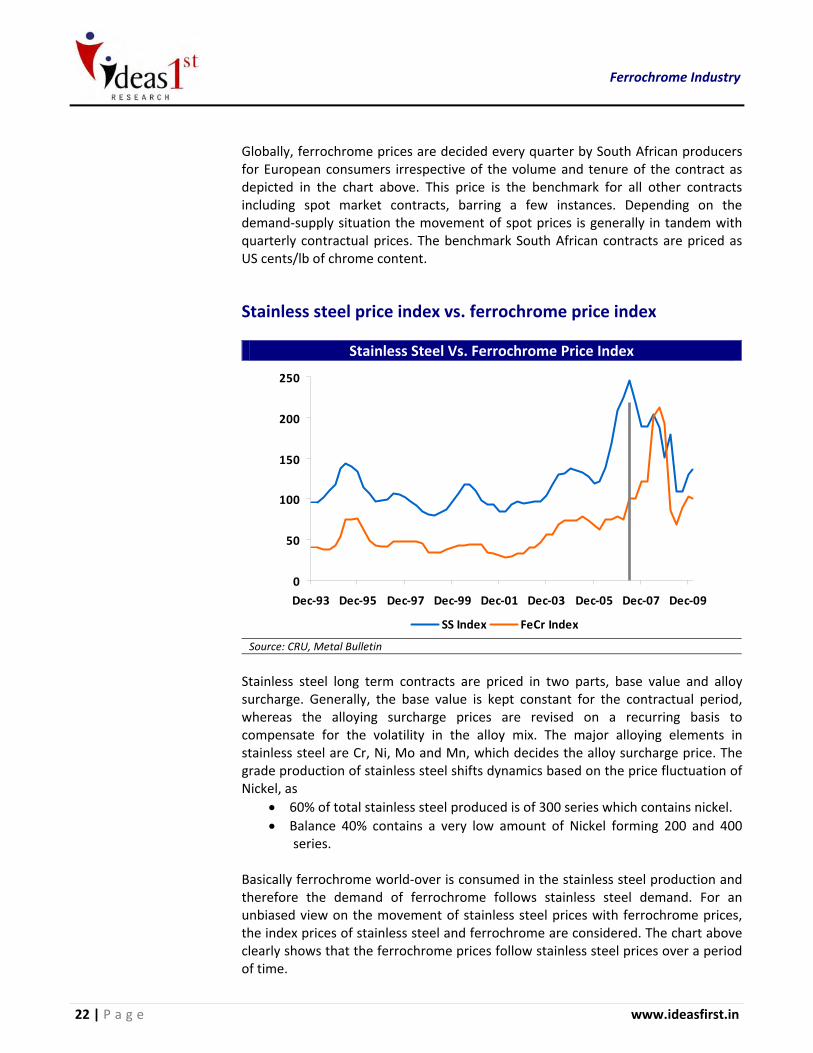
Ferrochrome Production and Quarterly Prices
Source: Metal Bulletin, USGS * Qtrly Prices – Ferrochrome Lumpy Cr Change basis 52% Cr Quarterly Major European Destination ($/lb) Cr
3
6
9
Dec‐93 Dec‐95 Dec‐97 Dec‐99 Dec‐01Dec‐03 Dec‐05 Dec‐07 Dec‐09
MMTPA
0
0.5
1
1.5
2
2.5
$/lb
Yearly Production Qtrly Price
3
6
9
Dec‐05 Dec‐07 Dec‐09
0
0.5
1
1.5
2
2.5
Ferrochrome Industry
22 | P a g e www.ideasfirst.in
Globally, ferrochrome prices are decided every quarter by South African producers
for European consumers irrespective of the volume and tenure of the contract as depicted in the chart above. This price is the benchmark for all other contracts including spot market contracts, barring a few instances. Depending on the demand‐supply situation the movement of spot prices is generally in tandem with quarterly contractual prices. The benchmark South African contracts are priced as US cents/lb of chrome content.
Stainless steel price index vs. ferrochrome price index
Stainless Steel Vs. Ferrochrome Price Index
0
50
Dec‐93 Dec‐95 Dec‐97 Dec‐99 Dec‐01 Dec‐03 Dec‐05 Dec‐07 Dec‐09
100
150
200
250
SS Index FeCr Index
Source: CRU, Metal Bulletin
Stainless steel long term contracts are priced in two parts, base value and alloy surcharge. Generally, the base value is kept constant for the contractual period, whereas the alloying surcharge prices are revised on a recurring basis to compensate for the volatility in the alloy mix. The major alloying elements in stainless steel are Cr, Ni, Mo and Mn, which decides the alloy surcharge price. The grade production of stainless steel shifts dynamics based on the price fluctuation of Nickel, as
• 60% of total stainless steel produced is of 300 series which contains nickel. • Balance 40% contains a very low amount of Nickel forming 200 and 400
series. Basically ferrochrome world‐over is consumed in the stainless steel production and therefore the demand of ferrochrome follows stainless steel demand. For an unbiased view on the movement of stainless steel prices with ferrochrome prices, the index prices of stainless steel and ferrochrome are considered. The chart above clearly shows that the ferrochrome prices follow stainless steel prices over a period of time.
Ferrochrome Industry
March 2010 23 | P a g e
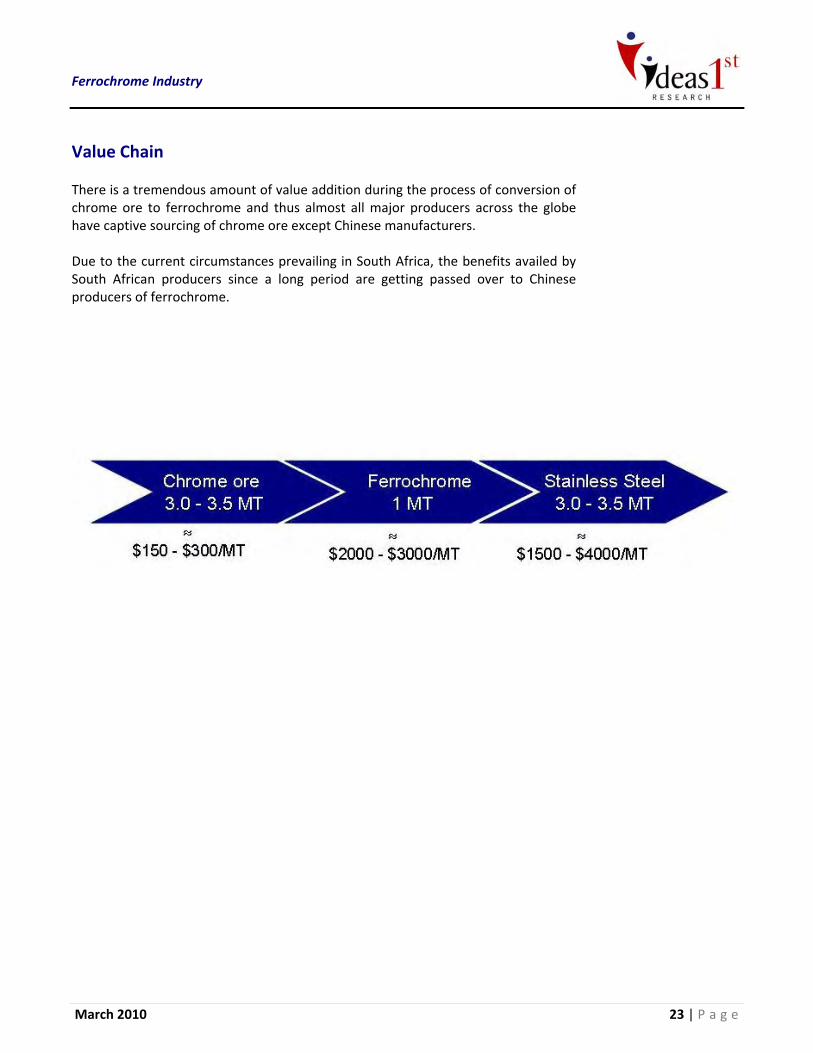
Value Chain There is a tremendous amount of value addition during the process of conversion of chrome ore to ferrochrome and thus almost all major producers across the globe have captive sourcing of chrome ore except Chinese manufacturers. Due to the current circumstances prevailing in South Africa, the benefits availed by South African producers since a long period are getting passed over to Chinese producers of ferrochrome.
Ferrochrome Industry
24 | P a g e www.ideasfirst.in
Outlook
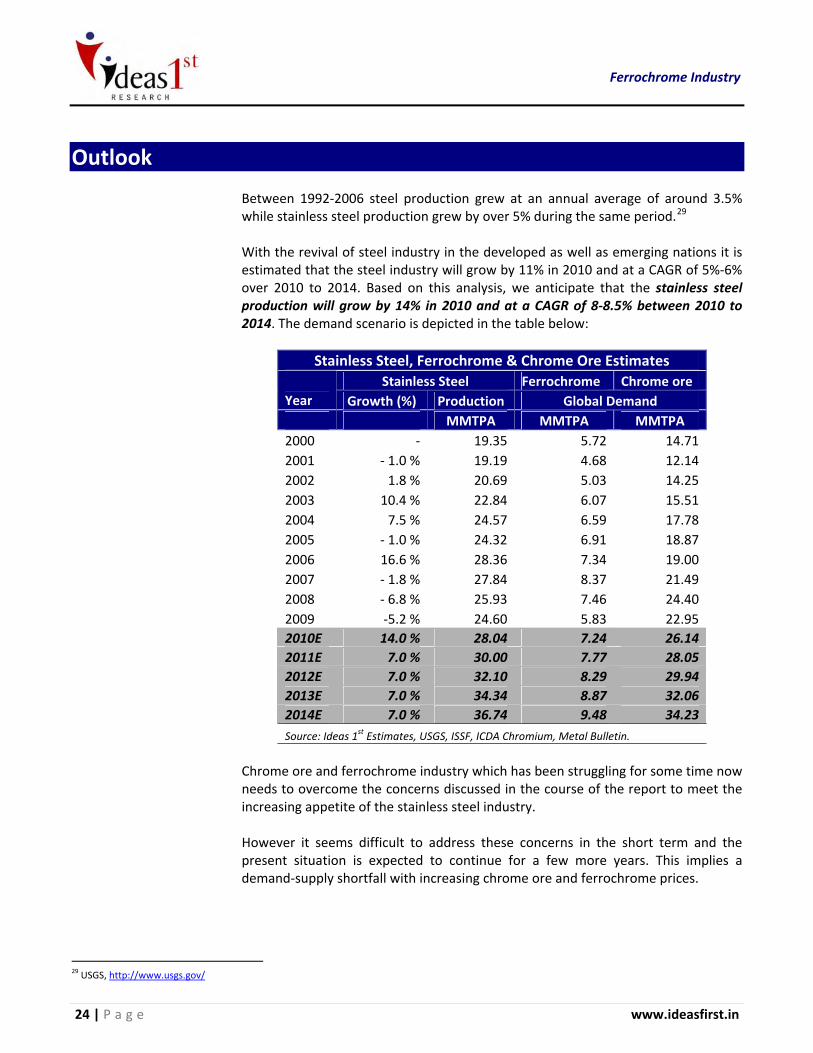
Between 1992‐2006 steel production grew at an annual average of around 3.5% while stainless steel production grew by over 5% during the same period.29 With the revival of steel industry in the developed as well as emerging nations it is estimated that the steel industry will grow by 11% in 2010 and at a CAGR of 5%‐6% over 2010 to 2014. Based on this analysis, we anticipate that the stainless steel production will grow by 14% in 2010 and at a CAGR of 8‐8.5% between 2010 to 2014. The demand scenario is depicted in the table below:
Stainless Steel, Ferrochrome & Chrome Ore Estimates Stainless Steel Ferrochrome Chrome ore
Year Growth (%) Production Global Demand MMTPA MMTPA MMTPA 2000 ‐ 19.35 5.72 14.712001 ‐ 1.0 % 19.19 4.68 12.142002 1.8 % 20.69 5.03 14.252003 10.4 % 22.84 6.07 15.512004 7.5 % 24.57 6.59 17.782005 ‐ 1.0 % 24.32 6.91 18.872006 16.6 % 28.36 7.34 19.002007 ‐ 1.8 % 27.84 8.37 21.492008 ‐ 6.8 % 25.93 7.46 24.402009 ‐5.2 % 24.60 5.83 22.952010E 14.0 % 28.04 7.24 26.14 2011E 7.0 % 30.00 7.77 28.05 2012E 7.0 % 32.10 8.29 29.94 2013E 7.0 % 34.34 8.87 32.06 2014E 7.0 % 36.74 9.48 34.23 Source: Ideas 1st Estimates, USGS, ISSF, ICDA Chromium, Metal Bulletin.
Chrome ore and ferrochrome industry which has been struggling for some time now needs to overcome the concerns discussed in the course of the report to meet the increasing appetite of the stainless steel industry. However it seems difficult to address these concerns in the short term and the present situation is expected to continue for a few more years. This implies a demand‐supply shortfall with increasing chrome ore and ferrochrome prices.
29 USGS, http://www.usgs.gov/
Ferrochrome Industry
March 2010 25 | P a g e
Observations • Demand for chrome ore has been expanding by some 5% annually over past decade
while chrome ore output was marginally lower at an average of 4.6% per annum.
Thus, new chrome ore resources need to be explored.
• Depletion of chrome ore grades will drive exploration of mines attracting cross‐
border investments .
• Backward integration is required to overcome the shortage of power throughout
the industrial chain of chrome ore, ferrochrome and stainless steel.
• South Africa is caught in a tight spot because of shortage of power, which is
compelling i t to increase ROM chrome ore exports instead of beneficiated chrome
ore and ferrochrome.
• Toughened export tax regime in South Africa, China and India to increase chrome
ore and ferrochrome prices.
• Kazakhstan holds a strong position as compared to other countries as i t has cash
r ich ferrochrome producers who have vertical ly integrated plants though i t holds
only 5% of world chrome ore resources.
• Geopolit ical situation:
Producers: South Africa, Kazakhstan and India
Consumers: China, Europe, U.S. and Asia
• Non availabil ity of low‐ash low‐phosphorus coking coal prices is l ikely to create
some strain for China and India.
• Need for process innovation to directly manufacture stainless steel from chrome
ore/ l iquid chrome .
• Dynamics of ferrochrome will mainly depend on stainless steel trend which will
mainly be driven by growing dominance of China’s stainless steel industry .
• Avenue for Mergers and Acquisition leading to further consolidation of the
business helping players to gain influence globally.
Ferrochrome Industry
26 | P a g e www.ideasfirst.in
• Augmentation of power supply in South Africa might change the dynamics of
chrome and ferrochrome industry post 2012.
• Substitute for Chromium – None.
Ferrochrome Industry
March 2010 27 | P a g e
Conclusions Chromium market is highly consolidated and is represented by a few miners and
producers in South Africa and Kazakhstan. This makes i t possible to cut down supply
whenever there is a reduction in stainless steel production to curb the downfall in
prices. The chrome ore and ferrochrome industry is struggling hard to meet the
demand emanating from the stainless steel producers particularly from China.
Considering the various triggers and concerns as discussed in the report, it seems
that shortage of chrome ore and ferrochrome may last for many years; probably ti l l
2013 and the industry will be subject to wild price f luctuations. Overcoming the
concerns will bring new dimensions and way forth for the chrome ore and
ferrochrome producers and will also keep a balance in the demand supply situation.
Ferrochrome companies who have already integrated backwards into chrome ore
mines and power plants have an edge to “Outperform” for a long period keeping the
existing scenario in view.
Country specific advantage matrix is listed in Annexure –I.
Publicly l isted ferrochrome producers are l isted in Annexure – I I .
Ferrochrome Industry
28 | P a g e www.ideasfirst.in
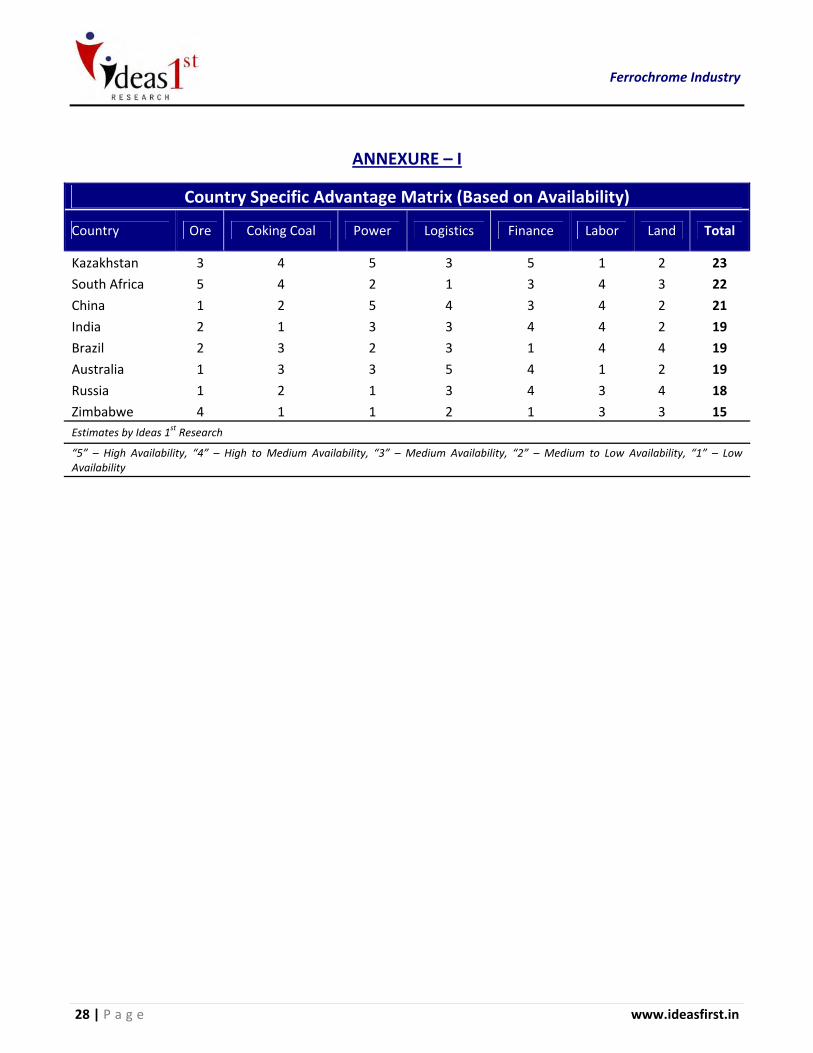
ANNEXURE – I
Country Specific Advantage Matrix (Based on Availability)
Country Ore Coking Coal Power Logistics Finance Labor Land Total
Kazakhstan 3 4 5 3 5 1 2 23
South Africa 5 4 2 1 3 4 3 22
China 1 2 5 4 3 4 2 21
India 2 1 3 3 4 4 2 19
Brazil 2 3 2 3 1 4 4 19
Australia 1 3 3 5 4 1 2 19
Russia 1 2 1 3 4 3 4 18
Zimbabwe 4 1 1 2 1 3 3 15 Estimates by Ideas 1st Research
“5” – High Availability, “4” – High to Medium Availability, “3” – Medium Availability, “2” – Medium to Low Availability, “1” – Low Availability
Ferrochrome Industry
March 2010 29 | P a g e
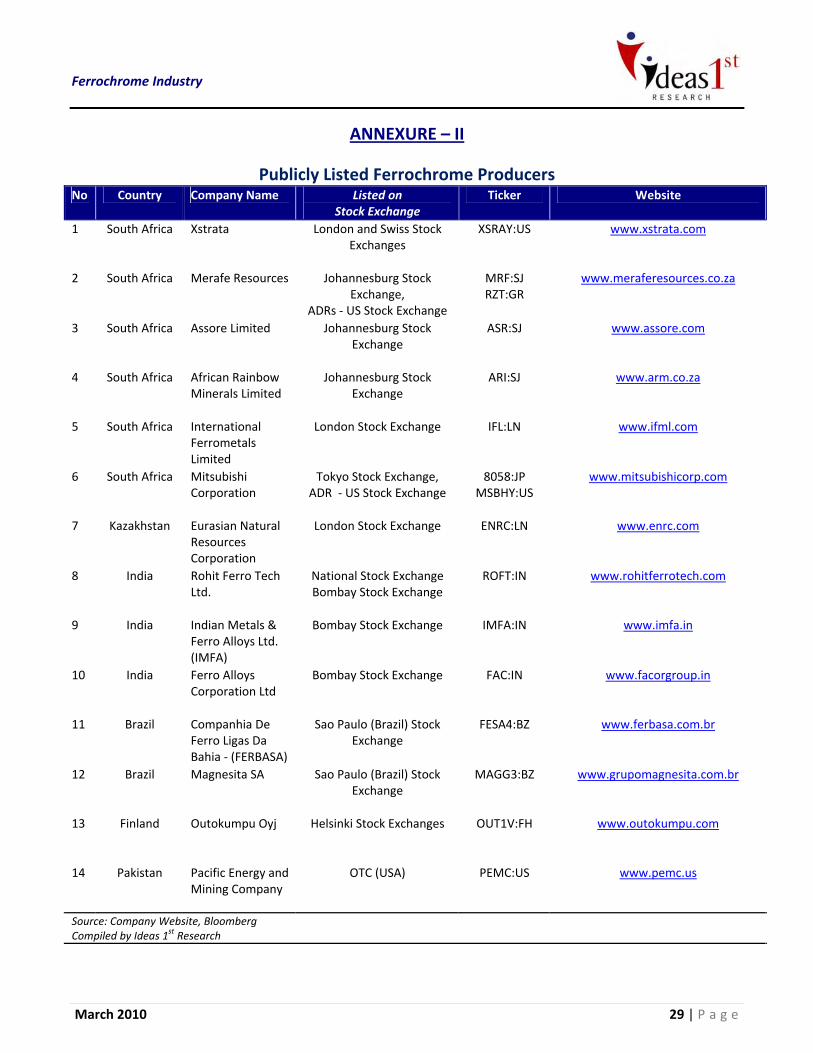
ANNEXURE – II
Publicly Listed Ferrochrome Producers No Country Company Name Listed on
Stock Exchange Ticker Website
1 South Africa Xstrata London and Swiss Stock Exchanges
XSRAY:US www.xstrata.com
2 South Africa Merafe Resources Johannesburg Stock Exchange,
ADRs ‐ US Stock Exchange
MRF:SJ RZT:GR
www.meraferesources.co.za
3 South Africa Assore Limited Johannesburg Stock Exchange
ASR:SJ www.assore.com
4 South Africa African Rainbow Minerals Limited
Johannesburg Stock Exchange
ARI:SJ www.arm.co.za
5 South Africa International Ferrometals Limited
London Stock Exchange IFL:LN www.ifml.com
6 South Africa Mitsubishi Corporation
Tokyo Stock Exchange, ADR ‐ US Stock Exchange
8058:JP MSBHY:US
www.mitsubishicorp.com
7 Kazakhstan Eurasian Natural Resources Corporation
London Stock Exchange ENRC:LN www.enrc.com
8 India Rohit Ferro Tech Ltd.
National Stock Exchange Bombay Stock Exchange
ROFT:IN www.rohitferrotech.com
9 India Indian Metals & Ferro Alloys Ltd. (IMFA)
Bombay Stock Exchange IMFA:IN www.imfa.in
10 India Ferro Alloys Corporation Ltd
Bombay Stock Exchange FAC:IN www.facorgroup.in
11 Brazil Companhia De Ferro Ligas Da Bahia ‐ (FERBASA)
Sao Paulo (Brazil) Stock Exchange
FESA4:BZ www.ferbasa.com.br
12 Brazil Magnesita SA Sao Paulo (Brazil) Stock Exchange
MAGG3:BZ www.grupomagnesita.com.br
13 Finland Outokumpu Oyj Helsinki Stock Exchanges OUT1V:FH www.outokumpu.com
14 Pakistan Pacific Energy and Mining Company
OTC (USA) PEMC:US www.pemc.us
Source: Company Website, Bloomberg Compiled by Ideas 1st Research
Ferrochrome Industry
30 | P a g e www.ideasfirst.in
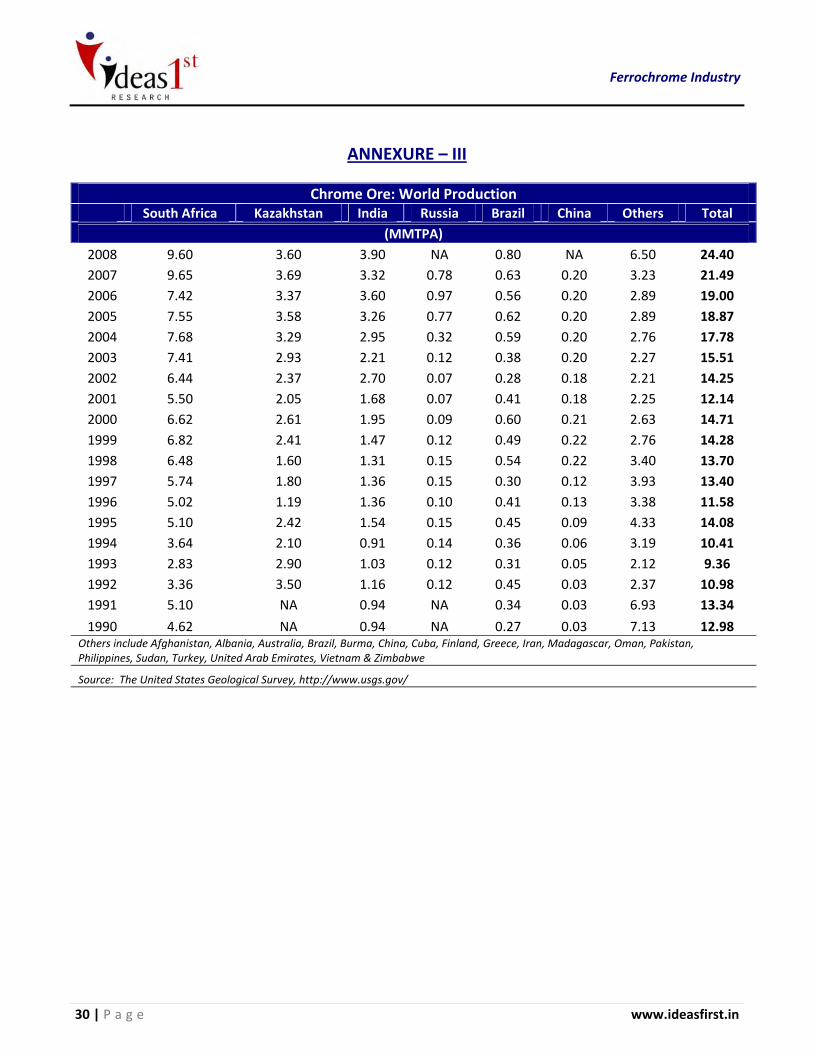
ANNEXURE – III
Chrome Ore: World Production South Africa Kazakhstan India Russia Brazil China Others Total
(MMTPA) 2008 9.60 3.60 3.90 NA 0.80 NA 6.50 24.40 2007 9.65 3.69 3.32 0.78 0.63 0.20 3.23 21.49 2006 7.42 3.37 3.60 0.97 0.56 0.20 2.89 19.00 2005 7.55 3.58 3.26 0.77 0.62 0.20 2.89 18.87 2004 7.68 3.29 2.95 0.32 0.59 0.20 2.76 17.78 2003 7.41 2.93 2.21 0.12 0.38 0.20 2.27 15.51 2002 6.44 2.37 2.70 0.07 0.28 0.18 2.21 14.25 2001 5.50 2.05 1.68 0.07 0.41 0.18 2.25 12.14 2000 6.62 2.61 1.95 0.09 0.60 0.21 2.63 14.71 1999 6.82 2.41 1.47 0.12 0.49 0.22 2.76 14.28 1998 6.48 1.60 1.31 0.15 0.54 0.22 3.40 13.70 1997 5.74 1.80 1.36 0.15 0.30 0.12 3.93 13.40 1996 5.02 1.19 1.36 0.10 0.41 0.13 3.38 11.58 1995 5.10 2.42 1.54 0.15 0.45 0.09 4.33 14.08 1994 3.64 2.10 0.91 0.14 0.36 0.06 3.19 10.41 1993 2.83 2.90 1.03 0.12 0.31 0.05 2.12 9.36 1992 3.36 3.50 1.16 0.12 0.45 0.03 2.37 10.98 1991 5.10 NA 0.94 NA 0.34 0.03 6.93 13.34
1990 4.62 NA 0.94 NA 0.27 0.03 7.13 12.98 Others include Afghanistan, Albania, Australia, Brazil, Burma, China, Cuba, Finland, Greece, Iran, Madagascar, Oman, Pakistan, Philippines, Sudan, Turkey, United Arab Emirates, Vietnam & Zimbabwe
Source: The United States Geological Survey, http://www.usgs.gov/
Ferrochrome Industry
March 2010 31 | P a g e
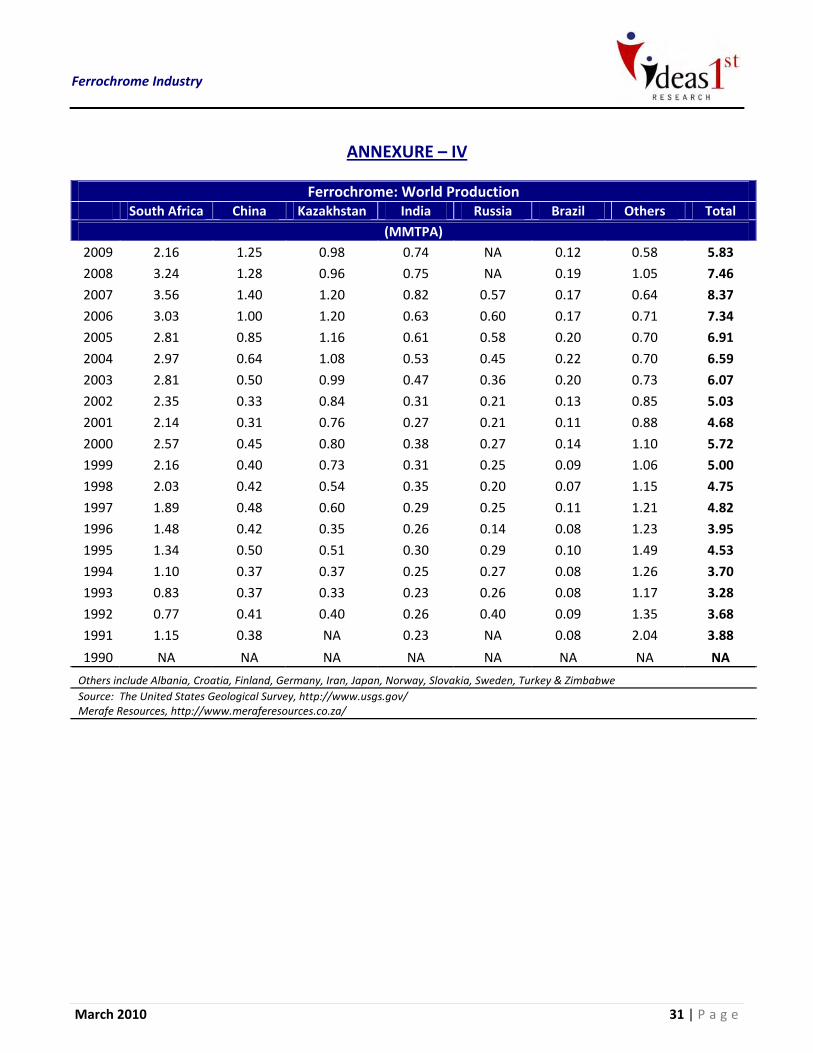
ANNEXURE – IV
Ferrochrome: World Production South Africa China Kazakhstan India Russia Brazil Others Total
(MMTPA) 2009 2.16 1.25 0.98 0.74 NA 0.12 0.58 5.83
2008 3.24 1.28 0.96 0.75 NA 0.19 1.05 7.46
2007 3.56 1.40 1.20 0.82 0.57 0.17 0.64 8.37
2006 3.03 1.00 1.20 0.63 0.60 0.17 0.71 7.34
2005 2.81 0.85 1.16 0.61 0.58 0.20 0.70 6.91
2004 2.97 0.64 1.08 0.53 0.45 0.22 0.70 6.59
2003 2.81 0.50 0.99 0.47 0.36 0.20 0.73 6.07
2002 2.35 0.33 0.84 0.31 0.21 0.13 0.85 5.03
2001 2.14 0.31 0.76 0.27 0.21 0.11 0.88 4.68
2000 2.57 0.45 0.80 0.38 0.27 0.14 1.10 5.72
1999 2.16 0.40 0.73 0.31 0.25 0.09 1.06 5.00
1998 2.03 0.42 0.54 0.35 0.20 0.07 1.15 4.75
1997 1.89 0.48 0.60 0.29 0.25 0.11 1.21 4.82
1996 1.48 0.42 0.35 0.26 0.14 0.08 1.23 3.95
1995 1.34 0.50 0.51 0.30 0.29 0.10 1.49 4.53
1994 1.10 0.37 0.37 0.25 0.27 0.08 1.26 3.70
1993 0.83 0.37 0.33 0.23 0.26 0.08 1.17 3.28
1992 0.77 0.41 0.40 0.26 0.40 0.09 1.35 3.68
1991 1.15 0.38 NA 0.23 NA 0.08 2.04 3.88
1990 NA NA NA NA NA NA NA NA
Others include Albania, Croatia, Finland, Germany, Iran, Japan, Norway, Slovakia, Sweden, Turkey & Zimbabwe Source: The United States Geological Survey, http://www.usgs.gov/ Merafe Resources, http://www.meraferesources.co.za/
Ferrochrome Industry
32 | P a g e www.ideasfirst.in
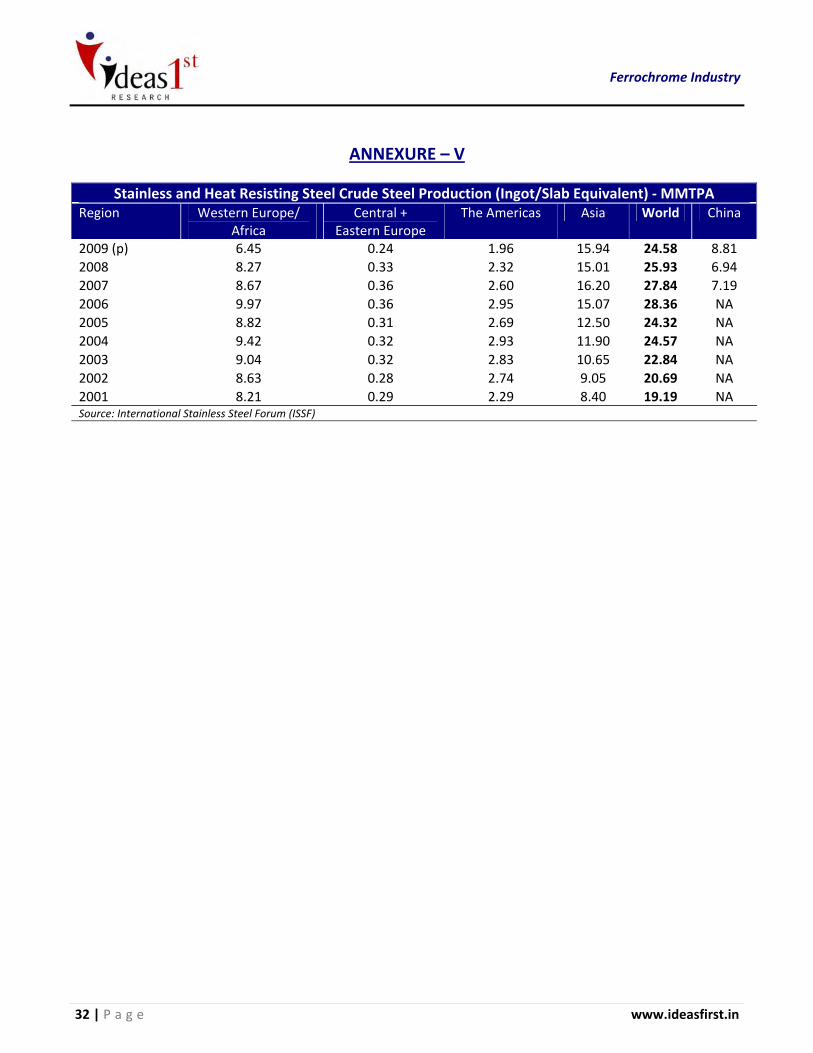
ANNEXURE – V
Stainless and Heat Resisting Steel Crude Steel Production (Ingot/Slab Equivalent) ‐ MMTPA Region Western Europe/
Africa Central +
Eastern Europe The Americas Asia World China
2009 (p) 6.45 0.24 1.96 15.94 24.58 8.81 2008 8.27 0.33 2.32 15.01 25.93 6.94 2007 8.67 0.36 2.60 16.20 27.84 7.19 2006 9.97 0.36 2.95 15.07 28.36 NA 2005 8.82 0.31 2.69 12.50 24.32 NA 2004 9.42 0.32 2.93 11.90 24.57 NA 2003 9.04 0.32 2.83 10.65 22.84 NA 2002 8.63 0.28 2.74 9.05 20.69 NA 2001 8.21 0.29 2.29 8.40 19.19 NA Source: International Stainless Steel Forum (ISSF)
March 2010 33 | P a g e
PAGE LEFT BLANK INTENTIONALLY
Disclaimer Ideas 1 s t Research i s a reg i s tered t rademark of I deas 1 s t In fo rmat ion Serv i ces Pr i va te L imi ted . Ideas 1s t In format ion Serv i ces Pr ivate L imi ted i s ne i ther author i zed nor regu lated by the F inanc ia l Serv i ces Author i ty . Th i s document i s not for pub l i c d i s t r ibut ion and has been fu rn i shed to you so le l y for your i n format ion and must not be reproduced or red i s t r i buted to any other person . Persons i n to whose possess ion th i s document may come are requ i red to observe these res t r i c t ions . Th i s mater ia l i s for the persona l i n format ion of the author i zed rec ip ien t , and we are not so l i c i t ing any act ion based upon i t . Th i s repor t i s not to be const rued as an of fer to se l l or the so l i c i t a t ion of an of fer to buy any secur i t y i n any j u r i sd i c t ion where such an of fer or so l i c i ta t ion wou ld be i l l ega l . I t i s fo r the genera l i n format ion of c l ients of Ideas 1 s t In format ion Serv i ces Pvt . L td . I t does not const i tu te a persona l recommendat ion or t ake i n to account the par t i cu lar i nves tment ob ject ives , f inanc ia l s i tuat ions , or needs of i nd i v idua l c l ients . We have rev iewed the repor t , and i n so fa r as i t i nc ludes cur rent or h i s tor i ca l i n format ion , i t i s be l ieved to be re l i ab le though i t s accuracy or completeness cannot be guaranteed . Nei ther Ideas 1s t In format ion Serv i ces Pvt . L td . , nor any person connected with i t , accepts any l i ab i l i t y ar i s ing f rom the use of th i s document . The rec ip ients of th i s mater i a l shou ld re ly on the i r own i nves t iga t ions and take the i r own profess iona l adv ice . Pr i ce and va lue of the i nves tments re fe r red to i n th i s mater ia l may go up or down. Past per formance i s not a gu ide for fu ture per formance . Cer ta in t ransact ions ‐ i n c lud ing those i nvo l v ing fu tures , opt ions and other der i va t ives as wel l as non ‐ i nves tment grade secur i t ies ‐ i nvo l ve substant ia l r i sk and are not su i t ab le for a l l i nves tors . Reports based on techn i ca l ana l ys i s centers on s tudy ing char t s of a s tock ' s pr i ce movement and t rad ing vo lume , as opposed to focus ing on a company 's fundamenta l s and as such , may not match with a repor t on a company ' s fundamenta l s . Opin ions expressed are our cur rent op in ions as of the date appear ing on th i s mater ia l on ly . Whi le we endeavor to update on a reasonab le bas i s the i n format ion d i s cussed i n th i s mater ia l , there may be regu latory , compl iance , or other reasons that prevent us f rom do ing so . Prospect i ve i nves tors and others are caut ioned that any fo rward ‐l ook ing s ta tements are not pred ic t ions and may be sub jec t to change without not i ce . Our propr ie tary t rad ing and i nves tment bus inesses may make i nves tment dec i s ions that are i ncons i s tent with the recommendat ions expressed here in . We and our af f i l i a tes , of f i cer s , d i rec tors , and employees wor ld wide may: ( a ) f rom t ime to t ime , have l ong or shor t pos i t i ons i n , and buy or se l l the secur i t ie s thereof , of company ( i es ) ment ioned here in or (b ) be engaged i n any other t ransact ion i nvo l v ing such secur i t ies and earn brokerage or other compensat ion or act as a market maker i n the f inanc ia l i n s t ruments of the company ( ies ) d i scussed here in or ac t as adv i sor or l ender / borrower to such company ( ies ) or have other potent i a l conf l i c t of i n teres t with respect to any recommendat ion and re l a ted i n fo rmat ion and op in ions . The ana l ys t fo r th i s repor t cer t i f i es that a l l of the v iews expressed i n th i s repor t accurate ly re f l ec t h i s or her persona l v iews about the sub ject company or compan ies and i t s or the i r secur i t ies , and no par t of h i s or her compensat ion was , i s or wi l l be , d i rec t l y or i nd i rec t l y re la ted to spec i f i c recommendat ions or v iews expressed i n th i s repor t . No par t of th i s mater i a l may be dup l i ca ted i n any fo rm and/or red i s t r ibuted without Ideas 1 s t In format ion Serv i ces ’ pr ior wr i t ten consent . Th i s document i s not fo r pub l i c d i s t r ibut ion and has been fu rn i shed to you so le ly fo r your i n format ion and must not be reproduced or red i s t r ibuted to any other person . Persons i n to whose possess ion th i s document may come are requ i red to observe these res t r i c t ions .
Contact Details Ideas 1st Information Services Pvt. Ltd. Regd. & Adm. Off: 3rd Floor, 28 Rajabahadur Mansion, Mumbai Samachar Marg, Fort, Mumbai – 400 001. India. Tel: +91 22 6521 4836 Fax: +91 22 2265 6905
Corporate Off: Gr. Floor, 11, Raheja Centre, Free Press Marg, Nariman Point, Mumbai – 400 021. India. Tel: +91 22 6148 5700 Fax: +91 22 6148 5750
E‐mail: [email protected] / [email protected] Website: www.ifisresearch.com / www.ideasfirst.in