packeteer packetshaper update
DESCRIPTION
Packeteer PacketShaper Update. OARNET April 2005. Sean Applegate Mid-Atlantic Territory Engineer (703) 801-0413 [email protected]. Agenda. New Features in 7.X DoS Tuning Performance Tuning General Q & A. Several Minor UI Improvements WUI Plugin Architecture Quick Commands - PowerPoint PPT PresentationTRANSCRIPT
1
Packeteer PacketShaper Update
OARNET April 2005
Sean ApplegateMid-Atlantic Territory Engineer
(703) [email protected]
2
Agenda
• New Features in 7.X
• DoS Tuning
• Performance Tuning
• General Q & A
3
What’s new in 7.X
• Several Minor UI Improvements
• WUI Plugin Architecture
• Quick Commands
• IPFilters
• Flow Detail Records (FDR)
• Adaptive Response Technology (ART)
4
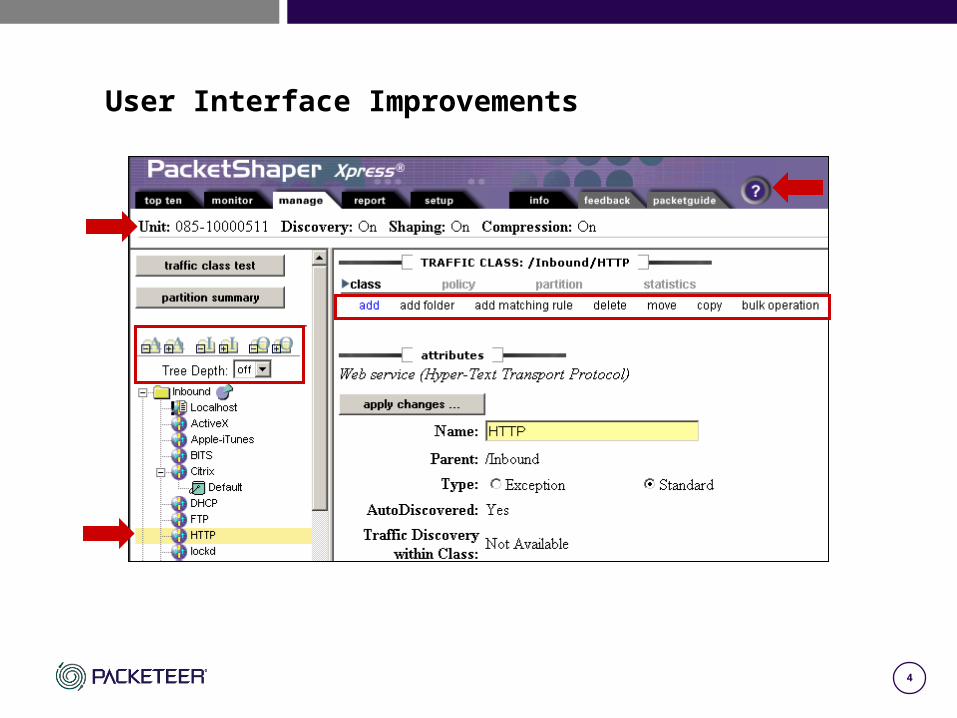
User Interface Improvements
5
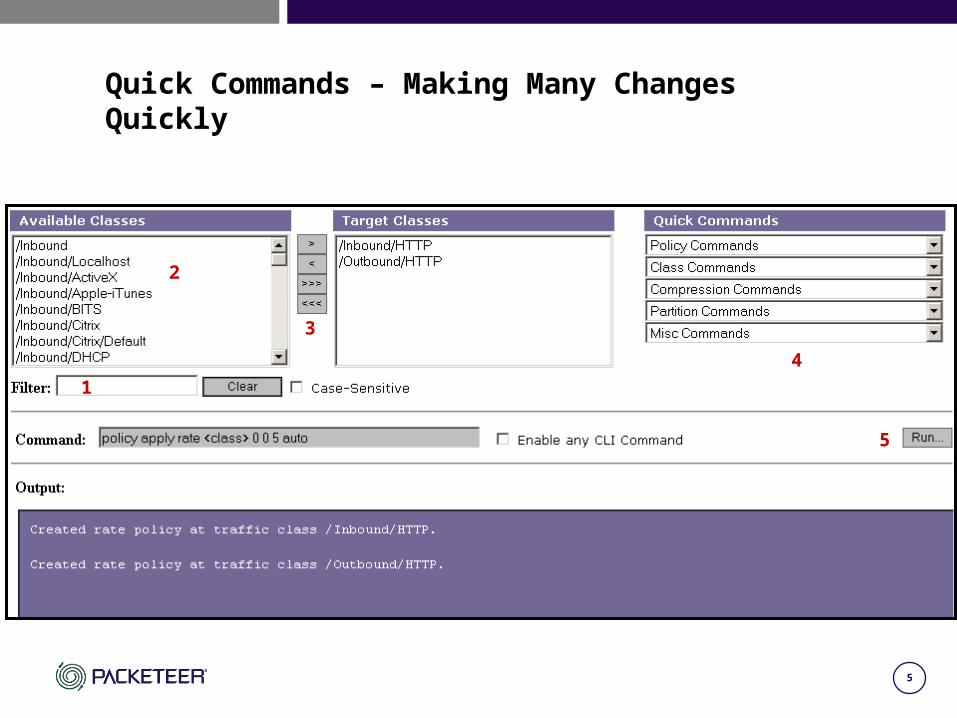
Quick Commands – Making Many Changes Quickly
1
2
3
4
5
6
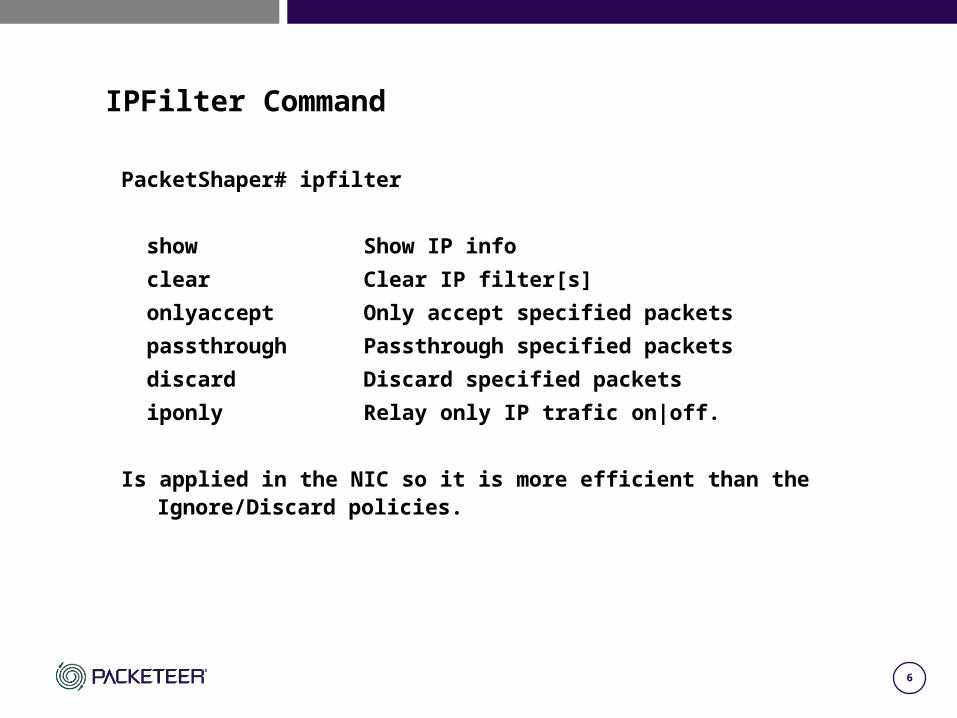
IPFilter Command
PacketShaper# ipfilter
show Show IP info
clear Clear IP filter[s]
onlyaccept Only accept specified packets
passthrough Passthrough specified packets
discard Discard specified packets
iponly Relay only IP trafic on|off.
Is applied in the NIC so it is more efficient than the Ignore/Discard policies.
7
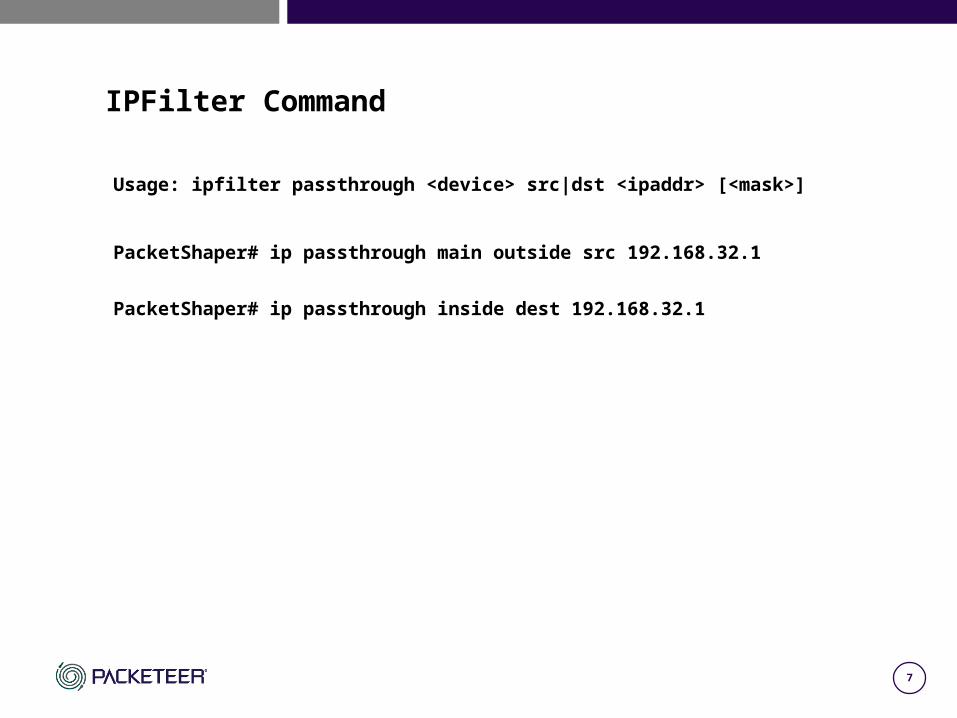
IPFilter Command
Usage: ipfilter passthrough <device> src|dst <ipaddr> [<mask>]
PacketShaper# ip passthrough main outside src 192.168.32.1
PacketShaper# ip passthrough inside dest 192.168.32.1
8
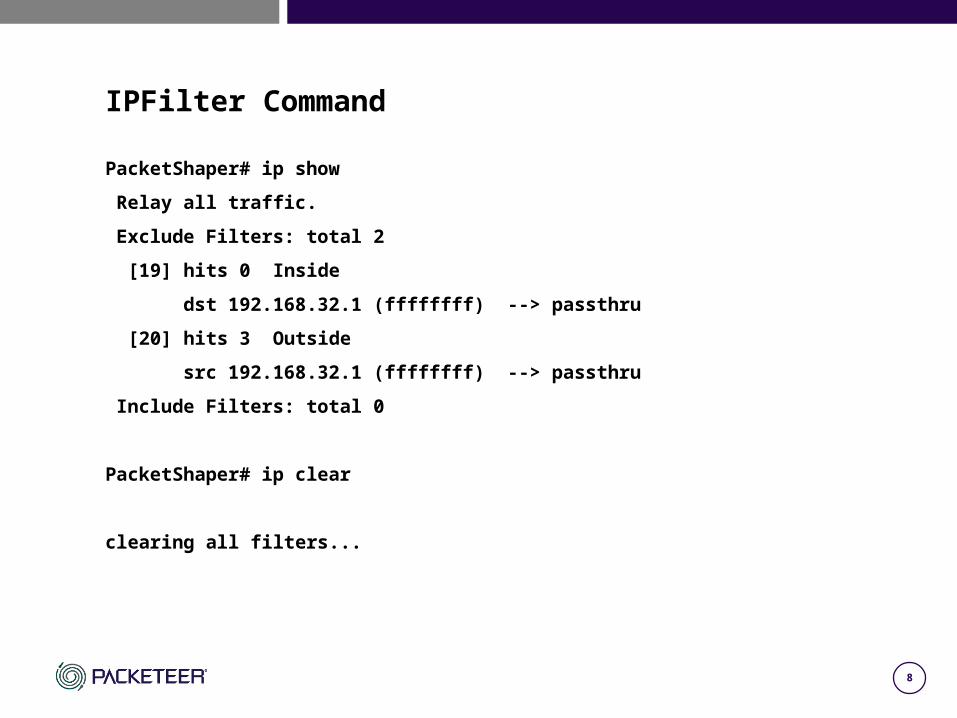
IPFilter Command
PacketShaper# ip show
Relay all traffic.
Exclude Filters: total 2
[19] hits 0 Inside
dst 192.168.32.1 (ffffffff) --> passthru
[20] hits 3 Outside
src 192.168.32.1 (ffffffff) --> passthru
Include Filters: total 0
PacketShaper# ip clear
clearing all filters...
9
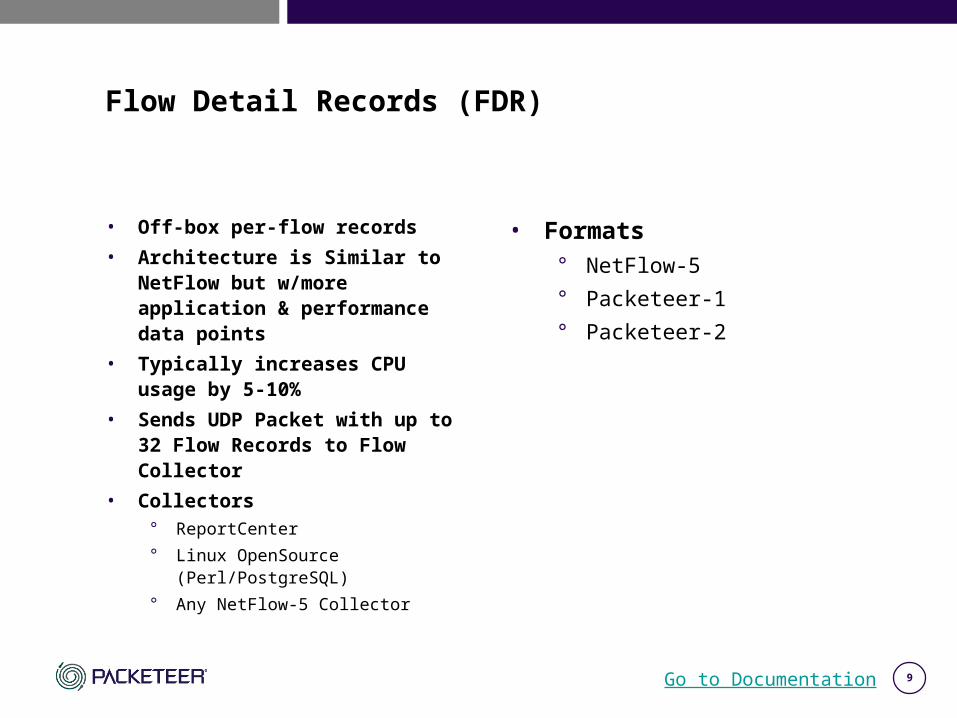
Flow Detail Records (FDR)
• Off-box per-flow records
• Architecture is Similar to NetFlow but w/more application & performance data points
• Typically increases CPU usage by 5-10%
• Sends UDP Packet with up to 32 Flow Records to Flow Collector
• Collectors° ReportCenter
° Linux OpenSource (Perl/PostgreSQL)
° Any NetFlow-5 Collector
• Formats° NetFlow-5
° Packeteer-1
° Packeteer-2
Go to Documentation
10
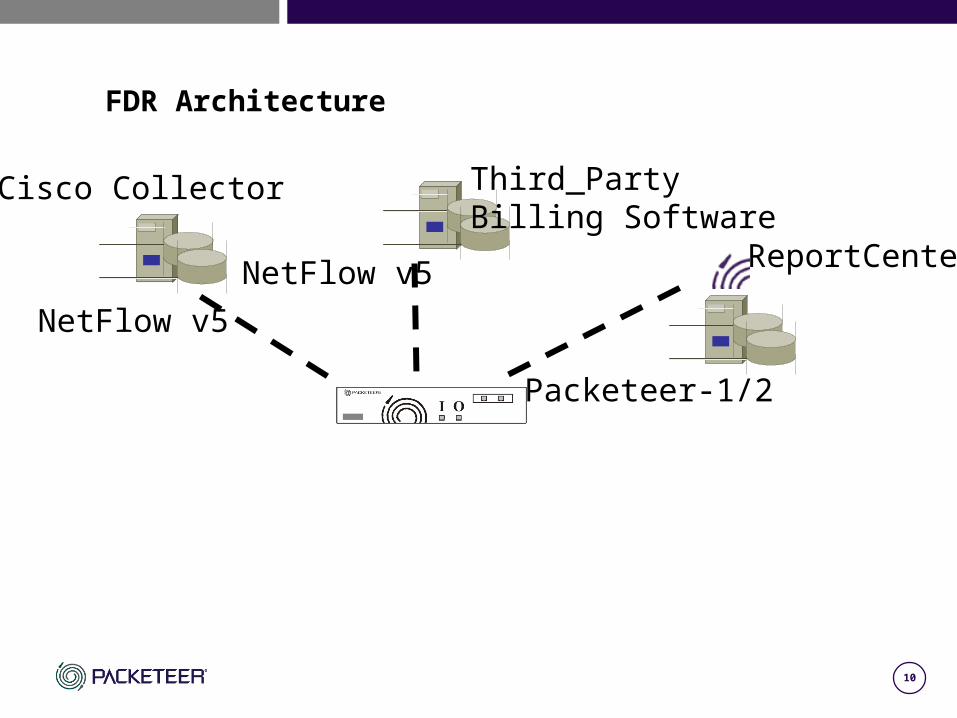
FDR Architecture
Third_Party Billing Software
NetFlow v5
Cisco Collector
NetFlow v5
ReportCenter
Packeteer-1/2
11
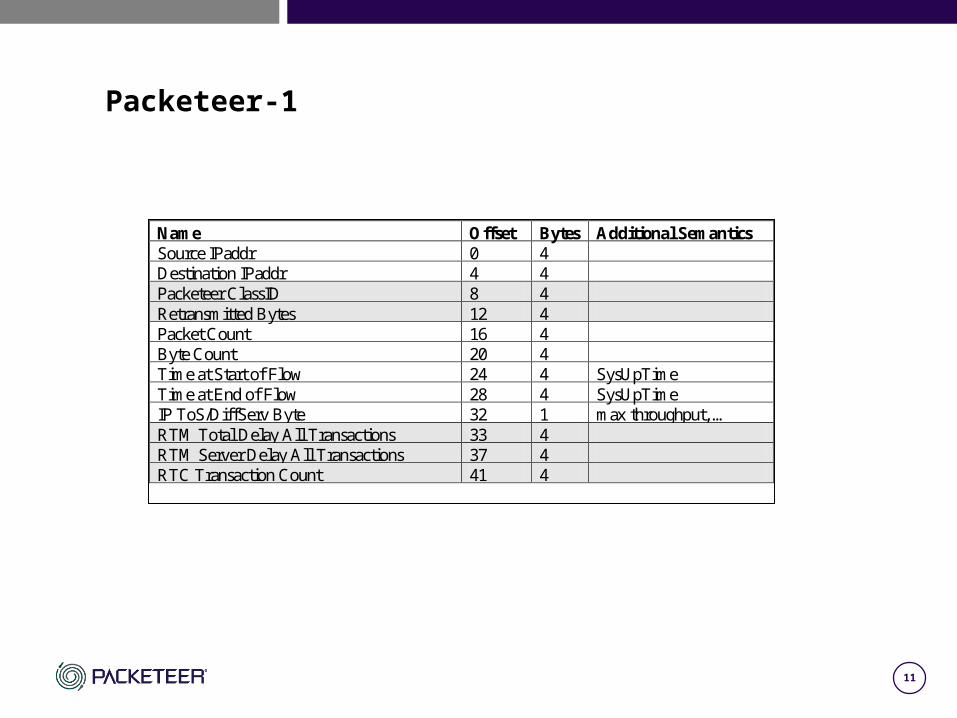
Packeteer-1
Name Offset Bytes Additional Semantics Source IPaddr 0 4 Destination IPaddr 4 4 Packeteer ClassID 8 4 Retransmitted Bytes 12 4 Packet Count 16 4 Byte Count 20 4 Time at Start of Flow 24 4 SysUpTime Time at End of Flow 28 4 SysUpTime IP ToS/DiffServ Byte 32 1 max throughput, … RTM Total Delay All Transactions 33 4 RTM Server Delay All Transactions 37 4 RTC Transaction Count 41 4
12
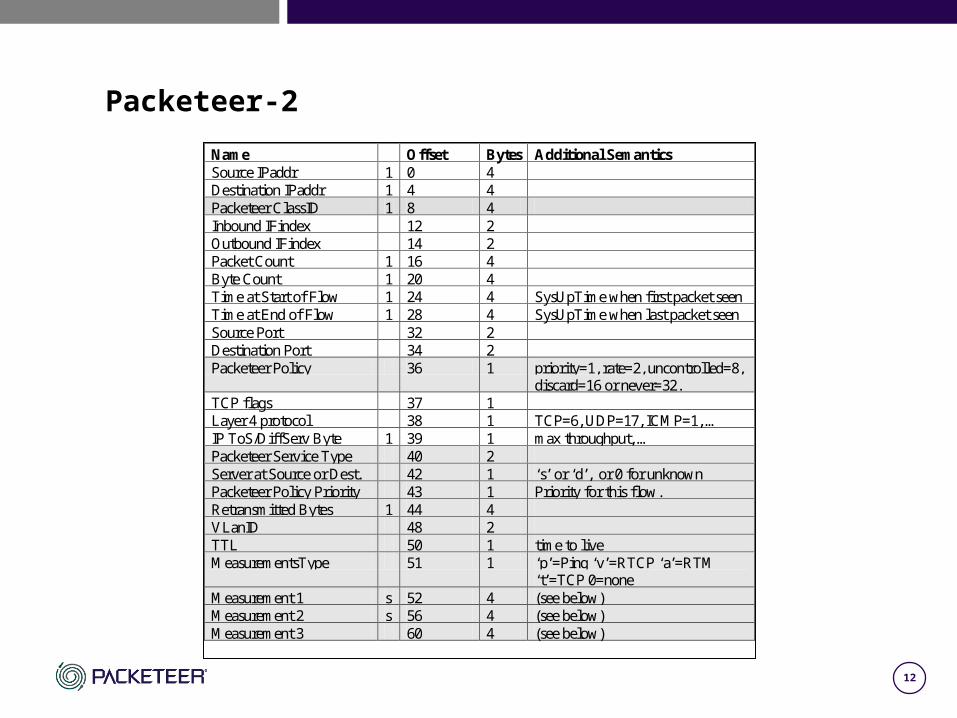
Packeteer-2
Name Offset Bytes Additional Semantics Source IPaddr 1 0 4 Destination IPaddr 1 4 4 Packeteer ClassID 1 8 4 Inbound IFindex 12 2 Outbound IFindex 14 2 Packet Count 1 16 4 Byte Count 1 20 4 Time at Start of Flow 1 24 4 SysUpTime when first packet seen Time at End of Flow 1 28 4 SysUpTime when last packet seen Source Port 32 2 Destination Port 34 2 Packeteer Policy 36 1 priority=1, rate=2, uncontrolled=8,
discard=16 or never=32. TCP flags 37 1 Layer 4 protocol 38 1 TCP=6, UDP=17, ICMP=1, … IP ToS/DiffServ Byte 1 39 1 max throughput, … Packeteer Service Type 40 2 Server at Source or Dest. 42 1 ‘s’ or ‘d’, or 0 for unknown Packeteer Policy Priority 43 1 Priority for this flow. Retransmitted Bytes 1 44 4 VLanID 48 2 TTL 50 1 time to live MeasurementsType 51 1 ‘p’=Ping ‘v’=RTCP ‘a’=RTM
‘t’=TCP 0=none Measurement 1 s 52 4 (see below) Measurement 2 s 56 4 (see below) Measurement 3 60 4 (see below)
13
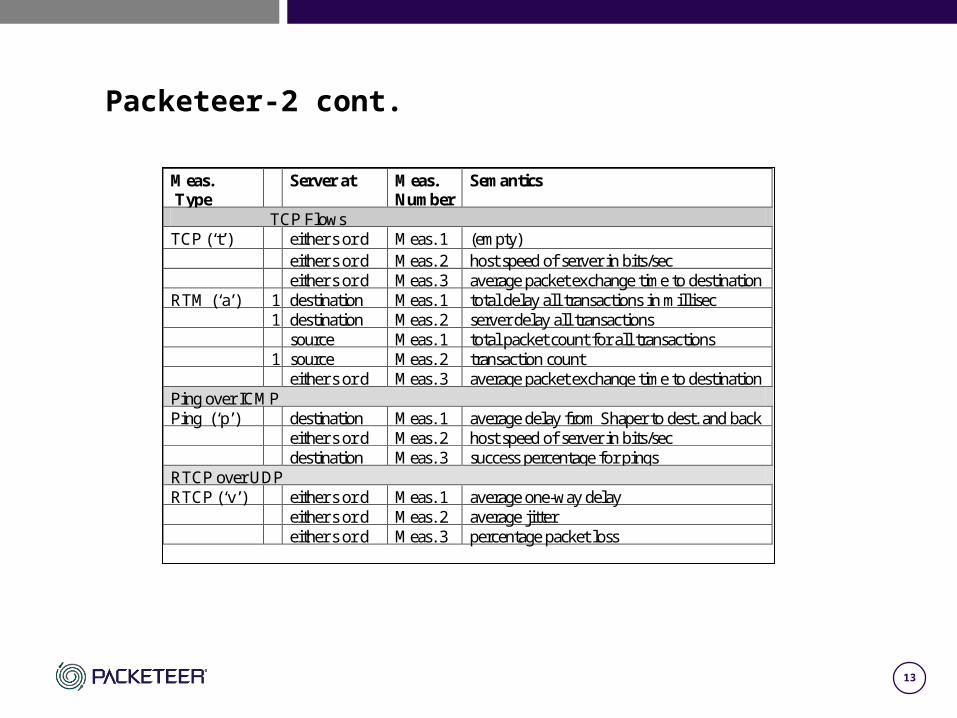
Packeteer-2 cont.
Meas. Type
Server at Meas. Number
Semantics
TCP Flows TCP (‘t’) either s or d Meas. 1 (empty) either s or d Meas. 2 host speed of server in bits/sec either s or d Meas. 3 average packet exchange time to destination RTM (‘a’) 1 destination Meas. 1 total delay all transactions in millisec 1 destination Meas. 2 server delay all transactions source Meas. 1 total packet count for all transactions 1 source Meas. 2 transaction count either s or d Meas. 3 average packet exchange time to destination Ping over ICMP Ping (‘p’) destination Meas. 1 average delay from Shaper to dest. and back either s or d Meas. 2 host speed of server in bits/sec destination Meas. 3 success percentage for pings RTCP over UDP RTCP (‘v’) either s or d Meas. 1 average one-way delay either s or d Meas. 2 average jitter either s or d Meas. 3 percentage packet loss
14
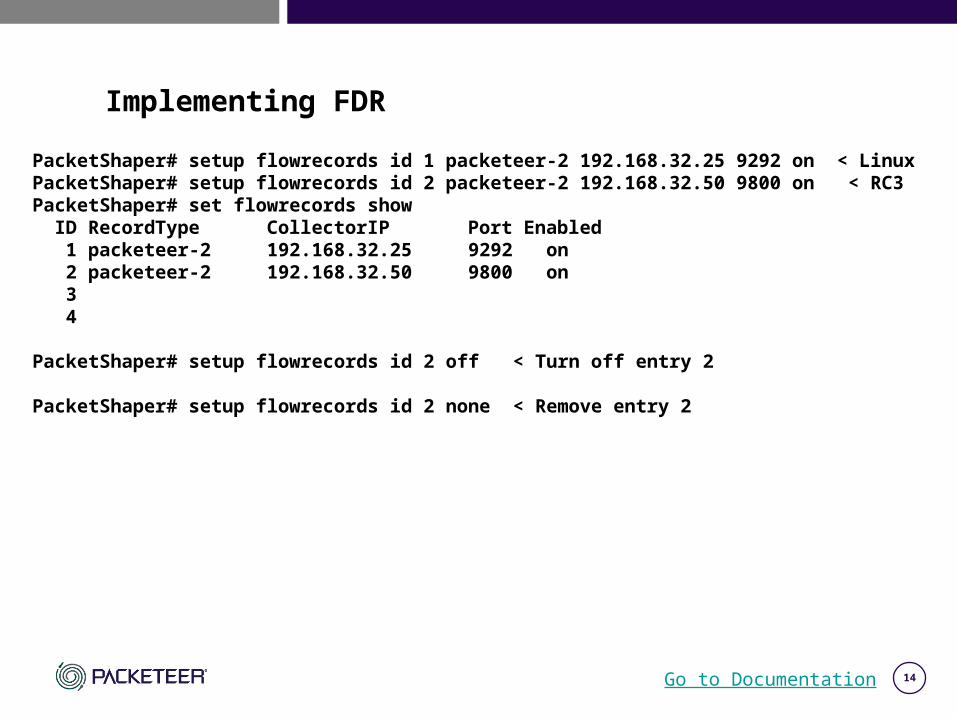
Implementing FDR
PacketShaper# setup flowrecords id 1 packeteer-2 192.168.32.25 9292 on < LinuxPacketShaper# setup flowrecords id 2 packeteer-2 192.168.32.50 9800 on < RC3PacketShaper# set flowrecords show ID RecordType CollectorIP Port Enabled 1 packeteer-2 192.168.32.25 9292 on 2 packeteer-2 192.168.32.50 9800 on 3 4
PacketShaper# setup flowrecords id 2 off < Turn off entry 2
PacketShaper# setup flowrecords id 2 none < Remove entry 2
Go to Documentation
15
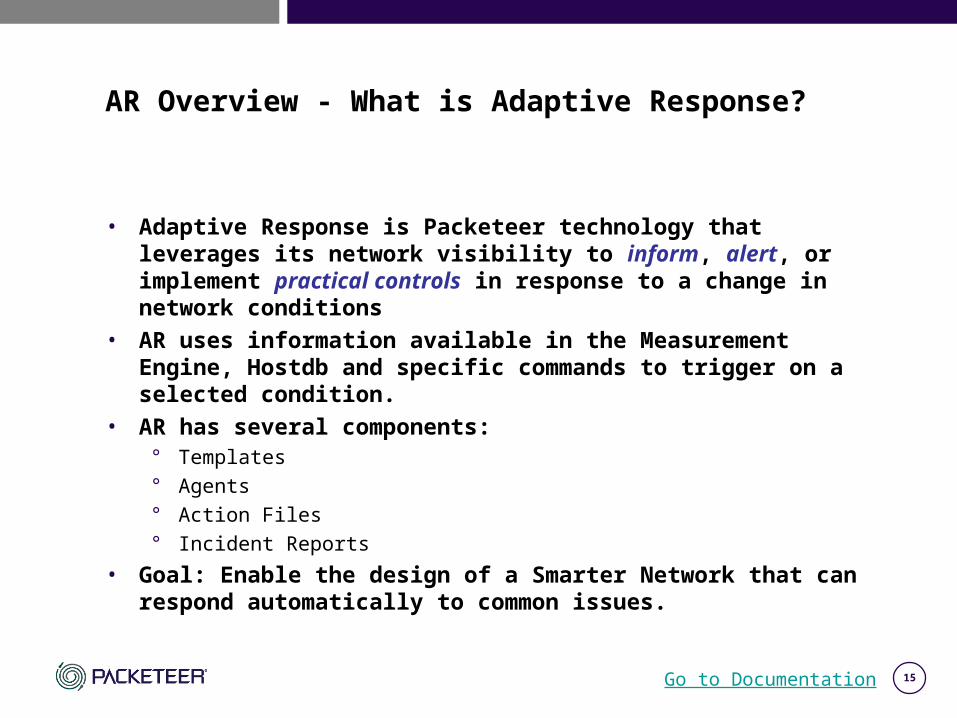
AR Overview - What is Adaptive Response?
• Adaptive Response is Packeteer technology that leverages its network visibility to inform, alert, or implement practical controls in response to a change in network conditions
• AR uses information available in the Measurement Engine, Hostdb and specific commands to trigger on a selected condition.
• AR has several components:° Templates° Agents° Action Files° Incident Reports
• Goal: Enable the design of a Smarter Network that can respond automatically to common issues.
Go to Documentation
16
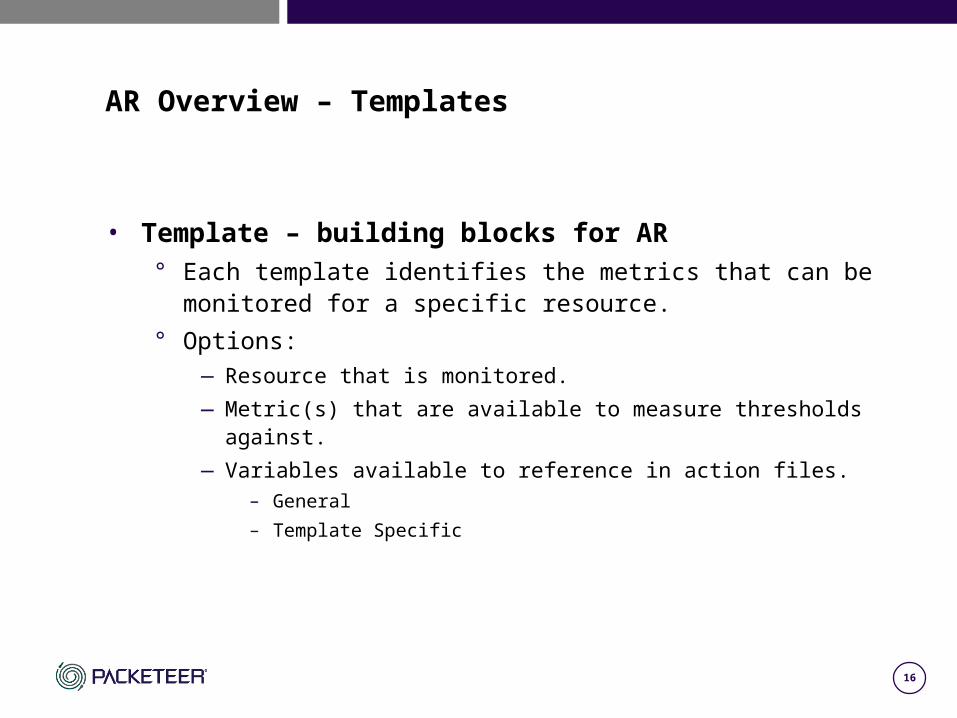
AR Overview – Templates
• Template – building blocks for AR° Each template identifies the metrics that can be monitored for a
specific resource.
° Options:—Resource that is monitored.
—Metric(s) that are available to measure thresholds against.
—Variables available to reference in action files.– General
– Template Specific
17
AR Agents
• Agent – The Glue° Multiple agents can be based on a single template
° Specifies the exact metric to monitor
° Specifies the resource to monitor (link, class, host, etc)
° Specifies Green, Yellow and Red Thresholds
° References optional Action files which implement alerts or actions.
° Creates Incident Report when triggered
Go to Documentation
18
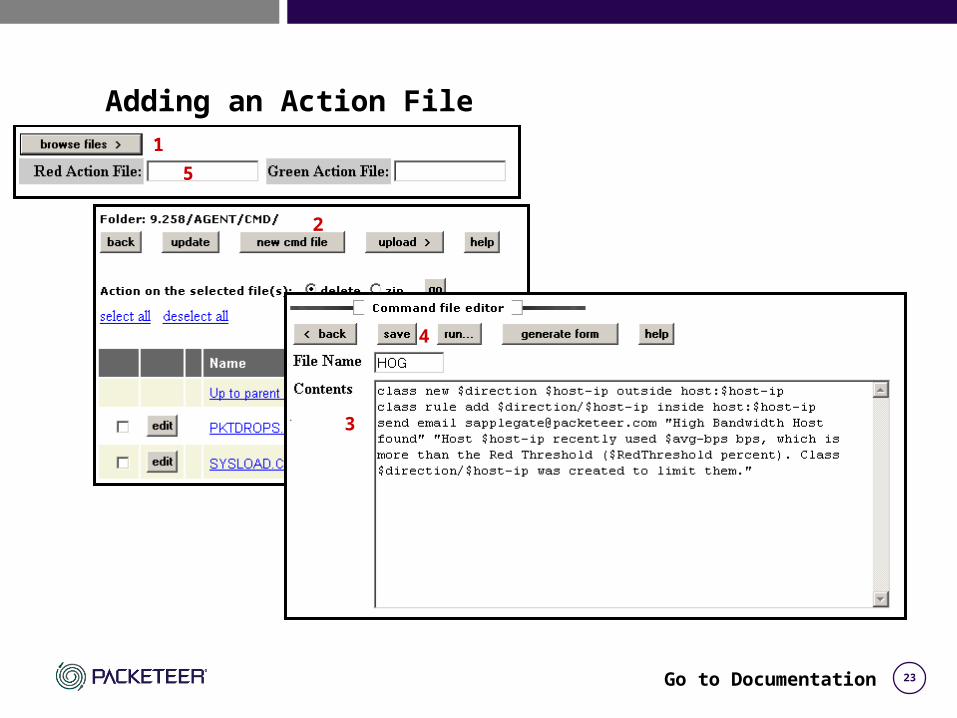
AR Overview – Action Files & Drilldowns
• Action files (also called command or .cmd files)° Provides the commands to run when an agent triggers° Example - Send an email when inbound/default becomes greater than 15% of
the partition bandwidth. The action file may look something like this for the Inbound Default Traffic agent: partition apply $ClassName 15% fixed send email [email protected] ‘$agentname agent’ ‘The $ClassName class has exceeded 15% of the link for more than 60 minutes. It has been limited to 15% of the link. Go to the Info tab to view the Incident Report for $agentname agent to see more details.’
• Drilldown (also called Incident Report)° Produces detailed information on the events that caused an agent to trigger° On the WUI, holding the mouse over the AR category produces a window with
a list of links to drilldown files or graphs – clicking on the link shows the drilldown in a separate window
° Example - High Bandwidth Host drilldown looks like this:"time","agent3","avg-bps","host-ip","direction" "06-Jan-2005 14:10:00","High Bandwidth Host",13816,10.10.253.99,outbound
"06-Jan-2005 14:10:00","High Bandwidth Host",7816,10.1.1.27,inbound
Go to Documentation

19
Default ART Templates
• App Health° Default Traffic
° New Application
° High Bandwidth New App
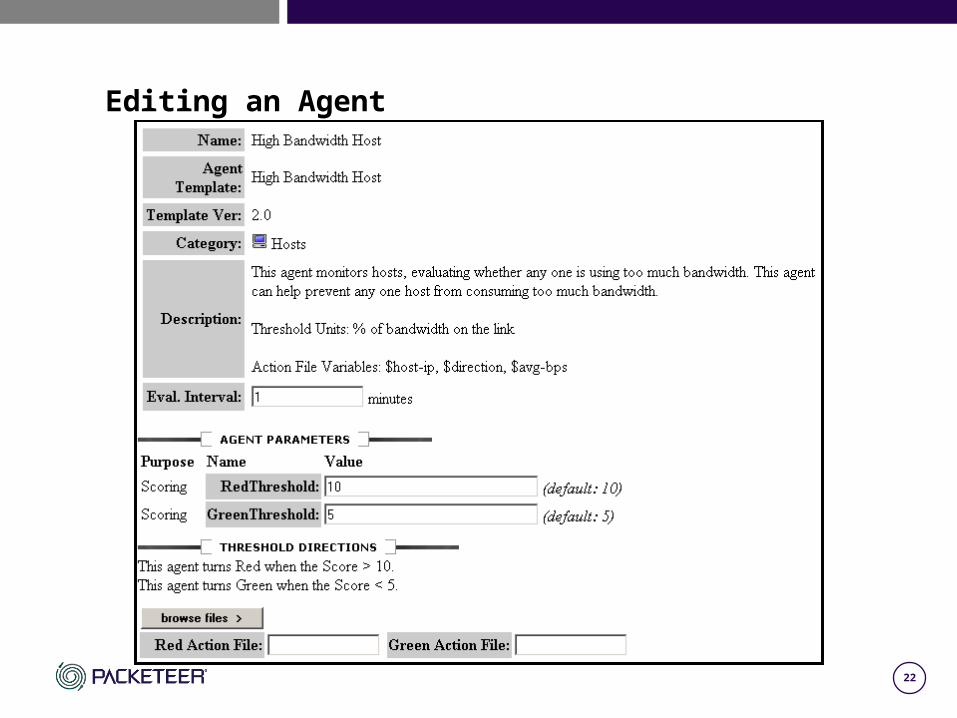
• Host ° High Bandwidth Host
° Host Info Variables
° Failed Flow Ratio
° New Flows Per Minute (NFPM) Failed Flow
° New Flows Per Minute (NFPM) Side Unknown
• General° Class ME Variables
° Partition Variables
° Link ME Variables
•Unit Health
°Unit Limits
°System Load
°Memory Allocation
•Network Health
°Traffic Performance
°Partition Utilization
20
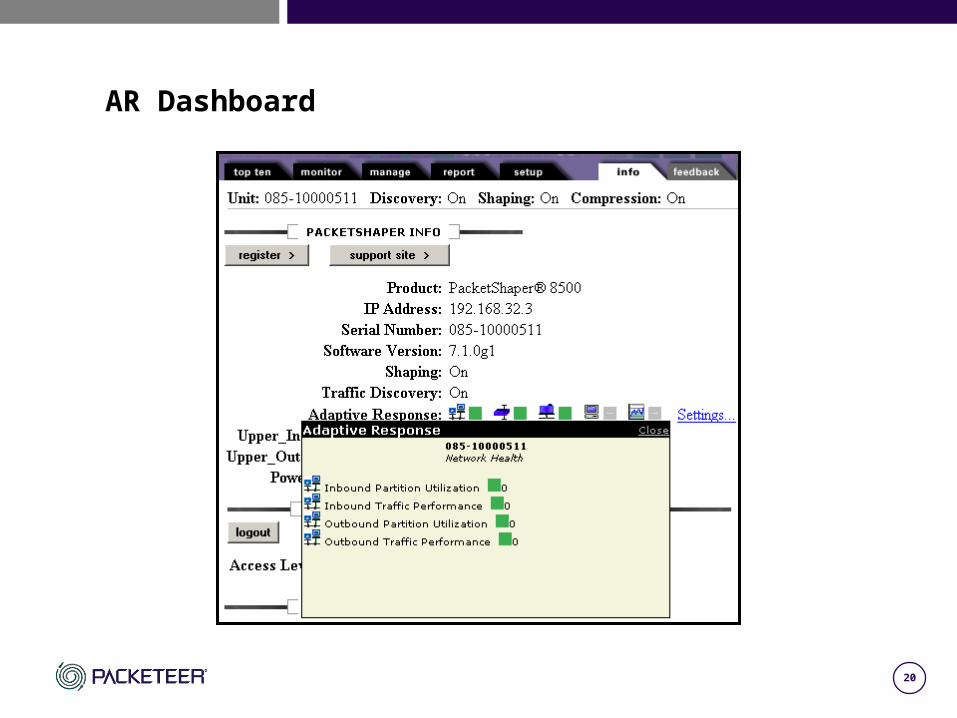
AR Dashboard
21
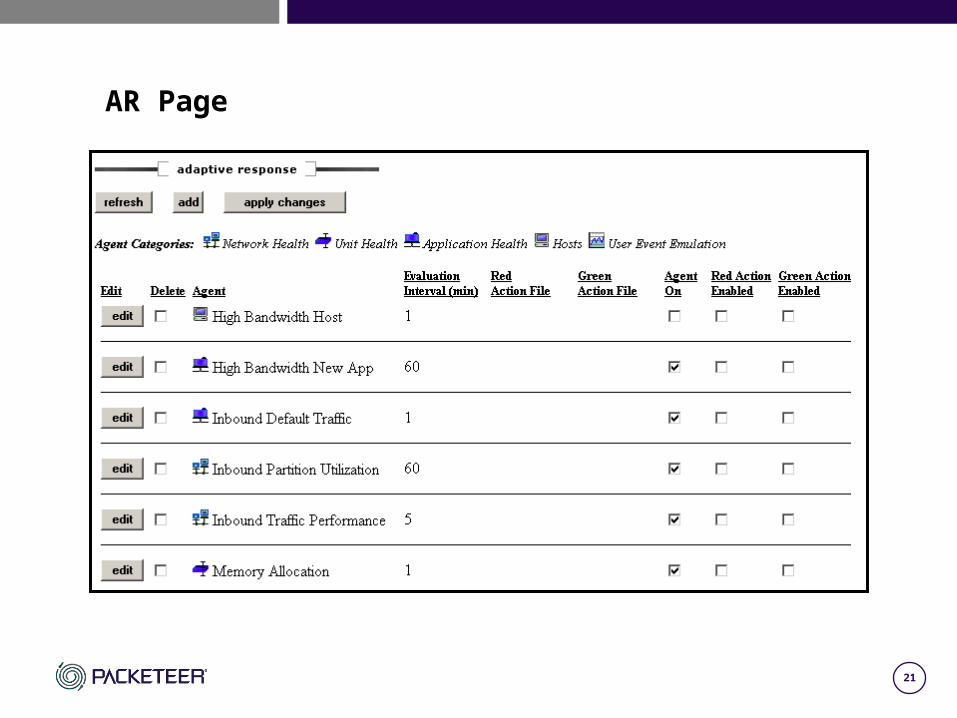
AR Page
22
Editing an Agent
23
Adding an Action File1
2
3
4
5
Go to Documentation
24
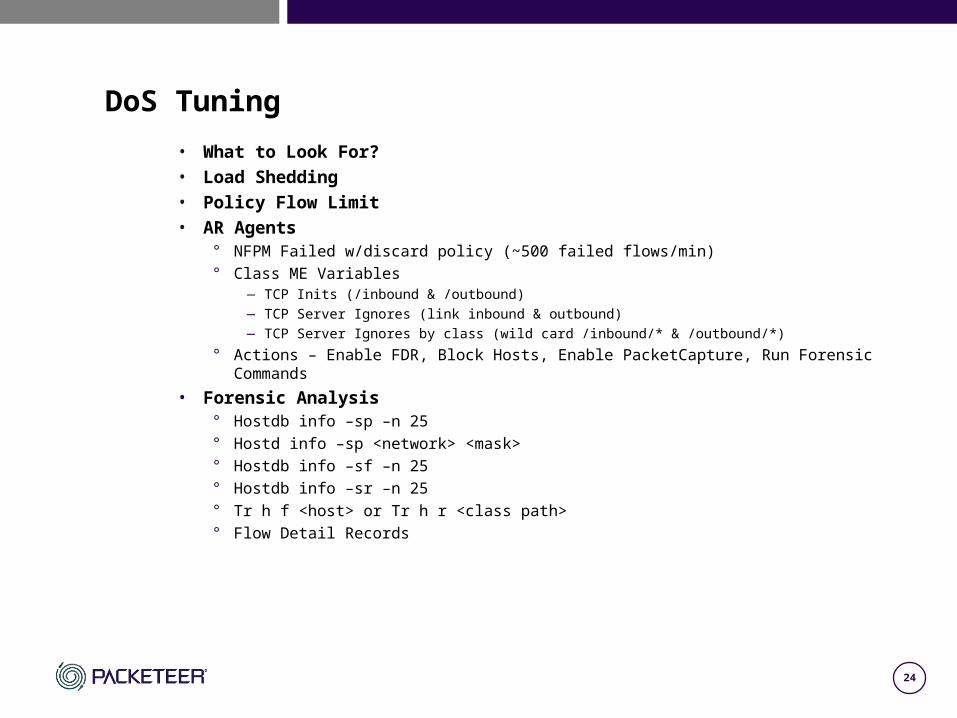
DoS Tuning
• What to Look For?• Load Shedding• Policy Flow Limit• AR Agents
° NFPM Failed w/discard policy (~500 failed flows/min)° Class ME Variables
— TCP Inits (/inbound & /outbound)— TCP Server Ignores (link inbound & outbound) — TCP Server Ignores by class (wild card /inbound/* & /outbound/*)
° Actions – Enable FDR, Block Hosts, Enable PacketCapture, Run Forensic Commands
• Forensic Analysis° Hostdb info –sp –n 25° Hostd info –sp <network> <mask>° Hostdb info –sf –n 25° Hostdb info –sr –n 25° Tr h f <host> or Tr h r <class path>° Flow Detail Records
25
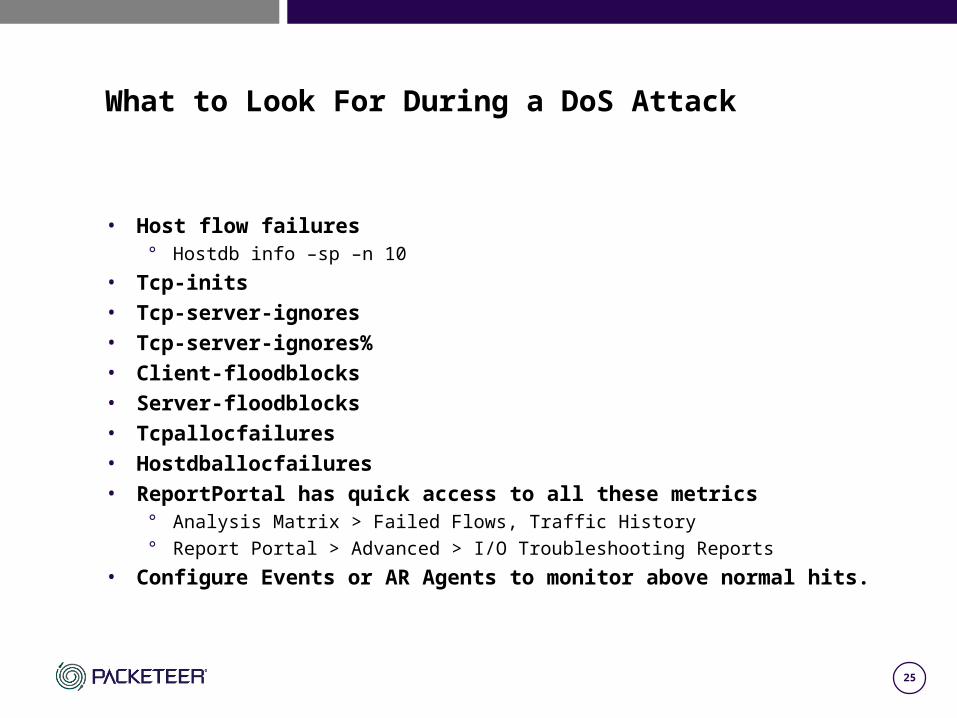
What to Look For During a DoS Attack
• Host flow failures° Hostdb info –sp –n 10
• Tcp-inits• Tcp-server-ignores• Tcp-server-ignores%• Client-floodblocks• Server-floodblocks• Tcpallocfailures• Hostdballocfailures• ReportPortal has quick access to all these metrics
° Analysis Matrix > Failed Flows, Traffic History° Report Portal > Advanced > I/O Troubleshooting Reports
• Configure Events or AR Agents to monitor above normal hits.
26
Load Shedding
• Drop new and/or existing connections on a per host basis that exceed a define threshold
• White List for Exception Hosts
Go to Documentation
27
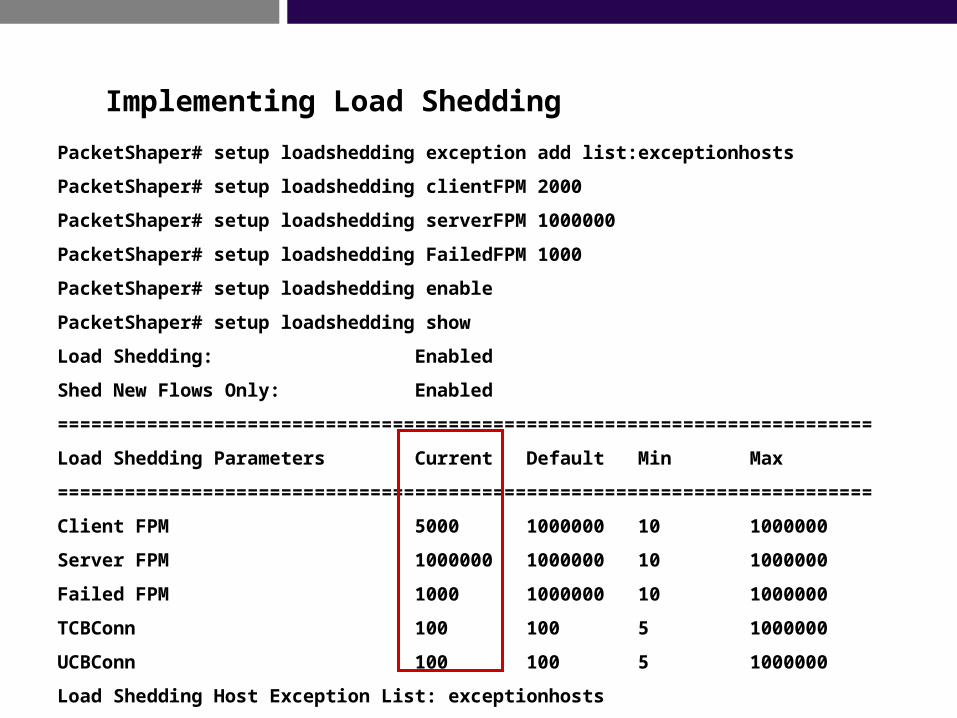
Implementing Load Shedding
PacketShaper# setup loadshedding exception add list:exceptionhosts
PacketShaper# setup loadshedding clientFPM 2000
PacketShaper# setup loadshedding serverFPM 1000000
PacketShaper# setup loadshedding FailedFPM 1000
PacketShaper# setup loadshedding enable
PacketShaper# setup loadshedding show
Load Shedding: Enabled
Shed New Flows Only: Enabled
=========================================================================
Load Shedding Parameters Current Default Min Max
=========================================================================
Client FPM 5000 1000000 10 1000000
Server FPM 1000000 1000000 10 1000000
Failed FPM 1000 1000000 10 1000000
TCBConn 100 100 5 1000000
UCBConn 100 100 5 1000000
Load Shedding Host Exception List: exceptionhosts
28
Policy Flowlimit
• Similar to Load Shedding but done in PacketWise Software and takes into account all flows and can only effect new flows.
• The limits are set to default values of 10,000 flows per minute on client hosts and 100,000 flows per minute on servers.
• Flows limits include flows of any type, not types of just that traffic type.
• policy flowlimit <tclass> none|<client-fpm> <server-fpm>
Go to Documentation
29
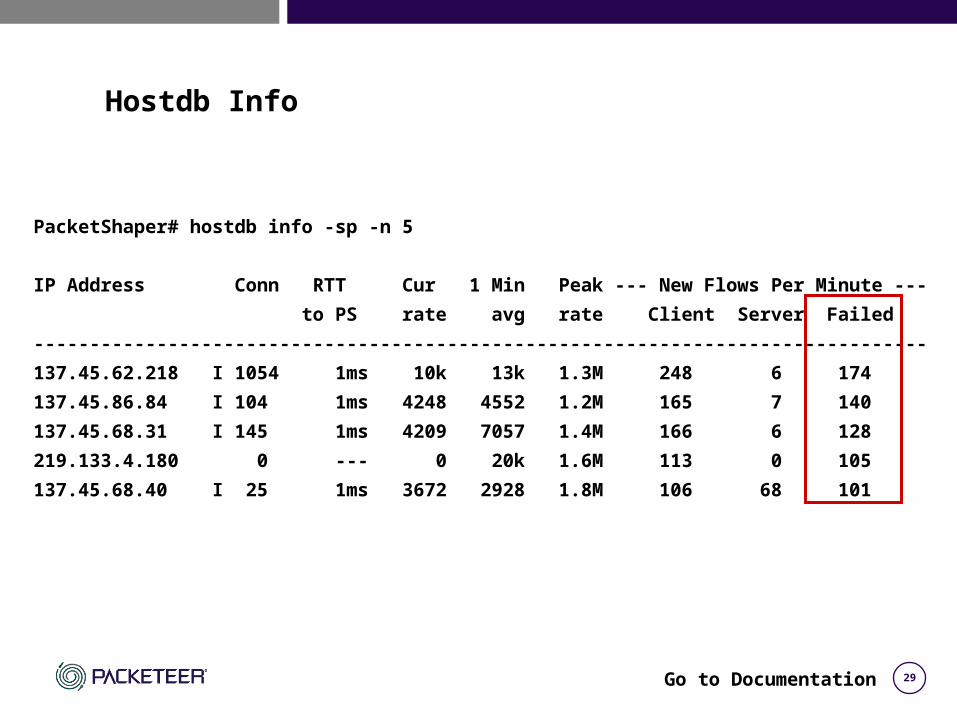
Hostdb Info
PacketShaper# hostdb info -sp -n 5
IP Address Conn RTT Cur 1 Min Peak --- New Flows Per Minute ---
to PS rate avg rate Client Server Failed
--------------------------------------------------------------------------------
137.45.62.218 I 1054 1ms 10k 13k 1.3M 248 6 174
137.45.86.84 I 104 1ms 4248 4552 1.2M 165 7 140
137.45.68.31 I 145 1ms 4209 7057 1.4M 166 6 128
219.133.4.180 0 --- 0 20k 1.6M 113 0 105
137.45.68.40 I 25 1ms 3672 2928 1.8M 106 68 101
Go to Documentation
30
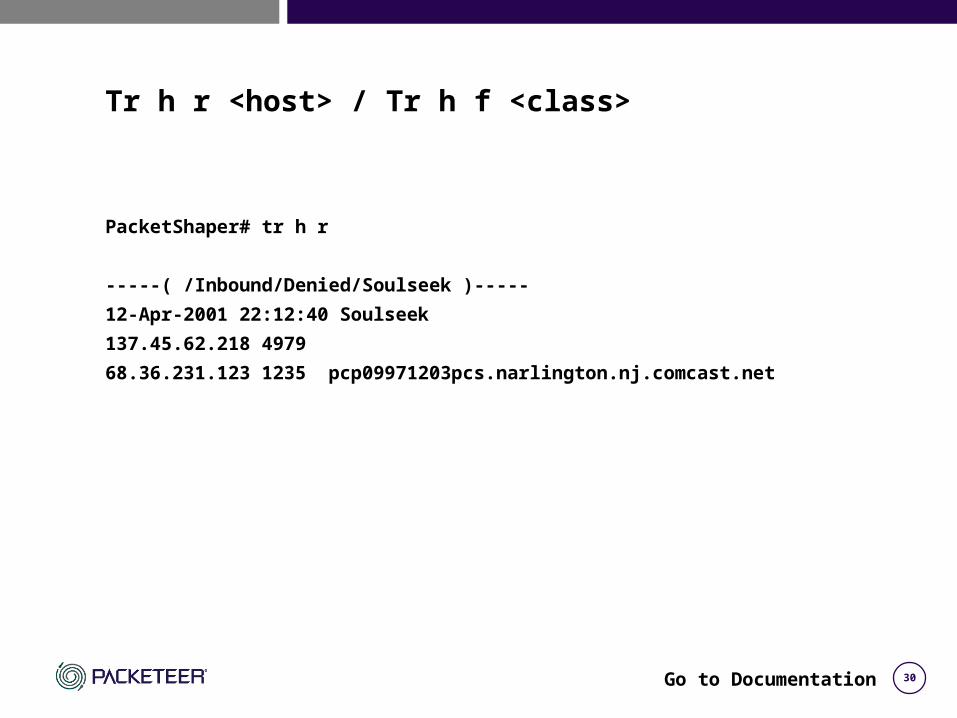
Tr h r <host> / Tr h f <class>
PacketShaper# tr h r
-----( /Inbound/Denied/Soulseek )-----
12-Apr-2001 22:12:40 Soulseek
137.45.62.218 4979
68.36.231.123 1235 pcp09971203pcs.narlington.nj.comcast.net
Go to Documentation
31
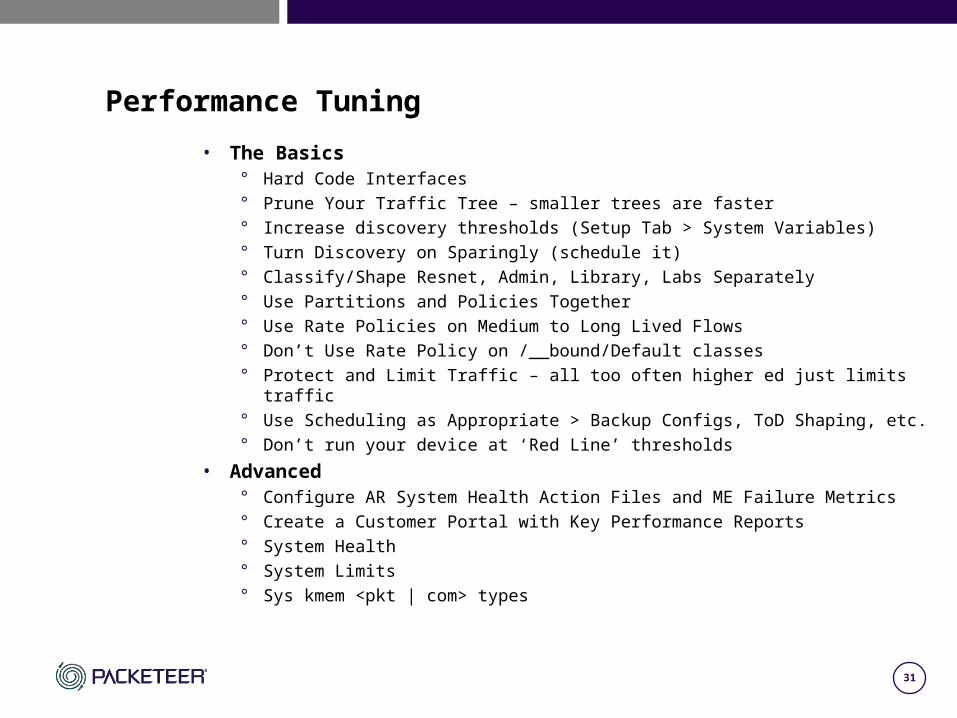
Performance Tuning
• The Basics° Hard Code Interfaces° Prune Your Traffic Tree – smaller trees are faster° Increase discovery thresholds (Setup Tab > System Variables)° Turn Discovery on Sparingly (schedule it)° Classify/Shape Resnet, Admin, Library, Labs Separately° Use Partitions and Policies Together° Use Rate Policies on Medium to Long Lived Flows° Don’t Use Rate Policy on /__bound/Default classes° Protect and Limit Traffic – all too often higher ed just limits traffic° Use Scheduling as Appropriate > Backup Configs, ToD Shaping, etc.° Don’t run your device at ‘Red Line’ thresholds
• Advanced° Configure AR System Health Action Files and ME Failure Metrics° Create a Customer Portal with Key Performance Reports° System Health° System Limits° Sys kmem <pkt | com> types
32
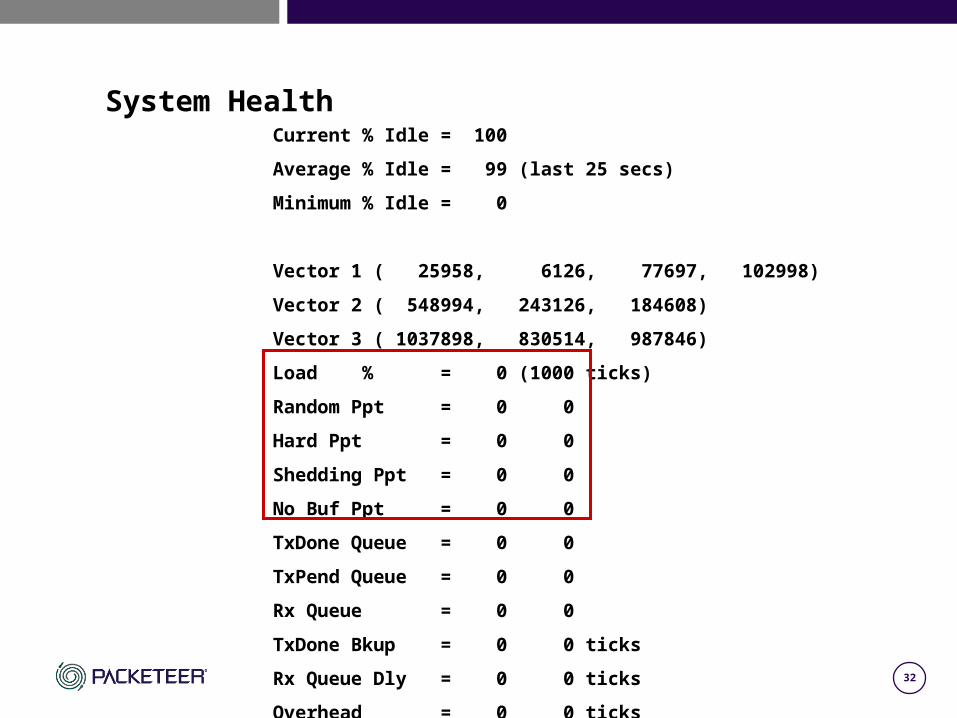
System HealthCurrent % Idle = 100
Average % Idle = 99 (last 25 secs)
Minimum % Idle = 0
Vector 1 ( 25958, 6126, 77697, 102998)
Vector 2 ( 548994, 243126, 184608)
Vector 3 ( 1037898, 830514, 987846)
Load % = 0 (1000 ticks)
Random Ppt = 0 0
Hard Ppt = 0 0
Shedding Ppt = 0 0
No Buf Ppt = 0 0
TxDone Queue = 0 0
TxPend Queue = 0 0
Rx Queue = 0 0
TxDone Bkup = 0 0 ticks
Rx Queue Dly = 0 0 ticks
Overhead = 0 0 ticks
33
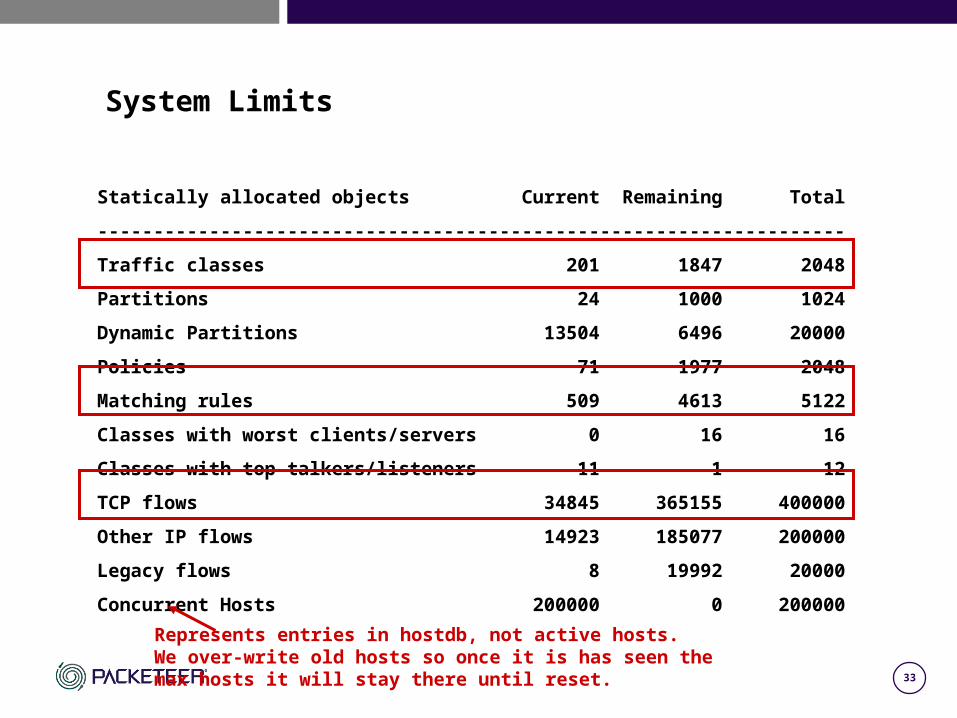
System Limits
Statically allocated objects Current Remaining Total
-------------------------------------------------------------------
Traffic classes 201 1847 2048
Partitions 24 1000 1024
Dynamic Partitions 13504 6496 20000
Policies 71 1977 2048
Matching rules 509 4613 5122
Classes with worst clients/servers 0 16 16
Classes with top talkers/listeners 11 1 12
TCP flows 34845 365155 400000
Other IP flows 14923 185077 200000
Legacy flows 8 19992 20000
Concurrent Hosts 200000 0 200000
Represents entries in hostdb, not active hosts. We over-write old hosts so once it is has seen the max hosts it will stay there until reset.
34
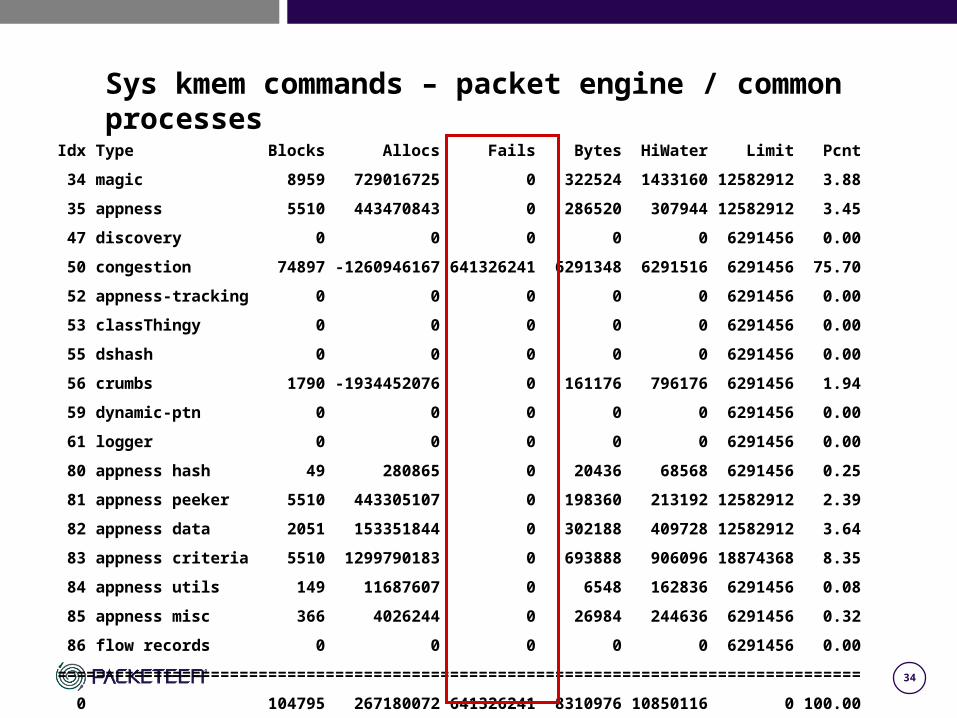
Sys kmem commands – packet engine / common processes
Idx Type Blocks Allocs Fails Bytes HiWater Limit Pcnt
34 magic 8959 729016725 0 322524 1433160 12582912 3.88
35 appness 5510 443470843 0 286520 307944 12582912 3.45
47 discovery 0 0 0 0 0 6291456 0.00
50 congestion 74897 -1260946167 641326241 6291348 6291516 6291456 75.70
52 appness-tracking 0 0 0 0 0 6291456 0.00
53 classThingy 0 0 0 0 0 6291456 0.00
55 dshash 0 0 0 0 0 6291456 0.00
56 crumbs 1790 -1934452076 0 161176 796176 6291456 1.94
59 dynamic-ptn 0 0 0 0 0 6291456 0.00
61 logger 0 0 0 0 0 6291456 0.00
80 appness hash 49 280865 0 20436 68568 6291456 0.25
81 appness peeker 5510 443305107 0 198360 213192 12582912 2.39
82 appness data 2051 153351844 0 302188 409728 12582912 3.64
83 appness criteria 5510 1299790183 0 693888 906096 18874368 8.35
84 appness utils 149 11687607 0 6548 162836 6291456 0.08
85 appness misc 366 4026244 0 26984 244636 6291456 0.32
86 flow records 0 0 0 0 0 6291456 0.00
====================================================================================
0 104795 267180072 641326241 8310976 10850116 0 100.00
35
General Q & A
• Performance
• Sizing
• Feature Requests
• Support / Resources
• Training
• Futures
• Etc