p1, p2, p3 2009
TRANSCRIPT
SULIT
NAMA : ................................................................................................ TING:......................................
PEPERIKSAAN PERCUBAAN SPM 2009 4551/1
BIOLOGY Kertas 1 Ogos
1 4
1 jam
PERSIDANGAN KEBANGSAAN PENGETUA-PENGETUA SEKOLAH MENENGAH
NEGERI KEDAH DARULAMAN
Satu jam lima belas minit
Bahasa Melayu.
3. Calon dikehendaki membaca maklumat di halaman belakang kertas soalan ini.
2. Soalan dalam Bahasa Inggeris mendahului soalan yang sepadan dalam
JANGAN BUKA KERTAS SOALAN INI SEHINGGA DIBERITAHU
1. Kertas soalan ini adalah dalam dwibahasa.
Kertas soalan ini mengandungi 31 halaman
4551/1© 2009 Hak cipta PKPSM Kedah [Lihat sebelah SULIT
j2kk
2 SULIT 4551/1
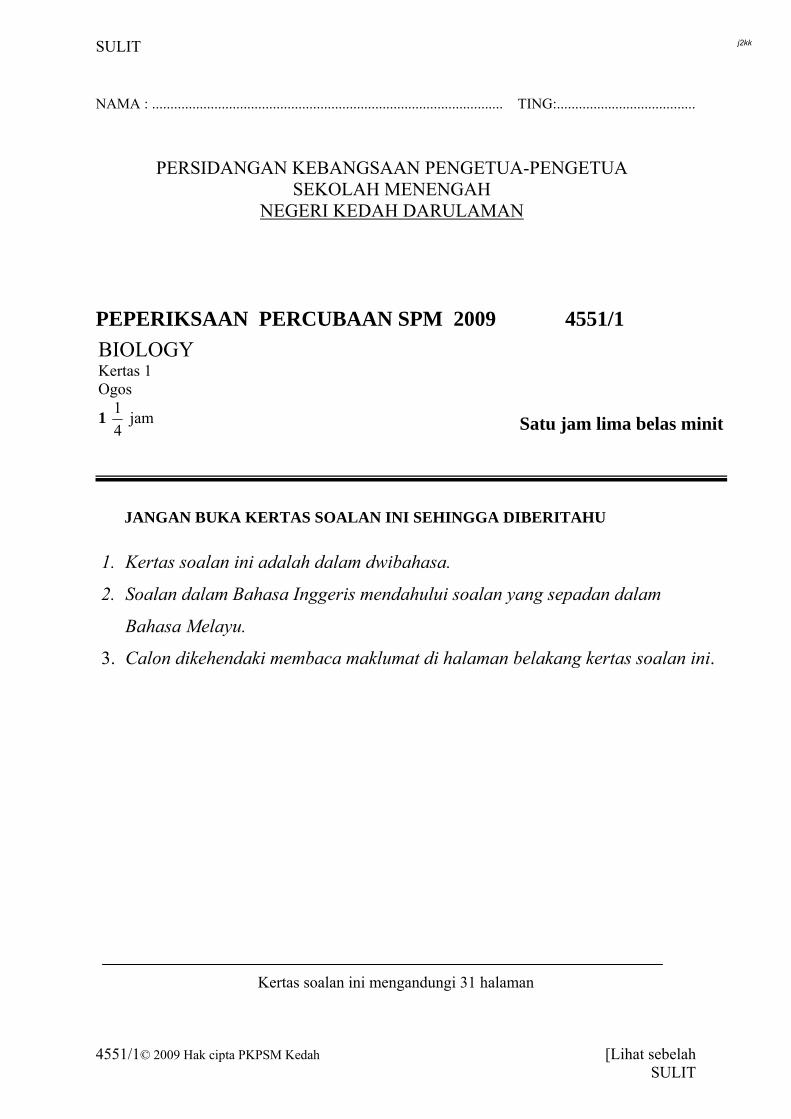
1 Diagram 1 shows an organelle in an animal cell. Rajah 1 menunjukkan satu organel dalam sel haiwan. Which of the following process takes place in this organelle? Di antara proses yang berikut, yang manakah berlaku dalam organel tersebut?
A Respiration Respirasi
B Photosynthesis Fotosintesis
C Lipid synthesis Sintesis lipid
D Protein synthesis Sintesis protein
2
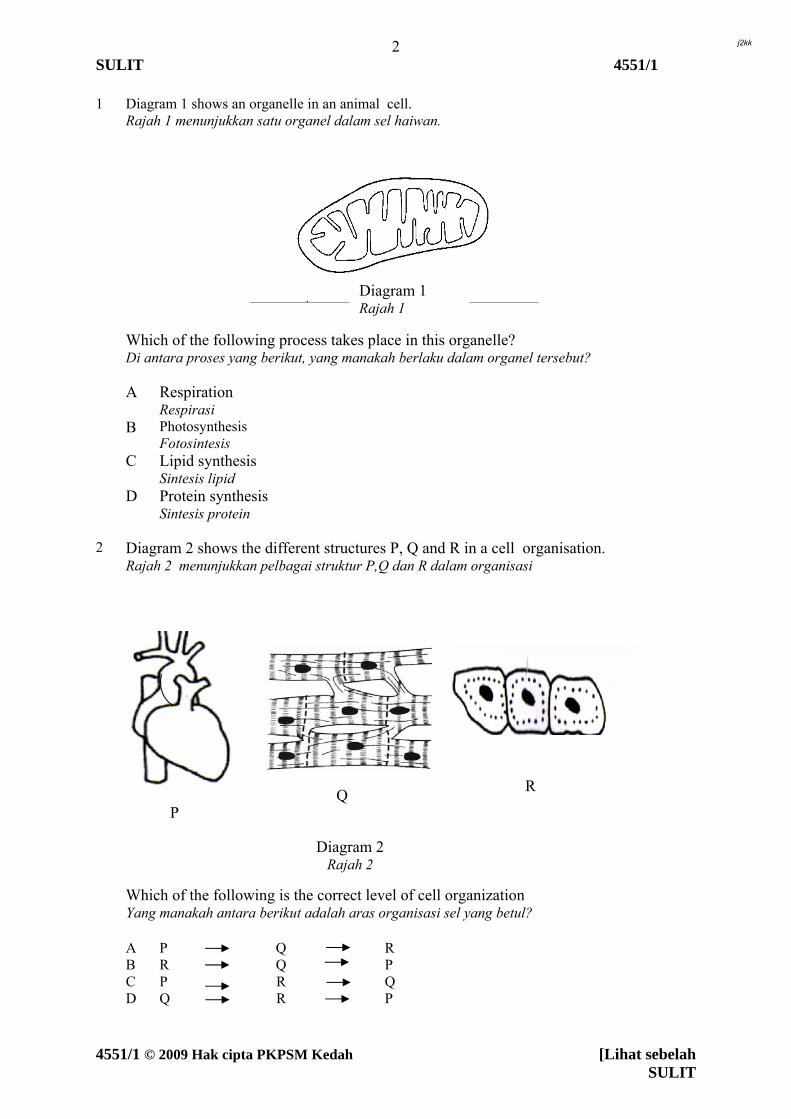
Diagram 2 shows the different structures P, Q and R in a cell organisation. Rajah 2 menunjukkan pelbagai struktur P,Q dan R dalam organisasi Which of the following is the correct level of cell organization Yang manakah antara berikut adalah aras organisasi sel yang betul?
A P Q R B R Q P C P R Q D Q R P
Diagram 1 Rajah 1
R Q
P
Diagram 2 Rajah 2
4551/1 © 2009 Hak cipta PKPSM Kedah [Lihat sebelah SULIT
j2kk
3 SULIT 4551/1
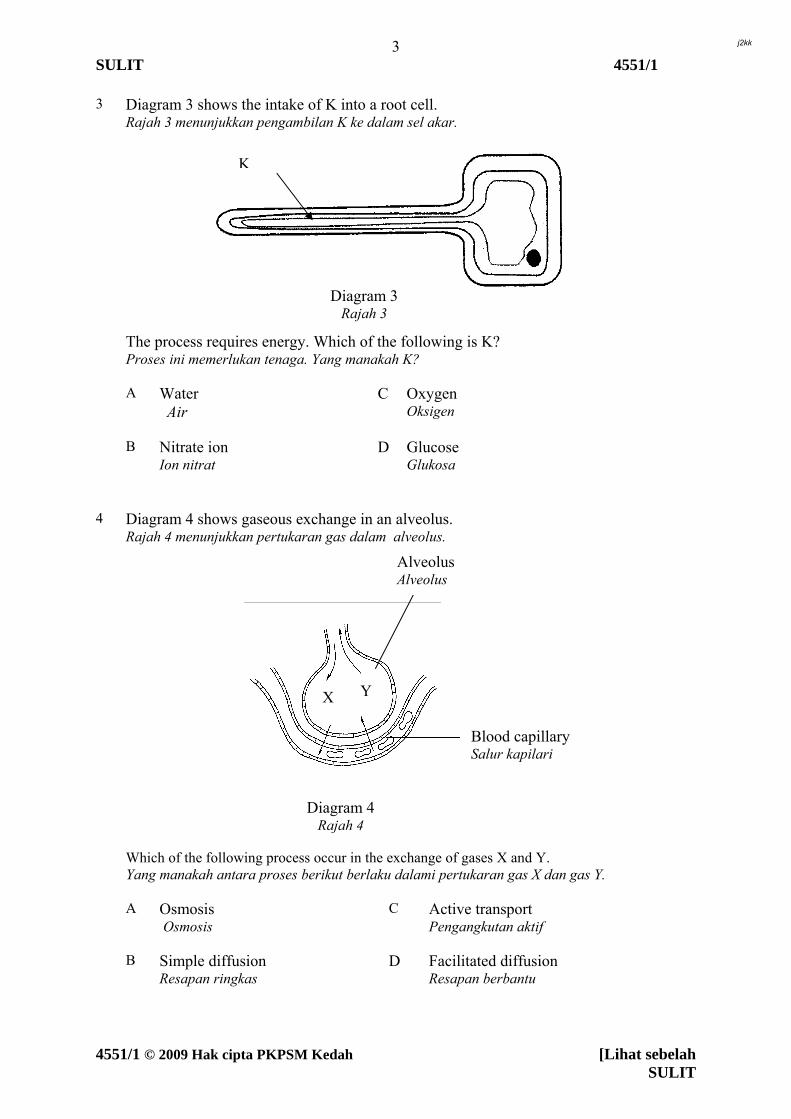
3 Diagram 3 shows the intake of K into a root cell. Rajah 3 menunjukkan pengambilan K ke dalam sel akar. The process requires energy. Which of the following is K? Proses ini memerlukan tenaga. Yang manakah K?
A Water Air
C
Oxygen Oksigen
B Nitrate ion Ion nitrat
D
Glucose Glukosa
4 Diagram 4 shows gaseous exchange in an alveolus.
Rajah 4 menunjukkan pertukaran gas dalam alveolus. Which of the following process occur in the exchange of gases X and Y. Yang manakah antara proses berikut berlaku dalami pertukaran gas X dan gas Y.
A Osmosis Osmosis
C
Active transport Pengangkutan aktif
B Simple diffusion Resapan ringkas
D
Facilitated diffusion Resapan berbantu
Diagram 3 Rajah 3
K
XY
YX
Diagram 4 Rajah 4
Blood capillary Salur kapilari
Alveolus Alveolus
4551/1 © 2009 Hak cipta PKPSM Kedah [Lihat sebelah SULIT
j2kk
4 SULIT 4551/1
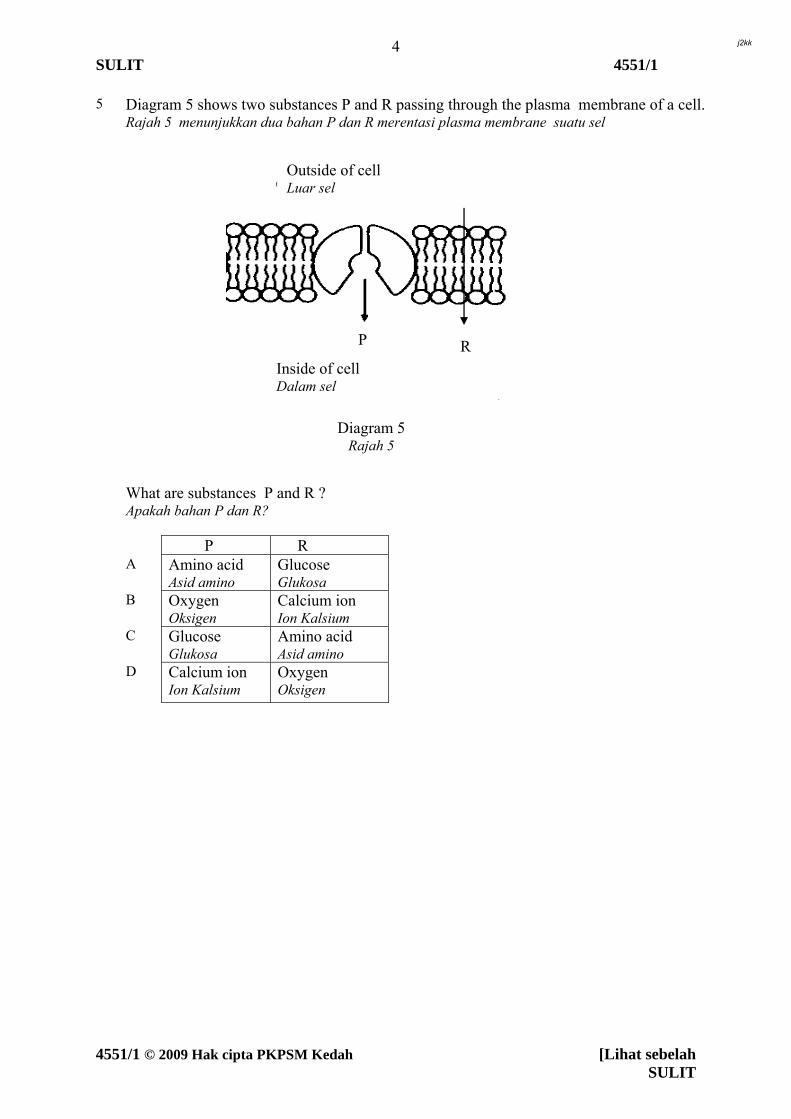
5 Diagram 5 shows two substances P and R passing through the plasma membrane of a cell. Rajah 5 menunjukkan dua bahan P dan R merentasi plasma membrane suatu sel What are substances P and R ? Apakah bahan P dan R?
P R A Amino acid
Asid amino Glucose Glukosa
B Oxygen Oksigen
Calcium ion Ion Kalsium
C Glucose Glukosa
Amino acid Asid amino
D Calcium ion Ion Kalsium
Oxygen Oksigen
Outside of cell Luar sel
P R
Inside of cell Dalam sel
Diagram 5 Rajah 5
4551/1 © 2009 Hak cipta PKPSM Kedah [Lihat sebelah SULIT
j2kk
5 SULIT 4551/1
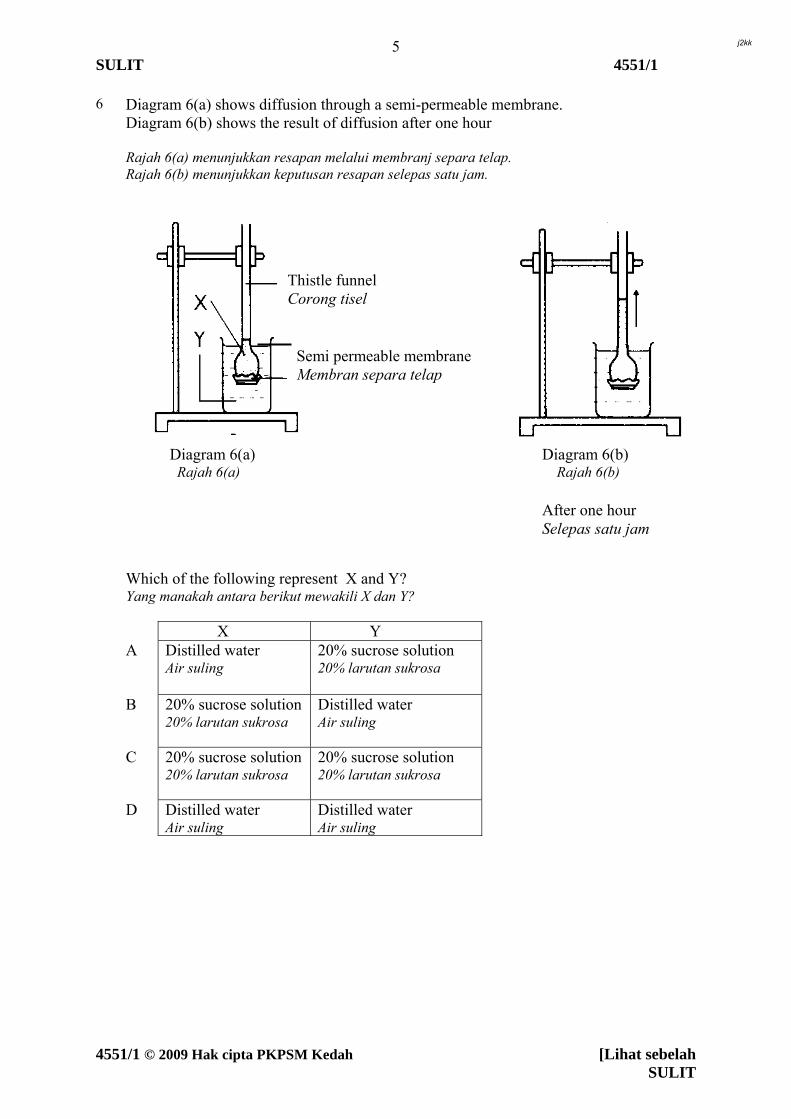
6 Diagram 6(a) shows diffusion through a semi-permeable membrane. Diagram 6(b) shows the result of diffusion after one hour Rajah 6(a) menunjukkan resapan melalui membranj separa telap. Rajah 6(b) menunjukkan keputusan resapan selepas satu jam. Which of the following represent X and Y? Yang manakah antara berikut mewakili X dan Y?
X Y A Distilled water
Air suling 20% sucrose solution 20% larutan sukrosa
B 20% sucrose solution 20% larutan sukrosa
Distilled water Air suling
C 20% sucrose solution 20% larutan sukrosa
20% sucrose solution 20% larutan sukrosa
D Distilled water Air suling
Distilled water Air suling
After one hour Selepas satu jam
Diagram 6(a) Rajah 6(a)
Diagram 6(b) Rajah 6(b)
Thistle fCorong
unnel tisel
Semi permeable membrane Membran separa telap
4551/1 © 2009 Hak cipta PKPSM Kedah [Lihat sebelah SULIT
j2kk
6 SULIT 4551/1
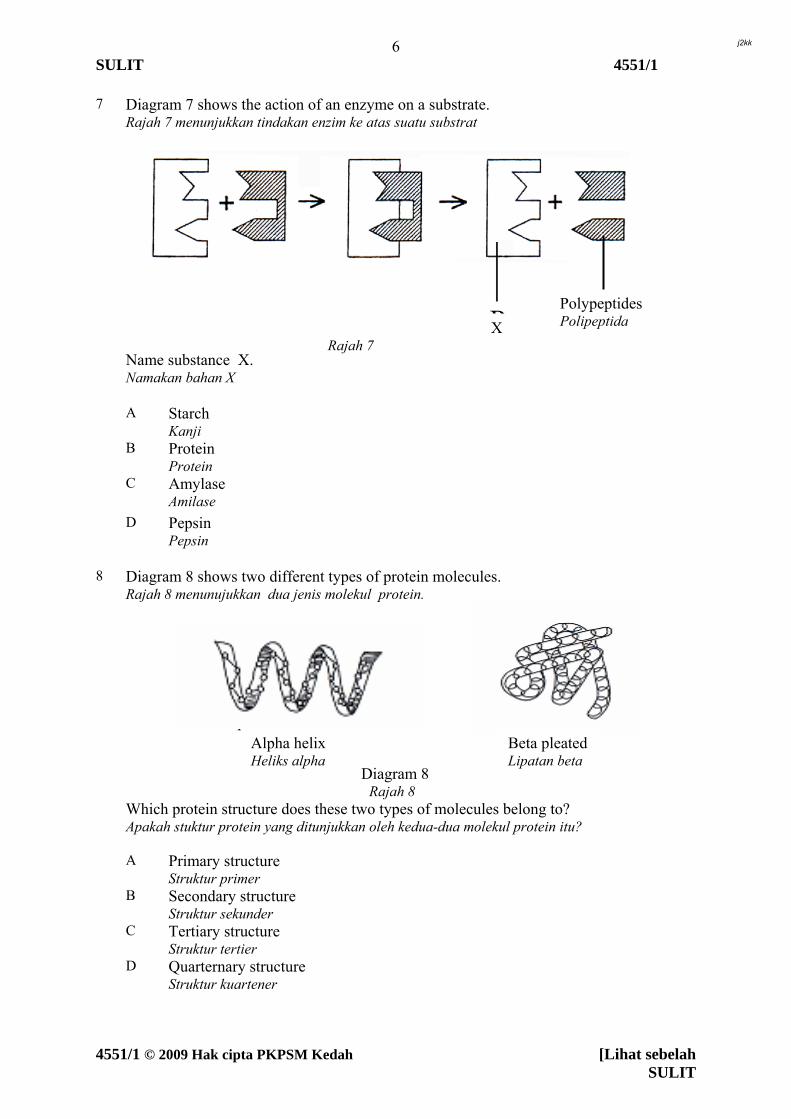
7 Diagram 7 shows the action of an enzyme on a substrate. Rajah 7 menunjukkan tindakan enzim ke atas suatu substrat Name substance X. Namakan bahan X
A Starch Kanji
B Protein Protein
C Amylase Amilase
D Pepsin Pepsin
8
Diagram 8 shows two different types of protein molecules. Rajah 8 menunujukkan dua jenis molekul protein.
Alpha helix Beta pleated
Diagram 8 Rajah 8
Which protein structure does these two types of molecules belong to? Apakah stuktur protein yang ditunjukkan oleh kedua-dua molekul protein itu?
A Primary structure Struktur primer
B Secondary structure Struktur sekunder
C Tertiary structure Struktur tertier
D Quarternary structure Struktur kuartener
Diagram 7 Rajah 7
Polypeptides Polipeptida X
Beta pleated Lipatan beta
Alpha helix Heliks alpha
4551/1 © 2009 Hak cipta PKPSM Kedah [Lihat sebelah SULIT
j2kk
7 SULIT 4551/1
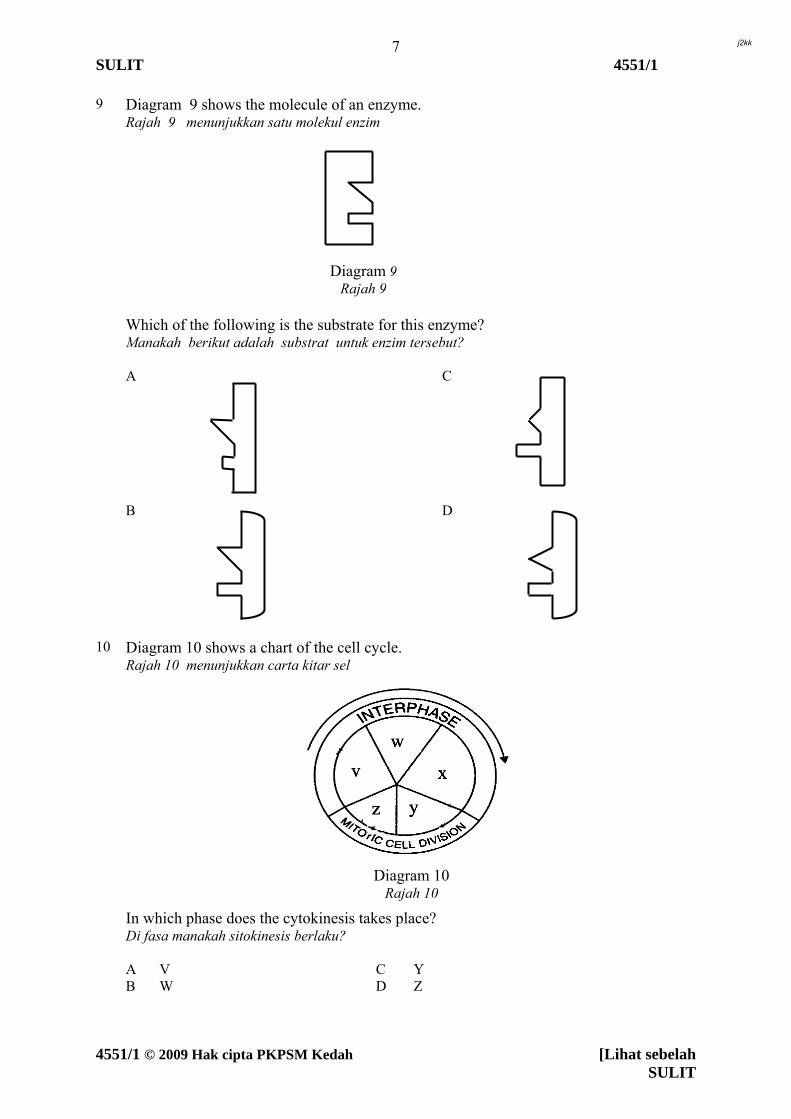
9 Diagram 9 shows the molecule of an enzyme. Rajah 9 menunjukkan satu molekul enzim Which of the following is the substrate for this enzyme? Manakah berikut adalah substrat untuk enzim tersebut?
A
C
B
D
10 Diagram 10 shows a chart of the cell cycle.
Rajah 10 menunjukkan carta kitar sel In which phase does the cytokinesis takes place? Di fasa manakah sitokinesis berlaku?
A V C Y B W D Z
Diagram 9 Rajah 9
Diagram 10 Rajah 10
4551/1 © 2009 Hak cipta PKPSM Kedah [Lihat sebelah SULIT
j2kk
8 SULIT 4551/1
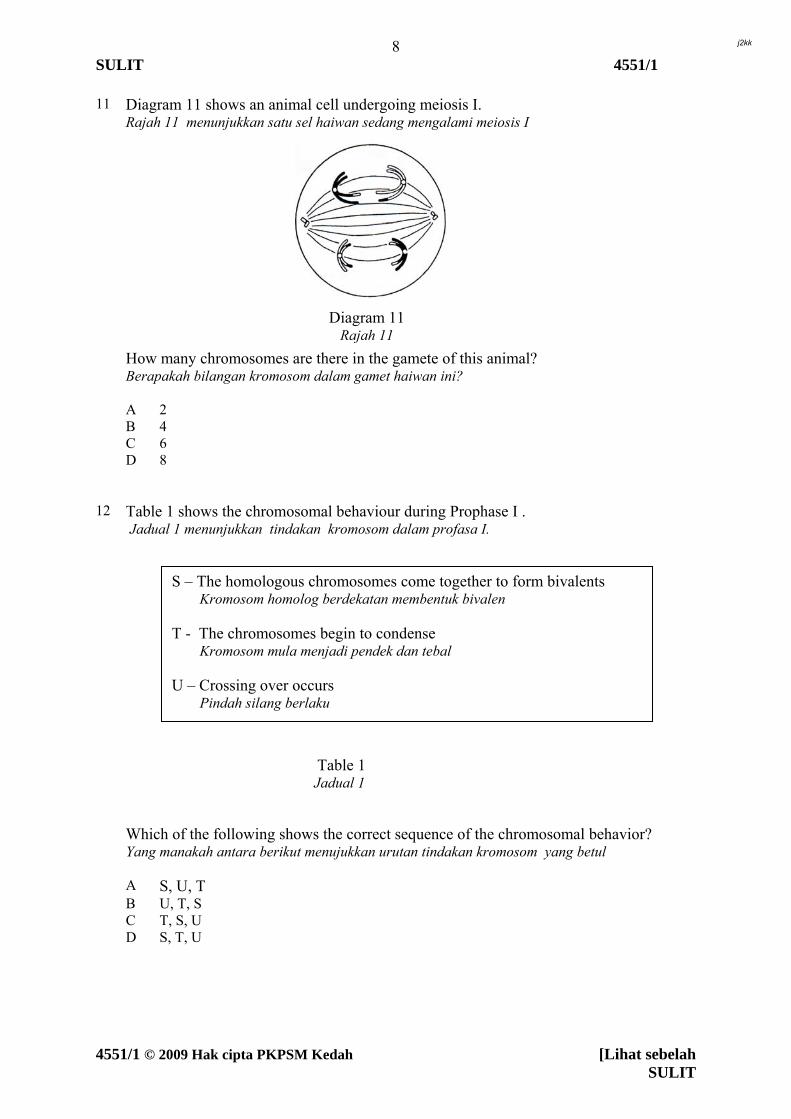
11 Diagram 11 shows an animal cell undergoing meiosis I. Rajah 11 menunjukkan satu sel haiwan sedang mengalami meiosis I How many chromosomes are there in the gamete of this animal? Berapakah bilangan kromosom dalam gamet haiwan ini?
A 2 B 4 C 6 D 8
12 Table 1 shows the chromosomal behaviour during Prophase I . Jadual 1 menunjukkan tindakan kromosom dalam profasa I.
Table 1
Jadual 1 Which of the following shows the correct sequence of the chromosomal behavior? Yang manakah antara berikut menujukkan urutan tindakan kromosom yang betul
A S, U, T B U, T, S C T, S, U D S, T, U
Diagram 11 Rajah 11
S – The homologous chromosomes come together to form bivalents Kromosom homolog berdekatan membentuk bivalen T - The chromosomes begin to condense Kromosom mula menjadi pendek dan tebal U – Crossing over occurs Pindah silang berlaku
4551/1 © 2009 Hak cipta PKPSM Kedah [Lihat sebelah SULIT
j2kk
9 SULIT 4551/1
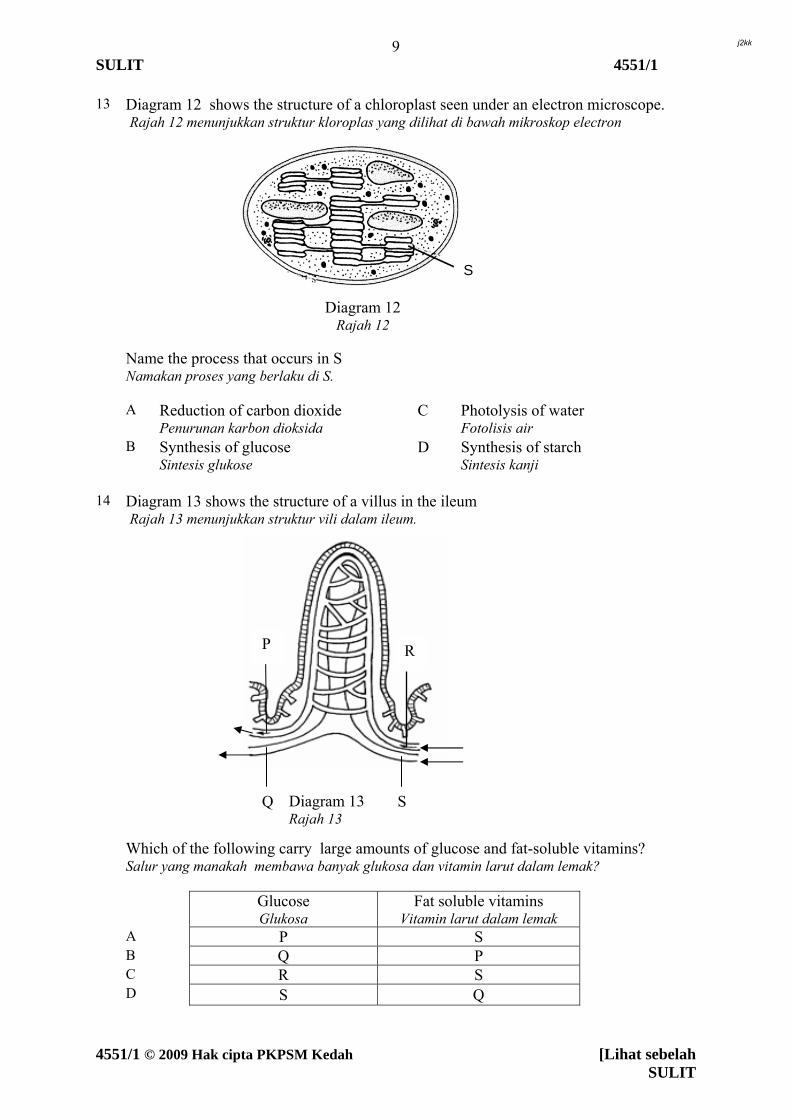
13 Diagram 12 shows the structure of a chloroplast seen under an electron microscope. Rajah 12 menunjukkan struktur kloroplas yang dilihat di bawah mikroskop electron Name the process that occurs in S Namakan proses yang berlaku di S.
A Reduction of carbon dioxide Penurunan karbon dioksida
C
Photolysis of water Fotolisis air
B Synthesis of glucose Sintesis glukose
D
Synthesis of starch Sintesis kanji
14
Diagram 13 shows the structure of a villus in the ileum Rajah 13 menunjukkan struktur vili dalam ileum. Which of the following carry large amounts of glucose and fat-soluble vitamins? Salur yang manakah membawa banyak glukosa dan vitamin larut dalam lemak?
Glucose Glukosa
Fat soluble vitamins Vitamin larut dalam lemak
A P S B Q P C R S D S Q
S
Diagram 12 Rajah 12
Diagram 13 Rajah 13
P R
S Q
4551/1 © 2009 Hak cipta PKPSM Kedah [Lihat sebelah SULIT
j2kk
10 SULIT 4551/1
15
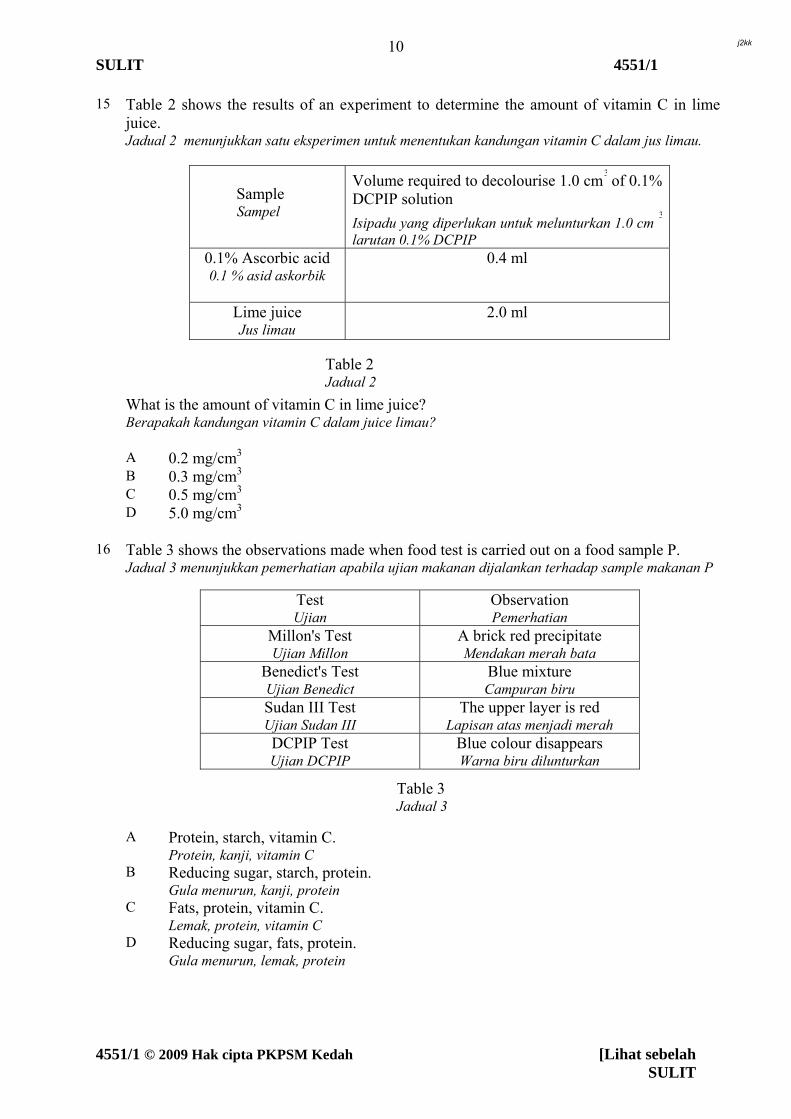
Table 2 shows the results of an experiment to determine the amount of vitamin C in lime juice. Jadual 2 menunjukkan satu eksperimen untuk menentukan kandungan vitamin C dalam jus limau.
Sample Sampel
Volume required to decolourise 1.0 cm3 of 0.1%
DCPIP solution
Isipadu yang diperlukan untuk melunturkan 1.0 cm 3
larutan 0.1% DCPIP
0.1% Ascorbic acid 0.1 % asid askorbik
0.4 ml
Lime juice Jus limau
2.0 ml
What is the amount of vitamin C in lime juice? Berapakah kandungan vitamin C dalam juice limau?
A 0.2 mg/cm3 B 0.3 mg/cm3 C 0.5 mg/cm3 D 5.0 mg/cm3 16 Table 3 shows the observations made when food test is carried out on a food sample P.
Jadual 3 menunjukkan pemerhatian apabila ujian makanan dijalankan terhadap sample makanan P
Test Ujian
Observation Pemerhatian
Millon's Test Ujian Millon
A brick red precipitate Mendakan merah bata
Benedict's Test Ujian Benedict
Blue mixture Campuran biru
Sudan III Test Ujian Sudan III
The upper layer is red Lapisan atas menjadi merah
DCPIP Test Ujian DCPIP
Blue colour disappears Warna biru dilunturkan
A Protein, starch, vitamin C. Protein, kanji, vitamin C
B Reducing sugar, starch, protein. Gula menurun, kanji, protein
C Fats, protein, vitamin C. Lemak, protein, vitamin C
D Reducing sugar, fats, protein. Gula menurun, lemak, protein
Table 2 Jadual 2
Table 3 Jadual 3
4551/1 © 2009 Hak cipta PKPSM Kedah [Lihat sebelah SULIT
j2kk
11 SULIT 4551/1
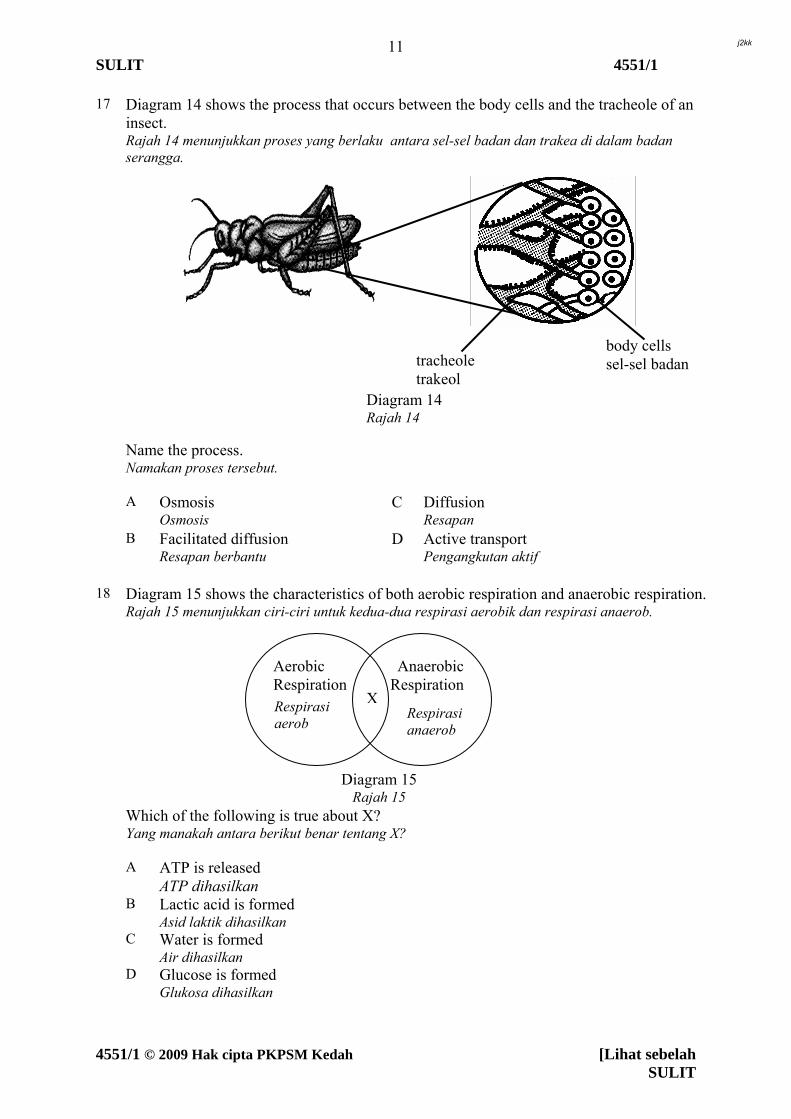
17 Diagram 14 shows the process that occurs between the body cells and the tracheole of an insect. Rajah 14 menunjukkan proses yang berlaku antara sel-sel badan dan trakea di dalam badan serangga. Name the process. Namakan proses tersebut.
A Osmosis Osmosis
C
Diffusion Resapan
B Facilitated diffusion Resapan berbantu
D
Active transport Pengangkutan aktif
18 Diagram 15 shows the characteristics of both aerobic respiration and anaerobic respiration.
Rajah 15 menunjukkan ciri-ciri untuk kedua-dua respirasi aerobik dan respirasi anaerob.
Which of the following is true about X? Yang manakah antara berikut benar tentang X?
A ATP is released
ATP dihasilkan B Lactic acid is formed
Asid laktik dihasilkan C Water is formed
Air dihasilkan D Glucose is formed
Glukosa dihasilkan
Diagram 14 Rajah 14
body cells sel-sel badan tracheole
trakeol
Anaerobic Respiration
Aerobic Respiration
X
Diagram 15
Respirasi aerob
Respirasi anaerob
Rajah 15
4551/1 © 2009 Hak cipta PKPSM Kedah [Lihat sebelah SULIT
j2kk
12 SULIT 4551/1
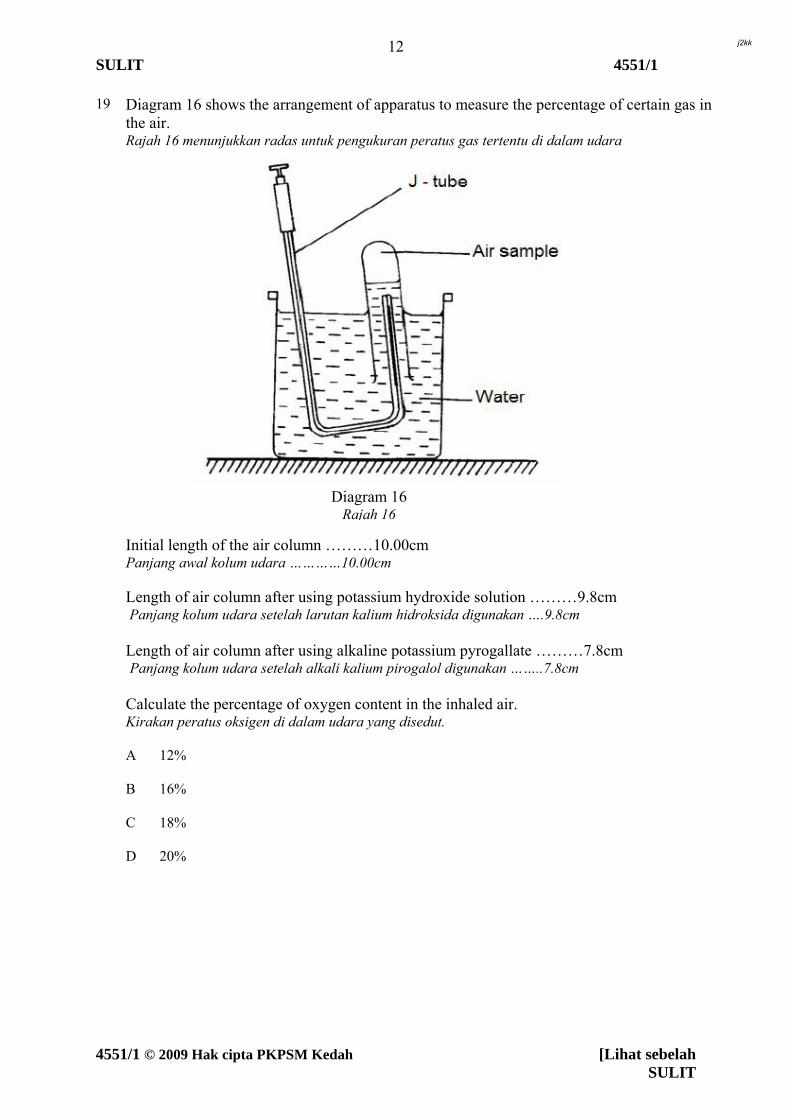
19 Diagram 16 shows the arrangement of apparatus to measure the percentage of certain gas in the air. Rajah 16 menunjukkan radas untuk pengukuran peratus gas tertentu di dalam udara Initial length of the air column ………10.00cm Panjang awal kolum udara …………10.00cm Length of air column after using potassium hydroxide solution ………9.8cm Panjang kolum udara setelah larutan kalium hidroksida digunakan ….9.8cm Length of air column after using alkaline potassium pyrogallate ………7.8cm Panjang kolum udara setelah alkali kalium pirogalol digunakan ……..7.8cm Calculate the percentage of oxygen content in the inhaled air. Kirakan peratus oksigen di dalam udara yang disedut.
A 12%
B 16%
C 18%
D 20%
Diagram 16
Rajah 16
4551/1 © 2009 Hak cipta PKPSM Kedah [Lihat sebelah SULIT
j2kk
13 SULIT 4551/1
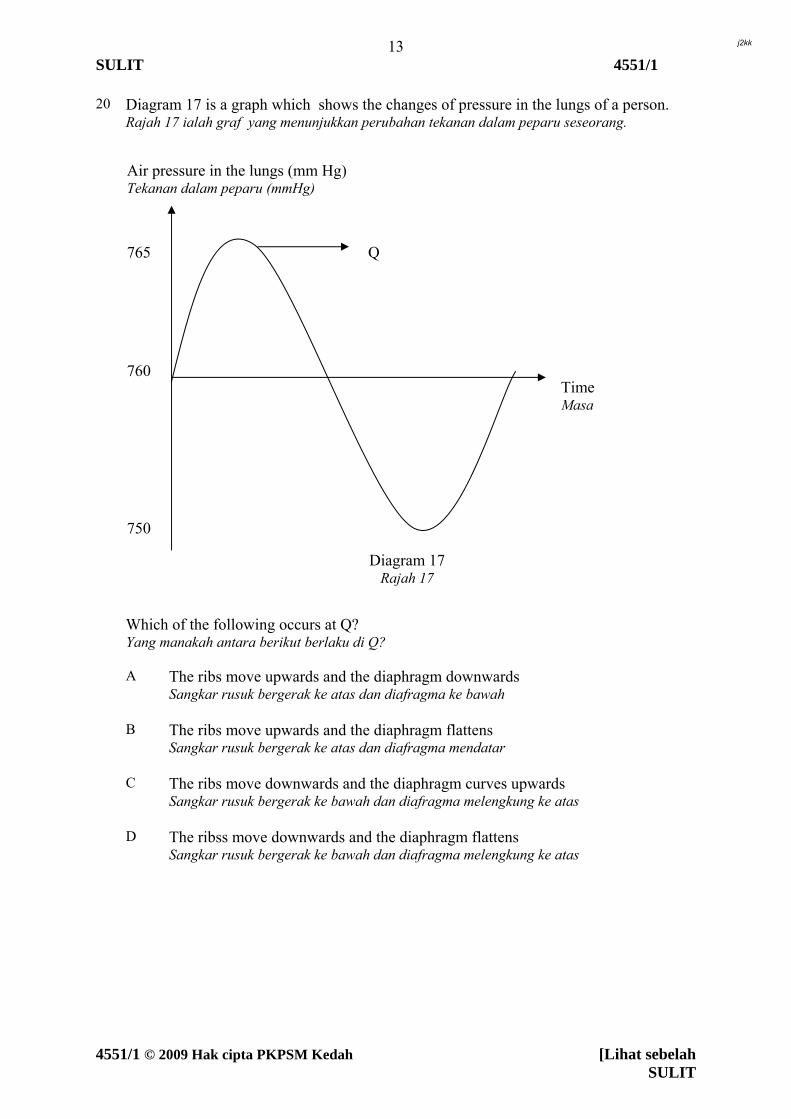
20 Diagram 17 is a graph which shows the changes of pressure in the lungs of a person. Rajah 17 ialah graf yang menunjukkan perubahan tekanan dalam peparu seseorang. Which of the following occurs at Q? Yang manakah antara berikut berlaku di Q?
A The ribs move upwards and the diaphragm downwards Sangkar rusuk bergerak ke atas dan diafragma ke bawah
B The ribs move upwards and the diaphragm flattens Sangkar rusuk bergerak ke atas dan diafragma mendatar
C The ribs move downwards and the diaphragm curves upwards Sangkar rusuk bergerak ke bawah dan diafragma melengkung ke atas
D The ribss move downwards and the diaphragm flattens Sangkar rusuk bergerak ke bawah dan diafragma melengkung ke atas
Air pressure in the lungs (mm Hg) Tekanan dalam peparu (mmHg)
Diagram 17 Rajah 17
Q
Time Masa
765
760
750
4551/1 © 2009 Hak cipta PKPSM Kedah [Lihat sebelah SULIT
j2kk
14 SULIT 4551/1
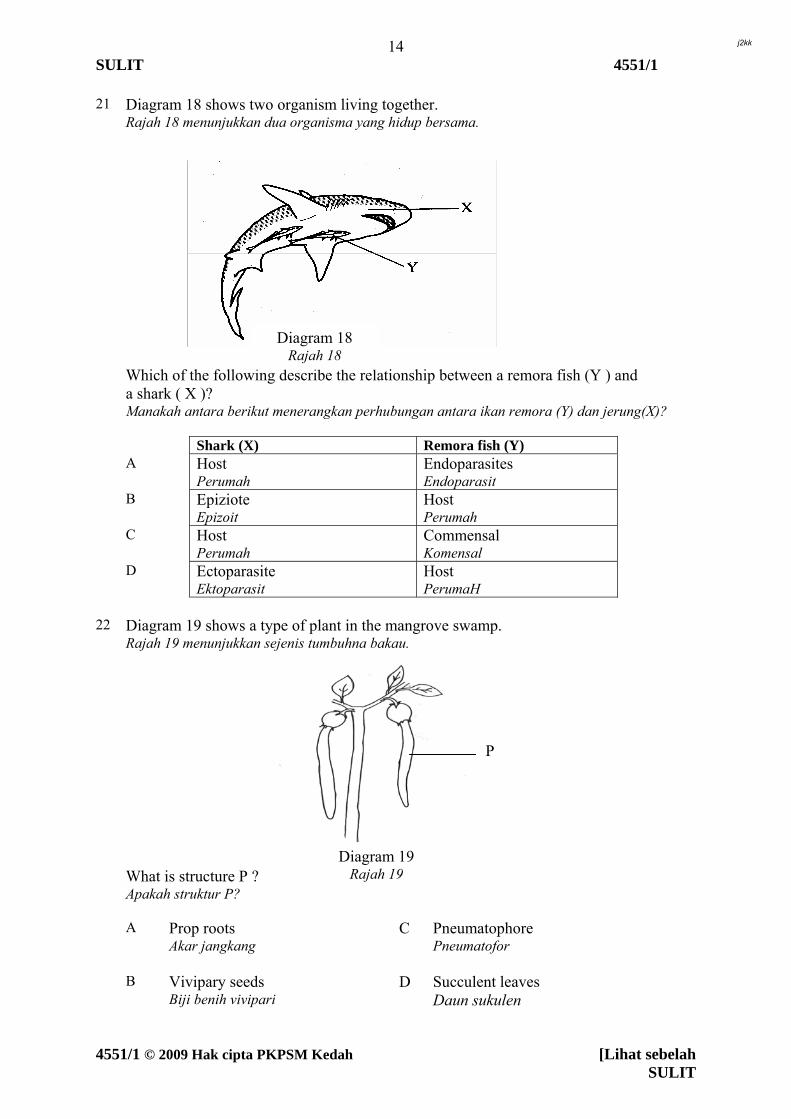
21 Diagram 18 shows two organism living together. Rajah 18 menunjukkan dua organisma yang hidup bersama. Which of the following describe the relationship between a remora fish (Y ) and a shark ( X )? Manakah antara berikut menerangkan perhubungan antara ikan remora (Y) dan jerung(X)?
Shark (X) Remora fish (Y) A Host
Perumah Endoparasites Endoparasit
B Epiziote Epizoit
Host Perumah
C Host Perumah
Commensal Komensal
D Ectoparasite Ektoparasit
Host PerumaH
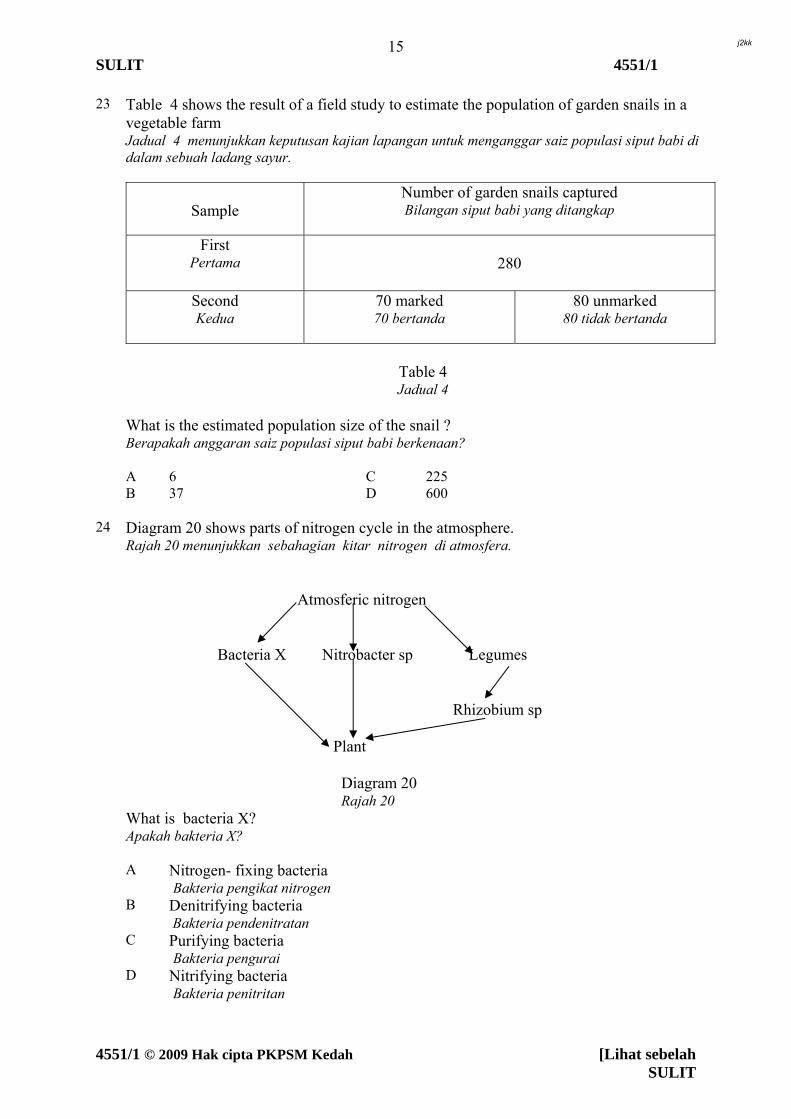
22 Diagram 19 shows a type of plant in the mangrove swamp.
Rajah 19 menunjukkan sejenis tumbuhna bakau.
What is structure P ? Apakah struktur P?
A Prop roots Akar jangkang
C
Pneumatophore Pneumatofor
B Vivipary seeds Biji benih vivipari
D
Succulent leaves Daun sukulen
Diagram 18 Rajah 18
P
Diagram 19 Rajah 19
4551/1 © 2009 Hak cipta PKPSM Kedah [Lihat sebelah SULIT
j2kk
15 SULIT 4551/1
23 Table 4 shows the result of a field study to estimate the population of garden snails in a vegetable farm Jadual 4 menunjukkan keputusan kajian lapangan untuk menganggar saiz populasi siput babi di dalam sebuah ladang sayur.
Sample
Number of garden snails captured Bilangan siput babi yang ditangkap
First
Pertama
280
Second Kedua
70 marked 70 bertanda
80 unmarked 80 tidak bertanda
Table 4 Jadual 4
What is the estimated population size of the snail ? Berapakah anggaran saiz populasi siput babi berkenaan?
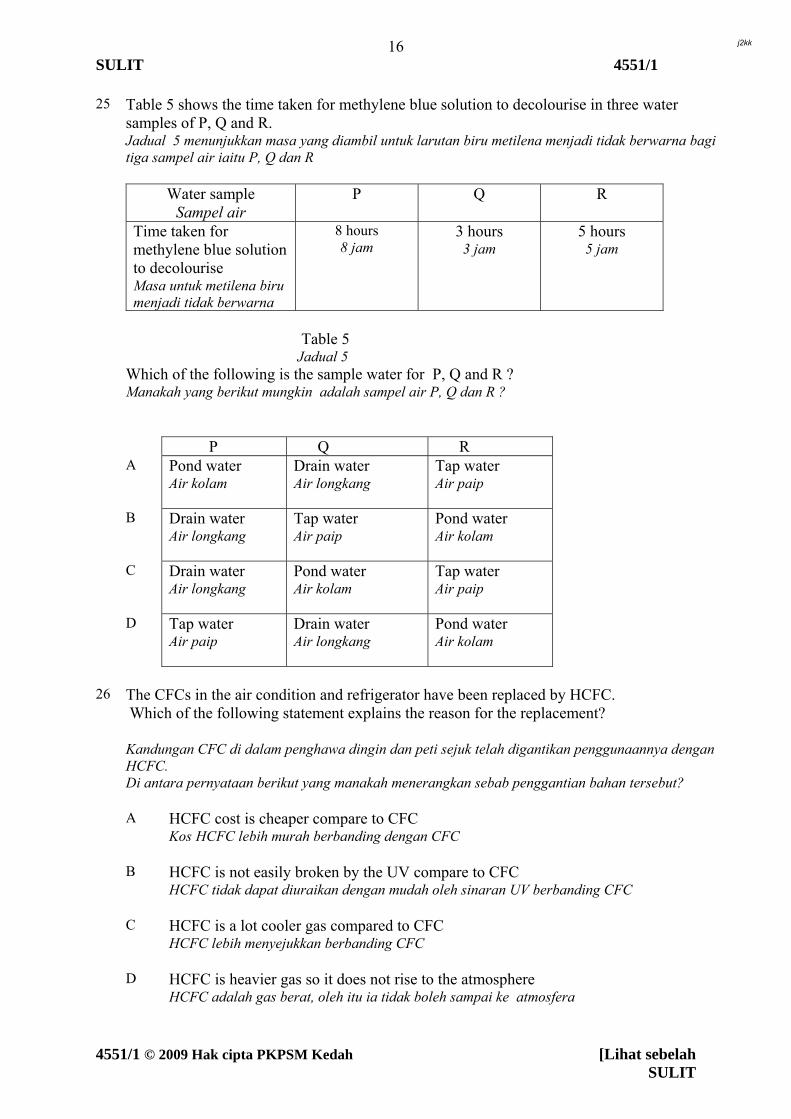
A 6 C 225 B 37 D 600 24 Diagram 20 shows parts of nitrogen cycle in the atmosphere.
Rajah 20 menunjukkan sebahagian kitar nitrogen di atmosfera. Atmosferic nitrogen Bacteria X Nitrobacter sp Legumes Rhizobium sp Plant Diagram 20 Rajah 20 What is bacteria X? Apakah bakteria X?
A Nitrogen- fixing bacteria Bakteria pengikat nitrogen
B Denitrifying bacteria Bakteria pendenitratan
C Purifying bacteria Bakteria pengurai
D Nitrifying bacteria Bakteria penitritan
4551/1 © 2009 Hak cipta PKPSM Kedah [Lihat sebelah SULIT
j2kk
16 SULIT 4551/1
25 Table 5 shows the time taken for methylene blue solution to decolourise in three water samples of P, Q and R. Jadual 5 menunjukkan masa yang diambil untuk larutan biru metilena menjadi tidak berwarna bagi tiga sampel air iaitu P, Q dan R
Water sample Sampel air
P Q R
Time taken for methylene blue solution to decolourise Masa untuk metilena biru menjadi tidak berwarna
8 hours 8 jam
3 hours 3 jam
5 hours 5 jam
Table 5 Jadual 5 Which of the following is the sample water for P, Q and R ? Manakah yang berikut mungkin adalah sampel air P, Q dan R ?
P Q R A Pond water
Air kolam Drain water Air longkang
Tap water Air paip
B Drain water Air longkang
Tap water Air paip
Pond water Air kolam
C Drain water Air longkang
Pond water Air kolam
Tap water Air paip
D Tap water Air paip
Drain water Air longkang
Pond water Air kolam
26 The CFCs in the air condition and refrigerator have been replaced by HCFC.
Which of the following statement explains the reason for the replacement? Kandungan CFC di dalam penghawa dingin dan peti sejuk telah digantikan penggunaannya dengan HCFC. Di antara pernyataan berikut yang manakah menerangkan sebab penggantian bahan tersebut?
A HCFC cost is cheaper compare to CFC Kos HCFC lebih murah berbanding dengan CFC
B HCFC is not easily broken by the UV compare to CFC HCFC tidak dapat diuraikan dengan mudah oleh sinaran UV berbanding CFC
C HCFC is a lot cooler gas compared to CFC HCFC lebih menyejukkan berbanding CFC
D HCFC is heavier gas so it does not rise to the atmosphere HCFC adalah gas berat, oleh itu ia tidak boleh sampai ke atmosfera
4551/1 © 2009 Hak cipta PKPSM Kedah [Lihat sebelah SULIT
j2kk
17 SULIT 4551/1
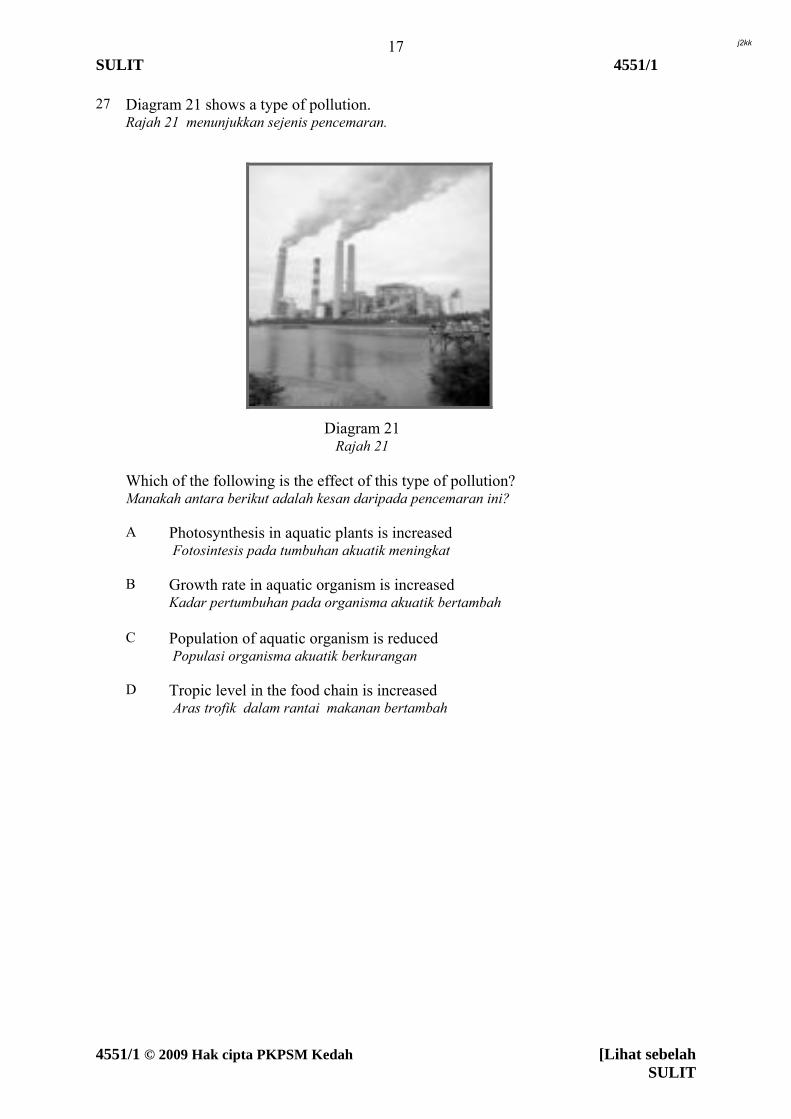
27 Diagram 21 shows a type of pollution. Rajah 21 menunjukkan sejenis pencemaran. Which of the following is the effect of this type of pollution? Manakah antara berikut adalah kesan daripada pencemaran ini?
A Photosynthesis in aquatic plants is increased Fotosintesis pada tumbuhan akuatik meningkat
B Growth rate in aquatic organism is increased Kadar pertumbuhan pada organisma akuatik bertambah
C Population of aquatic organism is reduced Populasi organisma akuatik berkurangan
D
Tropic level in the food chain is increased Aras trofik dalam rantai makanan bertambah
Diagram 21 Rajah 21
4551/1 © 2009 Hak cipta PKPSM Kedah [Lihat sebelah SULIT
j2kk
18 SULIT 4551/1
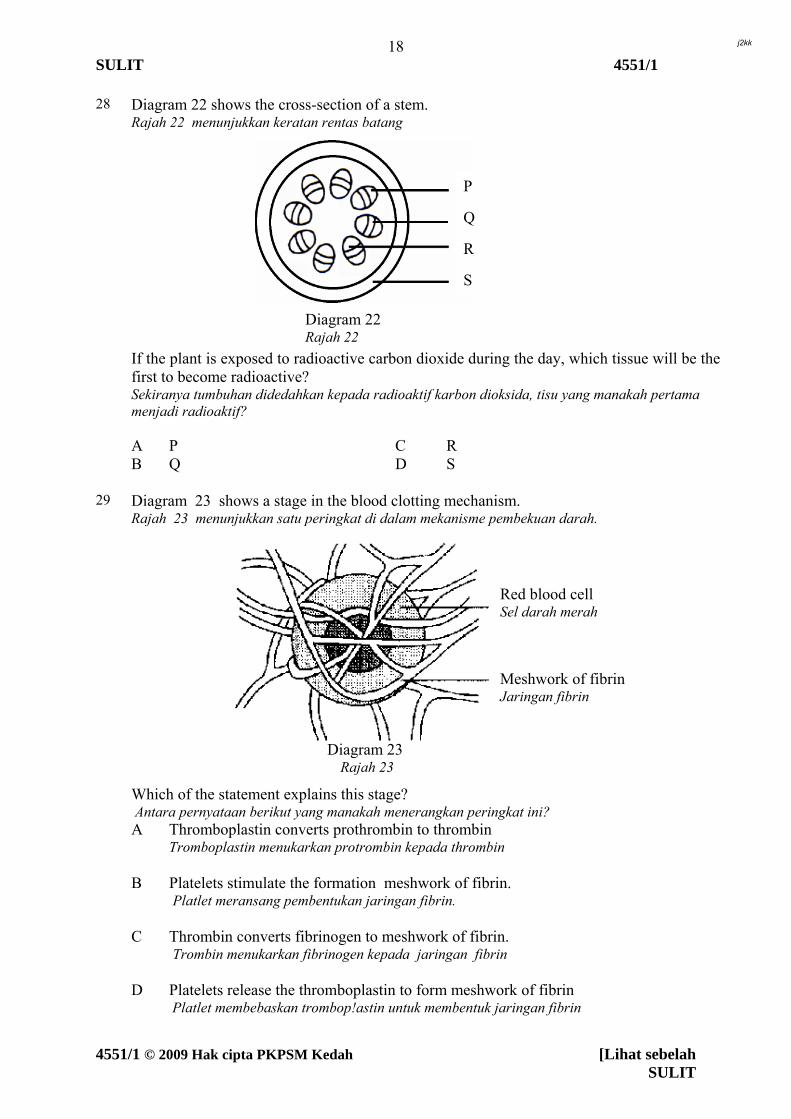
28
Diagram 22 shows the cross-section of a stem. Rajah 22 menunjukkan keratan rentas batang If the plant is exposed to radioactive carbon dioxide during the day, which tissue will be the first to become radioactive? Sekiranya tumbuhan didedahkan kepada radioaktif karbon dioksida, tisu yang manakah pertama menjadi radioaktif?
A P C R B Q D S 29 Diagram 23 shows a stage in the blood clotting mechanism.
Rajah 23 menunjukkan satu peringkat di dalam mekanisme pembekuan darah.
Which of the statement explains this stage? Antara pernyataan berikut yang manakah menerangkan peringkat ini?
A Thromboplastin converts prothrombin to thrombin Tromboplastin menukarkan protrombin kepada thrombin
B Platelets stimulate the formation meshwork of fibrin. Platlet meransang pembentukan jaringan fibrin.
C Thrombin converts fibrinogen to meshwork of fibrin. Trombin menukarkan fibrinogen kepada jaringan fibrin
D Platelets release the thromboplastin to form meshwork of fibrin Platlet membebaskan trombop!astin untuk membentuk jaringan fibrin
Diagram 22 Rajah 22
P
Q
R
S
Diagram 23 Rajah 23
Red blood cell Sel darah merah
Meshwork of fibrin Jaringan fibrin
4551/1 © 2009 Hak cipta PKPSM Kedah [Lihat sebelah SULIT
j2kk
19 SULIT 4551/1
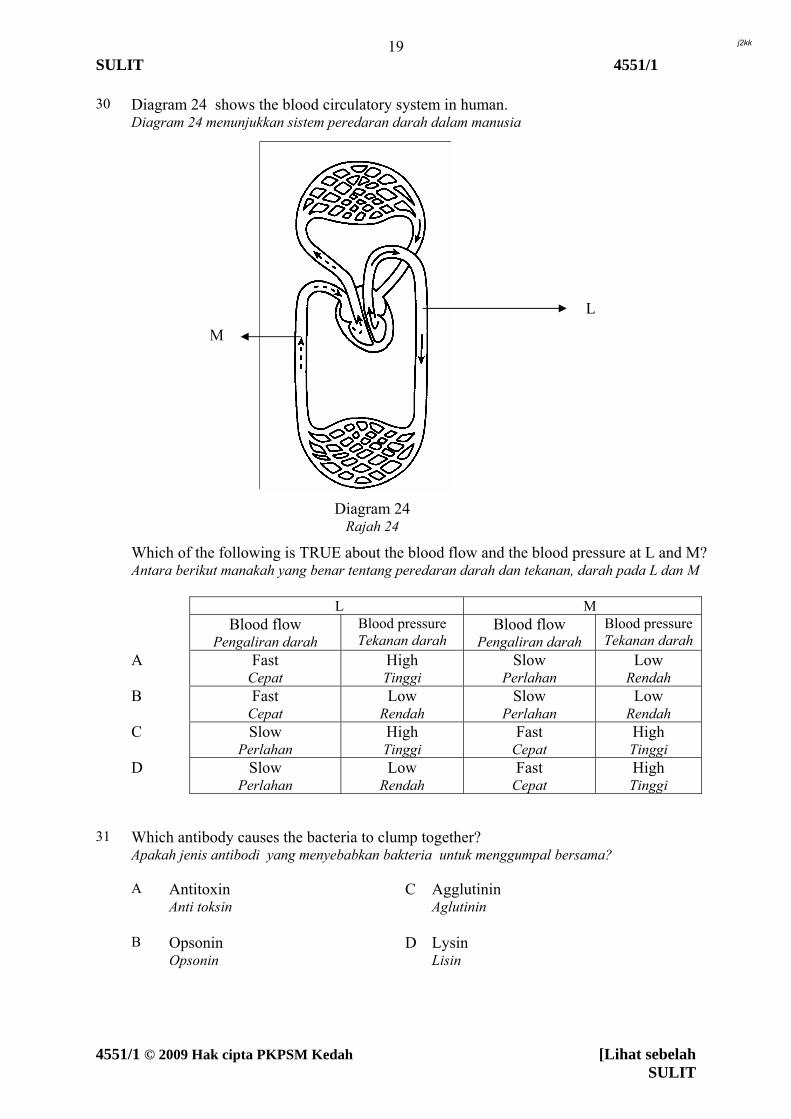
30 Diagram 24 shows the blood circulatory system in human. Diagram 24 menunjukkan sistem peredaran darah dalam manusia Which of the following is TRUE about the blood flow and the blood pressure at L and M? Antara berikut manakah yang benar tentang peredaran darah dan tekanan, darah pada L dan M
L M Blood flow
Pengaliran darah Blood pressure Tekanan darah
Blood flow Pengaliran darah
Blood pressure Tekanan darah
A Fast Cepat
High Tinggi
Slow Perlahan
Low Rendah
B Fast Cepat
Low Rendah
Slow Perlahan
Low Rendah
C Slow Perlahan
High Tinggi
Fast Cepat
High Tinggi
D Slow Perlahan
Low Rendah
Fast Cepat
High Tinggi
31 Which antibody causes the bacteria to clump together? Apakah jenis antibodi yang menyebabkan bakteria untuk menggumpal bersama?
A Antitoxin Anti toksin
C
Agglutinin Aglutinin
B Opsonin Opsonin
D
Lysin Lisin
M
L
Diagram 24 Rajah 24
4551/1 © 2009 Hak cipta PKPSM Kedah [Lihat sebelah SULIT
j2kk
20 SULIT 4551/1
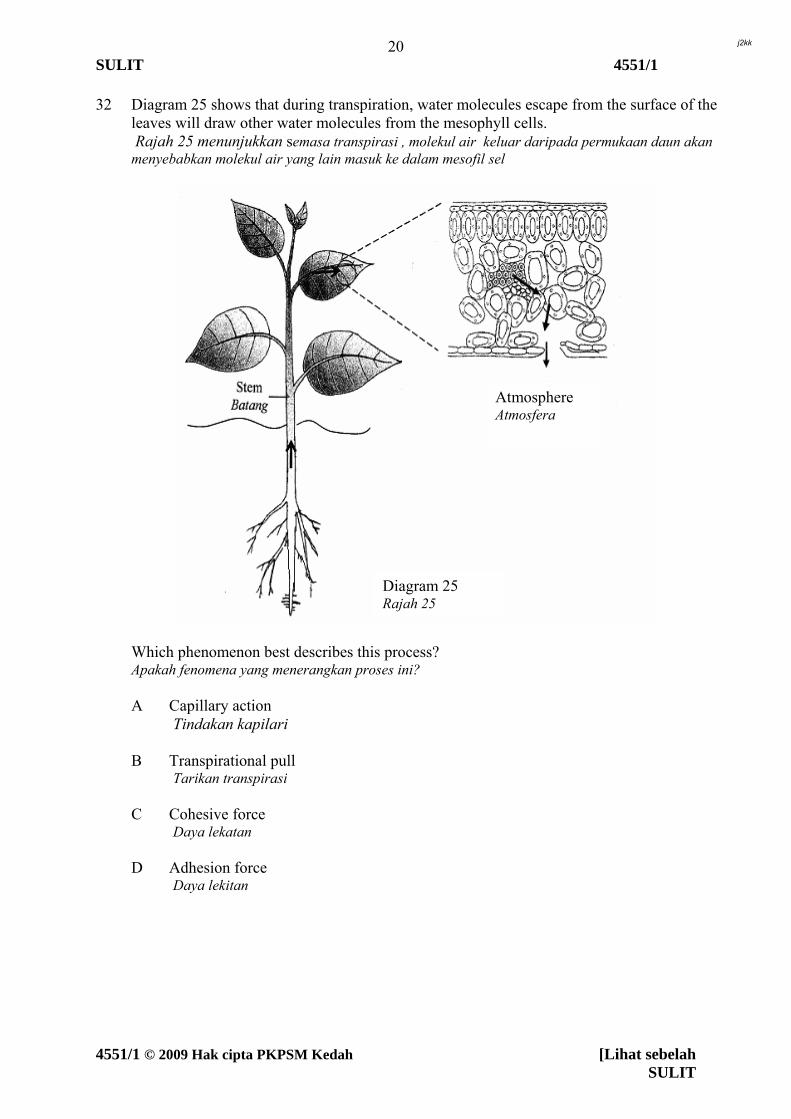
32 Diagram 25 shows that during transpiration, water molecules escape from the surface of the leaves will draw other water molecules from the mesophyll cells. Rajah 25 menunjukkan semasa transpirasi , molekul air keluar daripada permukaan daun akan menyebabkan molekul air yang lain masuk ke dalam mesofil sel Which phenomenon best describes this process? Apakah fenomena yang menerangkan proses ini?
A Capillary action Tindakan kapilari
B Transpirational pull Tarikan transpirasi
C
Cohesive force Daya lekatan
D
Adhesion force Daya lekitan
Diagram 26 Rajah 26
Atmosphere Atmosfera
Diagram 25 Rajah 25
4551/1 © 2009 Hak cipta PKPSM Kedah [Lihat sebelah SULIT
j2kk
21 SULIT 4551/1
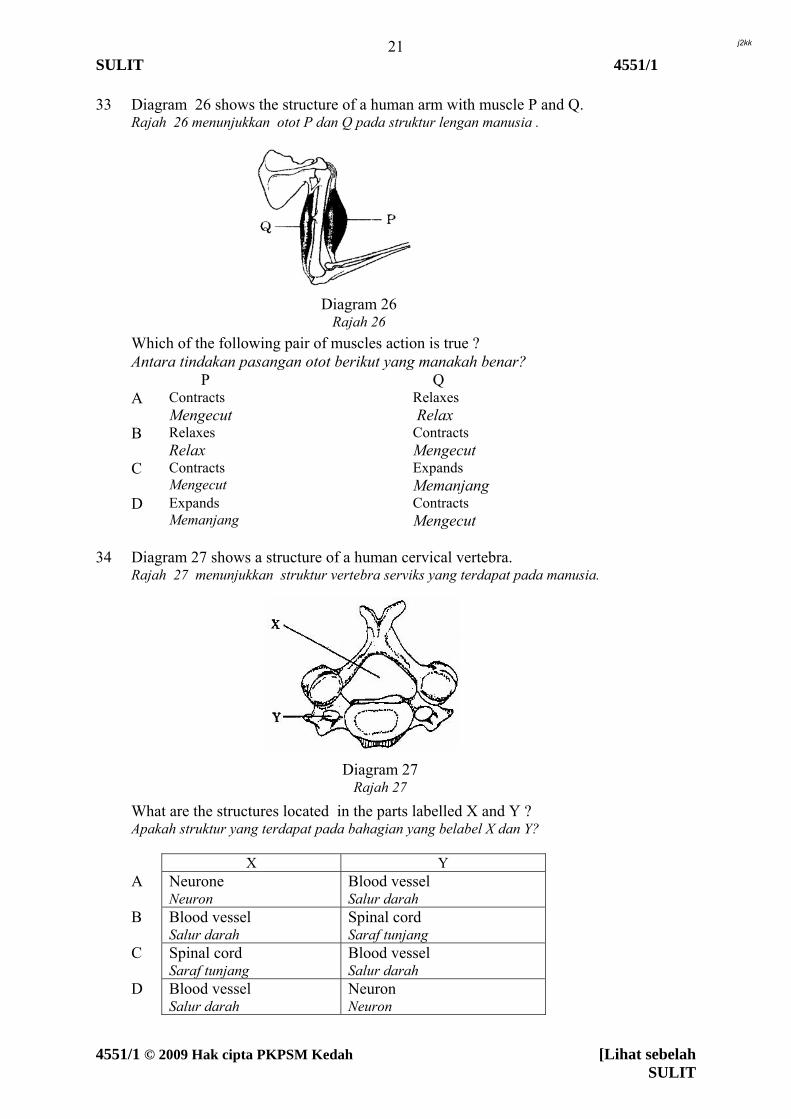
33 Diagram 26 shows the structure of a human arm with muscle P and Q. Rajah 26 menunjukkan otot P dan Q pada struktur lengan manusia . Which of the following pair of muscles action is true ? Antara tindakan pasangan otot berikut yang manakah benar?
P Q A Contracts
Mengecut Relaxes Relax
B Relaxes Relax
Contracts Mengecut
C Contracts Mengecut
Expands Memanjang
D Expands Memanjang
Contracts Mengecut
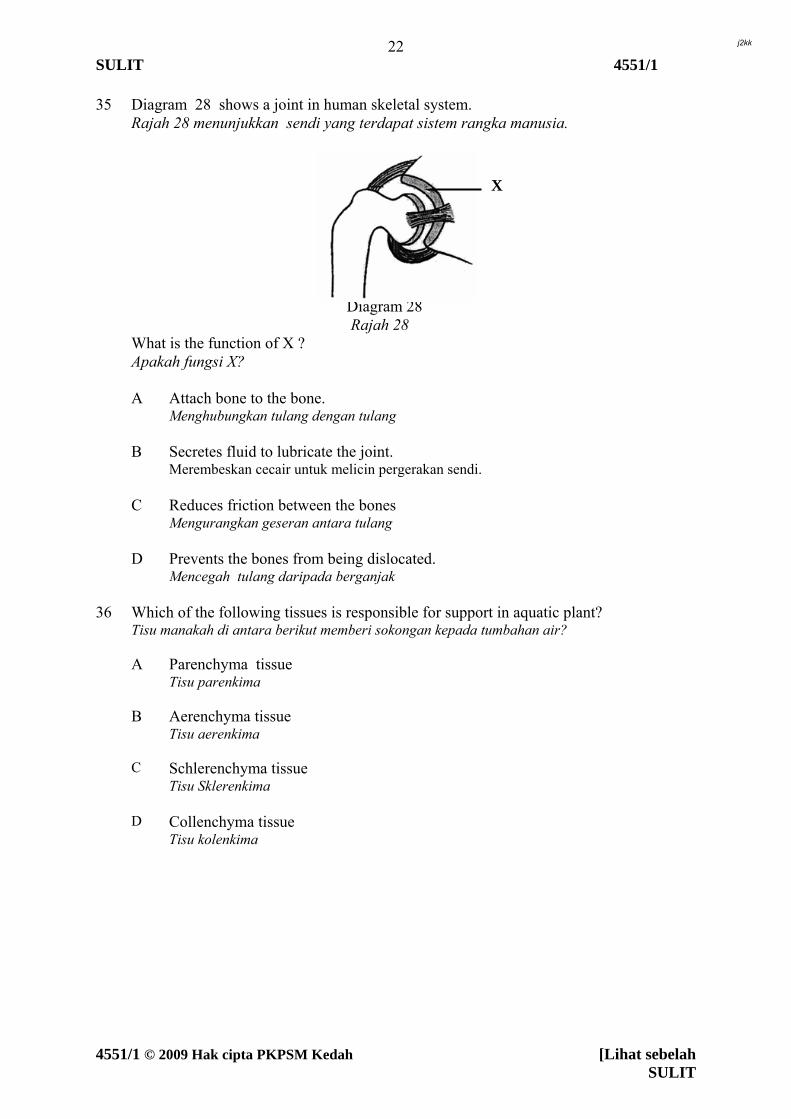
34 Diagram 27 shows a structure of a human cervical vertebra. Rajah 27 menunjukkan struktur vertebra serviks yang terdapat pada manusia. What are the structures located in the parts labelled X and Y ? Apakah struktur yang terdapat pada bahagian yang belabel X dan Y?
X Y A Neurone
Neuron Blood vessel Salur darah
B Blood vessel Salur darah
Spinal cord Saraf tunjang
C Spinal cord Saraf tunjang
Blood vessel Salur darah
D Blood vessel Salur darah
Neuron Neuron
Diagram 26 Rajah 26
Diagram 27 Rajah 27
4551/1 © 2009 Hak cipta PKPSM Kedah [Lihat sebelah SULIT
j2kk
22 SULIT 4551/1
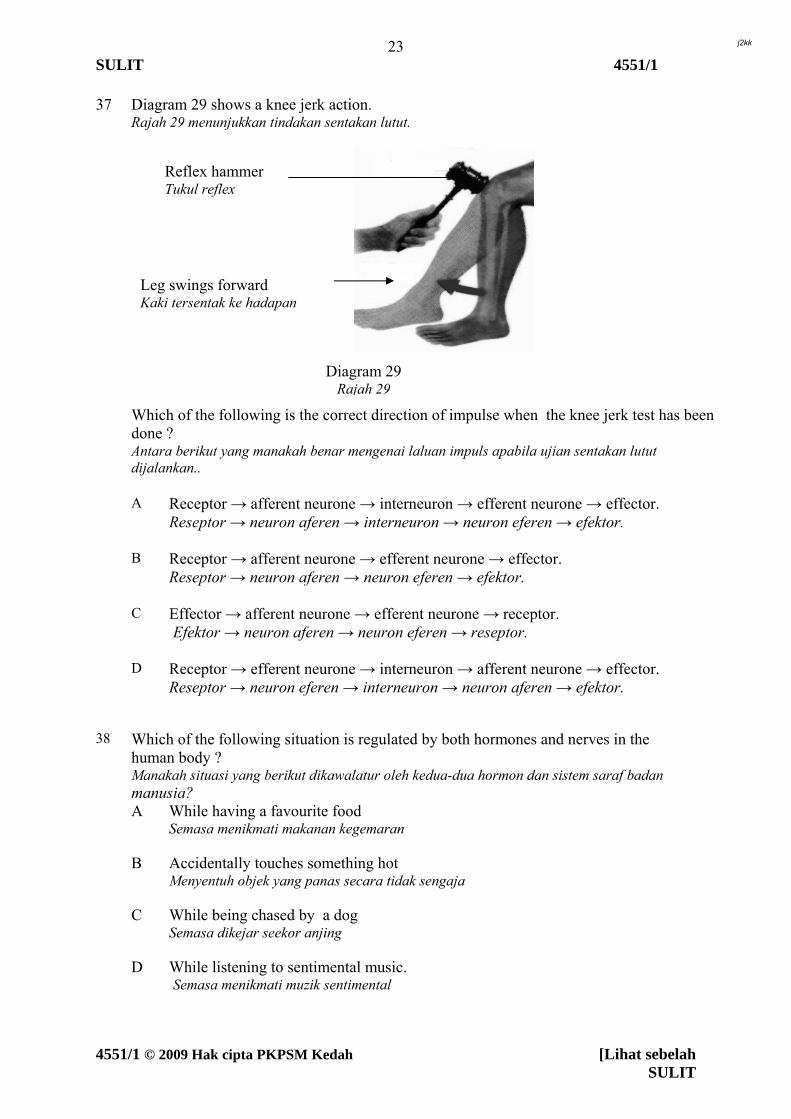
35 Diagram 28 shows a joint in human skeletal system. Rajah 28 menunjukkan sendi yang terdapat sistem rangka manusia. Diagram 28 Rajah 28 What is the function of X ? Apakah fungsi X?
A Attach bone to the bone. Menghubungkan tulang dengan tulang
B Secretes fluid to lubricate the joint. Merembeskan cecair untuk melicin pergerakan sendi.
C Reduces friction between the bones Mengurangkan geseran antara tulang
D Prevents the bones from being dislocated. Mencegah tulang daripada berganjak
36 Which of the following tissues is responsible for support in aquatic plant? Tisu manakah di antara berikut memberi sokongan kepada tumbahan air?
A Parenchyma tissue Tisu parenkima
B Aerenchyma tissue Tisu aerenkima
C Schlerenchyma tissue Tisu Sklerenkima
D Collenchyma tissue Tisu kolenkima
X
4551/1 © 2009 Hak cipta PKPSM Kedah [Lihat sebelah SULIT
j2kk
23 SULIT 4551/1
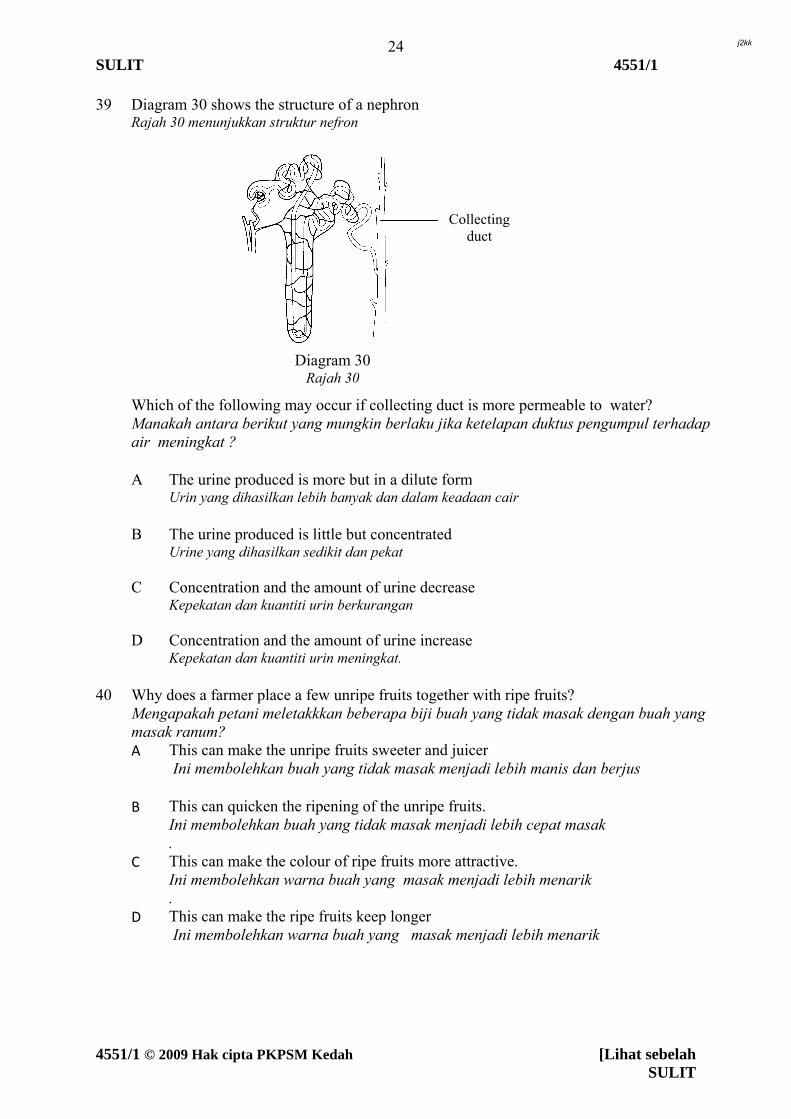
37 Diagram 29 shows a knee jerk action. Rajah 29 menunjukkan tindakan sentakan lutut. Which of the following is the correct direction of impulse when the knee jerk test has been done ? Antara berikut yang manakah benar mengenai laluan impuls apabila ujian sentakan lutut dijalankan..
A Receptor → afferent neurone → interneuron → efferent neurone → effector. Reseptor → neuron aferen → interneuron → neuron eferen → efektor.
B Receptor → afferent neurone → efferent neurone → effector. Reseptor → neuron aferen → neuron eferen → efektor.
C Effector → afferent neurone → efferent neurone → receptor. Efektor → neuron aferen → neuron eferen → reseptor.
D Receptor → efferent neurone → interneuron → afferent neurone → effector. Reseptor → neuron eferen → interneuron → neuron aferen → efektor.
38 Which of the following situation is regulated by both hormones and nerves in the human body ? Manakah situasi yang berikut dikawalatur oleh kedua-dua hormon dan sistem saraf badan manusia?
A While having a favourite food Semasa menikmati makanan kegemaran
B Accidentally touches something hot Menyentuh objek yang panas secara tidak sengaja
C While being chased by a dog Semasa dikejar seekor anjing
D While listening to sentimental music. Semasa menikmati muzik sentimental
Reflex hammer Tukul reflex
Leg swings forward Kaki tersentak ke hadapan
Diagram 29 Rajah 29
4551/1 © 2009 Hak cipta PKPSM Kedah [Lihat sebelah SULIT
j2kk
24 SULIT 4551/1
39 Diagram 30 shows the structure of a nephron Rajah 30 menunjukkan struktur nefron Which of the following may occur if collecting duct is more permeable to water? Manakah antara berikut yang mungkin berlaku jika ketelapan duktus pengumpul terhadap air meningkat ?
A The urine produced is more but in a dilute form Urin yang dihasilkan lebih banyak dan dalam keadaan cair
B The urine produced is little but concentrated Urine yang dihasilkan sedikit dan pekat
C Concentration and the amount of urine decrease Kepekatan dan kuantiti urin berkurangan
D Concentration and the amount of urine increase Kepekatan dan kuantiti urin meningkat.
40 Why does a farmer place a few unripe fruits together with ripe fruits?
Mengapakah petani meletakkkan beberapa biji buah yang tidak masak dengan buah yang masak ranum?
A This can make the unripe fruits sweeter and juicer Ini membolehkan buah yang tidak masak menjadi lebih manis dan berjus
B This can quicken the ripening of the unripe fruits. Ini membolehkan buah yang tidak masak menjadi lebih cepat masak .
C This can make the colour of ripe fruits more attractive. Ini membolehkan warna buah yang masak menjadi lebih menarik .
D This can make the ripe fruits keep longer Ini membolehkan warna buah yang masak menjadi lebih menarik
Diagram 30 Rajah 30
Collecting duct
4551/1 © 2009 Hak cipta PKPSM Kedah [Lihat sebelah SULIT
j2kk
25 SULIT 4551/1
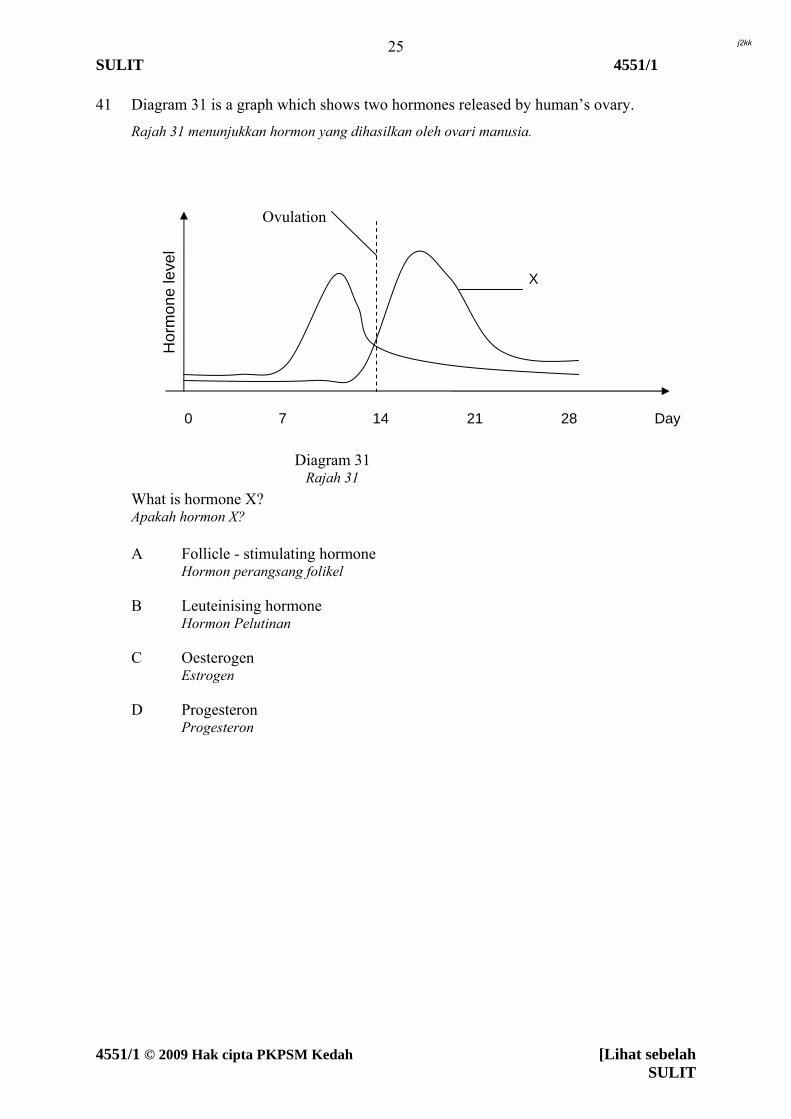
41 Diagram 31 is a graph which shows two hormones released by human’s ovary.
Rajah 31 menunjukkan hormon yang dihasilkan oleh ovari manusia.
What is hormone X? Apakah hormon X?
A Follicle - stimulating hormone Hormon perangsang folikel
B Leuteinising hormone Hormon Pelutinan
C Oesterogen Estrogen
D Progesteron Progesteron
X
Hor
mon
e le
vel
0 7 14 21 28 Day
Ovulation
Diagram 31 Rajah 31
4551/1 © 2009 Hak cipta PKPSM Kedah [Lihat sebelah SULIT
j2kk

26 SULIT 4551/1
42 Diagram 32 shows a method of birth control use by a mother. Rajah 32 menunjukkan kaedah mencegah kehamilan digunakan oleh seorang ibu What is the consequences of this type of birth control ? Apakah kesan ekoran dari pencegahan kehamilan jenis ini.
A Ovum cannot be produced. Ovum tidak dapat dihasilkan
B The female sex hormones cannot be secreted . Hormon seks perempuan tidak dapat dirembeskan
C Sperm cells would be unable to enter the uterus. Sel sperma tidak dapat memasuki uterus
D Sperm cells would be unable to reach the ovum Sel sperma tidak dapat mendekati ovum
Diagram 32 Rajah 32
4551/1 © 2009 Hak cipta PKPSM Kedah [Lihat sebelah SULIT
j2kk
27 SULIT 4551/1
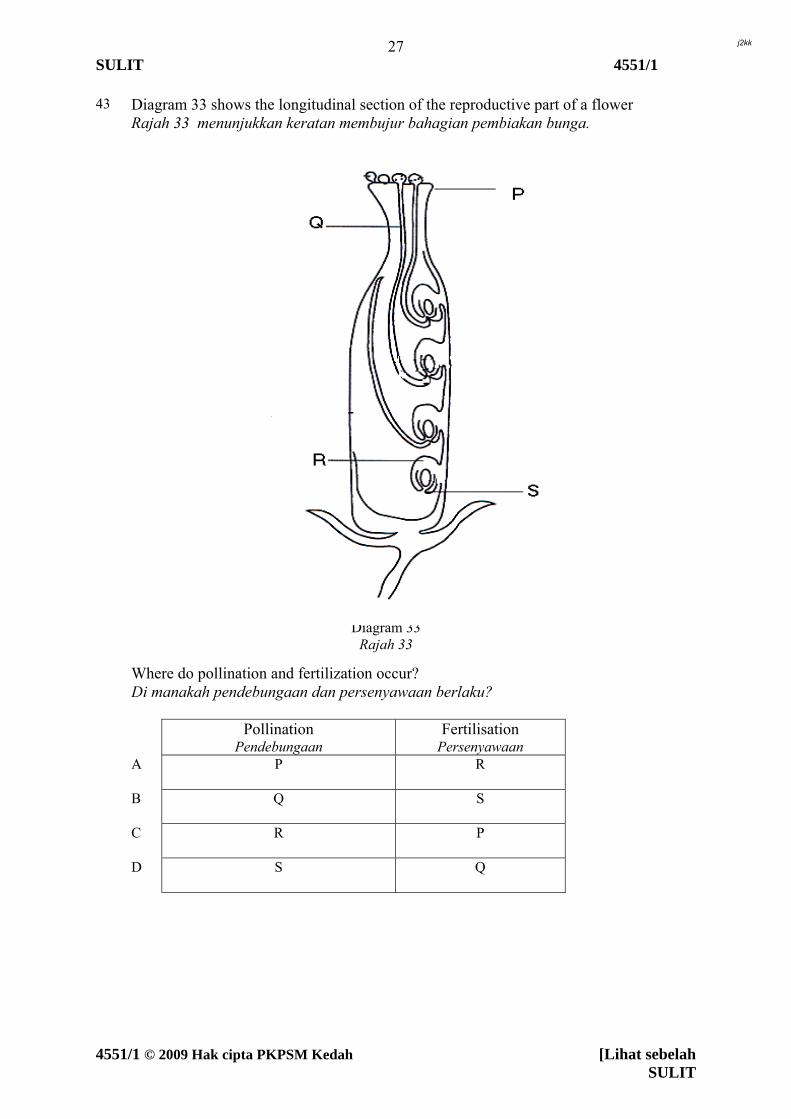
43 Diagram 33 shows the longitudinal section of the reproductive part of a flower Rajah 33 menunjukkan keratan membujur bahagian pembiakan bunga. Where do pollination and fertilization occur? Di manakah pendebungaan dan persenyawaan berlaku?
Pollination Pendebungaan
Fertilisation Persenyawaan
A P R
B Q S
C R P
D S Q
Diagram 33
Rajah 33
4551/1 © 2009 Hak cipta PKPSM Kedah [Lihat sebelah SULIT
j2kk
28 SULIT 4551/1
44 Choose the correct sequence that shows development of a zygote before implantation. Pilih urutan yang sesuai yang menunjukkan perkembangan zigot sebelum penempelan.
A morula
morula
blastocyst blastosista
embryo embrio
B embryo embrio
morula morula
blastocyst blastosista
C blastocyst blastosista
morula morula
embryo embrio
D blastocyst blastosista
embryo embrio
morula morula
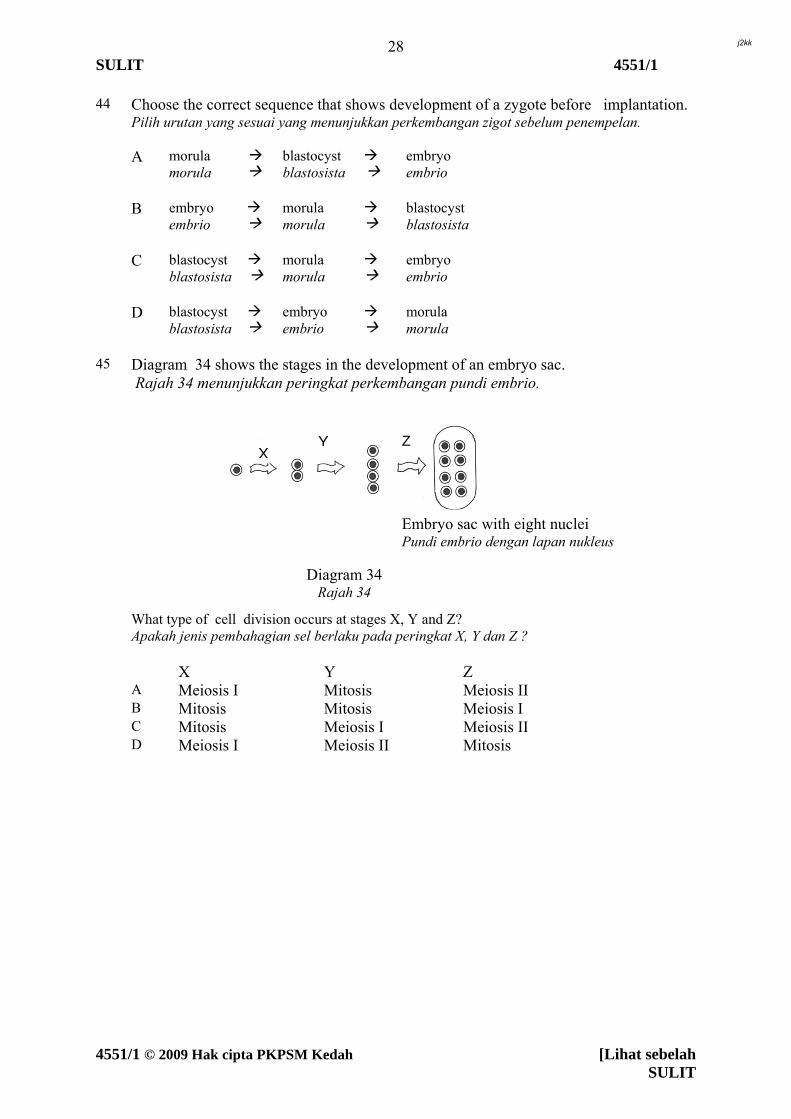
45 Diagram 34 shows the stages in the development of an embryo sac.
Rajah 34 menunjukkan peringkat perkembangan pundi embrio. What type of cell division occurs at stages X, Y and Z? Apakah jenis pembahagian sel berlaku pada peringkat X, Y dan Z ?
X Y Z A Meiosis I Mitosis Meiosis II B Mitosis Mitosis Meiosis I C Mitosis Meiosis I Meiosis II D Meiosis I Meiosis II Mitosis
Embryo sac with eight nuclei Pundi embrio dengan lapan nukleus
ZYX
Diagram 34 Rajah 34
4551/1 © 2009 Hak cipta PKPSM Kedah [Lihat sebelah SULIT
j2kk
29 SULIT 4551/1
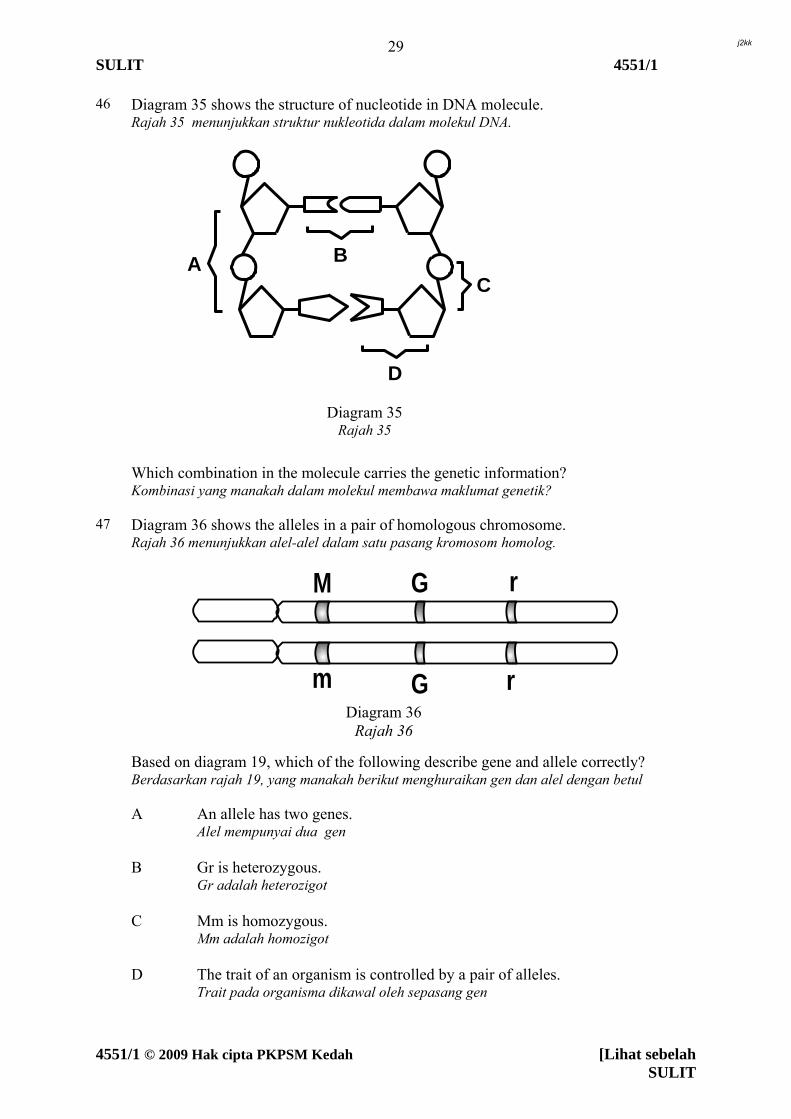
46 Diagram 35 shows the structure of nucleotide in DNA molecule. Rajah 35 menunjukkan struktur nukleotida dalam molekul DNA.
Which combination in the molecule carries the genetic information? Kombinasi yang manakah dalam molekul membawa maklumat genetik?
47 Diagram 36 shows the alleles in a pair of homologous chromosome.
Rajah 36 menunjukkan alel-alel dalam satu pasang kromosom homolog. Based on diagram 19, which of the following describe gene and allele correctly? Berdasarkan rajah 19, yang manakah berikut menghuraikan gen dan alel dengan betul
A An allele has two genes. Alel mempunyai dua gen
B Gr is heterozygous. Gr adalah heterozigot
C Mm is homozygous. Mm adalah homozigot
D The trait of an organism is controlled by a pair of alleles. Trait pada organisma dikawal oleh sepasang gen
A B
C
D
Diagram 35 Rajah 35
M
m
G
G
r
rDiagram 36
Rajah 36
4551/1 © 2009 Hak cipta PKPSM Kedah [Lihat sebelah SULIT
j2kk
30 SULIT 4551/1
48
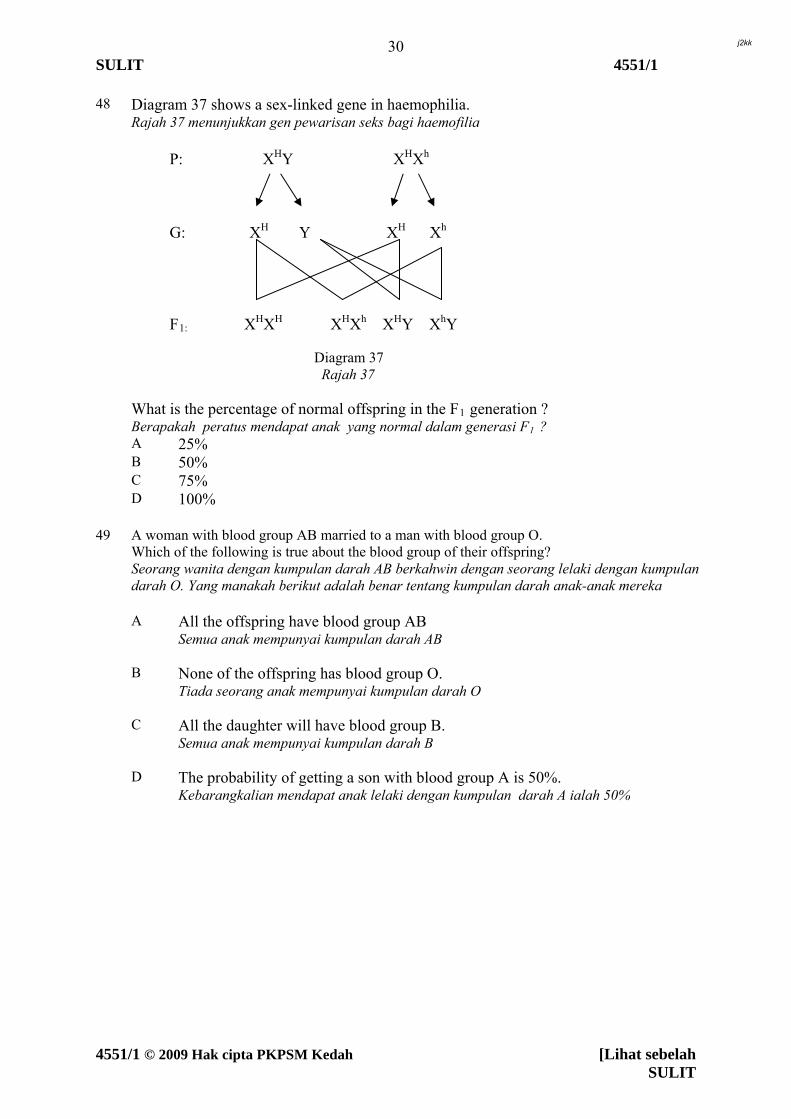
Diagram 37 shows a sex-linked gene in haemophilia. Rajah 37 menunjukkan gen pewarisan seks bagi haemofilia Diagram 37 Rajah 37 What is the percentage of normal offspring in the F1 generation ? Berapakah peratus mendapat anak yang normal dalam generasi F1 ?
A 25% B 50% C 75% D 100% 49 A woman with blood group AB married to a man with blood group O.
Which of the following is true about the blood group of their offspring? Seorang wanita dengan kumpulan darah AB berkahwin dengan seorang lelaki dengan kumpulan darah O. Yang manakah berikut adalah benar tentang kumpulan darah anak-anak mereka
A All the offspring have blood group AB Semua anak mempunyai kumpulan darah AB
B None of the offspring has blood group O. Tiada seorang anak mempunyai kumpulan darah O
C All the daughter will have blood group B. Semua anak mempunyai kumpulan darah B
D The probability of getting a son with blood group A is 50%. Kebarangkalian mendapat anak lelaki dengan kumpulan darah A ialah 50%
G: XH Y XH Xh F1: X
HXH XHXh XHY XhY
P: XHY XHXh
4551/1 © 2009 Hak cipta PKPSM Kedah [Lihat sebelah SULIT
j2kk
31 SULIT 4551/1
4551/1 © 2009 Hak cipta PKPSM Kedah [Lihat sebelah SULIT
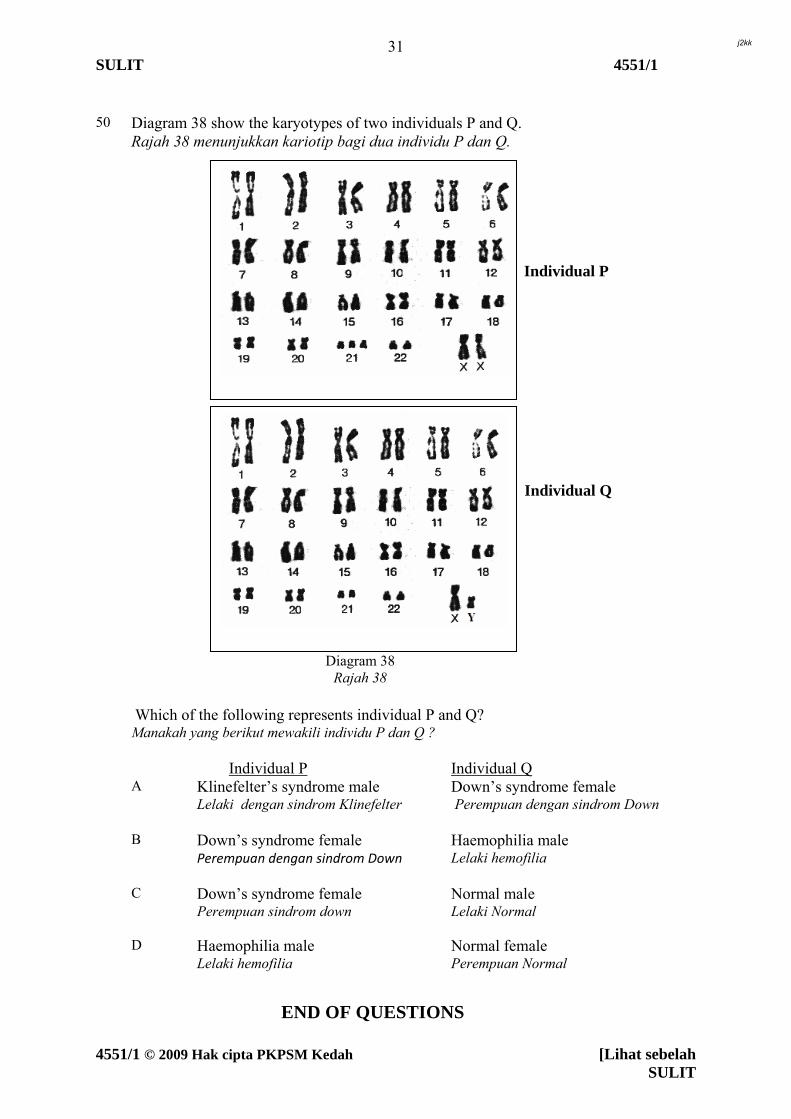
50 Diagram 38 show the karyotypes of two individuals P and Q. Rajah 38 menunjukkan kariotip bagi dua individu P dan Q. Which of the following represents individual P and Q? Manakah yang berikut mewakili individu P dan Q ?
Individual P Individual Q A Klinefelter’s syndrome male
Lelaki dengan sindrom Klinefelter Down’s syndrome female Perempuan dengan sindrom Down
B Down’s syndrome female Perempuan dengan sindrom Down
Haemophilia male Lelaki hemofilia
C Down’s syndrome female Perempuan sindrom down
Normal male Lelaki Normal
D Haemophilia male Lelaki hemofilia
Normal female Perempuan Normal
Individual P
Diagram 38 Rajah 38
Individual Q
END OF QUESTIONS
j2kk
SULIT
4551/2 © 2009 Hak Cipta PKPSM Kedah [ Lihat Sebelah
PEPERIKSAAN PERCUBAAN SPM 2009
PERSIDANGAN KEBANGSAAN PENGETUA-PENGETUA SEKOLAH MENENGAH
NEGERI KEDAH DARUL AMAN
4551/2 Biology Paper 2 Sept 2009
2
12 hours
Name:………………………………………………………. Form : ………………..
BIOLOGY PAPER 2
Two hours and thirty minutes
DO NOT OPEN THE TEST PAPER UNTIL YOU ARE TOLD TO DO SO
For Examiner’s Use
Section Question Full
Marks Marks
Obtained
1 12
2 12
3 12
4 12
A
Answer all
questions
5 12
6 20
7 20
8 20
B
Any Two
9 20
1. This paper consists of two sections. Section A, Section B. Answer all the questions in Section A, any two questions in Section B.
2. Write your answers in the spaces provided for Section A. Important steps in calculations must be shown .
3. Write your answers on the separate answer sheets provided for Section B.
4. Answer Section B in details. You may use equation, diagram, table, graph and other suitable methods to explain your answers.
5. Show your working, it may help you to get marks. 6. If you wish to change your answer, neatly cross out the
answer that you have done. Then write down the new answer
7. The diagrams in the questions are not drawn to scale unless stated.
8. Marks allocated for each question or part of the questions are shown in brackets.
9. The time suggested to answer Section A is 90 minutes, Section B is 60 minutes.
10. The use of a non programmable calculator is permitted.
Total 100
This Question Paper Consists of 22 Printed Pages
j2kk
SULIT
2
4551/2 © 2009 Hak Cipta PKPSM Kedah [ Lihat Sebelah
Section A Bahagian A
[ 60 marks ] [ 60 markah ]
Answer all questions in this section.
Jawab semua soalan dalam bahagian ini
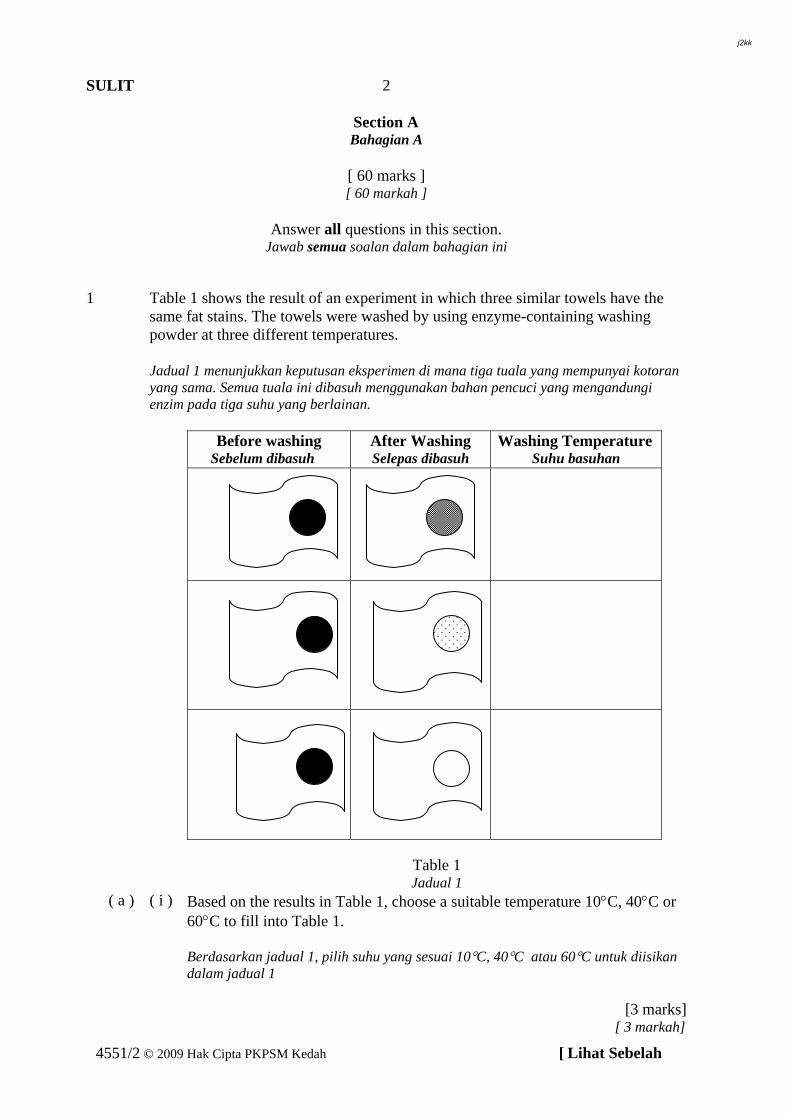
1
Table 1 shows the result of an experiment in which three similar towels have the same fat stains. The towels were washed by using enzyme-containing washing powder at three different temperatures. Jadual 1 menunjukkan keputusan eksperimen di mana tiga tuala yang mempunyai kotoran yang sama. Semua tuala ini dibasuh menggunakan bahan pencuci yang mengandungi enzim pada tiga suhu yang berlainan.
Before washing
Sebelum dibasuh After Washing Selepas dibasuh
Washing Temperature Suhu basuhan
Table 1 Jadual 1
( a ) ( i ) Based on the results in Table 1, choose a suitable temperature 10C, 40C or 60C to fill into Table 1.
Berdasarkan jadual 1, pilih suhu yang sesuai 10C, 40C atau 60C untuk diisikan dalam jadual 1
[3 marks] [ 3 markah]
j2kk
SULIT
3
4551/2 © 2009 Hak Cipta PKPSM Kedah [ Lihat Sebelah
( ii ) Explain the result of washing the towels at : Terangkan hasil keputusan basuhan tuala pada :
i. 10C
…………………………………………………………………………........
…………………………………………………………………………........
…………………………………………………………………………........
[2 marks] [ 2 markah]
ii. 40C
…………………………………………………………………………........
…………………………………………………………………………........
…………………………………………………………………………........
[2 marks] [ 2 markah]
( b ) Name one enzyme used in the washing powder Namakan satu enzim yang digunakan dalam serbuk pencuci itu.
…………………………………………………………………………...........
[1 mark]
[1 markah] ( c )
Explain two examples of the uses of enzymes. Terangkan dua contoh kegunaan enzim.
…………………………………………………………………………...........
…………………………………………………………………………...........
…………………………………………………………………………...........
…………………………………………………………………………...........
…………………………………………………………………………...........
[ 4 marks ] [ 4 markah ]
Besides being used in the manufacturing of detergents, enzymes are widely used in our daily life as well as in various industries.
Selain digunakan dalam penghasilan detergen, enzim juga banyak digunakan
dalam kehidupan seharian begitu juga dalam kebanyakan industri.
j2kk
SULIT
4
4551/2 © 2009 Hak Cipta PKPSM Kedah [ Lihat Sebelah
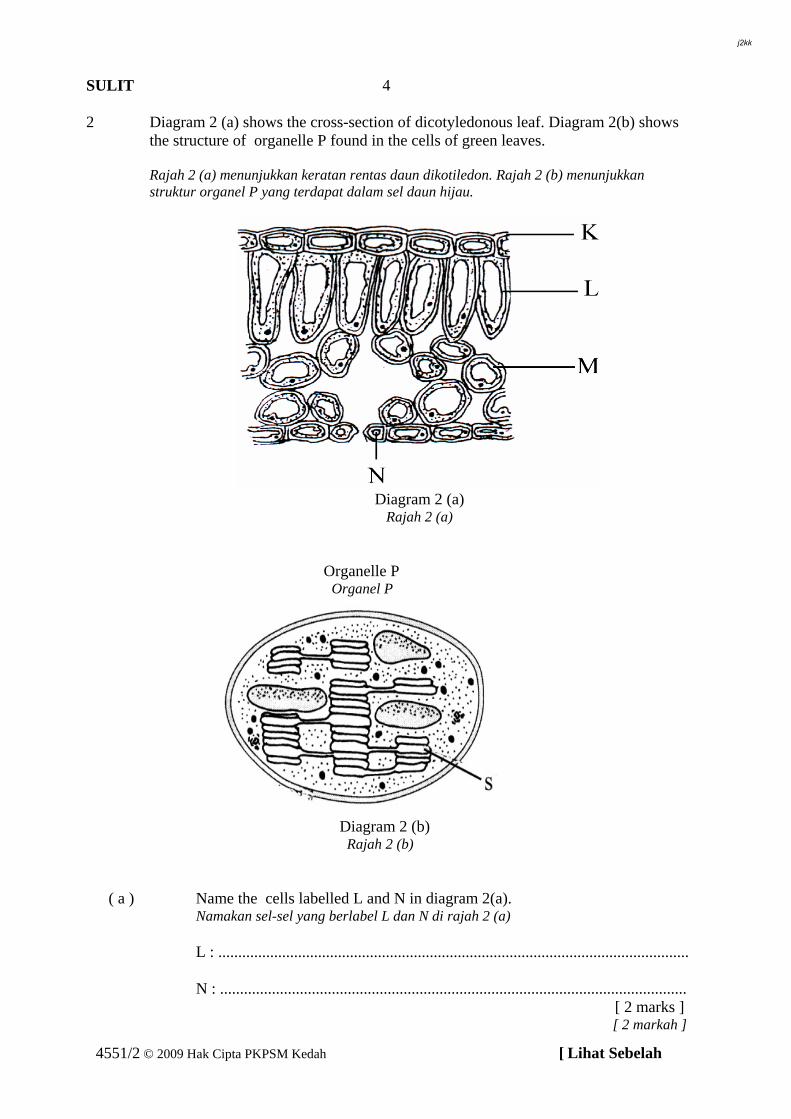
2 Diagram 2 (a) shows the cross-section of dicotyledonous leaf. Diagram 2(b) shows the structure of organelle P found in the cells of green leaves.
Rajah 2 (a) menunjukkan keratan rentas daun dikotiledon. Rajah 2 (b) menunjukkan struktur organel P yang terdapat dalam sel daun hijau.
Diagram 2 (a)
Rajah 2 (a)
Organelle P Organel P
Diagram 2 (b) Rajah 2 (b)
( a ) Name the cells labelled L and N in diagram 2(a). Namakan sel-sel yang berlabel L dan N di rajah 2 (a)
L : ...................................................................................................................... N : ..................................................................................................................... [ 2 marks ] [ 2 markah ]
j2kk
SULIT
5
4551/2 © 2009 Hak Cipta PKPSM Kedah [ Lihat Sebelah
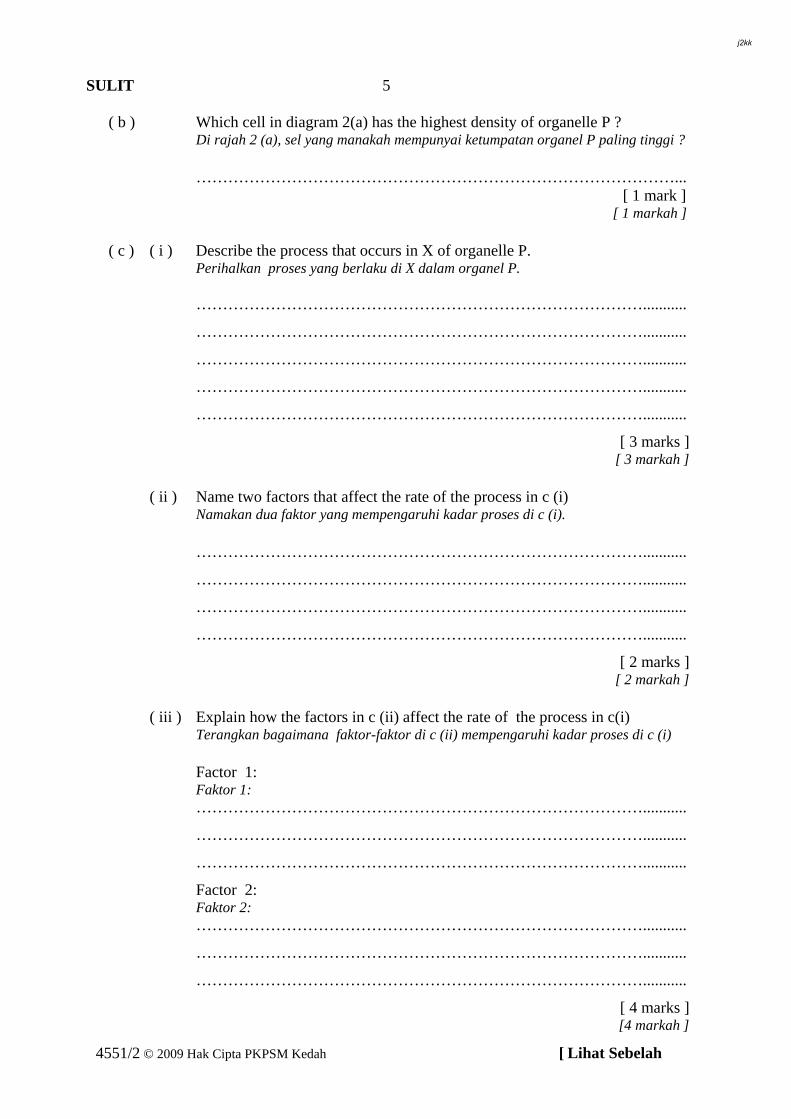
( b ) Which cell in diagram 2(a) has the highest density of organelle P ? Di rajah 2 (a), sel yang manakah mempunyai ketumpatan organel P paling tinggi ?
………………………………………………………………………………... [ 1 mark ] [ 1 markah ] ( c ) ( i ) Describe the process that occurs in X of organelle P. Perihalkan proses yang berlaku di X dalam organel P.
…………………………………………………………………………...........
…………………………………………………………………………...........
…………………………………………………………………………...........
…………………………………………………………………………...........
…………………………………………………………………………...........
[ 3 marks ] [ 3 markah ] ( ii ) Name two factors that affect the rate of the process in c (i) Namakan dua faktor yang mempengaruhi kadar proses di c (i). …………………………………………………………………………...........
…………………………………………………………………………...........
…………………………………………………………………………...........
…………………………………………………………………………...........
[ 2 marks ] [ 2 markah ] ( iii ) Explain how the factors in c (ii) affect the rate of the process in c(i) Terangkan bagaimana faktor-faktor di c (ii) mempengaruhi kadar proses di c (i) Factor 1:
Faktor 1: …………………………………………………………………………...........
…………………………………………………………………………...........
…………………………………………………………………………...........
Factor 2: Faktor 2:
…………………………………………………………………………...........
…………………………………………………………………………...........
…………………………………………………………………………...........
[ 4 marks ] [4 markah ]
j2kk
SULIT
6
4551/2 © 2009 Hak Cipta PKPSM Kedah [ Lihat Sebelah
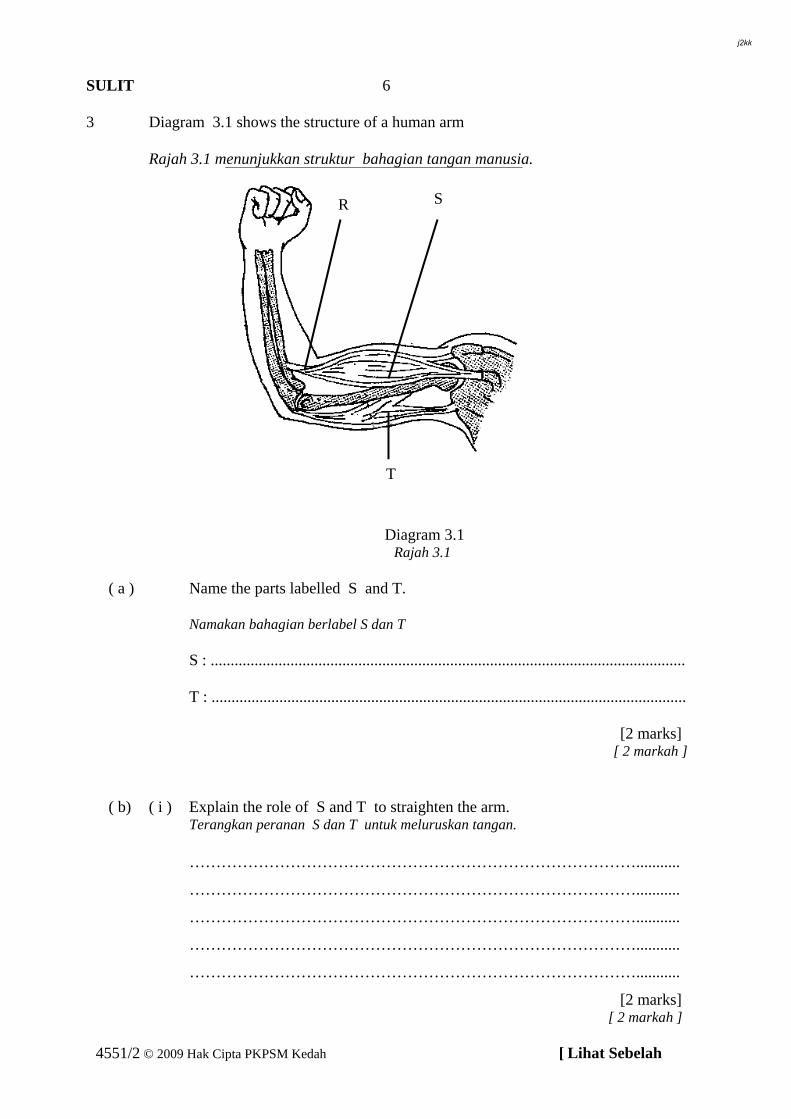
3
Diagram 3.1 shows the structure of a human arm Rajah 3.1 menunjukkan struktur bahagian tangan manusia.
Diagram 3.1 Rajah 3.1
( a ) Name the parts labelled S and T.
Namakan bahagian berlabel S dan T
S : .......................................................................................................................
T : ....................................................................................................................... [2 marks] [ 2 markah ]
( b) ( i ) Explain the role of S and T to straighten the arm. Terangkan peranan S dan T untuk meluruskan tangan. …………………………………………………………………………...........
…………………………………………………………………………...........
…………………………………………………………………………...........
…………………………………………………………………………...........
…………………………………………………………………………...........
[2 marks] [ 2 markah ]
T
R S
j2kk
SULIT
7
4551/2 © 2009 Hak Cipta PKPSM Kedah [ Lihat Sebelah
( ii ) S and T will need sufficient blood supply to function efficiently. Explain why?
S dan T memerlukan bekalan darah yang cukup untuk berfungsi dengan baik . Terangkan mengapa?
…………………………………………………………………………...........
…………………………………………………………………………...........
…………………………………………………………………………...........
…………………………………………………………………………...........
…………………………………………………………………………...........
[2 marks] [ 2 markah ]
( c ) ( i ) State the function of R. Nyatakan fungsi R. …………………………………………………………………………...........
…………………………………………………………………………...........
[ 1 mark ] [ 1 markah ]
(ii) State two physical characteristics of tissue R that enable it to carry out it’s
function efficiently. Nyatakan dua sifat fizikal R untuk membolehkannya berfungsi dengan baik.
…………………………………………………………………………..........
…………………………………………………………………………..........
…………………………………………………………………………..........
…………………………………………………………………………..........
…………………………………………………………………………..........
[2 marks] [ 2 markah ] (iii) What will happen if tissue R is torn off? Apakah yang akan berlaku jika tisu R mengalami kecederaan (terkoyak)?
…………………………………………………………………………........... …………………………………………………………………………........... [ 1 mark ] [ 1 markah ]
j2kk
SULIT
8
4551/2 © 2009 Hak Cipta PKPSM Kedah [ Lihat Sebelah
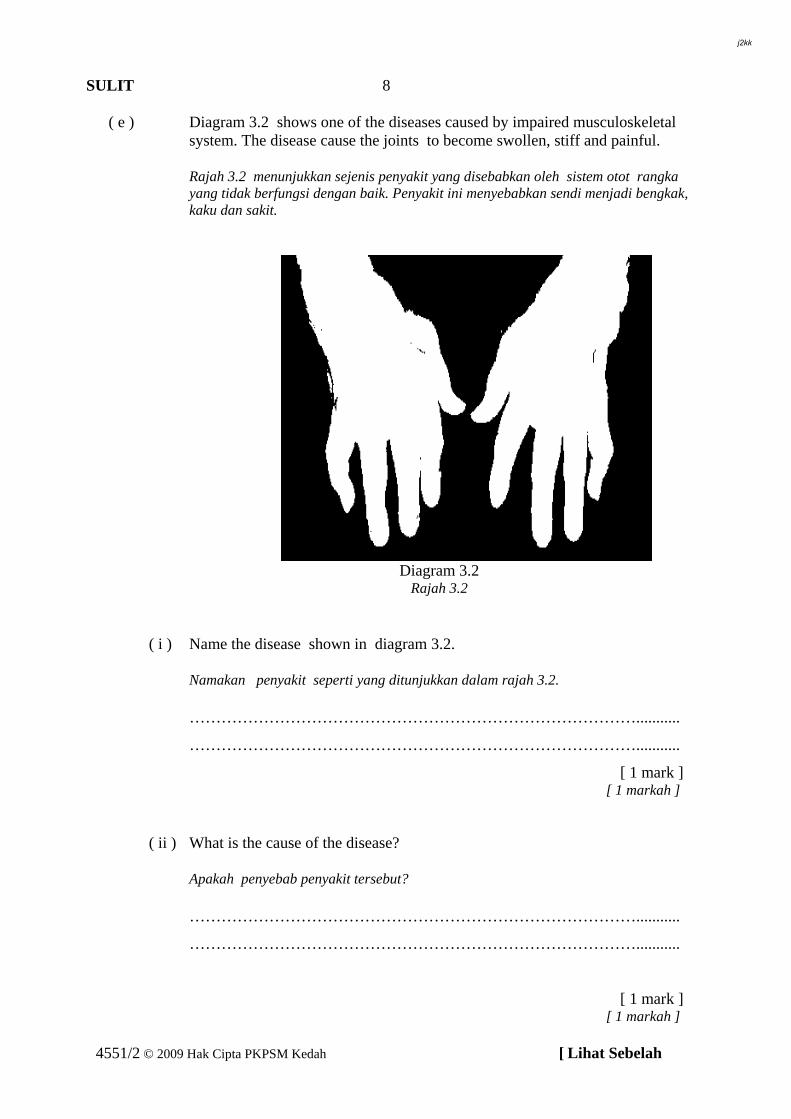
( e ) Diagram 3.2 shows one of the diseases caused by impaired musculoskeletal system. The disease cause the joints to become swollen, stiff and painful.
Rajah 3.2 menunjukkan sejenis penyakit yang disebabkan oleh sistem otot rangka yang tidak berfungsi dengan baik. Penyakit ini menyebabkan sendi menjadi bengkak, kaku dan sakit.
Diagram 3.2 Rajah 3.2 ( i ) Name the disease shown in diagram 3.2. Namakan penyakit seperti yang ditunjukkan dalam rajah 3.2. …………………………………………………………………………...........
…………………………………………………………………………...........
[ 1 mark ] [ 1 markah ]
( ii ) What is the cause of the disease? Apakah penyebab penyakit tersebut? …………………………………………………………………………...........
…………………………………………………………………………...........
[ 1 mark ] [ 1 markah ]
j2kk
SULIT
9
4551/2 © 2009 Hak Cipta PKPSM Kedah [ Lihat Sebelah
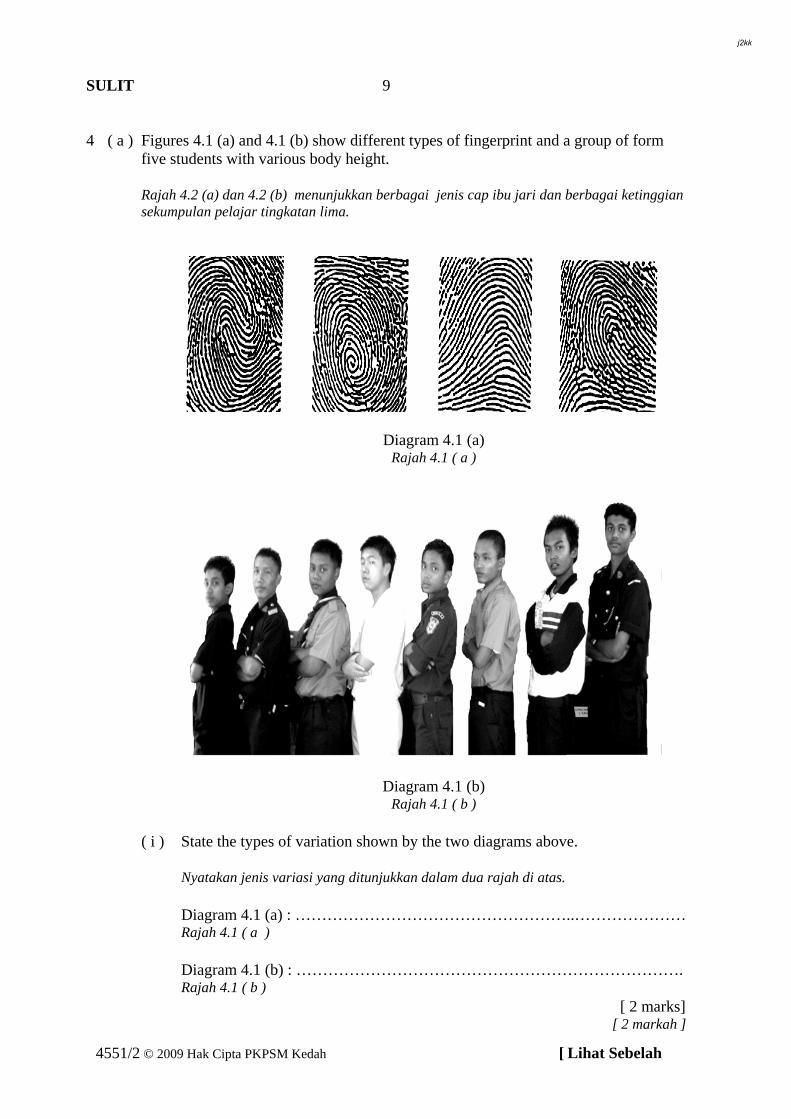
4 ( a ) Figures 4.1 (a) and 4.1 (b) show different types of fingerprint and a group of form
five students with various body height.
Rajah 4.2 (a) dan 4.2 (b) menunjukkan berbagai jenis cap ibu jari dan berbagai ketinggian sekumpulan pelajar tingkatan lima.
Diagram 4.1 (a) Rajah 4.1 ( a )
Diagram 4.1 (b) Rajah 4.1 ( b )
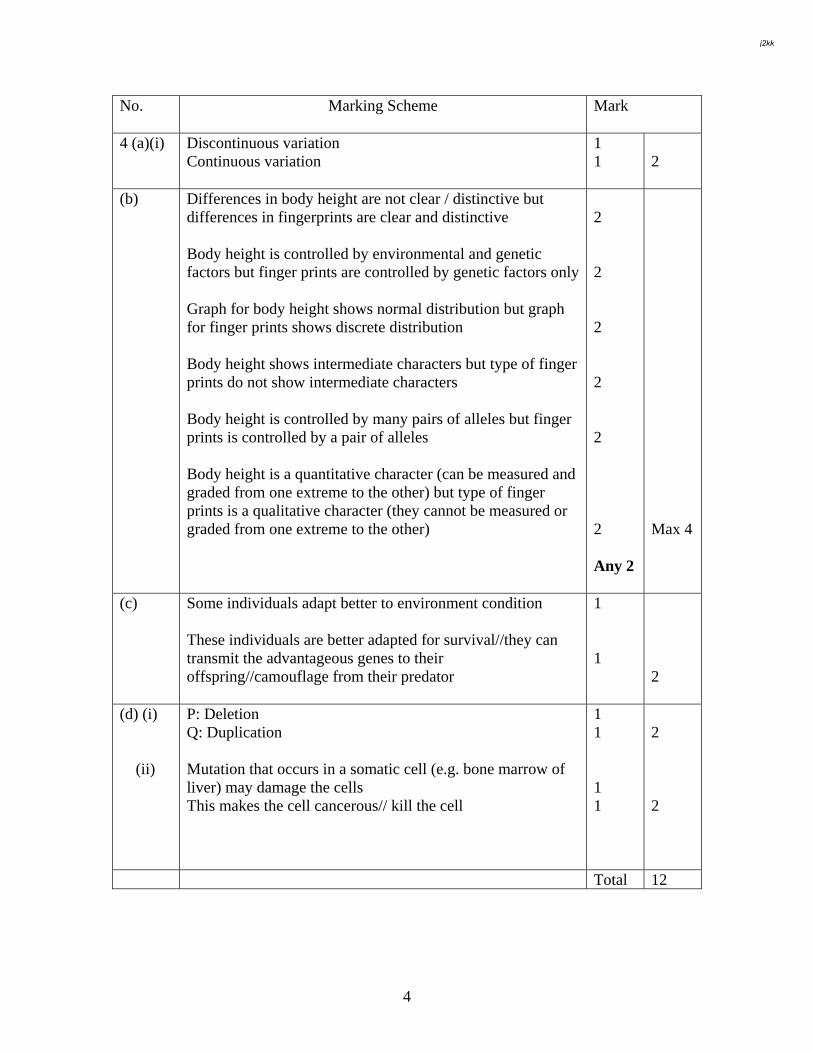
( i ) State the types of variation shown by the two diagrams above.
Nyatakan jenis variasi yang ditunjukkan dalam dua rajah di atas. Diagram 4.1 (a) : ……………………………………………..………………… Rajah 4.1 ( a ) Diagram 4.1 (b) : ………………………………………………………………. Rajah 4.1 ( b ) [ 2 marks] [ 2 markah ]
j2kk
SULIT
10
4551/2 © 2009 Hak Cipta PKPSM Kedah [ Lihat Sebelah
( b ) State two differences between the two types of variation in (a) (i). Nyatakan dua perbezaan antara dua jenis variasi dalam (a) (i) 1 ………………………………………………………………………….........
……………………………………………………………………………….
………………………………………………………………………….........
………………………………………………………………………….........
2 ……………………………………………………………………………….
………………………………………………………………………….........
………………………………………………………………………….........
………………………………………………………………………….........
[ 4 marks ] [ 4 markah ] ( c ) Explain the importance of variation. Terangkan kepentingn variasi …………………………………………………………………………...........
…………………………………………………………………………...........
…………………………………………………………………………...........
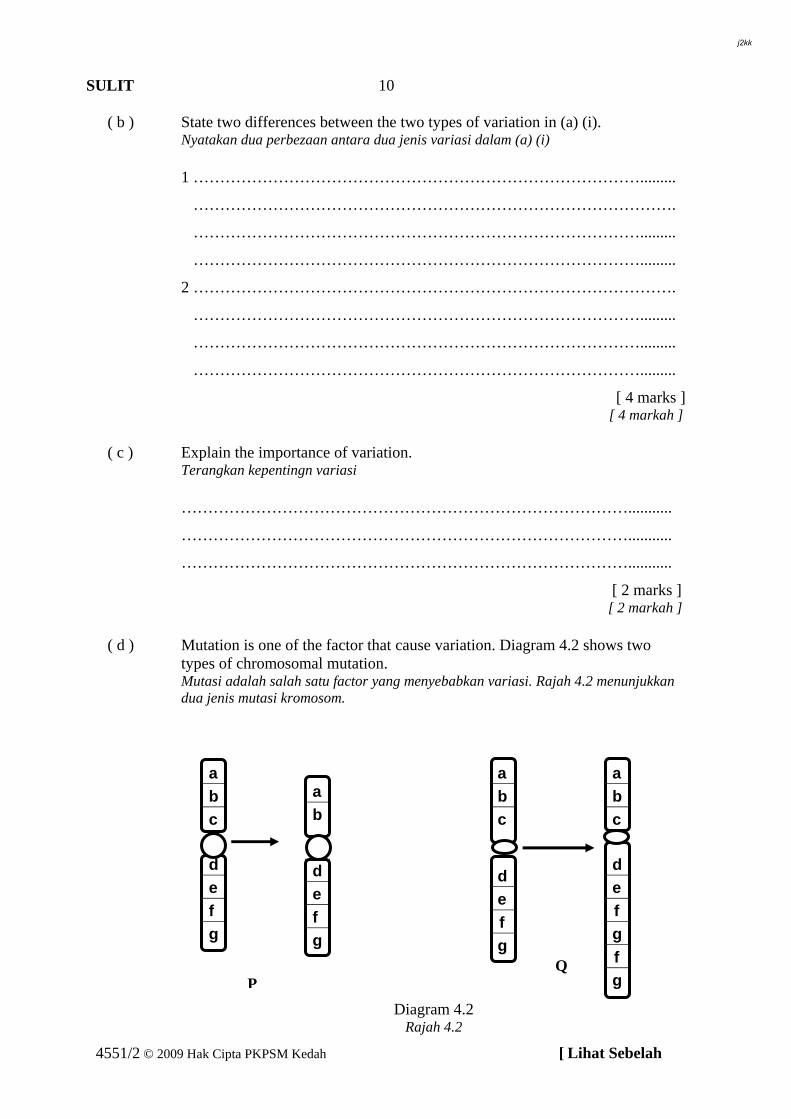
[ 2 marks ] [ 2 markah ] ( d ) Mutation is one of the factor that cause variation. Diagram 4.2 shows two
types of chromosomal mutation. Mutasi adalah salah satu factor yang menyebabkan variasi. Rajah 4.2 menunjukkan
dua jenis mutasi kromosom.
a b c d e f g
a b
d e f g
a b c
d e f g
a b c d e f g f g
Diagram 4.2 Rajah 4.2
Q P
j2kk
SULIT
11
4551/2 © 2009 Hak Cipta PKPSM Kedah [ Lihat Sebelah
(i) Name the processes involved in the mutation of P and Q.
Namakan proses-proses yang berlaku dalam mutasi P dan Q. P: ……………………………………………………………………………….. Q: ………………………………………………………………………………. [2 marks] [ 2 markah ]
(ii) Explain one bad effect cause by mutation. Terangkan satu kesan buruk yang disebabkan oleh mutasi.
…………………………………………………………………………...........
…………………………………………………………………………...........
…………………………………………………………………………...........
…………………………………………………………………………...........
[2 marks] [ 2 markah ]
j2kk
SULIT
12
4551/2 © 2009 Hak Cipta PKPSM Kedah [ Lihat Sebelah
5
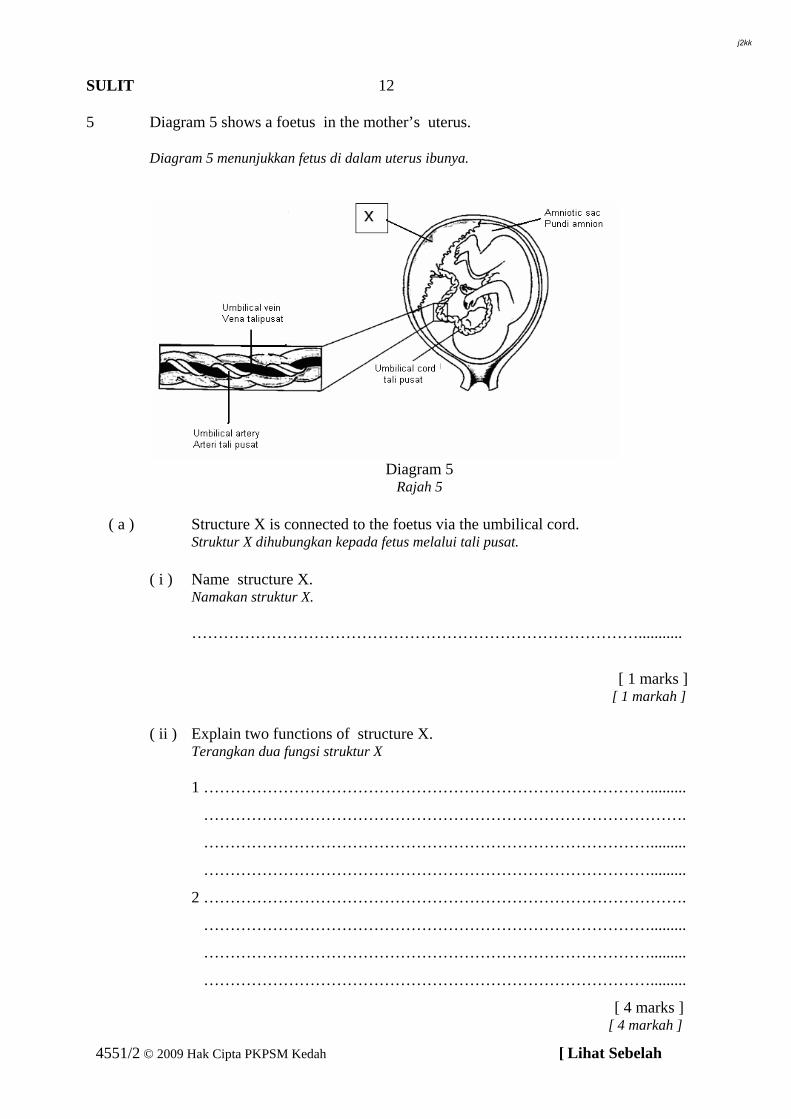
Diagram 5 shows a foetus in the mother’s uterus. Diagram 5 menunjukkan fetus di dalam uterus ibunya.
Diagram 5 Rajah 5
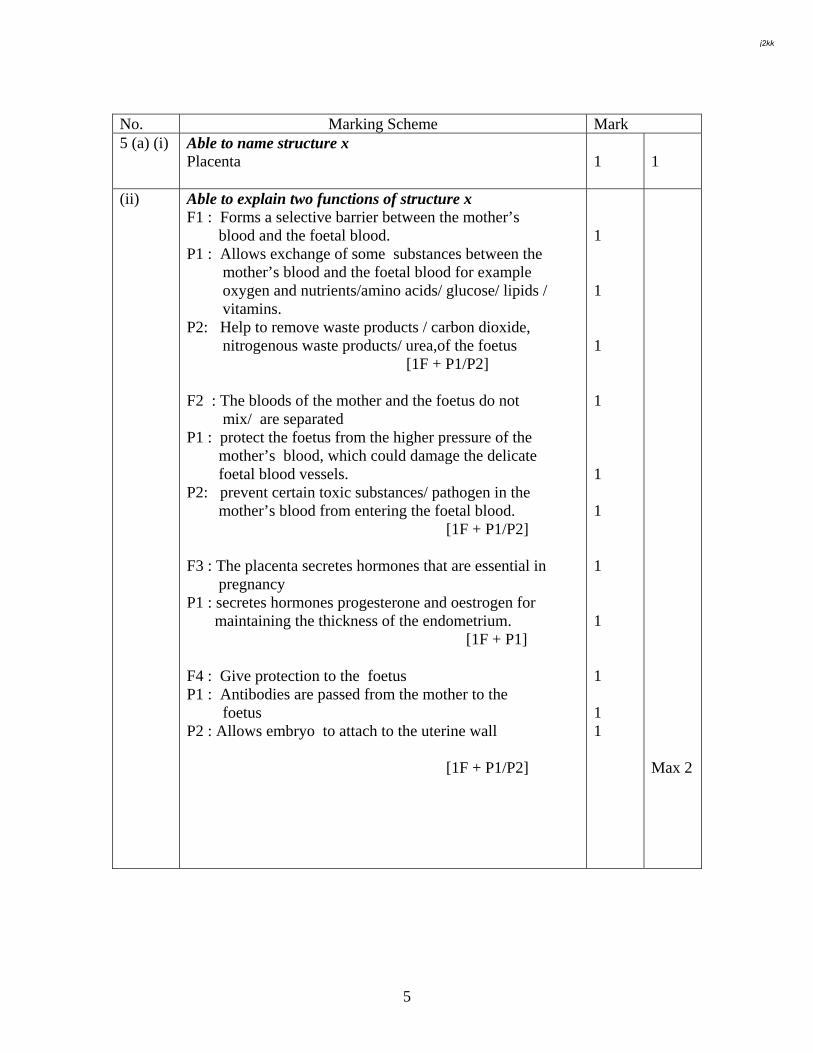
( a ) Structure X is connected to the foetus via the umbilical cord. Struktur X dihubungkan kepada fetus melalui tali pusat. ( i ) Name structure X. Namakan struktur X.
…………………………………………………………………………...........
[ 1 marks ] [ 1 markah ] ( ii ) Explain two functions of structure X. Terangkan dua fungsi struktur X
1 ………………………………………………………………………….........
……………………………………………………………………………….
………………………………………………………………………….........
………………………………………………………………………….........
2 ……………………………………………………………………………….
………………………………………………………………………….........
………………………………………………………………………….........
………………………………………………………………………….........
[ 4 marks ] [ 4 markah ]
j2kk
SULIT
13
4551/2 © 2009 Hak Cipta PKPSM Kedah [ Lihat Sebelah
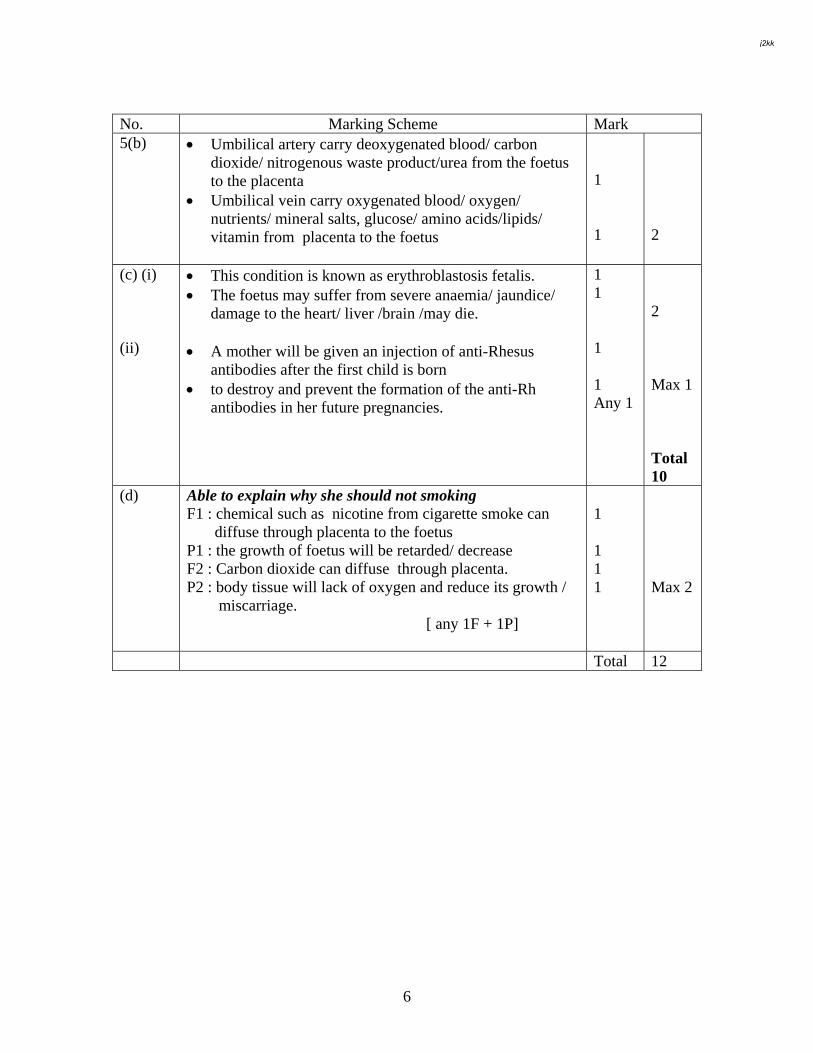
( b ) State the difference between the content of the blood in umbilical artery and umbilical vein.
Nyatakan perbezaan di antara kandungan darah dalam arteri tali pusat dengan vena tali pusat.
…………………………………………………………………………...........
…………………………………………………………………………...........
…………………………………………………………………………...........
…………………………………………………………………………...........
…………………………………………………………………………...........
[2 marks] [ 2 markah ]
( c ) Puan Lisa who is Rhesus negative is pregnant. During her first pregnancy, she carries a foetus which is Rhesus positive . The development of the first foetus was not affected. However during her second pregnancy , if the foetus is Rhesus positive, the foetus will be harmed. Puan Lisa should seek medical advice to prevent this condition .
Puan Lisa mempunyai Rhesus negatif telah hamil. Semasa kehamilan pertama , dia mempunyai fetus Rhesus positif. Perkembangan fetus pertamanya tidak terjejas. Walaubagaimanapun, untuk kehamilan kedua, jika fetus mempunyai Rhesus positif, kesan yang membahayakan akan berlaku keatas fetus. Puan Lisa harus mendapatkan nasihat perubatan untuk mencegah keadaan tersebut berlaku.
( i ) Explain the condition that occur during Puan Lisa’s second pregnancy. Terangkan keadaan yang berlaku semasa kehamilan kali kedua Puan Lisa.
…………………………………………………………………………...........
…………………………………………………………………………...........
…………………………………………………………………………...........
…………………………………………………………………………...........
…………………………………………………………………………...........
[2 marks] [ 2 markah ]
( ii ) How can this problem be avoided ?. Bagaimanakah masalah ini dapat dielak dari berlaku? …………………………………………………………………………...........
…………………………………………………………………………...........
[ 1 marks ] [ 1 markah ]
j2kk
SULIT
14
4551/2 © 2009 Hak Cipta PKPSM Kedah [ Lihat Sebelah
( d ) A woman who is a heavy smoker is pregnant. Explain why she should stop smoking.
Seorang perempuan yang kuat merokok disahkan hamil. Terangkan mengapa beliau
mesti berhenti merokok. …………………………………………………………………………...........
…………………………………………………………………………...........
…………………………………………………………………………...........
…………………………………………………………………………...........
…………………………………………………………………………...........
[2 marks] [ 2 markah ]
j2kk
SULIT
15
Section B Bahagian B
[ 40 marks] [ 40 markah]
Answer any two questions from this section Jawab mana-mana dua soalan daripada bahagian ini.
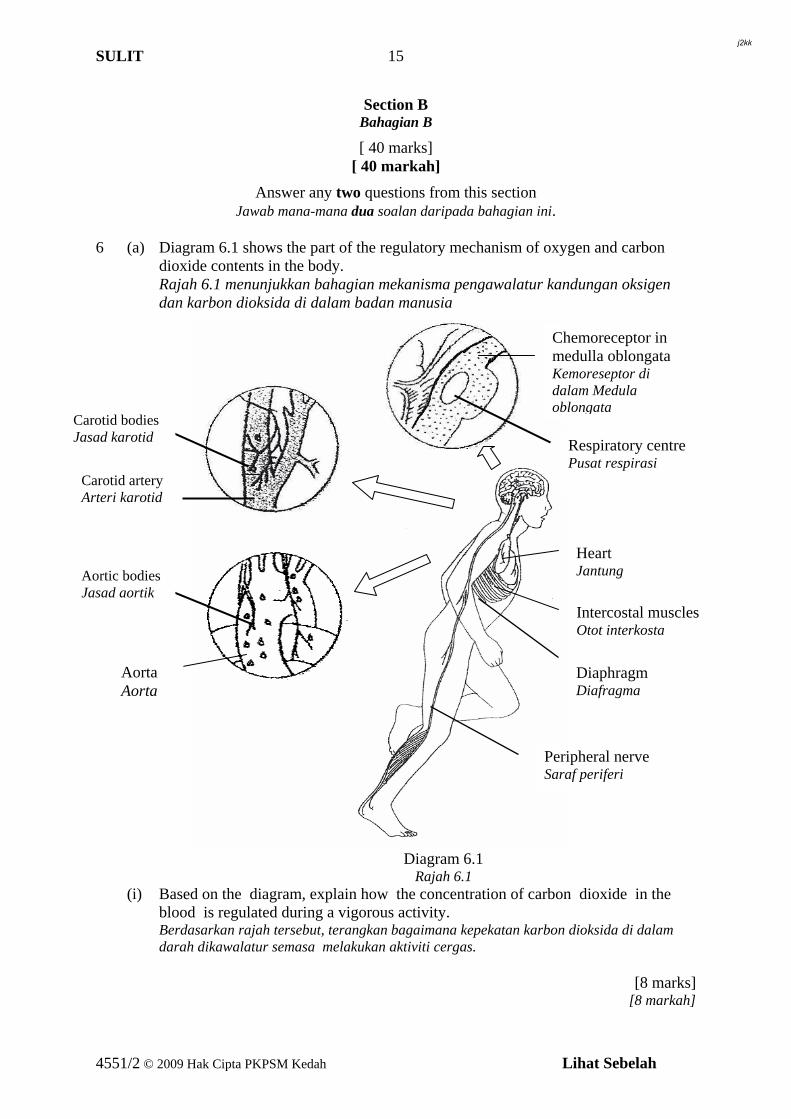
6 (a) Diagram 6.1 shows the part of the regulatory mechanism of oxygen and carbon
dioxide contents in the body. Rajah 6.1 menunjukkan bahagian mekanisma pengawalatur kandungan oksigen
dan karbon dioksida di dalam badan manusia
Diagram 6.1
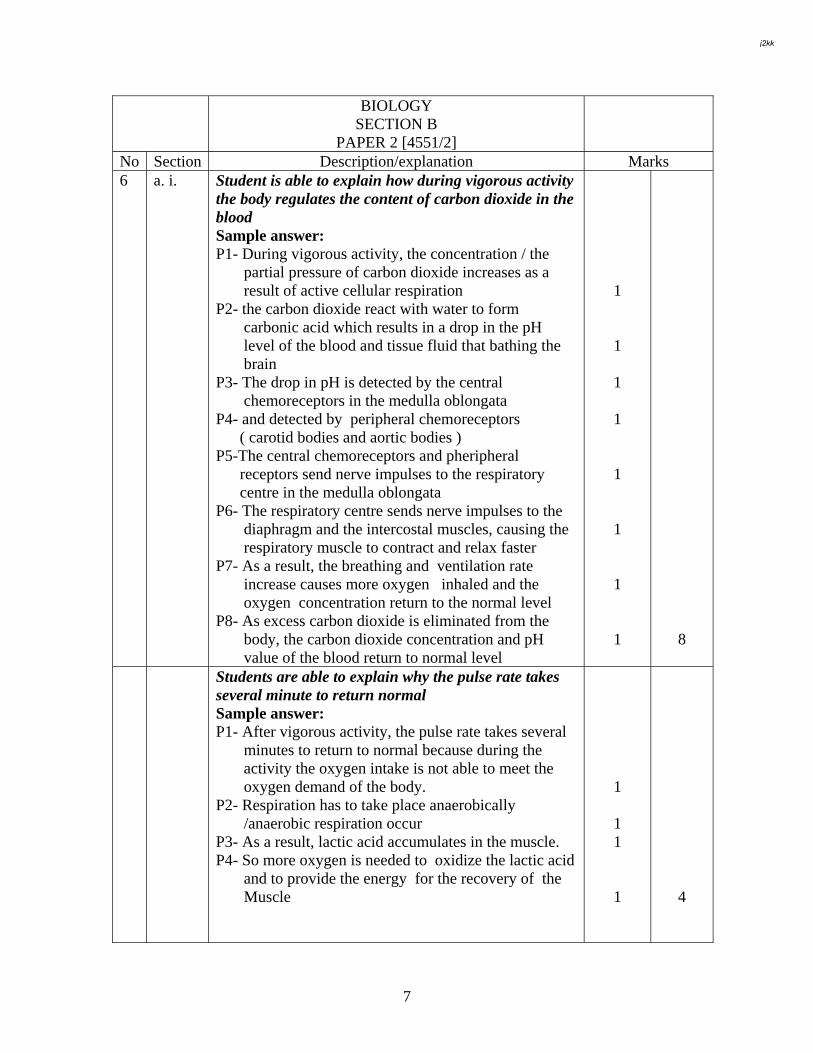
Rajah 6.1 (i) Based on the diagram, explain how the concentration of carbon dioxide in the
blood is regulated during a vigorous activity. Berdasarkan rajah tersebut, terangkan bagaimana kepekatan karbon dioksida di dalam darah dikawalatur semasa melakukan aktiviti cergas.
[8 marks] [8 markah]
Chemoreceptor in medulla oblongata Kemoreseptor di dalam Medula oblongata
Heart Jantung
Respiratory centre Pusat respirasi
Carotid artery Arteri karotid
Carotid bodies Jasad karotid
Aortic bodies Jasad aortik
Intercostal muscles Otot interkosta
Aorta Aorta
Diaphragm Diafragma
Peripheral nerve Saraf periferi
4551/2 © 2009 Hak Cipta PKPSM Kedah Lihat Sebelah
j2kk
SULIT
16
(ii) Explain why the pulse rate takes several minutes to return to normal after a vigorous
activity. Terangkan kenapa kadar denyutan nadi seseorang itu mengambil masa beberapa minit untuk kembali normal selepas melakukan aktiviti cergas.
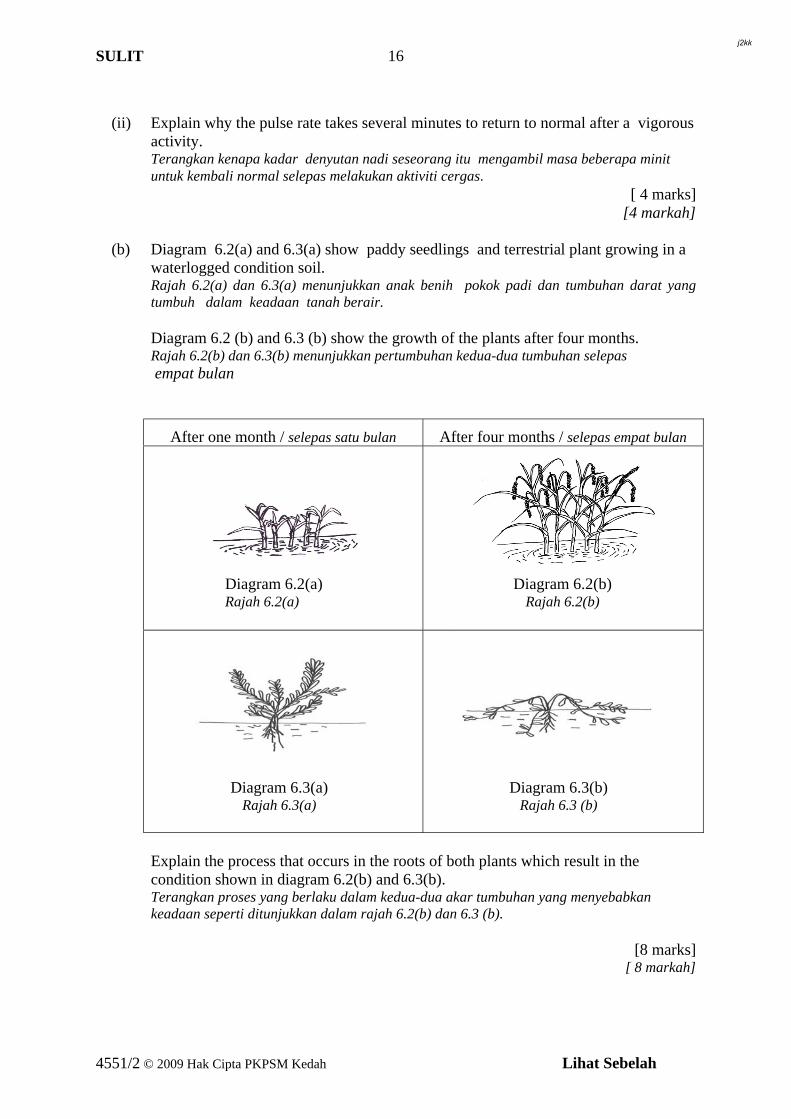
[ 4 marks] [4 markah] (b) Diagram 6.2(a) and 6.3(a) show paddy seedlings and terrestrial plant growing in a
waterlogged condition soil. Rajah 6.2(a) dan 6.3(a) menunjukkan anak benih pokok padi dan tumbuhan darat yang tumbuh dalam keadaan tanah berair.
Diagram 6.2 (b) and 6.3 (b) show the growth of the plants after four months.
Rajah 6.2(b) dan 6.3(b) menunjukkan pertumbuhan kedua-dua tumbuhan selepas empat bulan
After one month / selepas satu bulan After four months / selepas empat bulan
Explain the process that occurs in the roots of both plants which result in the
condition shown in diagram 6.2(b) and 6.3(b). Terangkan proses yang berlaku dalam kedua-dua akar tumbuhan yang menyebabkan keadaan seperti ditunjukkan dalam rajah 6.2(b) dan 6.3 (b).
[8 marks]
[ 8 markah]
Diagram 6.2(a) Rajah 6.2(a)
Diagram 6.2(b) Rajah 6.2(b)
Diagram 6.3(a) Rajah 6.3(a)
Diagram 6.3(b) Rajah 6.3 (b)
4551/2 © 2009 Hak Cipta PKPSM Kedah Lihat Sebelah
j2kk
SULIT
17
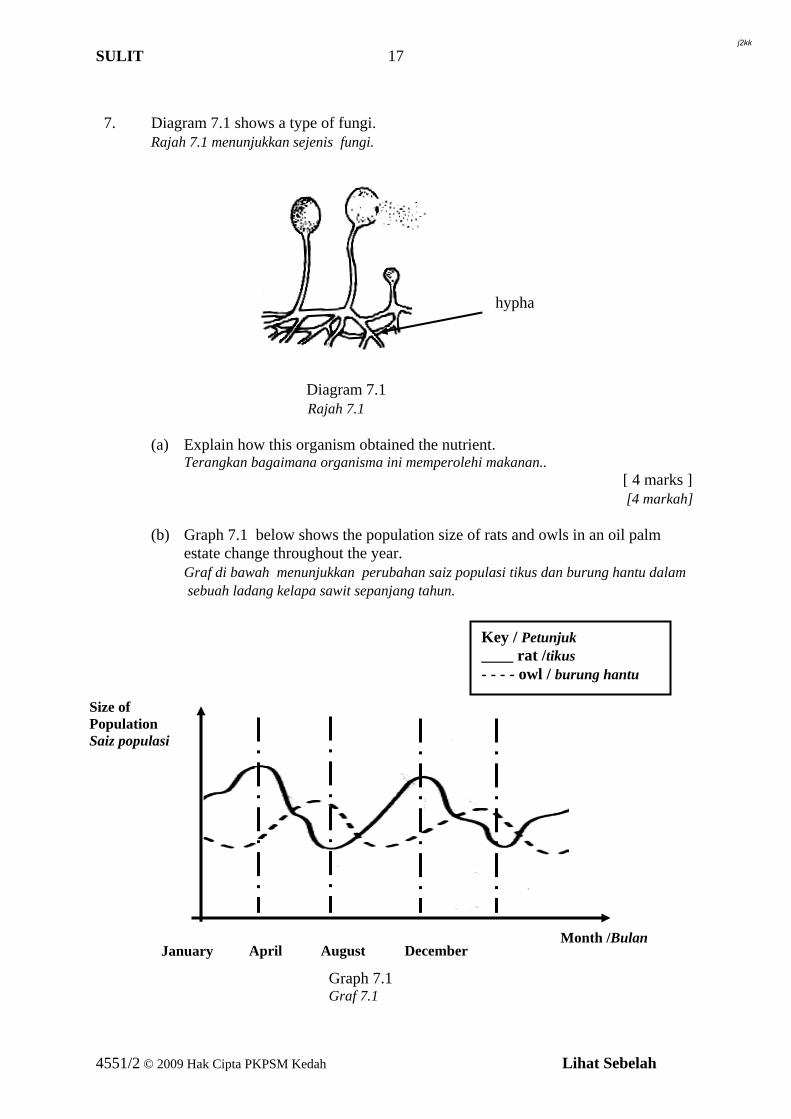
7. Diagram 7.1 shows a type of fungi. Rajah 7.1 menunjukkan sejenis fungi.
Diagram 7.1 Rajah 7.1 (a) Explain how this organism obtained the nutrient.
Terangkan bagaimana organisma ini memperolehi makanan.. [ 4 marks ]
[4 markah] (b)
Graph 7.1 below shows the population size of rats and owls in an oil palm estate change throughout the year.
Graf di bawah menunjukkan perubahan saiz populasi tikus dan burung hantu dalam sebuah ladang kelapa sawit sepanjang tahun.
hypha
January April August December
Graph 7.1 Graf 7.1
Size of Population Saiz populasi
Month /Bulan
Key / Petunjuk ____ rat /tikus - - - - owl / burung hantu
4551/2 © 2009 Hak Cipta PKPSM Kedah Lihat Sebelah
j2kk
SULIT
18
Based on graph 7.1, explain the changes in the size of population of the owls and the rats throughout the year.
Berdasarkan kepada graf di atas,huraikan perubahan saiz populasi bagi burung hantu dan tikus sepanjang tahun.
[ 6 marks ] [ 6 markah](c)
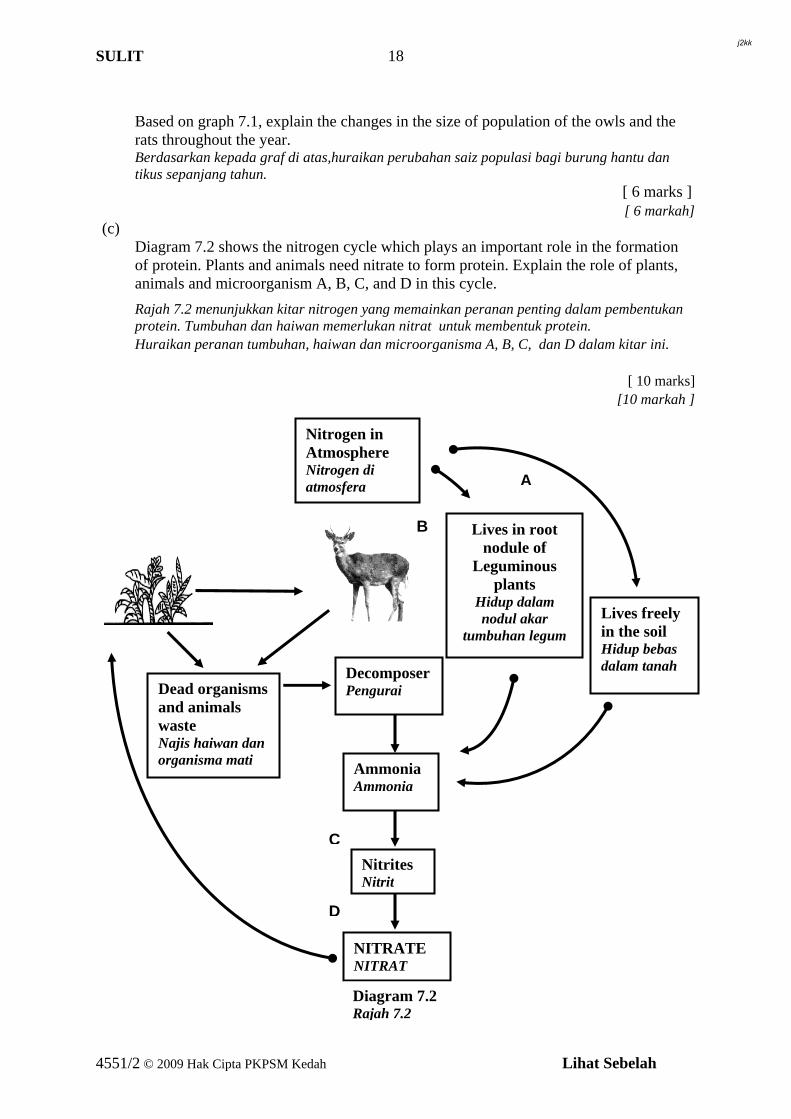
Diagram 7.2 shows the nitrogen cycle which plays an important role in the formation of protein. Plants and animals need nitrate to form protein. Explain the role of plants, animals and microorganism A, B, C, and D in this cycle.
Rajah 7.2 menunjukkan kitar nitrogen yang memainkan peranan penting dalam pembentukan protein. Tumbuhan dan haiwan memerlukan nitrat untuk membentuk protein.
Huraikan peranan tumbuhan, haiwan dan microorganisma A, B, C, dan D dalam kitar ini. [ 10 marks] [10 markah ]
Ammonia Ammonia
Decomposer Pengurai Dead organisms
and animals waste Najis haiwan dan organisma mati
Nitrites Nitrit
NITRATE NITRAT
Diagram 7.2
Lives in root nodule of
Leguminous plants
Hidup dalam nodul akar
tumbuhan legum
Lives freely in the soil Hidup bebas dalam tanah
A
B
Nitrogen in Atmosphere Nitrogen di atmosfera
Rajah 7.2
C
D
4551/2 © 2009 Hak Cipta PKPSM Kedah Lihat Sebelah
j2kk
SULIT
19
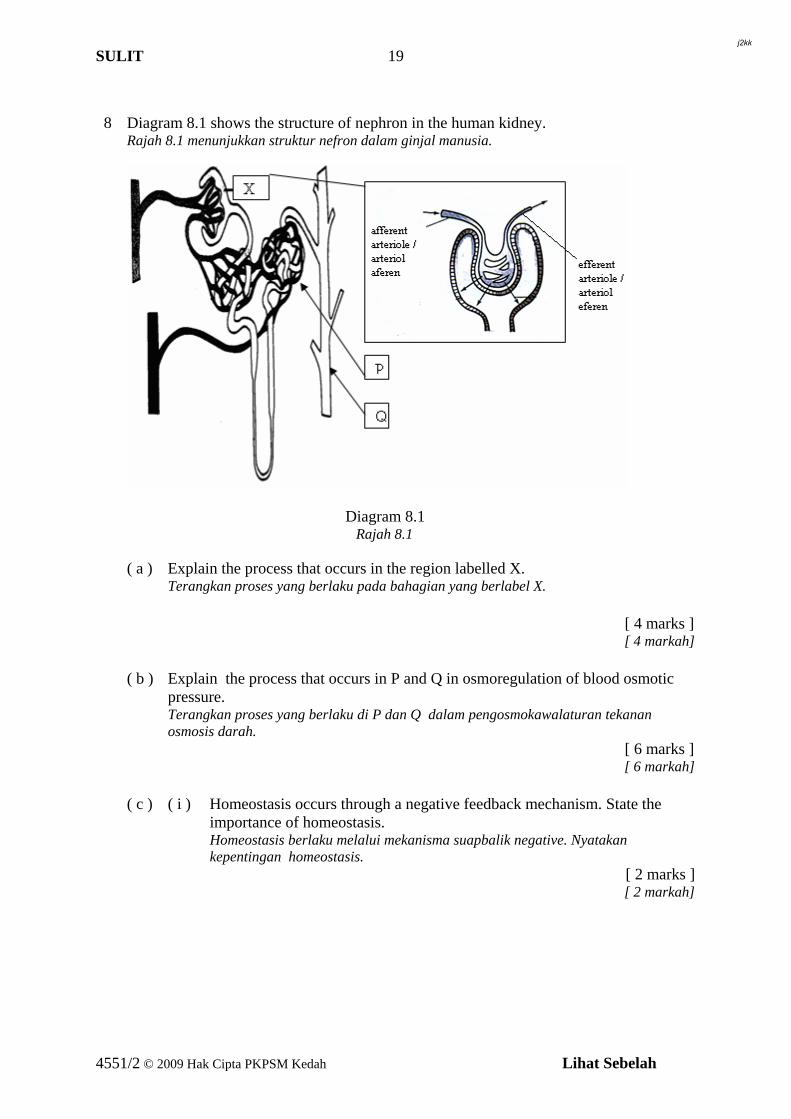
8 Diagram 8.1 shows the structure of nephron in the human kidney. Rajah 8.1 menunjukkan struktur nefron dalam ginjal manusia.
Diagram 8.1 Rajah 8.1 ( a ) Explain the process that occurs in the region labelled X. Terangkan proses yang berlaku pada bahagian yang berlabel X. [ 4 marks ] [ 4 markah] ( b ) Explain the process that occurs in P and Q in osmoregulation of blood osmotic
pressure. Terangkan proses yang berlaku di P dan Q dalam pengosmokawalaturan tekanan
osmosis darah. [ 6 marks ] [ 6 markah] ( c ) ( i ) Homeostasis occurs through a negative feedback mechanism. State the
importance of homeostasis. Homeostasis berlaku melalui mekanisma suapbalik negative. Nyatakan
kepentingan homeostasis. [ 2 marks ] [ 2 markah]
4551/2 © 2009 Hak Cipta PKPSM Kedah Lihat Sebelah
j2kk
SULIT
20
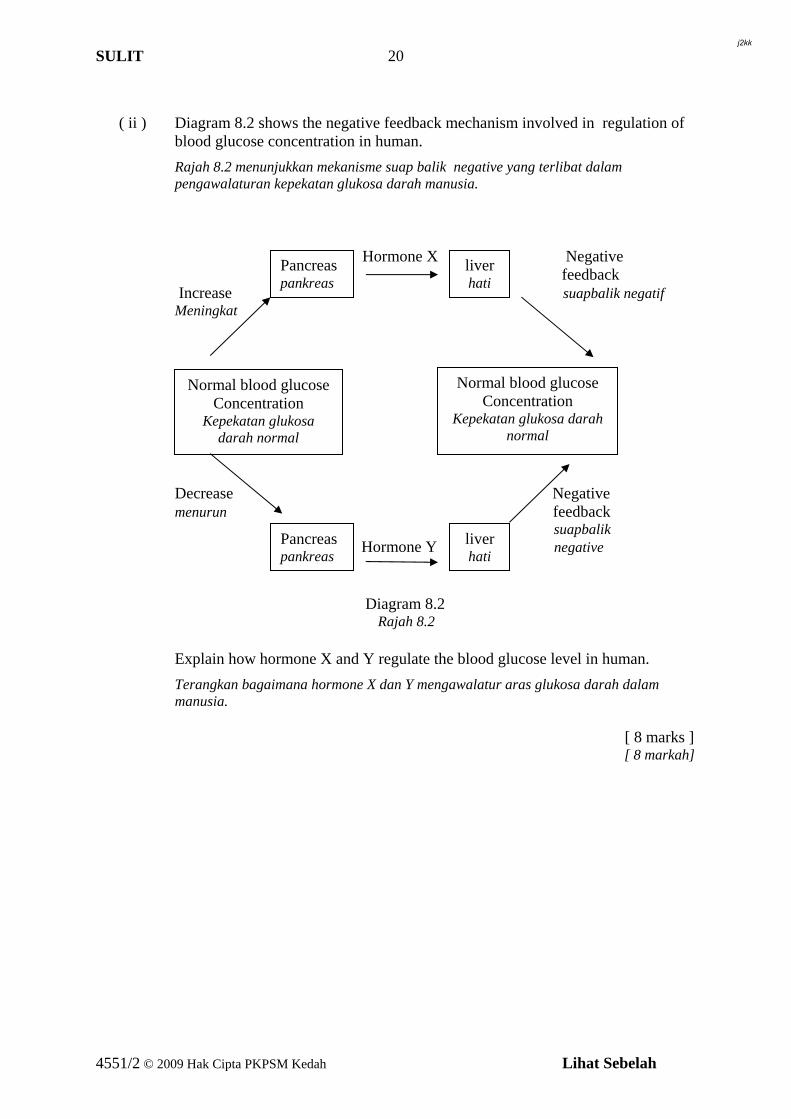
( ii ) Diagram 8.2 shows the negative feedback mechanism involved in regulation of
blood glucose concentration in human. Rajah 8.2 menunjukkan mekanisme suap balik negative yang terlibat dalam
pengawalaturan kepekatan glukosa darah manusia.
Hormone X Negative feedback Increase suapbalik negatif Meningkat Decrease Negative menurun feedback suapbalik Hormone Y negative
Diagram 8.2 Rajah 8.2 Explain how hormone X and Y regulate the blood glucose level in human. Terangkan bagaimana hormone X dan Y mengawalatur aras glukosa darah dalam
manusia. [ 8 marks ] [ 8 markah]
Normal blood glucose Concentration
Kepekatan glukosa darah normal
Normal blood glucose Concentration
Kepekatan glukosa darah normal
Pancreas pankreas
liver hati
Pancreas pankreas
liver hati
4551/2 © 2009 Hak Cipta PKPSM Kedah Lihat Sebelah
j2kk
SULIT
21
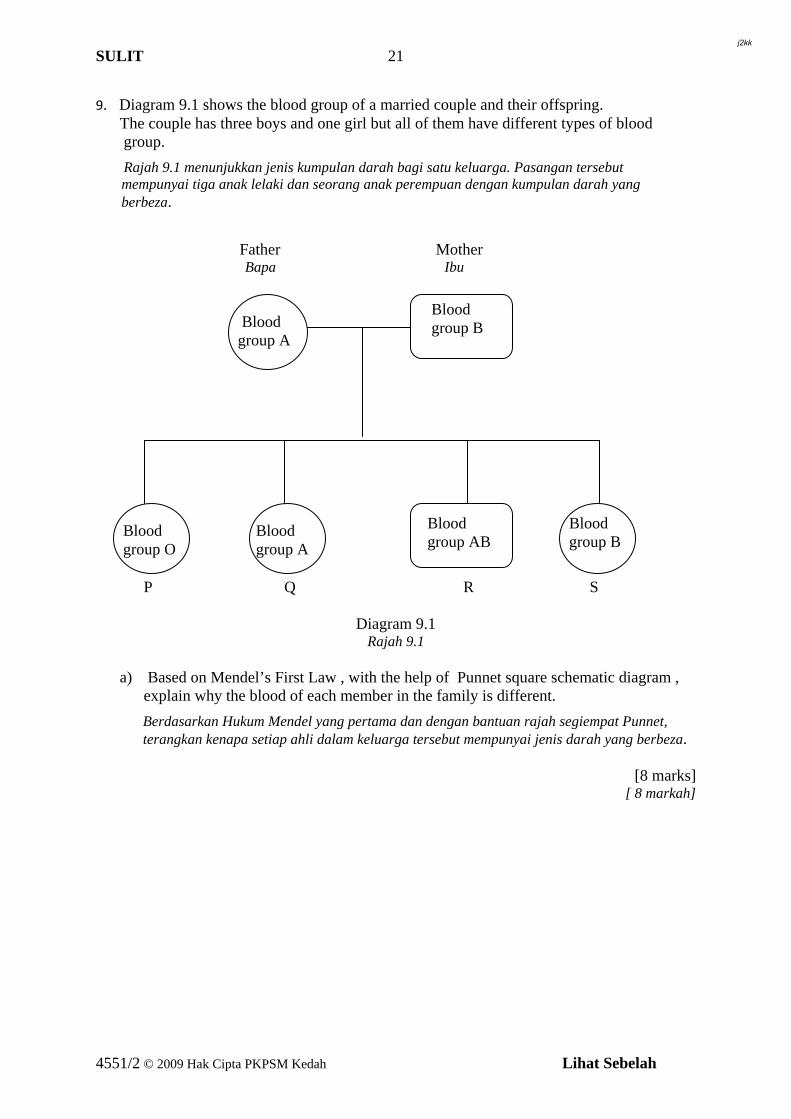
9. Diagram 9.1 shows the blood group of a married couple and their offspring. The couple has three boys and one girl but all of them have different types of blood group.
Rajah 9.1 menunjukkan jenis kumpulan darah bagi satu keluarga. Pasangan tersebut mempunyai tiga anak lelaki dan seorang anak perempuan dengan kumpulan darah yang berbeza.
Father Bapa
Mother Ibu
Blood group O
Blood group A
Blood group B
Blood group A
Blood group AB
Blood group B
P Q R S
Diagram 9.1 Rajah 9.1
a) Based on Mendel’s First Law , with the help of Punnet square schematic diagram ,
explain why the blood of each member in the family is different.
Berdasarkan Hukum Mendel yang pertama dan dengan bantuan rajah segiempat Punnet, terangkan kenapa setiap ahli dalam keluarga tersebut mempunyai jenis darah yang berbeza.
[8 marks] [ 8 markah]
4551/2 © 2009 Hak Cipta PKPSM Kedah Lihat Sebelah
j2kk
SULIT
22
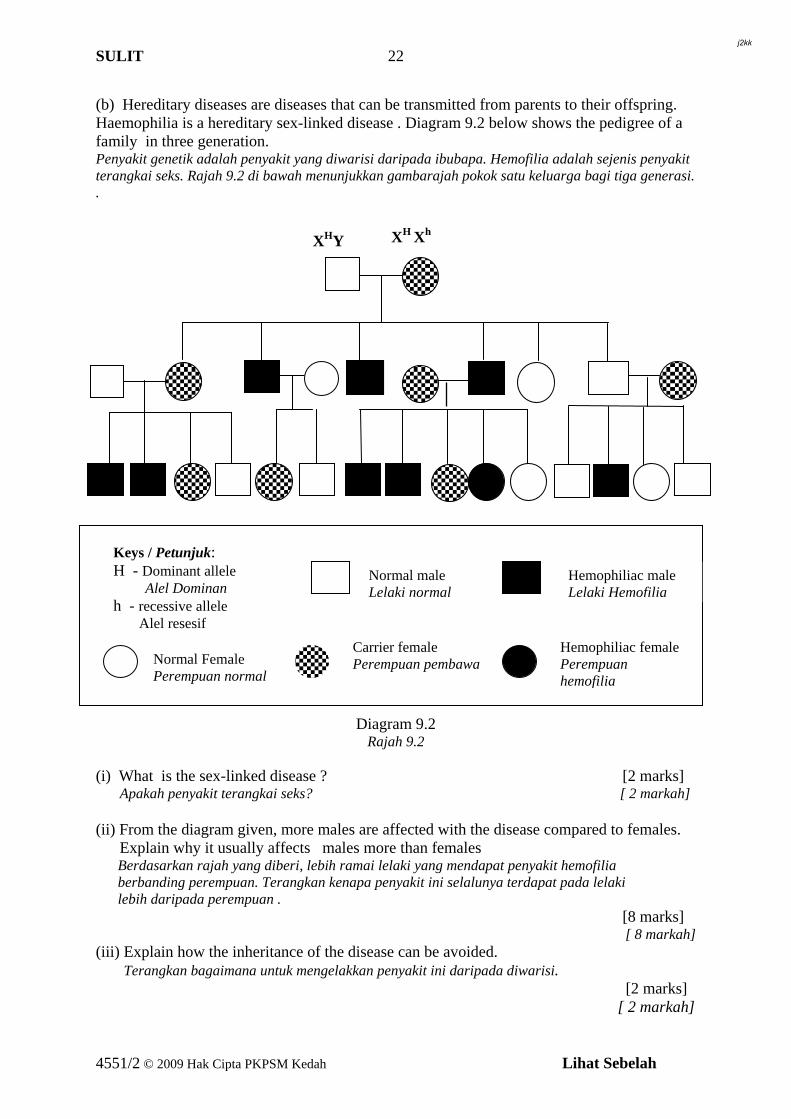
(b) Hereditary diseases are diseases that can be transmitted from parents to their offspring. Haemophilia is a hereditary sex-linked disease . Diagram 9.2 below shows the pedigree of a family in three generation. Penyakit genetik adalah penyakit yang diwarisi daripada ibubapa. Hemofilia adalah sejenis penyakit terangkai seks. Rajah 9.2 di bawah menunjukkan gambarajah pokok satu keluarga bagi tiga generasi. .
Hemophiliac female
Perempuan hemofilia
Normal Female Perempuan normal
Normal male
Keys / Petunjuk: H - Dominant allele Alel Dominan h - recessive allele Alel resesif
Lelaki normal
Carrier female Perempuan pembawa
Hemophiliac male Lelaki Hemofilia
XH XhXHY
Diagram 9.2 Rajah 9.2
(i) What is the sex-linked disease ? [2 marks] Apakah penyakit terangkai seks? [ 2 markah] (ii) From the diagram given, more males are affected with the disease compared to females. Explain why it usually affects males more than females Berdasarkan rajah yang diberi, lebih ramai lelaki yang mendapat penyakit hemofilia berbanding perempuan. Terangkan kenapa penyakit ini selalunya terdapat pada lelaki lebih daripada perempuan . [8 marks]
[ 8 markah] (iii) Explain how the inheritance of the disease can be avoided. Terangkan bagaimana untuk mengelakkan penyakit ini daripada diwarisi.
[2 marks] [ 2 markah]
4551/2 © 2009 Hak Cipta PKPSM Kedah Lihat Sebelah
j2kk
SULIT 4551/3
Name:………………………………………………………. Form : ………………..
PEPERIKSAAN PERCUBAAN SPM 2009 4551/3 BIOLOGY Kertas 3 September 1 ½ jam Satu jam tiga puluh minit
PERSIDANGAN KEBANGSAAN PENGETUA-PENGETUA SEKOLAH MENENGAH
NEGERI KEDAH DARUL AMAN
JANGAN BUKA KERTAS SOALAN INI SEHINGGA DIBERITAHU
1. Tuliskan nama anda pada ruang yang disediakan.
2. Kertas soalan ini adalah dalam
dwibahasa. 3. Soalan dalam bahasa Inggeris
mendahului soalan yang sepadan dalam bahasa Melayu.
4. Calon dibenarkan menjawab
keseluruhan atau sebahagian soalan sama ada dalam bahasa Inggeris atau bahasa Melayu.
5. Calon dikehendaki membaca arahan di halaman 2
Soalan Markah
Penuh Markah
Diperoleh 1
33
2
Respons
17
Jumlah
Kertas soalan ini mengandungi 11 halaman bercetak
4551/3 © PKPSM Kedah [Lihat sebelah SULIT
j2kk
4551/3 © PKPSM Kedah [Lihat sebelah SULIT
MAKLUMAT UNTUK CALON
1. This question paper consist of two questions: Question 1 and Question 2 Kertas soalan ini mengandungi dua soalan. Soalan 1 dan soalan 2
2. Answer all questions. Write your answers for Question 1 in the spaces provided in this
question paper. Jawab semua soalan .Tulis jawapan anda bagi Soalan 1 pada ruangyang disediakan dalam kertas soalan ini.
3. Write your answer for Question 2 on the answer sheets provided.You may used
equations, diagrams, tables, graphs, and other suitable methods to explain your answers Tuliskan jawapan bagi Soalan 2 pada kertas jawapan yang disediakan. Anda boleh menggunakan persamaan, gambar rajah, jadual, graf dan cara lain yang sesuai untuk menjelaskan jawapan anda.
4. Show your working, it may help you to get marks.
Tunjukkan kerja mengira, ini membantu anda mendapatkan markah.
5. If you wish to change your answers, cross out the answers that you have done. Then write down the new answers
Sekiranya anda hendak membatalkan sesuatu jawapan, batalkan jawapan yang telah dibuat. Kemudian tulis jawapan yang baru.
6. You are advised to spend 45 minutes to answer Question 1 and 45 minutes for Question 2
Masa yang dicadangkan untuk menjawab Soalan 1 ialah 45 minit dan Soalan 2 ialah 45 minit.
Pemberian markah : Skor Penerangan
3
Cemerlang : Respons yang paling baik
2
Memuaskan : Respons yang sederhana
1
Lemah : Respons yang kurang tepat
0
Respons salah atau tiada memberi respons
j2kk

4551/3 © PKPSM Kedah [Lihat sebelah SULIT
j2kk
SULIT 4551/3
Answer all questions Jawab semua soalan
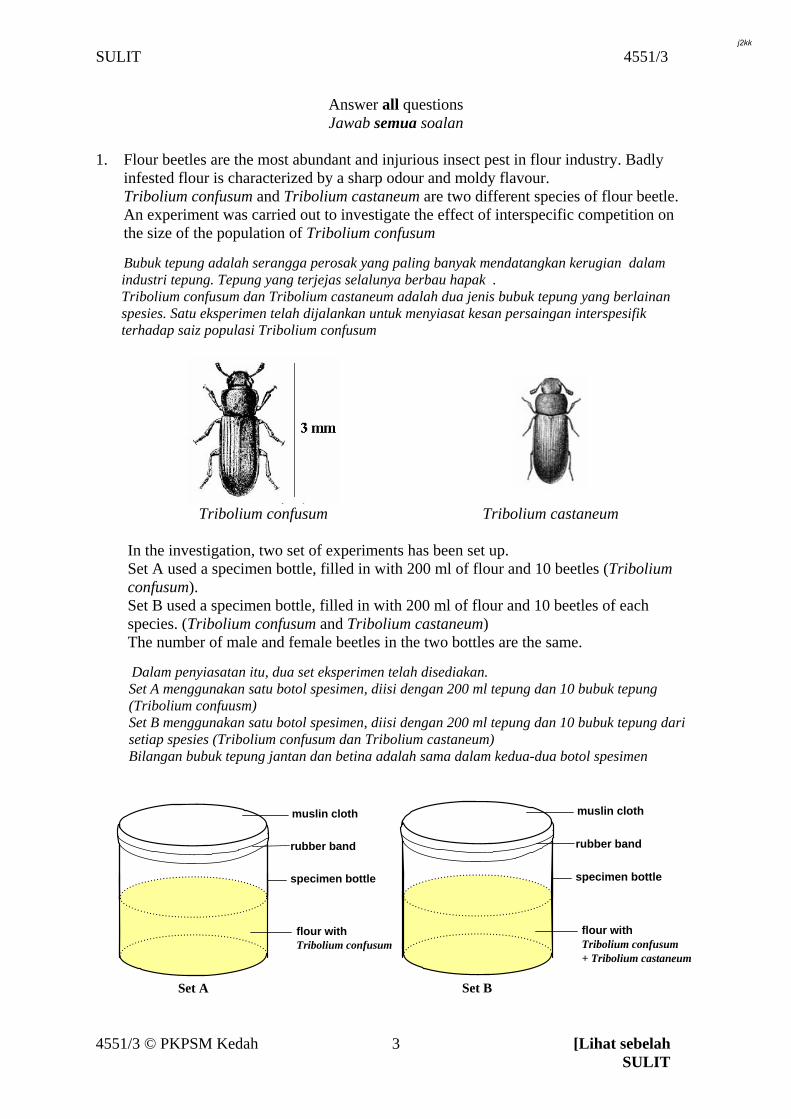
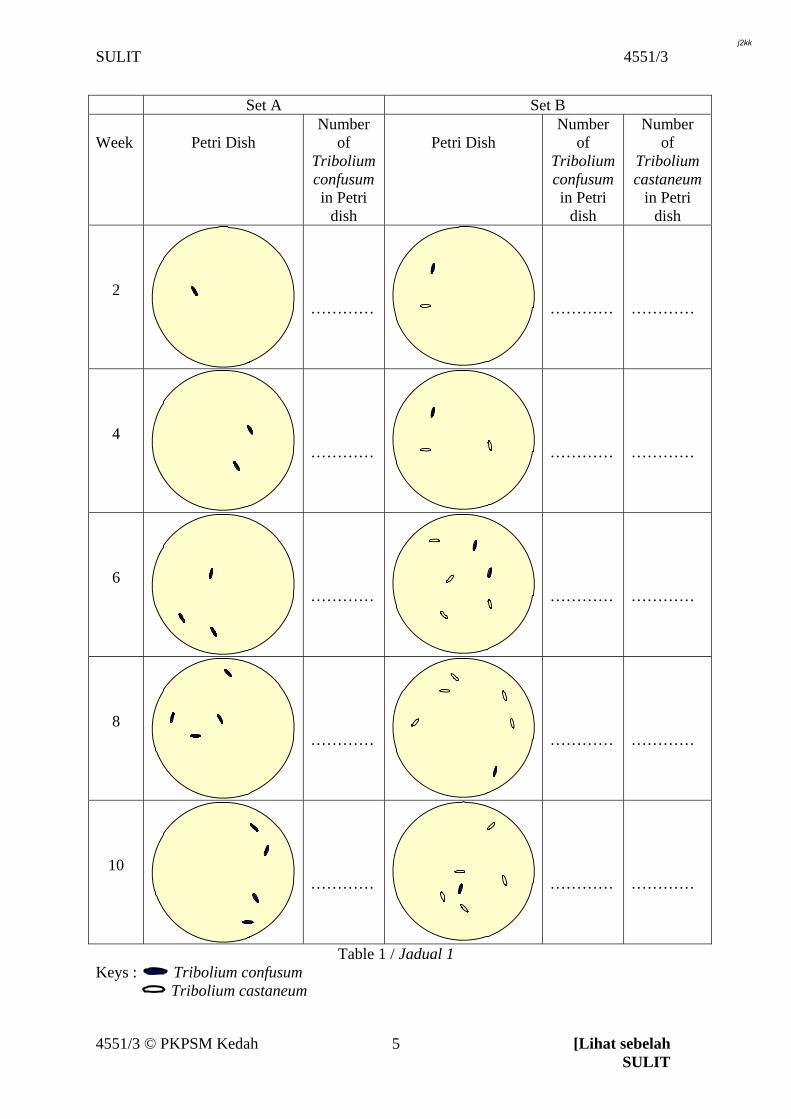
1. Flour beetles are the most abundant and injurious insect pest in flour industry. Badly infested flour is characterized by a sharp odour and moldy flavour. Tribolium confusum and Tribolium castaneum are two different species of flour beetle. An experiment was carried out to investigate the effect of interspecific competition on the size of the population of Tribolium confusum
Bubuk tepung adalah serangga perosak yang paling banyak mendatangkan kerugian dalam industri tepung. Tepung yang terjejas selalunya berbau hapak . Tribolium confusum dan Tribolium castaneum adalah dua jenis bubuk tepung yang berlainan spesies. Satu eksperimen telah dijalankan untuk menyiasat kesan persaingan interspesifik terhadap saiz populasi Tribolium confusum
Tribolium confusum Tribolium castaneum
In the investigation, two set of experiments has been set up. Set A used a specimen bottle, filled in with 200 ml of flour and 10 beetles (Tribolium confusum). Set B used a specimen bottle, filled in with 200 ml of flour and 10 beetles of each species. (Tribolium confusum and Tribolium castaneum) The number of male and female beetles in the two bottles are the same.
Dalam penyiasatan itu, dua set eksperimen telah disediakan. Set A menggunakan satu botol spesimen, diisi dengan 200 ml tepung dan 10 bubuk tepung (Tribolium confuusm) Set B menggunakan satu botol spesimen, diisi dengan 200 ml tepung dan 10 bubuk tepung dari setiap spesies (Tribolium confusum dan Tribolium castaneum) Bilangan bubuk tepung jantan dan betina adalah sama dalam kedua-dua botol spesimen
muslin cloth
rubber band
specimen bottle
flour withTribolium confusum
Set A
muslin cloth
rubber band
specimen bottle
flour withTribolium confusum+ Tribolium castaneum
Set B
4551/3 © PKPSM Kedah [Lihat sebelah SULIT
3
j2kk
SULIT 4551/3
specimen bottle
flour withbeetles
spoon spatula
5
10 flour with beetles
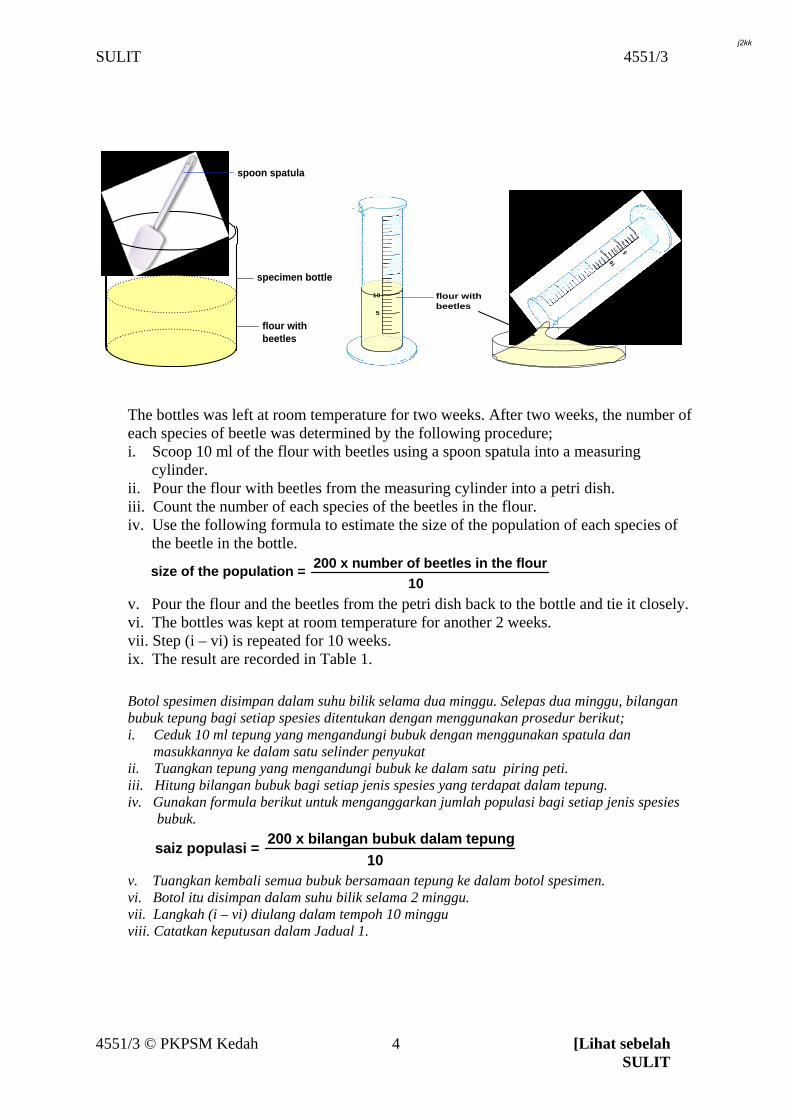
The bottles was left at room temperature for two weeks. After two weeks, the number of each species of beetle was determined by the following procedure; i. Scoop 10 ml of the flour with beetles using a spoon spatula into a measuring cylinder. ii. Pour the flour with beetles from the measuring cylinder into a petri dish. iii. Count the number of each species of the beetles in the flour. iv. Use the following formula to estimate the size of the population of each species of the beetle in the bottle.
200 x number of beetles in the flour
10size of the population =
v. Pour the flour and the beetles from the petri dish back to the bottle and tie it closely. vi. The bottles was kept at room temperature for another 2 weeks. vii. Step (i – vi) is repeated for 10 weeks. ix. The result are recorded in Table 1.
Botol spesimen disimpan dalam suhu bilik selama dua minggu. Selepas dua minggu, bilangan bubuk tepung bagi setiap spesies ditentukan dengan menggunakan prosedur berikut; i. Ceduk 10 ml tepung yang mengandungi bubuk dengan menggunakan spatula dan masukkannya ke dalam satu selinder penyukat ii. Tuangkan tepung yang mengandungi bubuk ke dalam satu piring peti. iii. Hitung bilangan bubuk bagi setiap jenis spesies yang terdapat dalam tepung. iv. Gunakan formula berikut untuk menganggarkan jumlah populasi bagi setiap jenis spesies bubuk.
200 x bilangan bubuk dalam tepung
10saiz populasi =
v. Tuangkan kembali semua bubuk bersamaan tepung ke dalam botol spesimen. vi. Botol itu disimpan dalam suhu bilik selama 2 minggu. vii. Langkah (i – vi) diulang dalam tempoh 10 minggu viii. Catatkan keputusan dalam Jadual 1.
4551/3 © PKPSM Kedah [Lihat sebelah SULIT
4
j2kk
SULIT 4551/3
Set A Set B Week
Petri Dish
Number of
Tribolium confusum in Petri
dish
Petri Dish
Number of
Tribolium confusum in Petri
dish
Number of
Tribolium castaneum
in Petri dish
2
…………
…………
…………
4
…………
…………
…………
6
…………
…………
…………
8
…………
…………
…………
10
…………
…………
…………
Table 1 / Jadual 1 Keys : Tribolium confusum Tribolium castaneum
4551/3 © PKPSM Kedah [Lihat sebelah SULIT
5
j2kk
SULIT 4551/3
(a) Record the number of each species of the beetle in Table 1. Catatkan bilangan bubuk bagi setiap spesies dalam Jadual 1.
[ 3 marks / markah ]
(b) (i) State two different observations on the number of Tribolium confusum made from Table 1. Nyatakan dua pemerhatian yang berbeza ke atas bilangan Tribolium confusum yang dibuat daripada Jadual 1. Observation 1 / Pemerhatian 1 : ……………….………………………………………………………………………… ………………..……………………………………………………………………….. ………………………………………………………………………………………… Observation 2 / Pemerhatian 2 : ………………………………………………………………………………………… ………………………………………………………………………………………… …………………………………………………………………………………………
[ 3 marks / markah ] (ii) State the inference from the observations in 1(b)(i). Nyatakan inferens daripada pemerhatian di 1(b)(i). Inference 1 / Inferens 1 : ........................................................................................................................................ ........................................................................................................................................ ........................................................................................................................................ Inference 2 / Inferens 2 : ....................................................................................................................................... ....................................................................................................................................... ......................................................................................................................................
[ 3 marks / markah ]
4551/3 © PKPSM Kedah [Lihat sebelah SULIT
6
j2kk
SULIT 4551/3
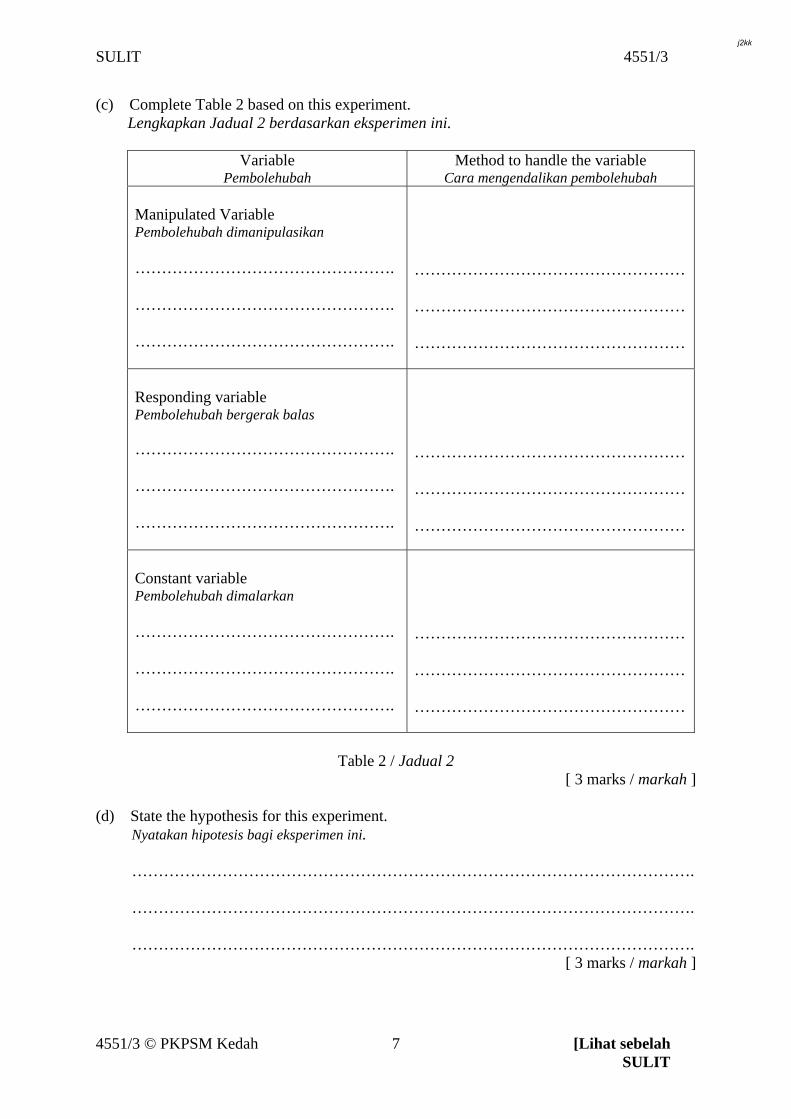
(c) Complete Table 2 based on this experiment. Lengkapkan Jadual 2 berdasarkan eksperimen ini.
Variable Pembolehubah
Method to handle the variable Cara mengendalikan pembolehubah
Manipulated Variable Pembolehubah dimanipulasikan …………………………………………. …………………………………………. ………………………………………….
…………………………………………… …………………………………………… ……………………………………………
Responding variable Pembolehubah bergerak balas …………………………………………. …………………………………………. ………………………………………….
…………………………………………… …………………………………………… ……………………………………………
Constant variable Pembolehubah dimalarkan …………………………………………. …………………………………………. ………………………………………….
…………………………………………… …………………………………………… ……………………………………………
Table 2 / Jadual 2
[ 3 marks / markah ] (d) State the hypothesis for this experiment. Nyatakan hipotesis bagi eksperimen ini. ……………………………………………………………………………………………. ……………………………………………………………………………………………. …………………………………………………………………………………………….
[ 3 marks / markah ]
4551/3 © PKPSM Kedah [Lihat sebelah SULIT
7
j2kk
SULIT 4551/3
(e) (i) Construct a table and record all the data collected in this experiment. Bina satu jadual dan rekodkan semua data yang dikumpul dalam eksperimen ini. Your table should have the following aspects : Jadual anda hendaklah mengandungi aspek-aspek berikut: - Week of the experiment Minggu eksperimen - Number of each species of the beetles in the Petri dish of Set A and Set B. Bilangan bubuk tepung bagi setiap spesies dalam piring Petri Set A dan Set B. - The population of each species of the beetles in Set A and Set B Jumlah populasi bagi setiap spesies dalam Set A dan Set B.
[ 3 marks / markah ] (ii) Use the data in 1(e)(i) and on the same piece of graph paper, plot the graphs to show the changes of the population of each species of beetles in 10 weeks. Gunakan data dalam 1(e)(i) dan di atas kertas graf yang yang sama, plotkan graf bagi menunjukkan perubahan populasi bagi setiap spesies bubuk dalam masa 10 minggu.
[ 3 marks / markah ]
4551/3 © PKPSM Kedah [Lihat sebelah SULIT
8
j2kk
SULIT 4551/3
(f) Based on the graphs in 1(e)(ii), explain the relationship between the presence of Tribolium castaneum and the changes of population of Tribolium confusum in Set A and Set B. Berdasarkan graf di 1(e)(ii), terangkan hubungan antara kehadiran Tribolium castaneum dengan perubahan populasi Tribolium confusum dalam Set A dan Set B. ……………………………………………………………………………………………. ……………………………………………………………………………………………. ……………………………………………………………………………………………
[ 3 marks / markah ]
(g) Based on the results of this experiment, what can be deduced about interspecific competition? Berdasarkan keputusan eksperimen ini, apa yang dapat dirumuskan tentang persaingan interspesifik? …………………………………………………………………………………………… …………………………………………………………………………………………… ……………………………………………………………………………………………
[ 3 marks / markah ] (h) The experiment is repeated by a group of students in rainy season, based on the results of this experiment, predict the changes of the population of Tribolium confusum in Set A Explain your prediction. Eksperimen ini diulangi oleh sekumpulan pelajar dalam musim hujan, berdasarkan keputusan eksperimen ini, ramalkan perubahan populasi Tribolium confusum dalam Set A. Terangkan ramalan anda. …………………………………………………………………………………………… …………………………………………………………………………………………… …………………………………………………………………………………………… ……………………………………………………………………………………………
[ 3 marks / markah ]
4551/3 © PKPSM Kedah [Lihat sebelah SULIT
9
j2kk
SULIT 4551/3
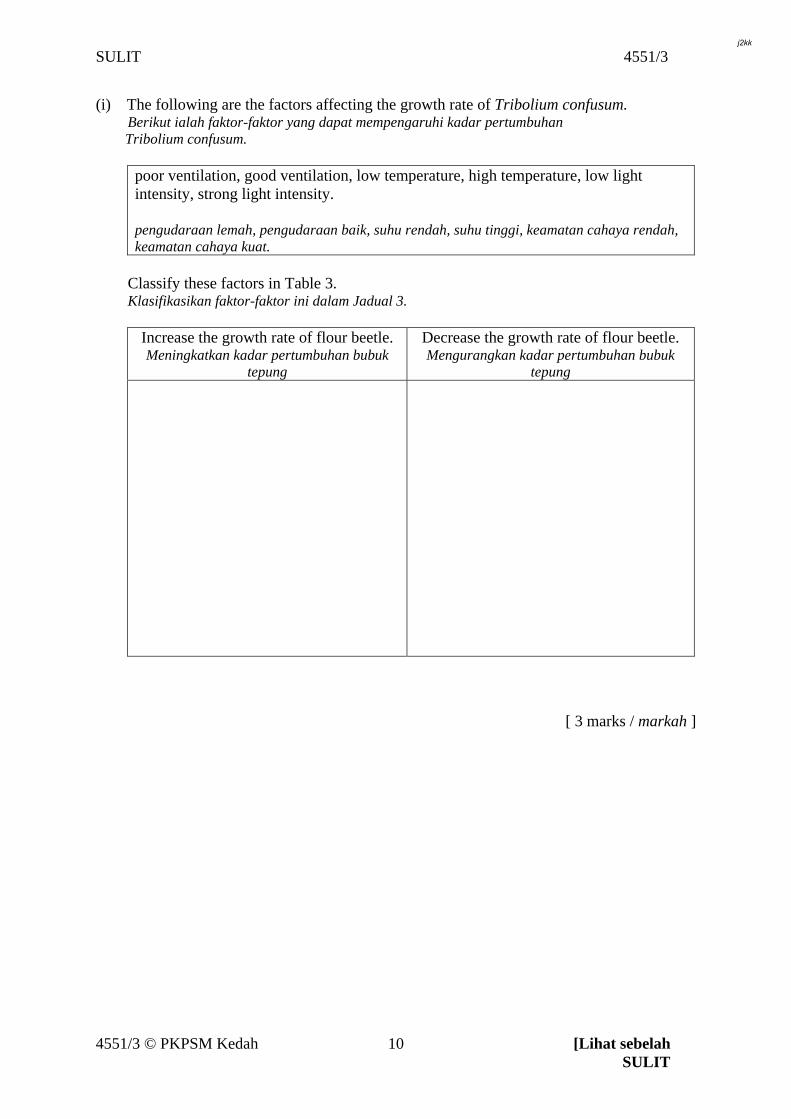
(i) The following are the factors affecting the growth rate of Tribolium confusum. Berikut ialah faktor-faktor yang dapat mempengaruhi kadar pertumbuhan Tribolium confusum.
poor ventilation, good ventilation, low temperature, high temperature, low light intensity, strong light intensity. pengudaraan lemah, pengudaraan baik, suhu rendah, suhu tinggi, keamatan cahaya rendah, keamatan cahaya kuat.
Classify these factors in Table 3. Klasifikasikan faktor-faktor ini dalam Jadual 3.
Increase the growth rate of flour beetle. Meningkatkan kadar pertumbuhan bubuk
tepung
Decrease the growth rate of flour beetle. Mengurangkan kadar pertumbuhan bubuk
tepung
[ 3 marks / markah ]
4551/3 © PKPSM Kedah [Lihat sebelah SULIT
10
j2kk
SULIT 4551/3
4551/3 © PKPSM Kedah [Lihat sebelah SULIT
11
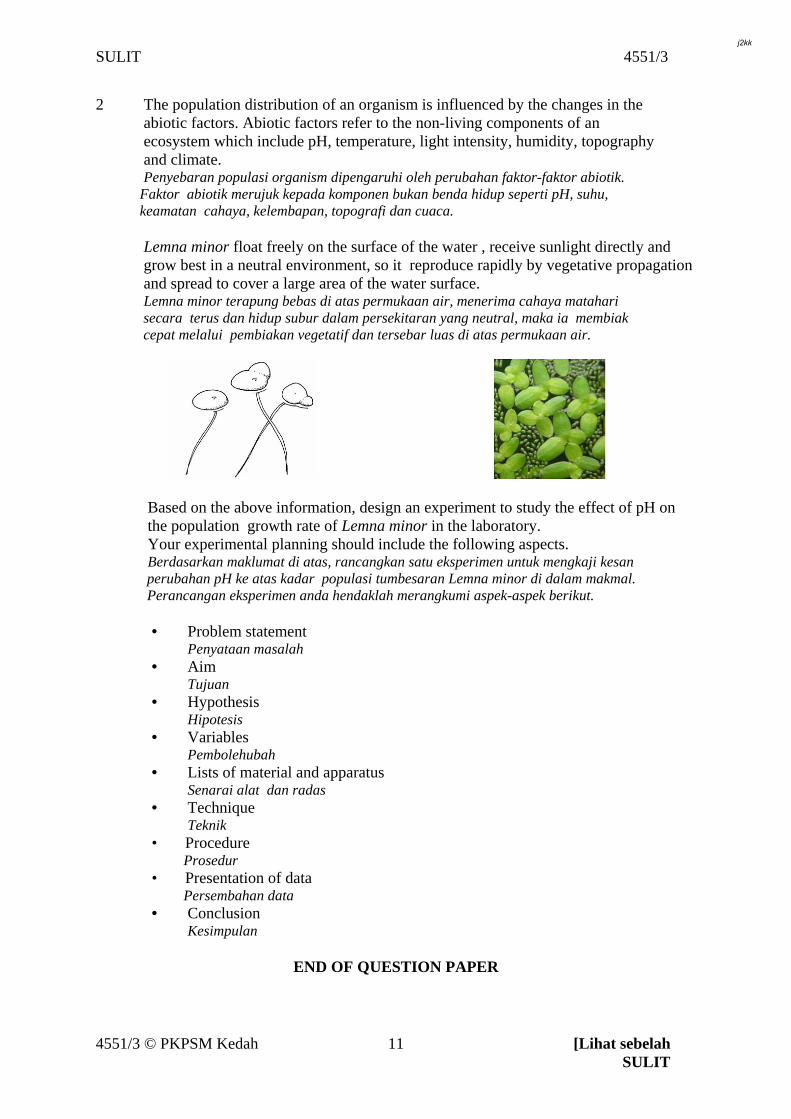
2 The population distribution of an organism is influenced by the changes in the abiotic factors. Abiotic factors refer to the non-living components of an ecosystem which include pH, temperature, light intensity, humidity, topography and climate. Penyebaran populasi organism dipengaruhi oleh perubahan faktor-faktor abiotik. Faktor abiotik merujuk kepada komponen bukan benda hidup seperti pH, suhu, keamatan cahaya, kelembapan, topografi dan cuaca. Lemna minor float freely on the surface of the water , receive sunlight directly and grow best in a neutral environment, so it reproduce rapidly by vegetative propagation and spread to cover a large area of the water surface. Lemna minor terapung bebas di atas permukaan air, menerima cahaya matahari secara terus dan hidup subur dalam persekitaran yang neutral, maka ia membiak cepat melalui pembiakan vegetatif dan tersebar luas di atas permukaan air.
Based on the above information, design an experiment to study the effect of pH on the population growth rate of Lemna minor in the laboratory. Your experimental planning should include the following aspects. Berdasarkan maklumat di atas, rancangkan satu eksperimen untuk mengkaji kesan perubahan pH ke atas kadar populasi tumbesaran Lemna minor di dalam makmal. Perancangan eksperimen anda hendaklah merangkumi aspek-aspek berikut.
• Problem statement Penyataan masalah
• Aim Tujuan
• Hypothesis Hipotesis
• Variables Pembolehubah
• Lists of material and apparatus Senarai alat dan radas
• Technique Teknik
• Procedure Prosedur • Presentation of data Persembahan data • Conclusion
Kesimpulan
END OF QUESTION PAPER
j2kk
Biology Paper 1 Sept 2009 1¼ jam PERSIDANGAN KEBANGSAAN PENGETUA-PENGETUA
SEKOLAH MENENGAH NEGERI KEDAH DARUL AMAN
_______________________________________________
PEPERIKSAAN PERCUBAAN SIJIL PELAJARAN MALAYSIA 2009
BIOLOGY PAPER 1 / 2 / 3
SKEMA JAWAPAN
j2kk
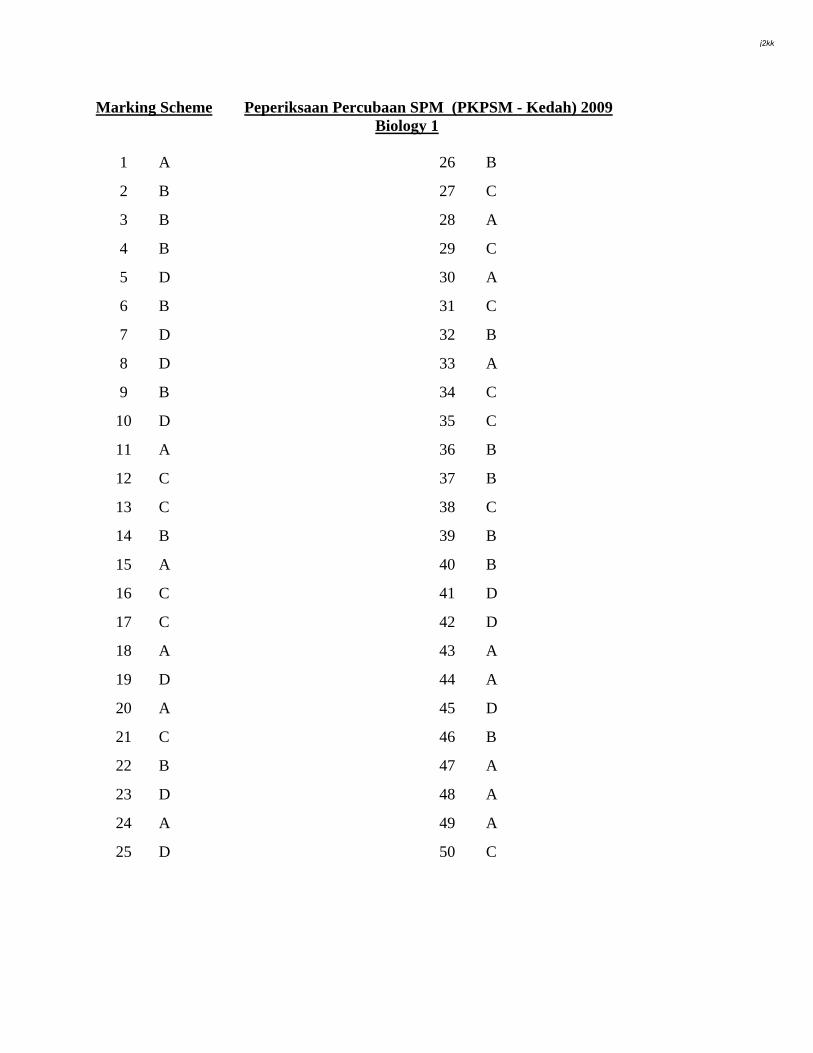
Marking Scheme Peperiksaan Percubaan SPM (PKPSM - Kedah) 2009 Biology 1
1 A 26 B
2 B 27 C
3 B 28 A
4 B 29 C
5 D 30 A
6 B 31 C
7 D 32 B
8 D 33 A
9 B 34 C
10 D 35 C
11 A 36 B
12 C 37 B
13 C 38 C
14 B 39 B
15 A 40 B
16 C 41 D
17 C 42 D
18 A 43 A
19 D 44 A
20 A 45 D
21 C 46 B
22 B 47 A
23 D 48 A
24 A 49 A
25 D 50 C
j2kk
BIOLOGY SECTION A
PAPER 2 [4551/2]
No.
Marking Scheme Mark
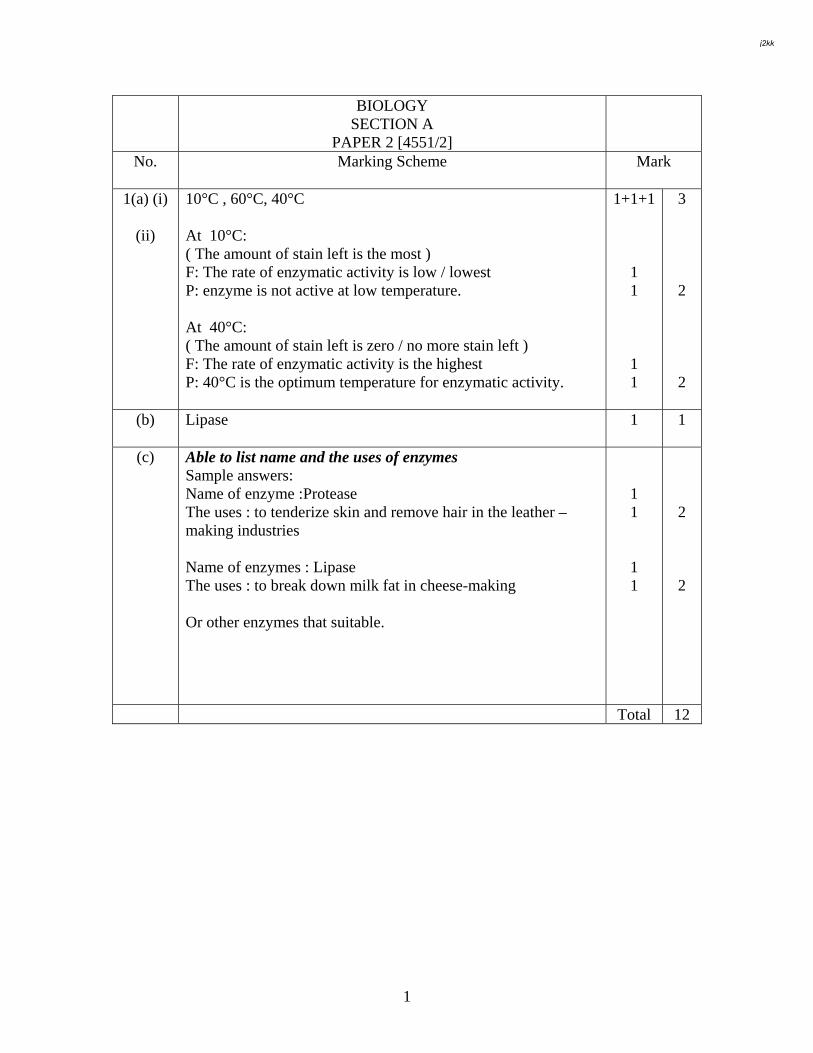
1(a) (i)
(ii)
10°C , 60°C, 40°C At 10°C: ( The amount of stain left is the most ) F: The rate of enzymatic activity is low / lowest P: enzyme is not active at low temperature. At 40°C: ( The amount of stain left is zero / no more stain left ) F: The rate of enzymatic activity is the highest P: 40°C is the optimum temperature for enzymatic activity.
1+1+1
1 1 1 1
3 2 2
(b) Lipase 1
1
(c) Able to list name and the uses of enzymes Sample answers: Name of enzyme :Protease The uses : to tenderize skin and remove hair in the leather – making industries Name of enzymes : Lipase The uses : to break down milk fat in cheese-making Or other enzymes that suitable.
1 1 1 1
2 2
Total 12
1
j2kk
No.
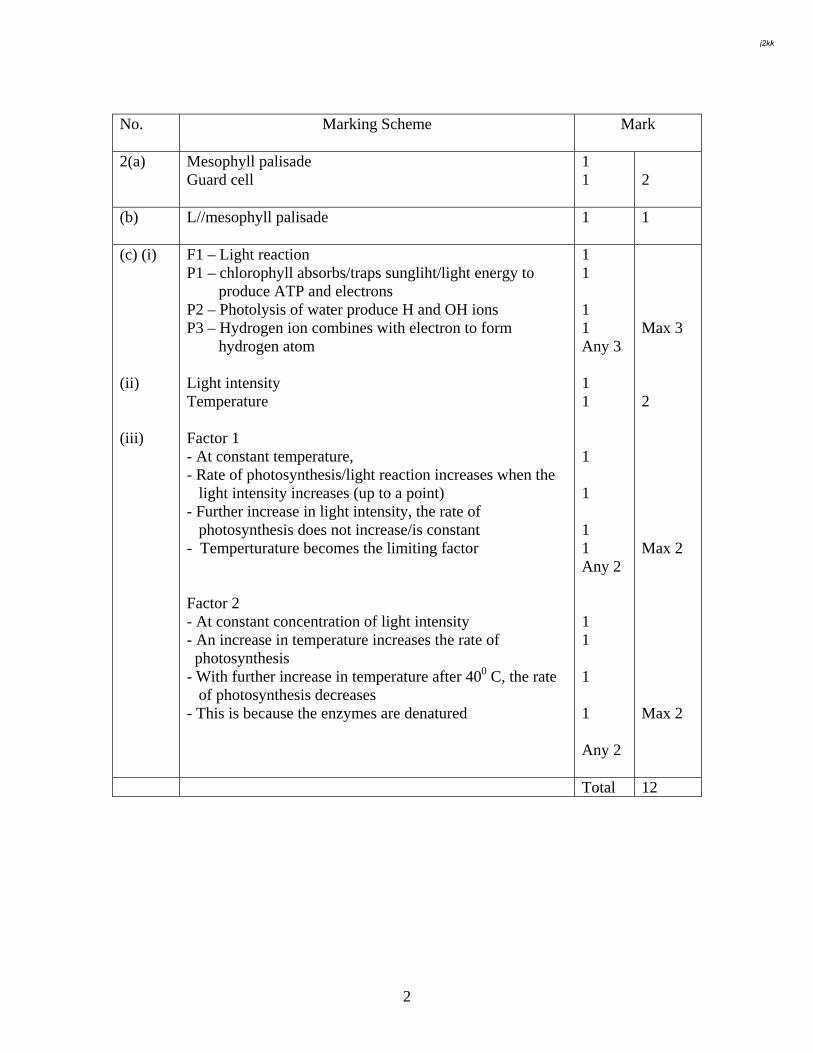
Marking Scheme Mark
2(a) Mesophyll palisade Guard cell
1 1
2
(b) L//mesophyll palisade
1 1
(c) (i) (ii) (iii)
F1 – Light reaction P1 – chlorophyll absorbs/traps sungliht/light energy to produce ATP and electrons P2 – Photolysis of water produce H and OH ions P3 – Hydrogen ion combines with electron to form hydrogen atom Light intensity Temperature Factor 1 - At constant temperature, - Rate of photosynthesis/light reaction increases when the light intensity increases (up to a point) - Further increase in light intensity, the rate of photosynthesis does not increase/is constant - Temperturature becomes the limiting factor
Factor 2 - At constant concentration of light intensity - An increase in temperature increases the rate of photosynthesis - With further increase in temperature after 400 C, the rate of photosynthesis decreases - This is because the enzymes are denatured
1 1 1 1 Any 3 1 1 1 1 1 1 Any 2 1 1 1 1 Any 2
Max 3 2 Max 2 Max 2
Total 12
2
j2kk
No.
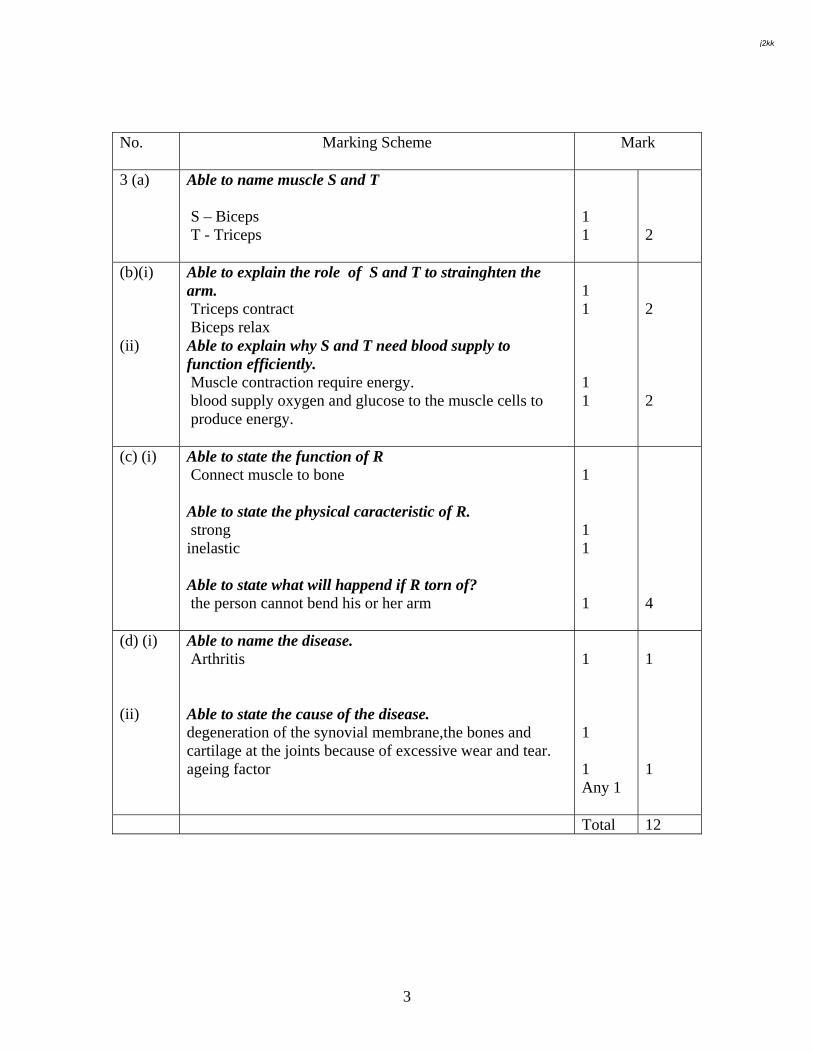
Marking Scheme Mark
3 (a) Able to name muscle S and T S – Biceps T - Triceps
1 1
2
(b)(i) (ii)
Able to explain the role of S and T to strainghten the arm. Triceps contract Biceps relax Able to explain why S and T need blood supply to function efficiently. Muscle contraction require energy. blood supply oxygen and glucose to the muscle cells to produce energy.
1 1 1 1
2 2
(c) (i) Able to state the function of R Connect muscle to bone Able to state the physical caracteristic of R. strong inelastic Able to state what will happend if R torn of? the person cannot bend his or her arm
1 1 1 1
4
(d) (i) (ii)
Able to name the disease. Arthritis Able to state the cause of the disease. degeneration of the synovial membrane,the bones and cartilage at the joints because of excessive wear and tear. ageing factor
1 1 1 Any 1
1 1
Total 12
3
j2kk
No.
Marking Scheme Mark
4 (a)(i) Discontinuous variation Continuous variation
1 1
2
(b) Differences in body height are not clear / distinctive but differences in fingerprints are clear and distinctive Body height is controlled by environmental and genetic factors but finger prints are controlled by genetic factors only Graph for body height shows normal distribution but graph for finger prints shows discrete distribution Body height shows intermediate characters but type of finger prints do not show intermediate characters Body height is controlled by many pairs of alleles but finger prints is controlled by a pair of alleles Body height is a quantitative character (can be measured and graded from one extreme to the other) but type of finger prints is a qualitative character (they cannot be measured or graded from one extreme to the other)
2 2 2 2 2 2 Any 2
Max 4
(c) Some individuals adapt better to environment condition These individuals are better adapted for survival//they can transmit the advantageous genes to their offspring//camouflage from their predator
1 1
2
(d) (i) (ii)
P: Deletion Q: Duplication Mutation that occurs in a somatic cell (e.g. bone marrow of liver) may damage the cells This makes the cell cancerous// kill the cell
1 1 1 1
2 2
Total 12
4
j2kk
No. Marking Scheme Mark 5 (a) (i) Able to name structure x
Placenta
1
1
(ii) Able to explain two functions of structure x F1 : Forms a selective barrier between the mother’s blood and the foetal blood. P1 : Allows exchange of some substances between the
mother’s blood and the foetal blood for example oxygen and nutrients/amino acids/ glucose/ lipids / vitamins.
P2: Help to remove waste products / carbon dioxide, nitrogenous waste products/ urea,of the foetus [1F + P1/P2] F2 : The bloods of the mother and the foetus do not mix/ are separated P1 : protect the foetus from the higher pressure of the mother’s blood, which could damage the delicate foetal blood vessels. P2: prevent certain toxic substances/ pathogen in the mother’s blood from entering the foetal blood. [1F + P1/P2] F3 : The placenta secretes hormones that are essential in pregnancy P1 : secretes hormones progesterone and oestrogen for maintaining the thickness of the endometrium. [1F + P1] F4 : Give protection to the foetus P1 : Antibodies are passed from the mother to the foetus P2 : Allows embryo to attach to the uterine wall [1F + P1/P2]
1 1 1 1 1 1 1 1 1 1 1
Max 2
5
j2kk
No. Marking Scheme Mark 5(b) Umbilical artery carry deoxygenated blood/ carbon
dioxide/ nitrogenous waste product/urea from the foetus to the placenta
Umbilical vein carry oxygenated blood/ oxygen/ nutrients/ mineral salts, glucose/ amino acids/lipids/ vitamin from placenta to the foetus
1 1
2
(c) (i) (ii)
This condition is known as erythroblastosis fetalis. The foetus may suffer from severe anaemia/ jaundice/
damage to the heart/ liver /brain /may die. A mother will be given an injection of anti-Rhesus
antibodies after the first child is born to destroy and prevent the formation of the anti-Rh
antibodies in her future pregnancies.
1 1 1 1 Any 1
2 Max 1 Total 10
(d) Able to explain why she should not smoking F1 : chemical such as nicotine from cigarette smoke can diffuse through placenta to the foetus P1 : the growth of foetus will be retarded/ decrease F2 : Carbon dioxide can diffuse through placenta. P2 : body tissue will lack of oxygen and reduce its growth / miscarriage. [ any 1F + 1P]
1 1 1 1
Max 2
Total 12
6
j2kk
BIOLOGY SECTION B
PAPER 2 [4551/2]
No Section Description/explanation Marks 6 a. i. Student is able to explain how during vigorous activity
the body regulates the content of carbon dioxide in the blood Sample answer: P1- During vigorous activity, the concentration / the partial pressure of carbon dioxide increases as a result of active cellular respiration P2- the carbon dioxide react with water to form carbonic acid which results in a drop in the pH level of the blood and tissue fluid that bathing the brain P3- The drop in pH is detected by the central chemoreceptors in the medulla oblongata P4- and detected by peripheral chemoreceptors ( carotid bodies and aortic bodies ) P5-The central chemoreceptors and pheripheral receptors send nerve impulses to the respiratory centre in the medulla oblongata P6- The respiratory centre sends nerve impulses to the diaphragm and the intercostal muscles, causing the respiratory muscle to contract and relax faster P7- As a result, the breathing and ventilation rate increase causes more oxygen inhaled and the oxygen concentration return to the normal level P8- As excess carbon dioxide is eliminated from the body, the carbon dioxide concentration and pH value of the blood return to normal level
1 1
1
1 1
1 1 1
8
Students are able to explain why the pulse rate takes several minute to return normal Sample answer: P1- After vigorous activity, the pulse rate takes several minutes to return to normal because during the activity the oxygen intake is not able to meet the oxygen demand of the body. P2- Respiration has to take place anaerobically /anaerobic respiration occur P3- As a result, lactic acid accumulates in the muscle. P4- So more oxygen is needed to oxidize the lactic acid and to provide the energy for the recovery of the Muscle
1 1 1 1
4
7
j2kk
Students are able to explain the aerobic and anaerobic respiration F1-Anaerobic respiration process involves the breaks down of glucose in the absence of oxygen or in a limited supply of oxygen to release energy P1-Oxidation of glucose is incomplete which 2 molecules of ATP are produced P2-The by-products are ethanol and energy P3-Take place in the cytoplasm F2-Teresterial Plant respires aerobically. P4- Aerobic respiration process involves the oxidation of glucose in the presence of oxygen to release energy P5- In situation of waterlogged condition // less amount of dissolve oxygen P6- The root of terrestrial plant respires anaerobically P7-Terrestrial plant unable to carry out anaerobic respiration for a long term which result the plant die / wilt.
1 1 1 1
1 1 1 1 1
8
Total 20
8
j2kk
7 a The diagram shows a saprophytic fungus. It obtain its nutrient by secreting digestive enzymes onto the substrate The enzymes digest the complex substances into simple forms. The simple forms are then absorbed by hypha.
1 1 1 1
4
b F1- In the month of January until April, the increase in the prey's is followed by an increase in predator population P1 - due to abundance of food F2 - However from April to August, when the number of predator increases the number of preys will then decrease P1 - This is because the high number of predators will easily consume the prey. P2 - When the prey reduces, the predators will have less to eat. P3 - There is intraspesific competition. F3 - The number of predators also reduces in the following months from August to December. P1 - The prey - predator relationship takes place in cycle. F4 - This keeps the population of both organisms in a dynamic equilibrium
1 1
1 1 1 1 1 1 1
Max 6
9
j2kk
c. F1 – To build proteins, plants need the element nitrogen. P1 - The nitrogen gas in the atmosphere is about 78% P2 - but plants are not able to utilize this nitrogen P3 - The nitrogen has to be fixed before it can be absorbed by the plants. F2 - Nitrogen fixing bacteria / Noctoc sp / Azotobacter / bacteria A which lives freely in the soil and Rhizobium sp / bacteria B which lives in the root nodule of Leguminous plant P1 - can convert nitrogen in the atmosphere into ammonia F3 - Nitrosomonas / bacteria C oxidizes/ converted ammonia into nitrites. F4 - Nitrobacter oxidizes / converted nitrites into nitrates P1 - Nitrites and Nitrate can be absorbed by plants as their nitrogen source. P2 - The plants protein is transferred to the animals when consumed by the animals. F5 - The animals and plants proteins are transferred to human when consumed.
1 1 1 1
1 1 1
1
1 1 1
Max 10
Total 20
10
j2kk
8 a. P1 - Blood from the renal artery enters the glomerulus through the afferent arteriole and out through the efferent arteriole. P2 - The diameter of afferent arteriole is bigger than the diameter of the efferent arteriole causing a high hydrostatic pressure in the glomerulus. P3 - The fluid and solute in the glomerulus is filtered out through the capillary wall into the lumen of the Bowman’s capsule. P4 - The glomerular filtrate has the same composition as the plasma except that it does not contain any of the larger component such as red blood cell and plasma proteins. P5 - The process of filtration produced as a result of this pressure is known as ultrafiltration.
1 1 1 1 1
Max 4
b. P1- When the osmotic pressure of blood is lower than usual, the osmoreceptor cells in the hypothalamus are less stimulated/ the pituitary gland is less stimulated, less ADH is secreted. P2- (A lower level of ADH) causes the structure P/ distal convoluted tubule and structure Q/ collecting duct to become impermeable to water . P3 - Less water is reabsorbed( from the filtrate into the blood). P4 - The blood osmotic pressure rises / return to normal range.
1 1 1 1
Max 3
P5 - When the osmotic pressure of blood is higher than usual the osmoreceptor cells in the hypothalamus are stimulated /the pituitary gland is stimulated, more ADH is secreted. P6 - (A higher level of ADH) causes the distal convoluted tubule and collecting duct to become more permeable to water . P7 - More water is reabsorbed( from the filtrate into the blood). P8 - The blood osmotic pressure drops / return to normal range.
1 1 1 1
Max 3
11
j2kk
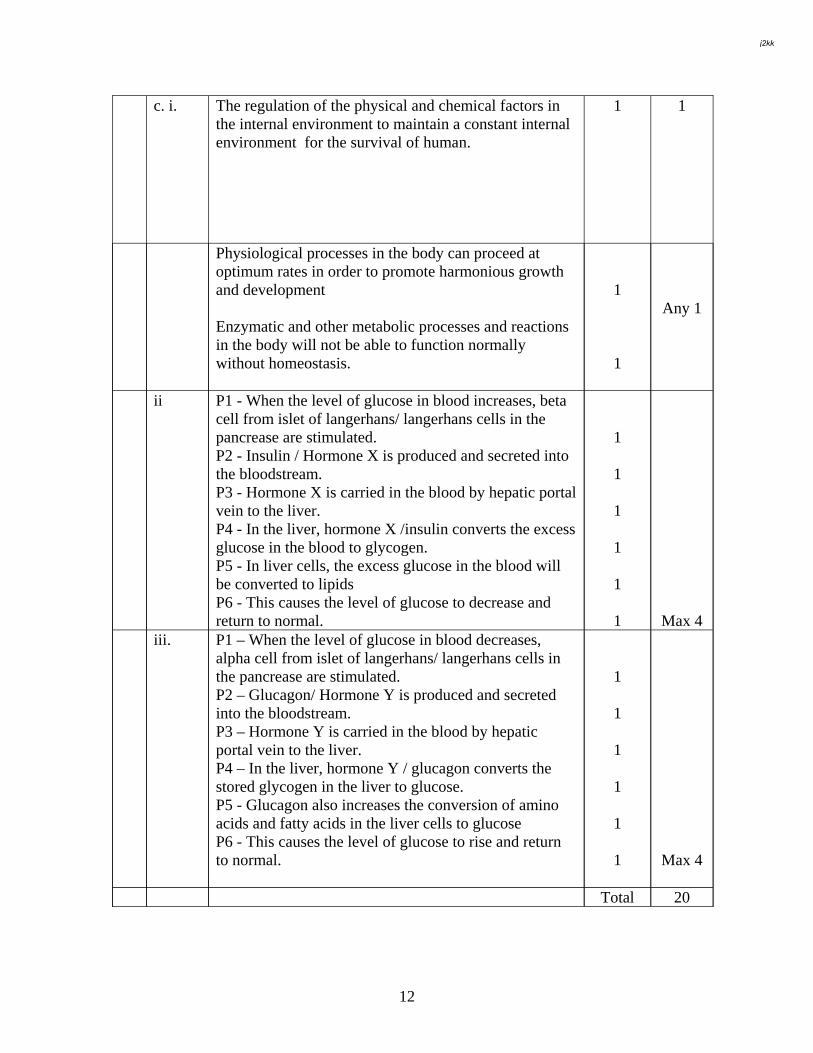
c. i. The regulation of the physical and chemical factors in the internal environment to maintain a constant internal environment for the survival of human.
1
1
Physiological processes in the body can proceed at optimum rates in order to promote harmonious growth and development Enzymatic and other metabolic processes and reactions in the body will not be able to function normally without homeostasis.
1 1
Any 1
ii P1 - When the level of glucose in blood increases, beta cell from islet of langerhans/ langerhans cells in the pancrease are stimulated. P2 - Insulin / Hormone X is produced and secreted into the bloodstream. P3 - Hormone X is carried in the blood by hepatic portal vein to the liver. P4 - In the liver, hormone X /insulin converts the excess glucose in the blood to glycogen. P5 - In liver cells, the excess glucose in the blood will be converted to lipids P6 - This causes the level of glucose to decrease and return to normal.
1 1 1 1 1 1
Max 4 iii. P1 – When the level of glucose in blood decreases,
alpha cell from islet of langerhans/ langerhans cells in the pancrease are stimulated. P2 – Glucagon/ Hormone Y is produced and secreted into the bloodstream. P3 – Hormone Y is carried in the blood by hepatic portal vein to the liver. P4 – In the liver, hormone Y / glucagon converts the stored glycogen in the liver to glucose. P5 - Glucagon also increases the conversion of amino acids and fatty acids in the liver cells to glucose P6 - This causes the level of glucose to rise and return to normal.
1
1 1 1 1 1
Max 4
Total 20
12
j2kk
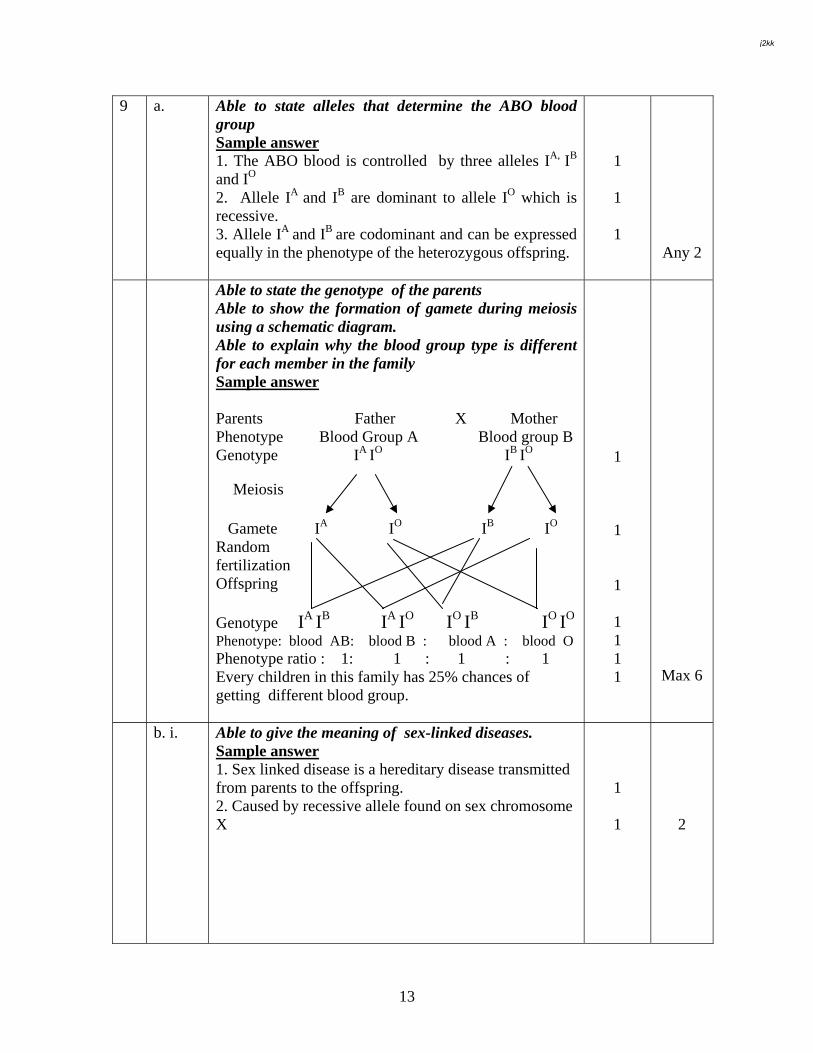
9 a. Able to state alleles that determine the ABO blood group Sample answer 1. The ABO blood is controlled by three alleles IA, IB
and IO
2. Allele IA and IB are dominant to allele IO which is recessive. 3. Allele IA and IB are codominant and can be expressed equally in the phenotype of the heterozygous offspring.
1 1 1
Any 2
Able to state the genotype of the parents Able to show the formation of gamete during meiosis using a schematic diagram. Able to explain why the blood group type is different for each member in the family Sample answer Parents Father X Mother Phenotype Blood Group A Blood group B Genotype IA IO IB IO
Gametes
Gamete IA IO IB IO
Random fertilization
Offspring Genotype IA IB IA IO IO IB IO IO
Phenotype: blood AB: blood B : blood A : blood O Phenotype ratio : 1: 1 : 1 : 1 Every children in this family has 25% chances of getting different blood group.
1 1 1 1 1 1 1
Max 6
b. i. Able to give the meaning of sex-linked diseases. Sample answer 1. Sex linked disease is a hereditary disease transmitted from parents to the offspring. 2. Caused by recessive allele found on sex chromosome X
1
1
2
Meiosis
13
j2kk
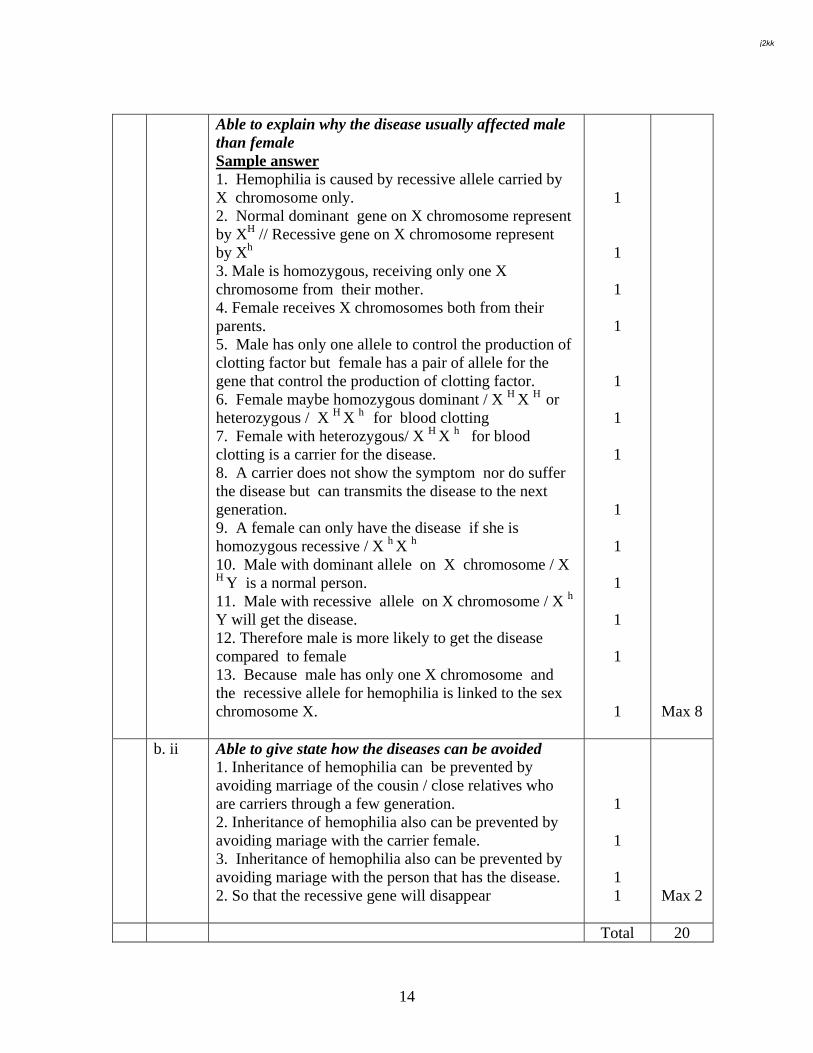
Able to explain why the disease usually affected male
than female Sample answer 1. Hemophilia is caused by recessive allele carried by X chromosome only. 2. Normal dominant gene on X chromosome represent by XH // Recessive gene on X chromosome represent by Xh 3. Male is homozygous, receiving only one X chromosome from their mother. 4. Female receives X chromosomes both from their parents. 5. Male has only one allele to control the production of clotting factor but female has a pair of allele for the gene that control the production of clotting factor. 6. Female maybe homozygous dominant / X H X H or heterozygous / X H X h for blood clotting 7. Female with heterozygous/ X H X h for blood clotting is a carrier for the disease. 8. A carrier does not show the symptom nor do suffer the disease but can transmits the disease to the next generation. 9. A female can only have the disease if she is homozygous recessive / X h X h 10. Male with dominant allele on X chromosome / X H Y is a normal person. 11. Male with recessive allele on X chromosome / X h
Y will get the disease. 12. Therefore male is more likely to get the disease compared to female 13. Because male has only one X chromosome and the recessive allele for hemophilia is linked to the sex chromosome X.
1
1
1 1 1 1 1 1 1 1 1 1 1
Max 8
b. ii Able to give state how the diseases can be avoided 1. Inheritance of hemophilia can be prevented by avoiding marriage of the cousin / close relatives who are carriers through a few generation. 2. Inheritance of hemophilia also can be prevented by avoiding mariage with the carrier female. 3. Inheritance of hemophilia also can be prevented by avoiding mariage with the person that has the disease. 2. So that the recessive gene will disappear
1
1 1 1
Max 2
Total 20
14
j2kk

15
j2kk
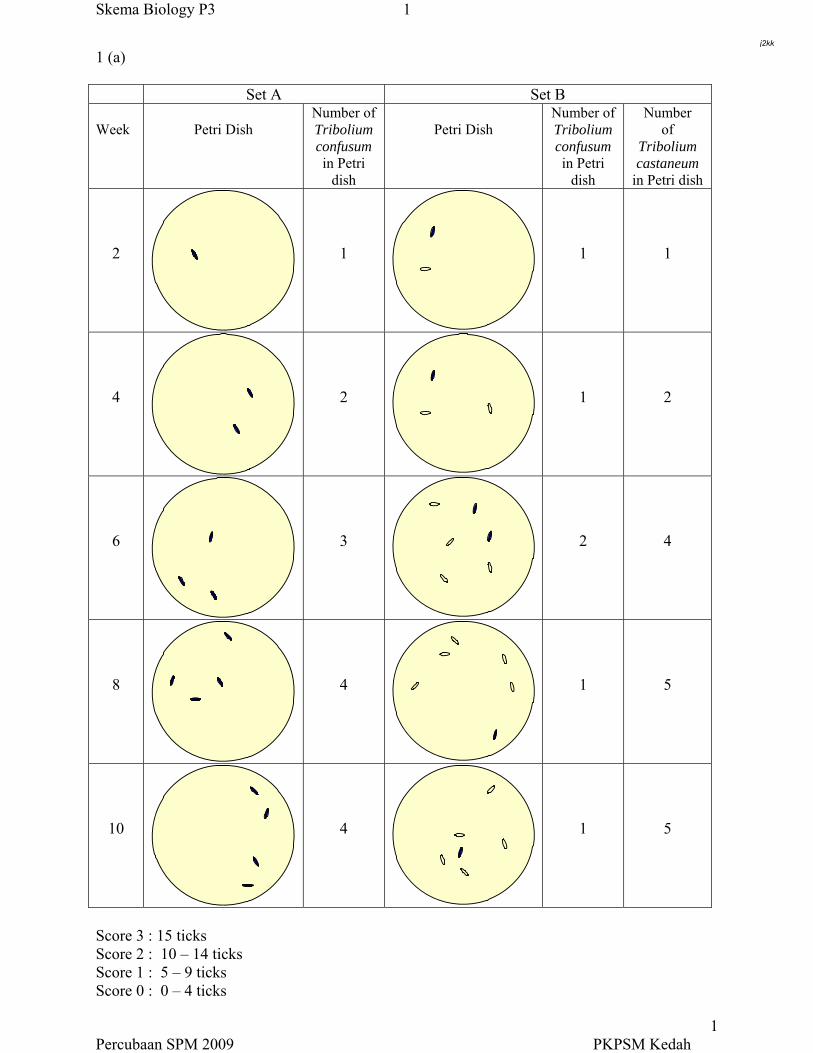
Skema Biology P3 1
1 (a) Set A Set B Week
Petri Dish
Number of Tribolium confusum in Petri
dish
Petri Dish
Number of Tribolium confusum in Petri
dish
Number of
Tribolium castaneum
in Petri dish
2
1
1
1
4
2
1
2
6
3
2
4
8
4
1
5
10
4
1
5
Score 3 : 15 ticks Score 2 : 10 – 14 ticks Score 1 : 5 – 9 ticks Score 0 : 0 – 4 ticks
Percubaan SPM 2009 PKPSM Kedah 1
j2kk
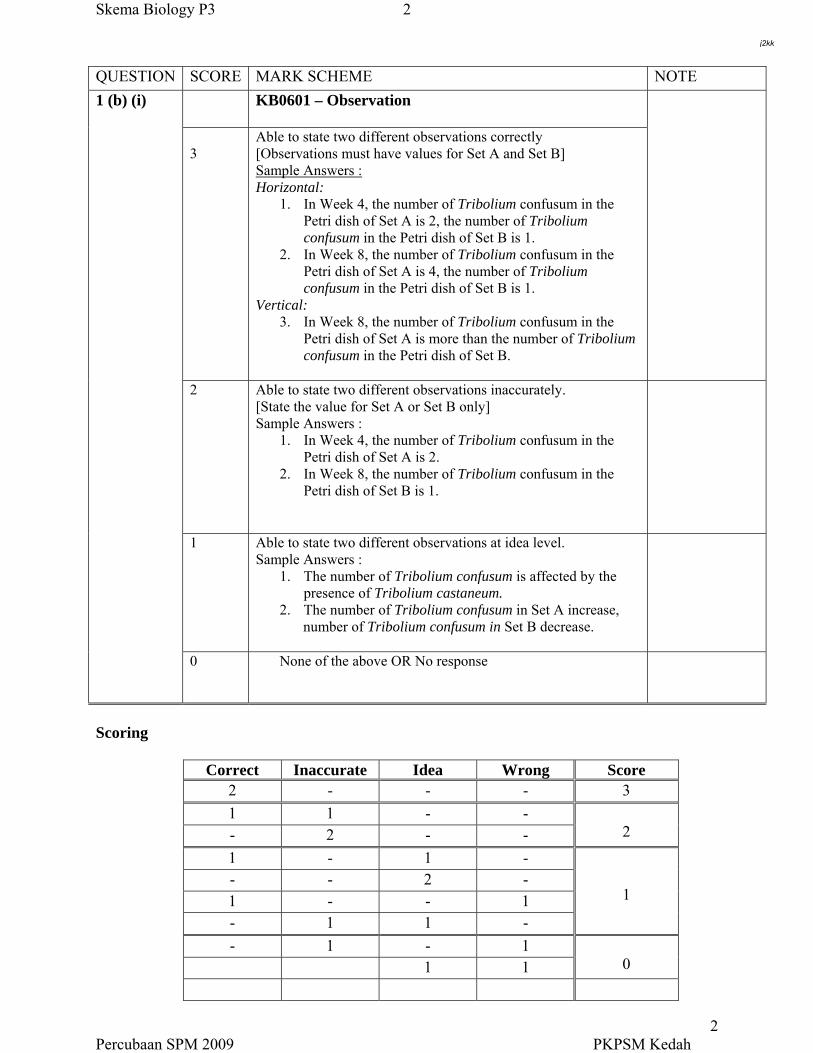
Skema Biology P3 2
QUESTION SCORE MARK SCHEME NOTE
KB0601 – Observation
3
Able to state two different observations correctly [Observations must have values for Set A and Set B] Sample Answers : Horizontal:
1. In Week 4, the number of Tribolium confusum in the Petri dish of Set A is 2, the number of Tribolium confusum in the Petri dish of Set B is 1.
2. In Week 8, the number of Tribolium confusum in the Petri dish of Set A is 4, the number of Tribolium confusum in the Petri dish of Set B is 1.
Vertical: 3. In Week 8, the number of Tribolium confusum in the
Petri dish of Set A is more than the number of Tribolium confusum in the Petri dish of Set B.
2 Able to state two different observations inaccurately. [State the value for Set A or Set B only] Sample Answers :
1. In Week 4, the number of Tribolium confusum in the Petri dish of Set A is 2.
2. In Week 8, the number of Tribolium confusum in the Petri dish of Set B is 1.
1 Able to state two different observations at idea level. Sample Answers :
1. The number of Tribolium confusum is affected by the presence of Tribolium castaneum.
2. The number of Tribolium confusum in Set A increase, number of Tribolium confusum in Set B decrease.
1 (b) (i)
0 None of the above OR No response
Scoring
Correct Inaccurate Idea Wrong Score 2 - - - 3
1 1 - - - 2 - -
2
1 - 1 - - - 2 - 1 - - 1 - 1 1 -
1
- 1 - 1 1 1
0
Percubaan SPM 2009 PKPSM Kedah 2
j2kk
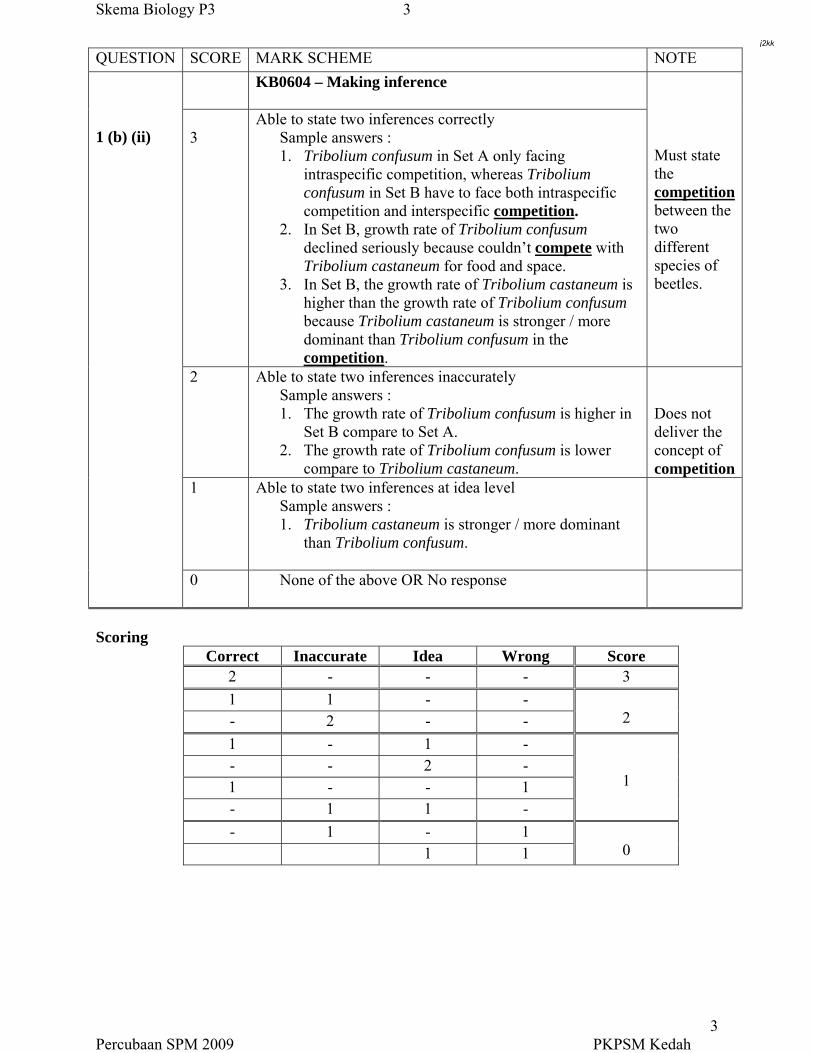
Skema Biology P3 3
QUESTION SCORE MARK SCHEME NOTE
KB0604 – Making inference
3
Able to state two inferences correctly Sample answers : 1. Tribolium confusum in Set A only facing
intraspecific competition, whereas Tribolium confusum in Set B have to face both intraspecific competition and interspecific competition.
2. In Set B, growth rate of Tribolium confusum declined seriously because couldn’t compete with Tribolium castaneum for food and space.
3. In Set B, the growth rate of Tribolium castaneum is higher than the growth rate of Tribolium confusum because Tribolium castaneum is stronger / more dominant than Tribolium confusum in the competition.
Must state the competitionbetween the two different species of beetles.
2 Able to state two inferences inaccurately Sample answers : 1. The growth rate of Tribolium confusum is higher in
Set B compare to Set A. 2. The growth rate of Tribolium confusum is lower
compare to Tribolium castaneum.
Does not deliver the concept of competition
1 Able to state two inferences at idea level Sample answers : 1. Tribolium castaneum is stronger / more dominant
than Tribolium confusum.
1 (b) (ii)
0 None of the above OR No response
Scoring Correct Inaccurate Idea Wrong Score
2 - - - 3
1 1 - - - 2 - -
2
1 - 1 - - - 2 - 1 - - 1 - 1 1 -
1
- 1 - 1 1 1
0
Percubaan SPM 2009 PKPSM Kedah 3
j2kk
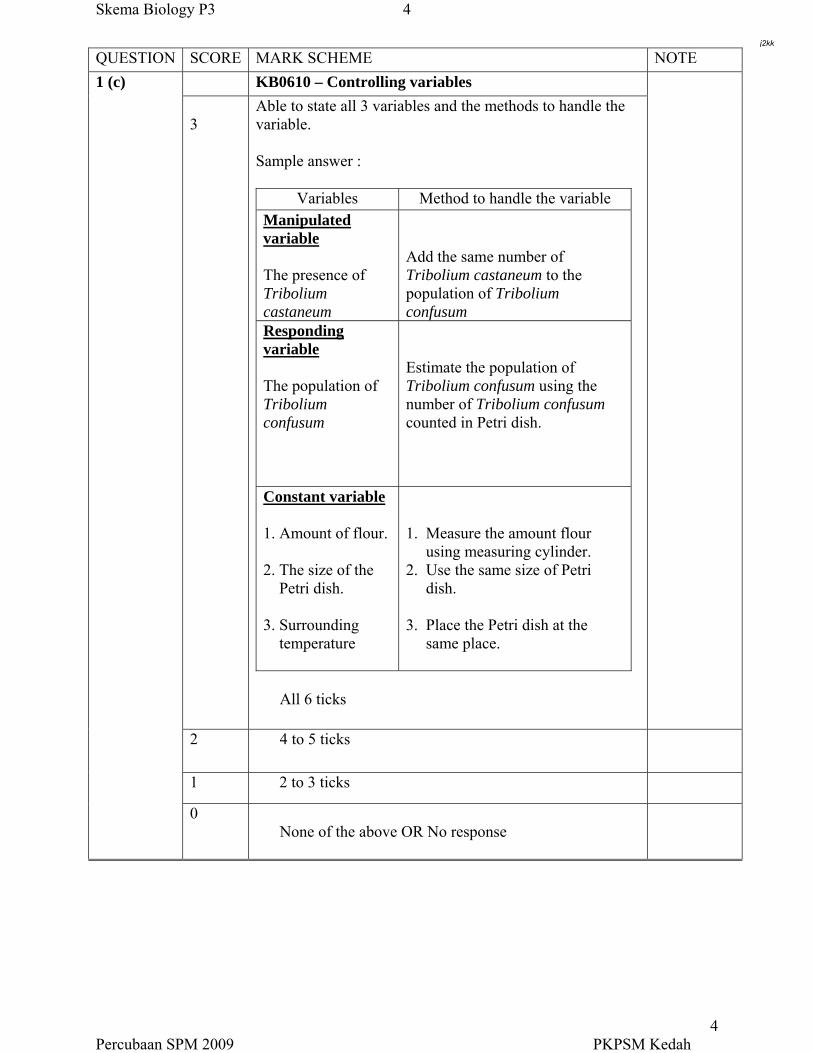
Skema Biology P3 4
QUESTION SCORE MARK SCHEME NOTE
KB0610 – Controlling variables
3
Able to state all 3 variables and the methods to handle the variable. Sample answer :
Variables Method to handle the variable Manipulated variable The presence of Tribolium castaneum
Add the same number of Tribolium castaneum to the population of Tribolium confusum
Responding variable The population of Tribolium confusum
Estimate the population of Tribolium confusum using the number of Tribolium confusum counted in Petri dish.
Constant variable 1. Amount of flour. 2. The size of the Petri dish. 3. Surrounding temperature
1. Measure the amount flour using measuring cylinder. 2. Use the same size of Petri dish. 3. Place the Petri dish at the same place.
All 6 ticks
2 4 to 5 ticks
1 2 to 3 ticks
1 (c)
0 None of the above OR No response
Percubaan SPM 2009 PKPSM Kedah 4
j2kk
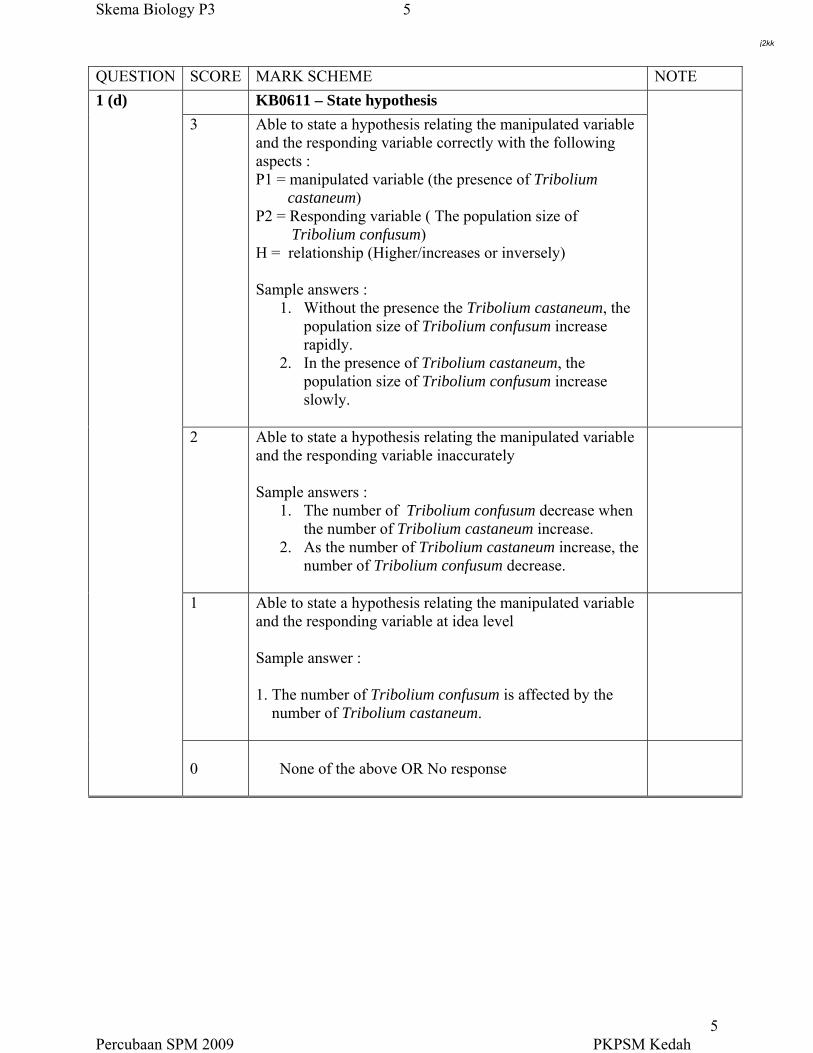
Skema Biology P3 5
QUESTION SCORE MARK SCHEME NOTE
KB0611 – State hypothesis
3 Able to state a hypothesis relating the manipulated variable and the responding variable correctly with the following aspects : P1 = manipulated variable (the presence of Tribolium castaneum) P2 = Responding variable ( The population size of Tribolium confusum) H = relationship (Higher/increases or inversely) Sample answers :
1. Without the presence the Tribolium castaneum, the population size of Tribolium confusum increase rapidly.
2. In the presence of Tribolium castaneum, the population size of Tribolium confusum increase slowly.
2 Able to state a hypothesis relating the manipulated variable and the responding variable inaccurately Sample answers :
1. The number of Tribolium confusum decrease when the number of Tribolium castaneum increase.
2. As the number of Tribolium castaneum increase, the number of Tribolium confusum decrease.
1 Able to state a hypothesis relating the manipulated variable and the responding variable at idea level Sample answer : 1. The number of Tribolium confusum is affected by the number of Tribolium castaneum.
1 (d)
0
None of the above OR No response
Percubaan SPM 2009 PKPSM Kedah 5
j2kk
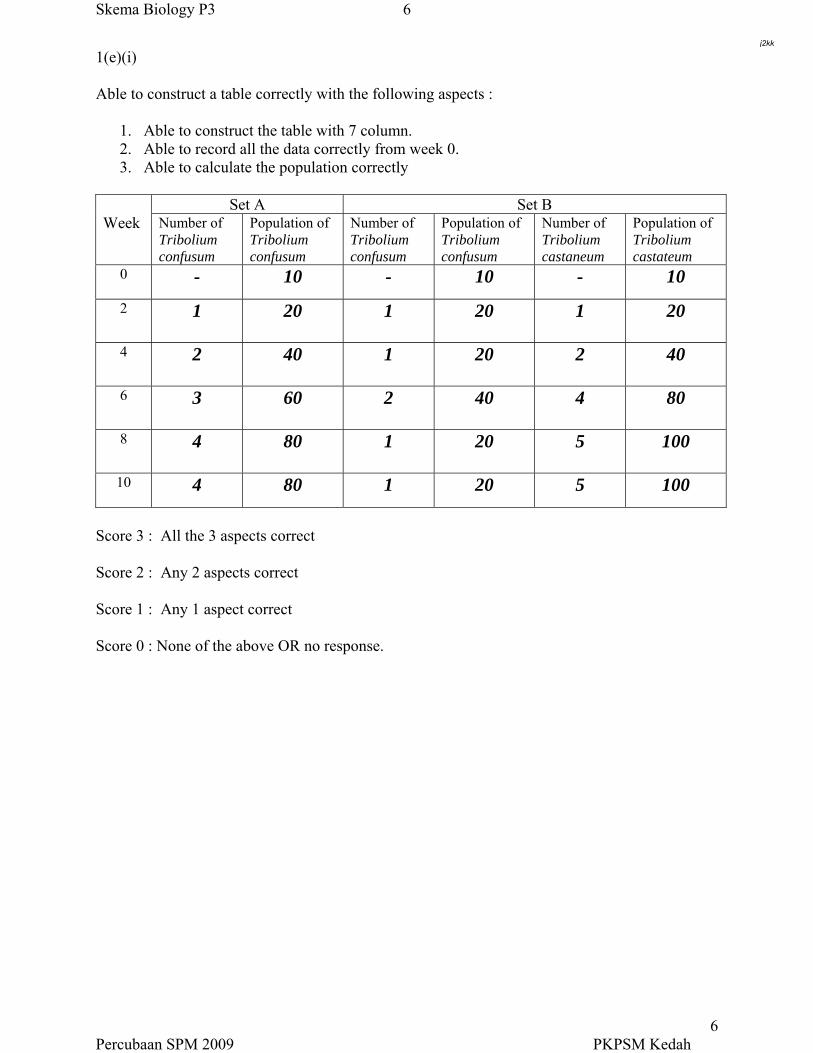
Skema Biology P3 6
1(e)(i) Able to construct a table correctly with the following aspects :
1. Able to construct the table with 7 column. 2. Able to record all the data correctly from week 0. 3. Able to calculate the population correctly
Set A Set B
Week Number of Tribolium confusum
Population of Tribolium confusum
Number of Tribolium confusum
Population of Tribolium confusum
Number of Tribolium castaneum
Population of Tribolium castateum
0
- 10 - 10 - 10
2 1 20 1 20 1 20
4 2 40 1 20 2 40
6 3 60 2 40 4 80
8 4 80 1 20 5 100
10
4 80 1 20 5 100
Score 3 : All the 3 aspects correct Score 2 : Any 2 aspects correct Score 1 : Any 1 aspect correct Score 0 : None of the above OR no response.
Percubaan SPM 2009 PKPSM Kedah 6
j2kk
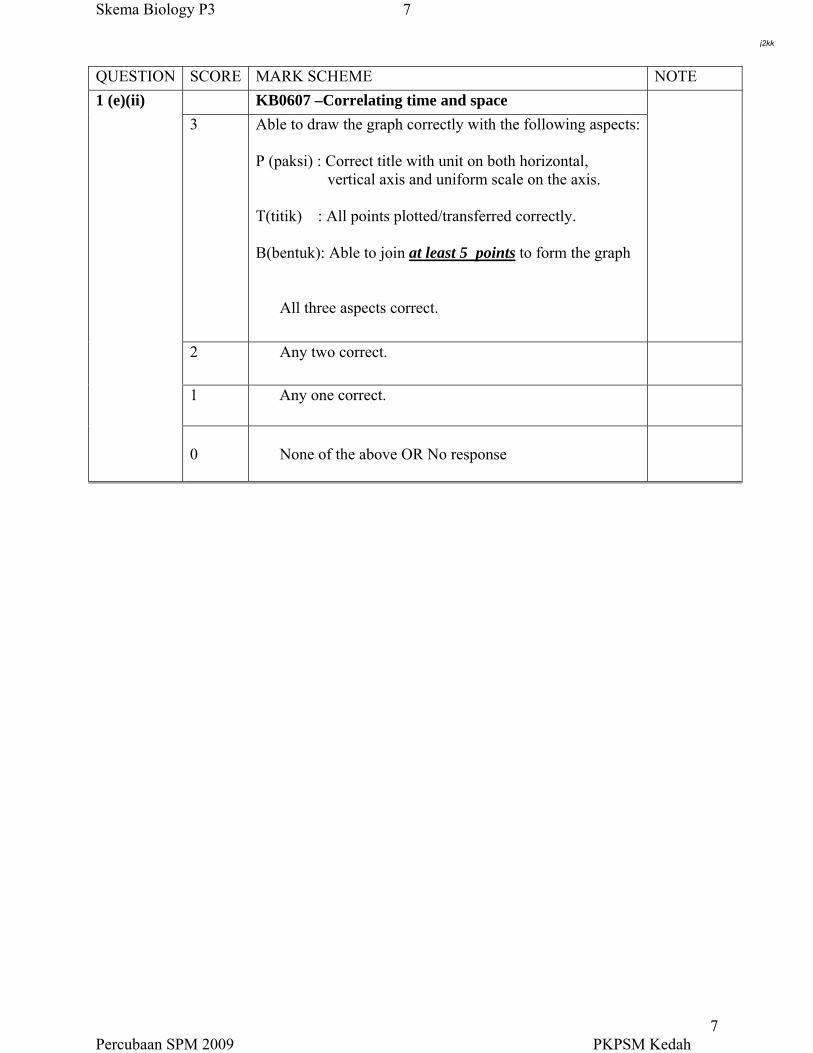
Skema Biology P3 7
QUESTION SCORE MARK SCHEME NOTE
KB0607 –Correlating time and space
3 Able to draw the graph correctly with the following aspects: P (paksi) : Correct title with unit on both horizontal, vertical axis and uniform scale on the axis. T(titik) : All points plotted/transferred correctly. B(bentuk): Able to join at least 5 points to form the graph
All three aspects correct.
2 Any two correct.
1 Any one correct.
1 (e)(ii)
0
None of the above OR No response
Percubaan SPM 2009 PKPSM Kedah 7
j2kk
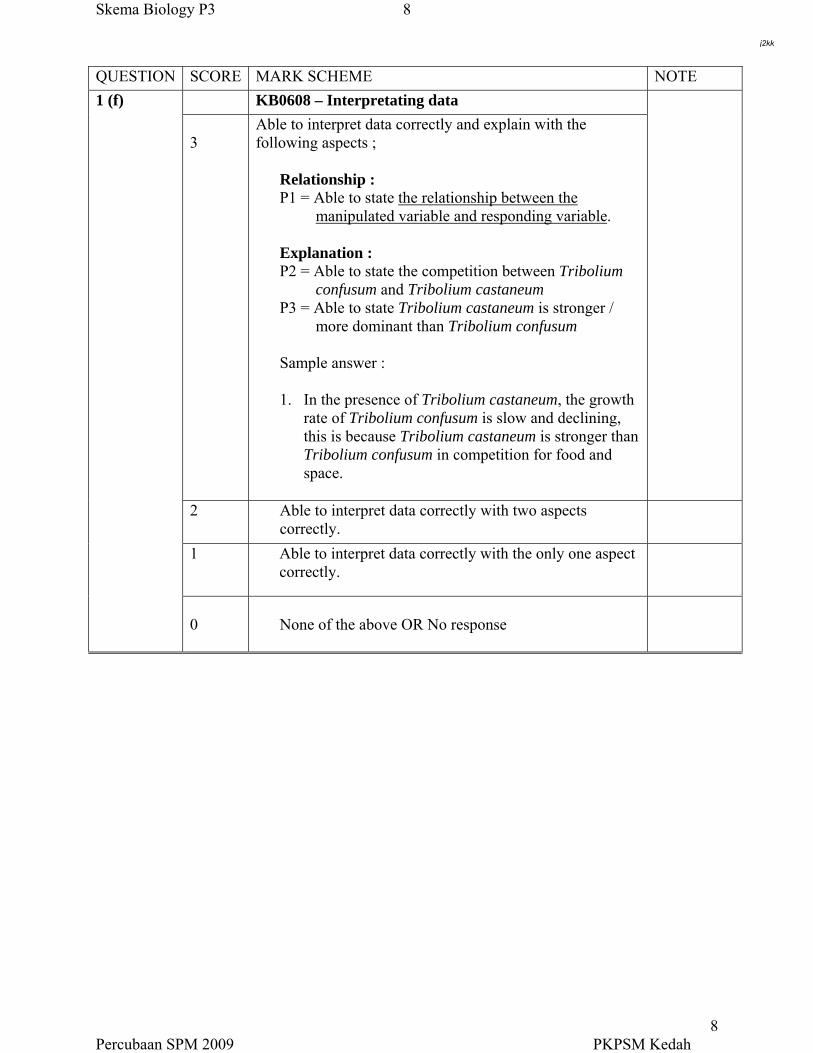
Skema Biology P3 8
QUESTION SCORE MARK SCHEME NOTE
KB0608 – Interpretating data
3
Able to interpret data correctly and explain with the following aspects ;
Relationship : P1 = Able to state the relationship between the manipulated variable and responding variable. Explanation : P2 = Able to state the competition between Tribolium confusum and Tribolium castaneum P3 = Able to state Tribolium castaneum is stronger / more dominant than Tribolium confusum Sample answer : 1. In the presence of Tribolium castaneum, the growth
rate of Tribolium confusum is slow and declining, this is because Tribolium castaneum is stronger than Tribolium confusum in competition for food and space.
2 Able to interpret data correctly with two aspects correctly.
1 Able to interpret data correctly with the only one aspect correctly.
1 (f)
0
None of the above OR No response
Percubaan SPM 2009 PKPSM Kedah 8
j2kk
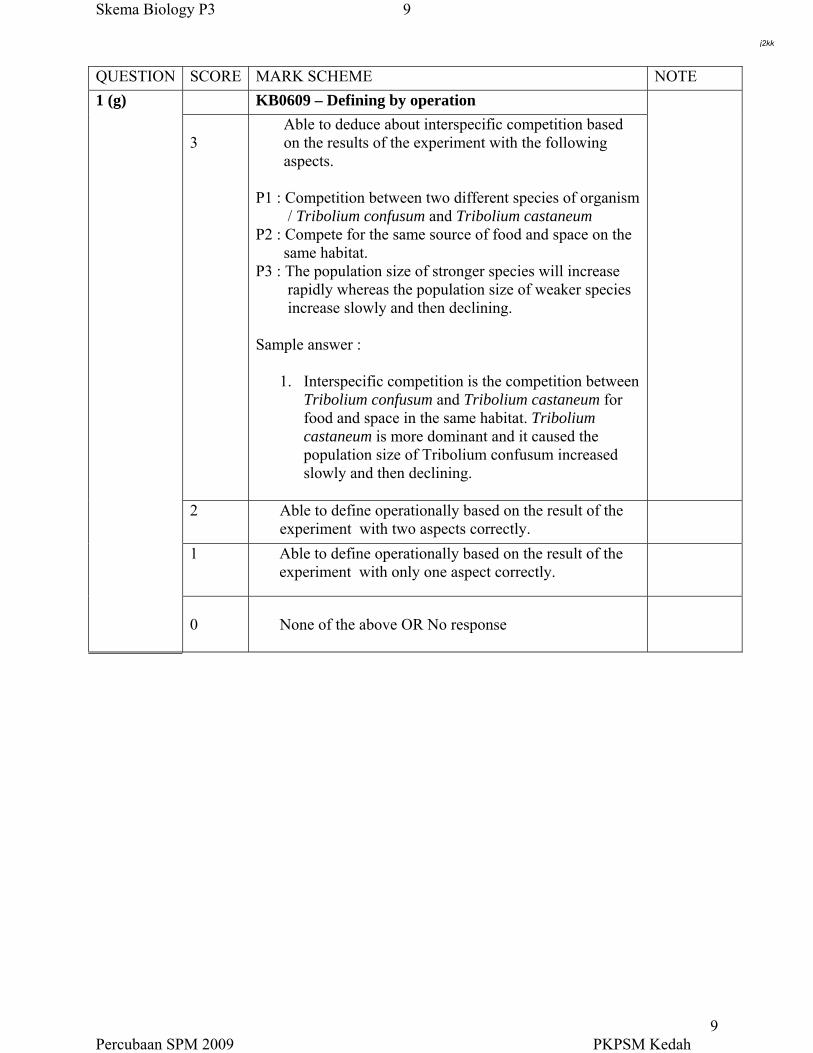
Skema Biology P3 9
QUESTION SCORE MARK SCHEME NOTE
KB0609 – Defining by operation
3
Able to deduce about interspecific competition based on the results of the experiment with the following aspects. P1 : Competition between two different species of organism / Tribolium confusum and Tribolium castaneum P2 : Compete for the same source of food and space on the same habitat. P3 : The population size of stronger species will increase rapidly whereas the population size of weaker species increase slowly and then declining. Sample answer :
1. Interspecific competition is the competition between Tribolium confusum and Tribolium castaneum for food and space in the same habitat. Tribolium castaneum is more dominant and it caused the population size of Tribolium confusum increased slowly and then declining.
2 Able to define operationally based on the result of the experiment with two aspects correctly.
1 Able to define operationally based on the result of the experiment with only one aspect correctly.
1 (g)
0
None of the above OR No response
Percubaan SPM 2009 PKPSM Kedah 9
j2kk
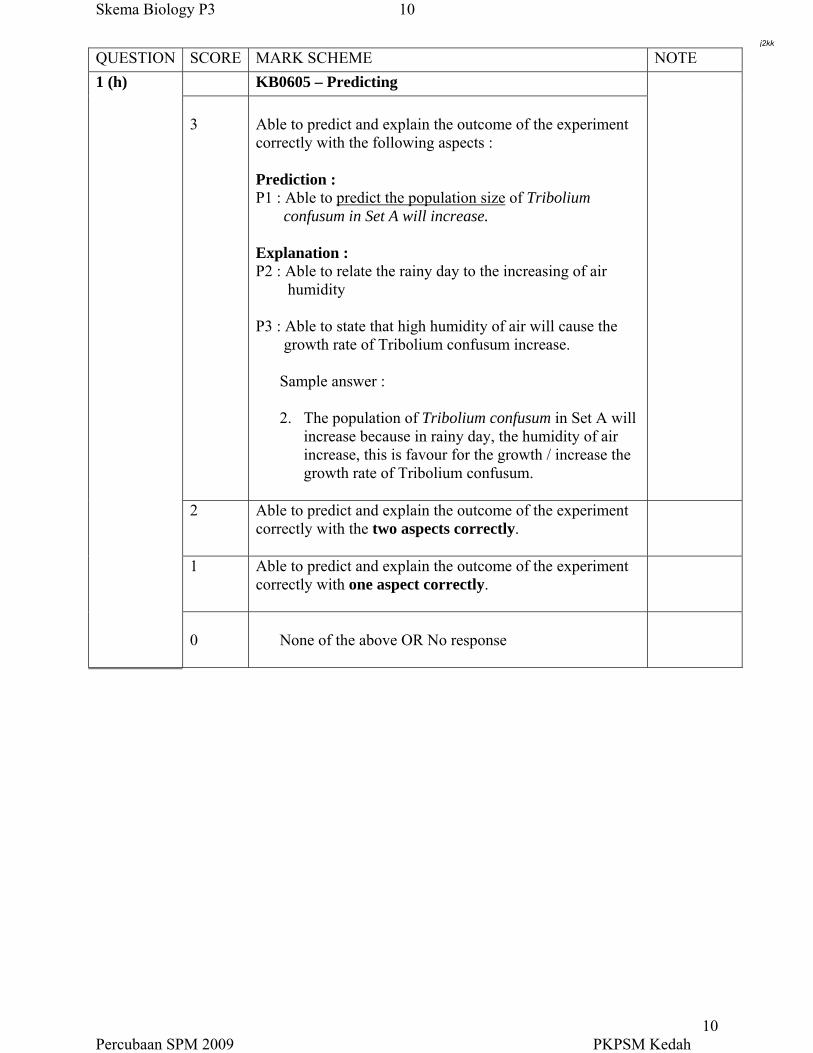
Skema Biology P3 10
QUESTION SCORE MARK SCHEME NOTE
KB0605 – Predicting
3
Able to predict and explain the outcome of the experiment correctly with the following aspects : Prediction : P1 : Able to predict the population size of Tribolium confusum in Set A will increase. Explanation : P2 : Able to relate the rainy day to the increasing of air humidity P3 : Able to state that high humidity of air will cause the growth rate of Tribolium confusum increase.
Sample answer : 2. The population of Tribolium confusum in Set A will
increase because in rainy day, the humidity of air increase, this is favour for the growth / increase the growth rate of Tribolium confusum.
2 Able to predict and explain the outcome of the experiment correctly with the two aspects correctly.
1 Able to predict and explain the outcome of the experiment correctly with one aspect correctly.
1 (h)
0
None of the above OR No response
Percubaan SPM 2009 PKPSM Kedah 10
j2kk
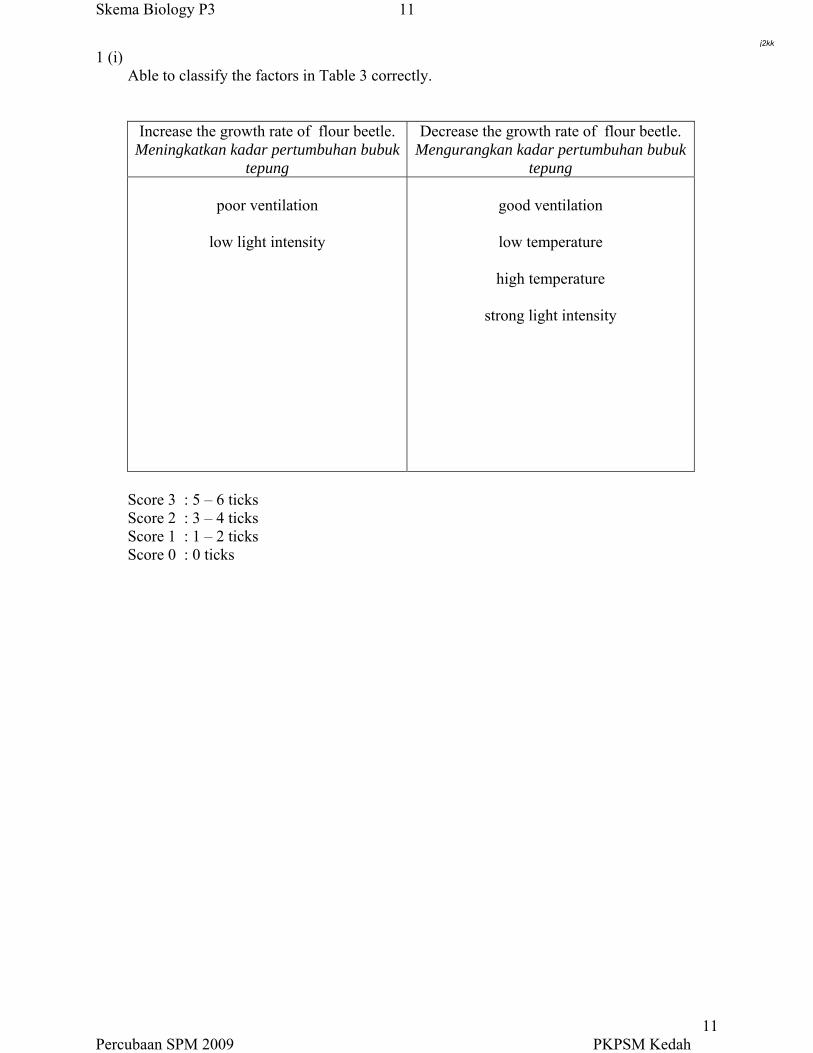
Skema Biology P3 11
1 (i) Able to classify the factors in Table 3 correctly.
Increase the growth rate of flour beetle. Meningkatkan kadar pertumbuhan bubuk
tepung
Decrease the growth rate of flour beetle. Mengurangkan kadar pertumbuhan bubuk
tepung
poor ventilation
low light intensity
good ventilation
low temperature
high temperature
strong light intensity
Score 3 : 5 – 6 ticks Score 2 : 3 – 4 ticks Score 1 : 1 – 2 ticks Score 0 : 0 ticks
Percubaan SPM 2009 PKPSM Kedah 11
j2kk
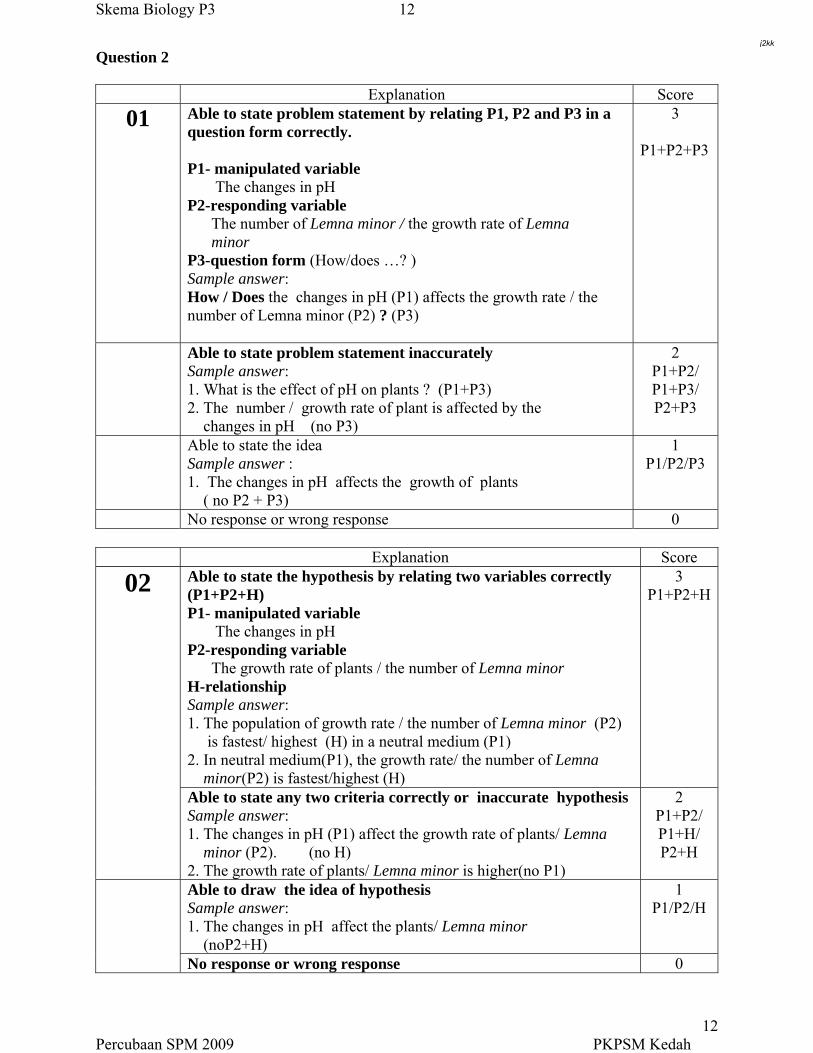
Skema Biology P3 12
Question 2 Explanation Score
01 Able to state problem statement by relating P1, P2 and P3 in a question form correctly. P1- manipulated variable The changes in pH P2-responding variable The number of Lemna minor / the growth rate of Lemna minor P3-question form (How/does …? ) Sample answer: How / Does the changes in pH (P1) affects the growth rate / the number of Lemna minor (P2) ? (P3)
3 P1+P2+P3
Able to state problem statement inaccurately Sample answer: 1. What is the effect of pH on plants ? (P1+P3) 2. The number / growth rate of plant is affected by the changes in pH (no P3)
2 P1+P2/ P1+P3/ P2+P3
Able to state the idea Sample answer : 1. The changes in pH affects the growth of plants ( no P2 + P3)
1 P1/P2/P3
No response or wrong response 0 Explanation Score
02 Able to state the hypothesis by relating two variables correctly (P1+P2+H) P1- manipulated variable The changes in pH P2-responding variable The growth rate of plants / the number of Lemna minor H-relationship Sample answer: 1. The population of growth rate / the number of Lemna minor (P2) is fastest/ highest (H) in a neutral medium (P1) 2. In neutral medium(P1), the growth rate/ the number of Lemna minor(P2) is fastest/highest (H)
3 P1+P2+H
Able to state any two criteria correctly or inaccurate hypothesis Sample answer: 1. The changes in pH (P1) affect the growth rate of plants/ Lemna minor (P2). (no H) 2. The growth rate of plants/ Lemna minor is higher(no P1)
2 P1+P2/ P1+H/ P2+H
Able to draw the idea of hypothesis Sample answer: 1. The changes in pH affect the plants/ Lemna minor (noP2+H)
1 P1/P2/H
No response or wrong response 0
Percubaan SPM 2009 PKPSM Kedah 12
j2kk
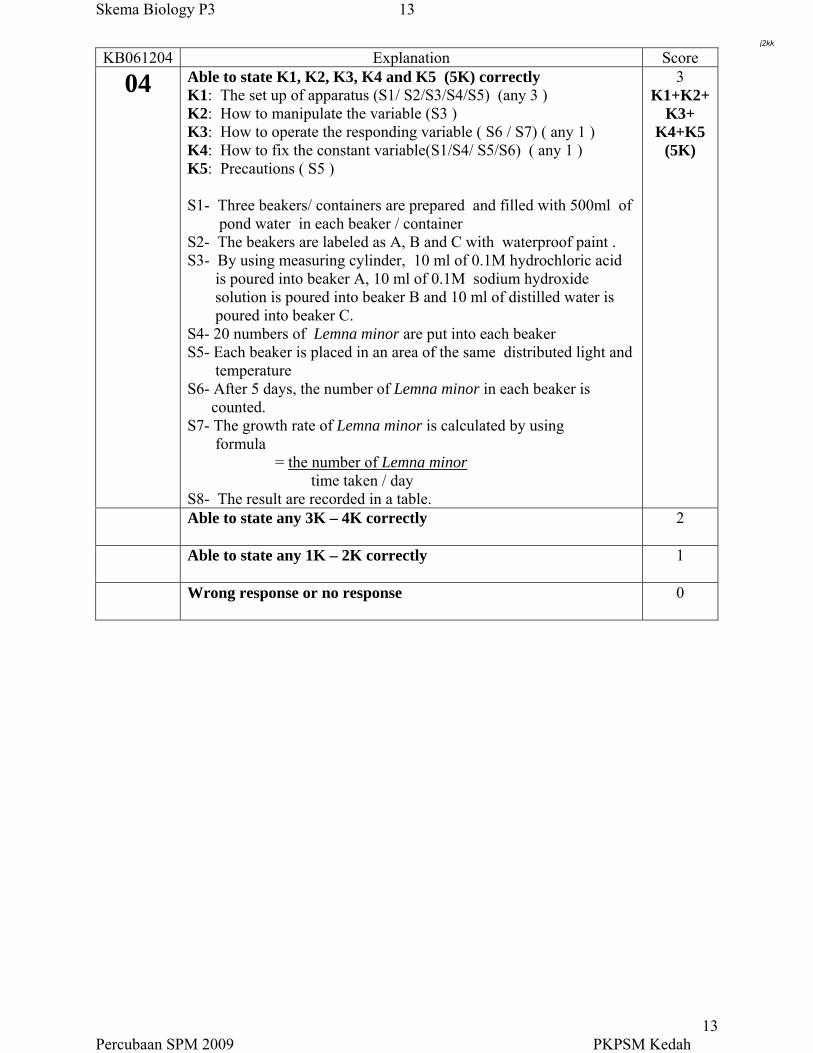
Skema Biology P3 13
KB061204 Explanation Score
04 Able to state K1, K2, K3, K4 and K5 (5K) correctly K1: The set up of apparatus (S1/ S2/S3/S4/S5) (any 3 ) K2: How to manipulate the variable (S3 ) K3: How to operate the responding variable ( S6 / S7) ( any 1 ) K4: How to fix the constant variable(S1/S4/ S5/S6) ( any 1 ) K5: Precautions ( S5 ) S1- Three beakers/ containers are prepared and filled with 500ml of pond water in each beaker / container S2- The beakers are labeled as A, B and C with waterproof paint . S3- By using measuring cylinder, 10 ml of 0.1M hydrochloric acid is poured into beaker A, 10 ml of 0.1M sodium hydroxide solution is poured into beaker B and 10 ml of distilled water is poured into beaker C. S4- 20 numbers of Lemna minor are put into each beaker S5- Each beaker is placed in an area of the same distributed light and temperature S6- After 5 days, the number of Lemna minor in each beaker is counted. S7- The growth rate of Lemna minor is calculated by using formula = the number of Lemna minor time taken / day S8- The result are recorded in a table.
3 K1+K2+
K3+ K4+K5
(5K)
Able to state any 3K – 4K correctly
2
Able to state any 1K – 2K correctly
1
Wrong response or no response
0
Percubaan SPM 2009 PKPSM Kedah 13
j2kk
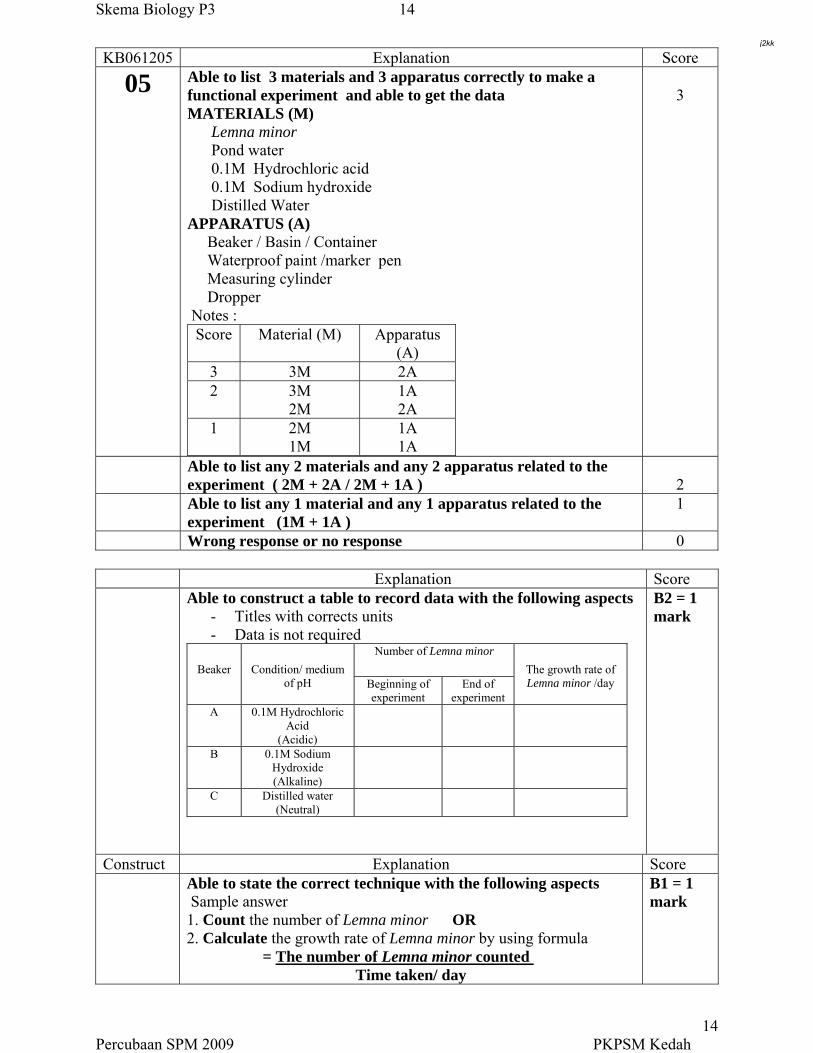
Skema Biology P3 14
KB061205 Explanation Score
05 Able to list 3 materials and 3 apparatus correctly to make a functional experiment and able to get the data MATERIALS (M) Lemna minor Pond water 0.1M Hydrochloric acid 0.1M Sodium hydroxide Distilled Water APPARATUS (A) Beaker / Basin / Container Waterproof paint /marker pen Measuring cylinder Dropper Notes :
Score Material (M) Apparatus (A)
3 3M 2A 2 3M
2M 1A 2A
1 2M 1M
1A 1A
3
Able to list any 2 materials and any 2 apparatus related to the experiment ( 2M + 2A / 2M + 1A )
2
Able to list any 1 material and any 1 apparatus related to the experiment (1M + 1A )
1
Wrong response or no response 0
Explanation Score
Able to construct a table to record data with the following aspects - Titles with corrects units - Data is not required
Number of Lemna minor Beaker Condition/ medium
of pH The growth rate of
Lemna minor /day Beginning of experiment
End of experiment
A 0.1M Hydrochloric Acid
(Acidic)
B 0.1M Sodium Hydroxide (Alkaline)
C Distilled water (Neutral)
B2 = 1 mark
Construct Explanation Score Able to state the correct technique with the following aspects
Sample answer 1. Count the number of Lemna minor OR 2. Calculate the growth rate of Lemna minor by using formula = The number of Lemna minor counted
Time taken/ day
B1 = 1 mark
Percubaan SPM 2009 PKPSM Kedah 14
j2kk
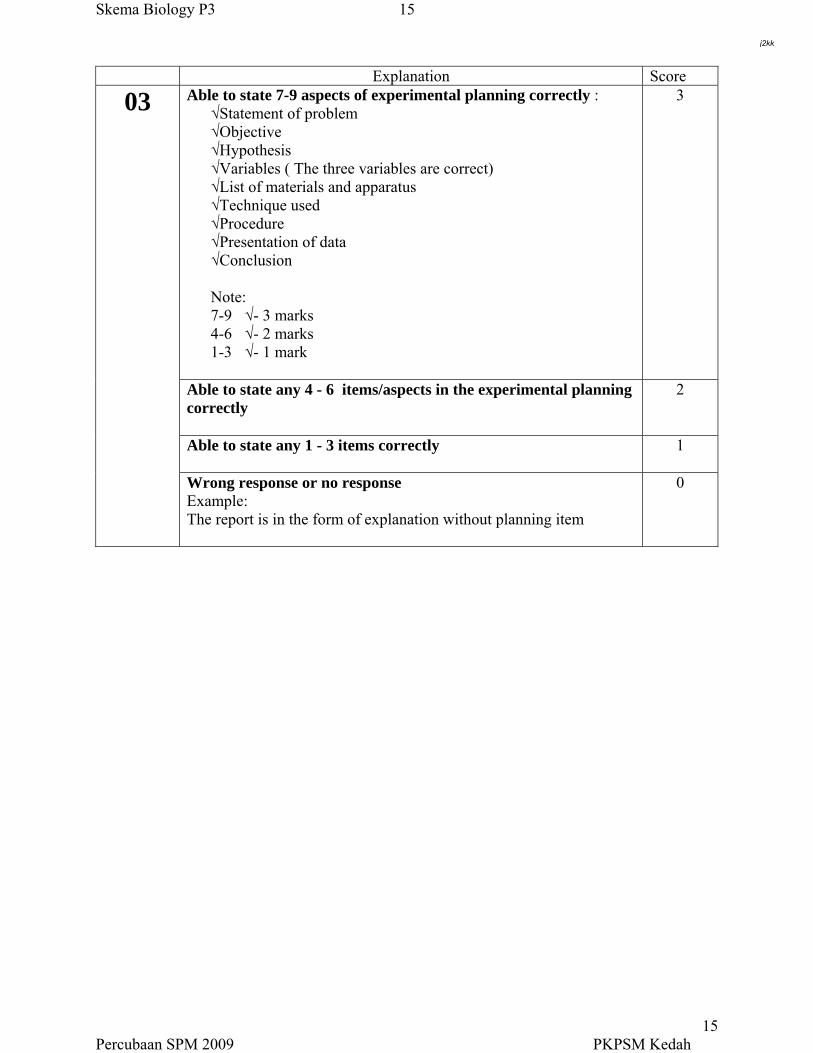
Skema Biology P3 15
Explanation Score
03 Able to state 7-9 aspects of experimental planning correctly : √Statement of problem √Objective √Hypothesis √Variables ( The three variables are correct) √List of materials and apparatus √Technique used √Procedure √Presentation of data √Conclusion Note: 7-9 √- 3 marks 4-6 √- 2 marks 1-3 √- 1 mark
3
Able to state any 4 - 6 items/aspects in the experimental planning correctly
2
Able to state any 1 - 3 items correctly
1
Wrong response or no response Example: The report is in the form of explanation without planning item
0
Percubaan SPM 2009 PKPSM Kedah 15
j2kk
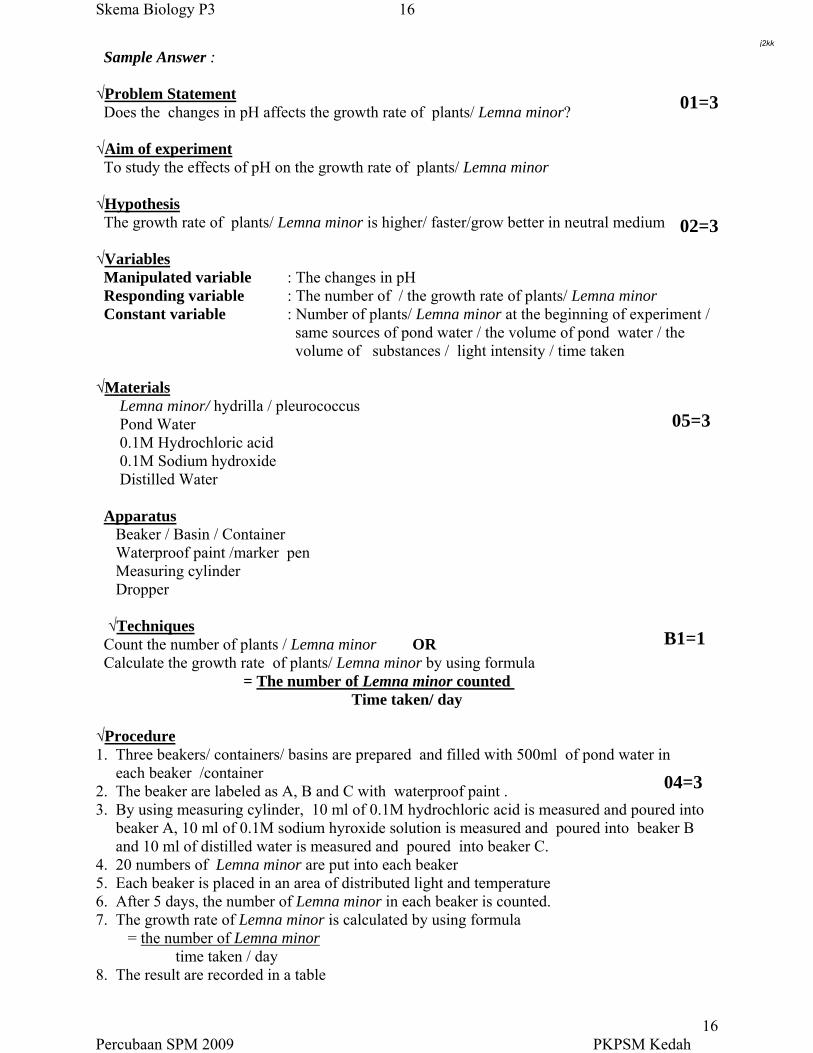
Skema Biology P3 16
Sample Answer : √Problem Statement 01=3 Does the changes in pH affects the growth rate of plants/ Lemna minor? √Aim of experiment To study the effects of pH on the growth rate of plants/ Lemna minor √Hypothesis The growth rate of plants/ Lemna minor is higher/ faster/grow better in neutral medium 02=3 √Variables Manipulated variable : The changes in pH Responding variable : The number of / the growth rate of plants/ Lemna minor Constant variable : Number of plants/ Lemna minor at the beginning of experiment / same sources of pond water / the volume of pond water / the volume of substances / light intensity / time taken √Materials Lemna minor/ hydrilla / pleurococcus
05=3 Pond Water 0.1M Hydrochloric acid 0.1M Sodium hydroxide Distilled Water Apparatus Beaker / Basin / Container Waterproof paint /marker pen Measuring cylinder
Dropper √Techniques
B1=1 Count the number of plants / Lemna minor OR Calculate the growth rate of plants/ Lemna minor by using formula
= The number of Lemna minor counted Time taken/ day
√Procedure 1. Three beakers/ containers/ basins are prepared and filled with 500ml of pond water in each beaker /container 2. The beaker are labeled as A, B and C with waterproof paint . 3. By using measuring cylinder, 10 ml of 0.1M hydrochloric acid is measured and poured into
04=3
beaker A, 10 ml of 0.1M sodium hyroxide solution is measured and poured into beaker B and 10 ml of distilled water is measured and poured into beaker C. 4. 20 numbers of Lemna minor are put into each beaker 5. Each beaker is placed in an area of distributed light and temperature 6. After 5 days, the number of Lemna minor in each beaker is counted. 7. The growth rate of Lemna minor is calculated by using formula = the number of Lemna minor time taken / day 8. The result are recorded in a table
Percubaan SPM 2009 PKPSM Kedah 16
j2kk
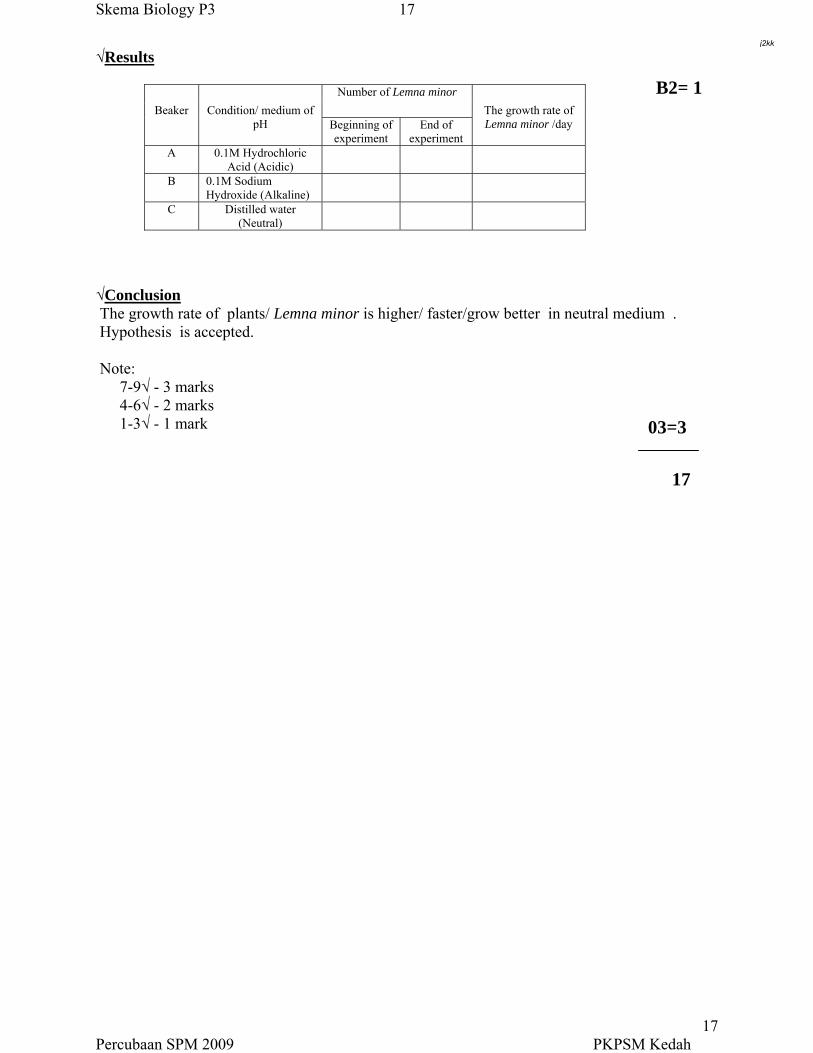
Skema Biology P3
Percubaan SPM 2009 PKPSM Kedah
17
17
√Results
B2= 1 Number of Lemna minor Beaker Condition/ medium of
pH Beginning of experiment
End of experiment
The growth rate of Lemna minor /day
A 0.1M Hydrochloric Acid (Acidic)
B 0.1M Sodium Hydroxide (Alkaline)
C Distilled water (Neutral)
√Conclusion The growth rate of plants/ Lemna minor is higher/ faster/grow better in neutral medium . Hypothesis is accepted. Note:
7-9√ - 3 marks 4-6√ - 2 marks
03=3 1-3√ - 1 mark
17
j2kk