overview of warm mix asphalt (wma) - … mix asphalt (wma) update thomas bennert, ph.d. ... tsr’s...
TRANSCRIPT
CAIT RUTGERS
Warm Mix Asphalt (WMA) Update
Thomas Bennert, Ph.D. Research Professor
Rutgers University Center for Advanced Infrastructure
and Transportation (CAIT)

CAIT RUTGERS
Presentation Outline
National Perspective New Jersey Perspective Moving Forward – Other Uses
CAIT RUTGERS
WMA Benefits
Reduced Emissions and Fumes Reduced Energy Consumption Improved Workability Extending Paving Window Cold Weather Paving Compaction Aid/Improve Compaction Quality

CAIT RUTGERS
WMA Technologies
In 2005
CAIT RUTGERS
WMA Technologies
At the end of 2012
+
CAIT RUTGERS
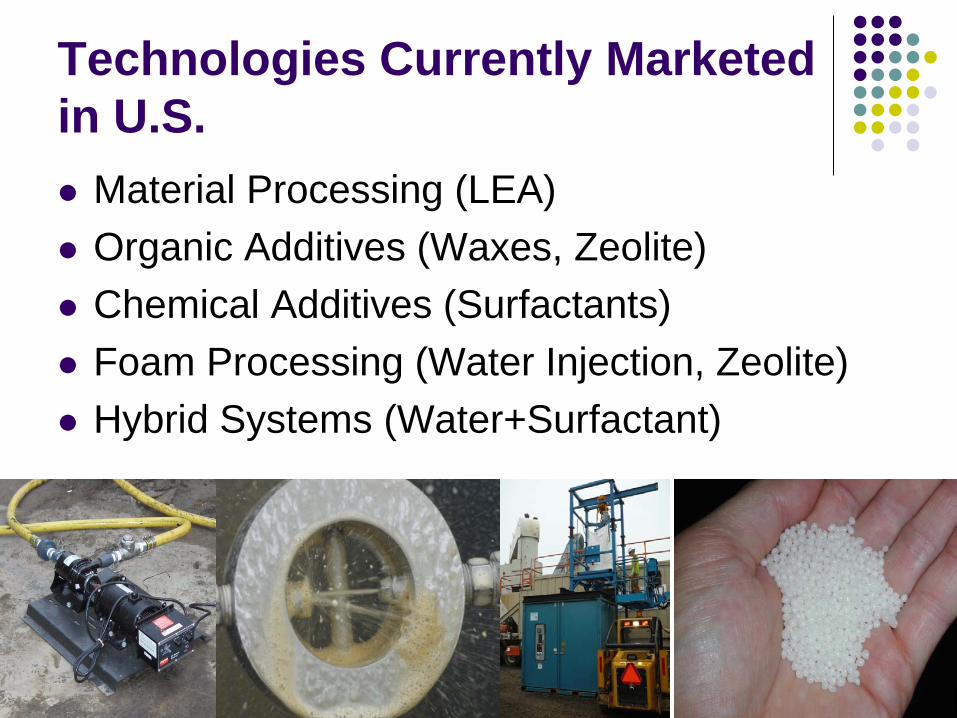
Technologies Currently Marketed in U.S. Material Processing (LEA) Organic Additives (Waxes, Zeolite) Chemical Additives (Surfactants) Foam Processing (Water Injection, Zeolite) Hybrid Systems (Water+Surfactant)

CAIT RUTGERS
Information on Technologies
CAIT RUTGERS
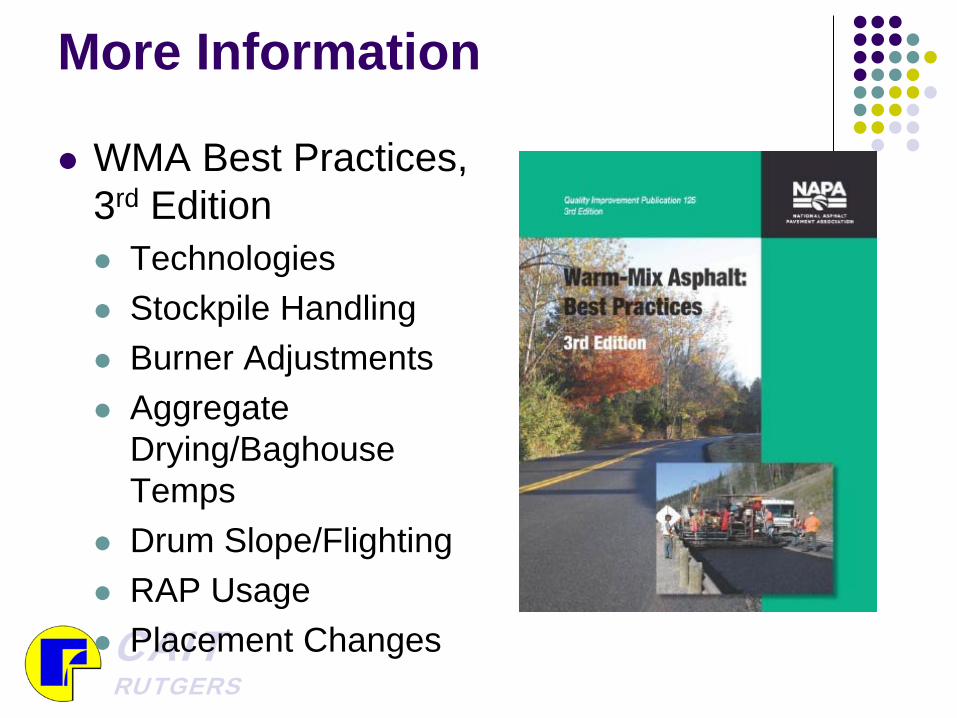
More Information WMA Best Practices,
3rd Edition Technologies Stockpile Handling Burner Adjustments Aggregate
Drying/Baghouse Temps
Drum Slope/Flighting RAP Usage Placement Changes

CAIT RUTGERS
NATIONAL PERSPECTIVE
CAIT RUTGERS
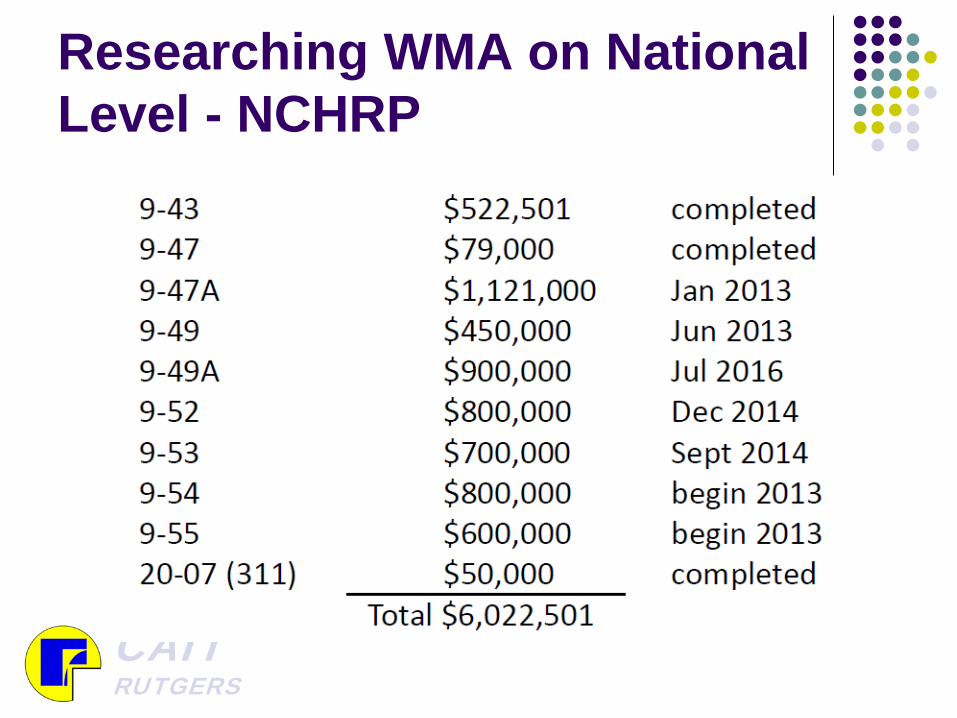
Researching WMA on National Level - NCHRP
CAIT RUTGERS
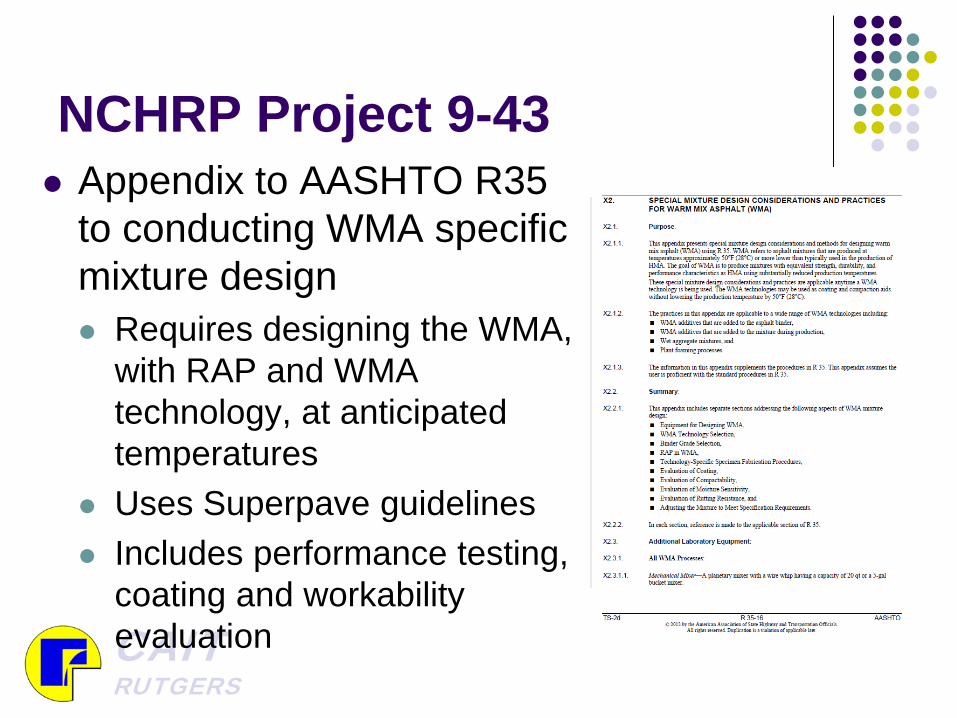
NCHRP Project 9-43 Appendix to AASHTO R35
to conducting WMA specific mixture design Requires designing the WMA,
with RAP and WMA technology, at anticipated temperatures
Uses Superpave guidelines Includes performance testing,
coating and workability evaluation
CAIT RUTGERS
NCHRP Project 9-47A
Evaluated 14 in-place and newly constructed WMA projects – all having companion HMA Various technologies Evaluated loose mix performance Field density Field performance (limited to the time frame of the
project < 5 years)
CAIT RUTGERS
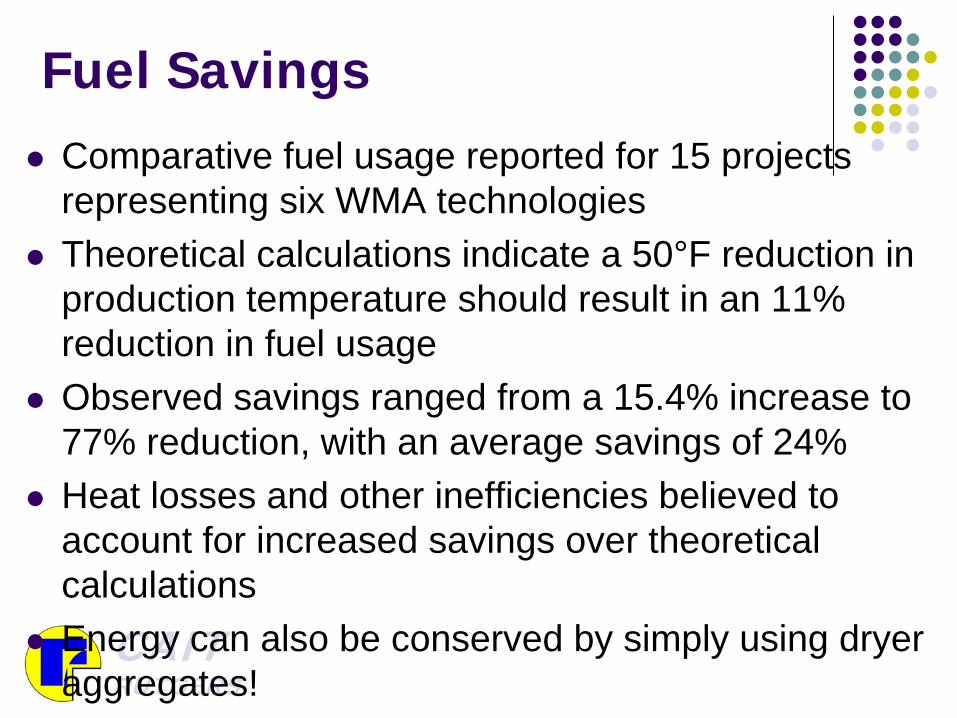
Fuel Savings Comparative fuel usage reported for 15 projects
representing six WMA technologies Theoretical calculations indicate a 50°F reduction in
production temperature should result in an 11% reduction in fuel usage
Observed savings ranged from a 15.4% increase to 77% reduction, with an average savings of 24%
Heat losses and other inefficiencies believed to account for increased savings over theoretical calculations
Energy can also be conserved by simply using dryer aggregates!
CAIT RUTGERS
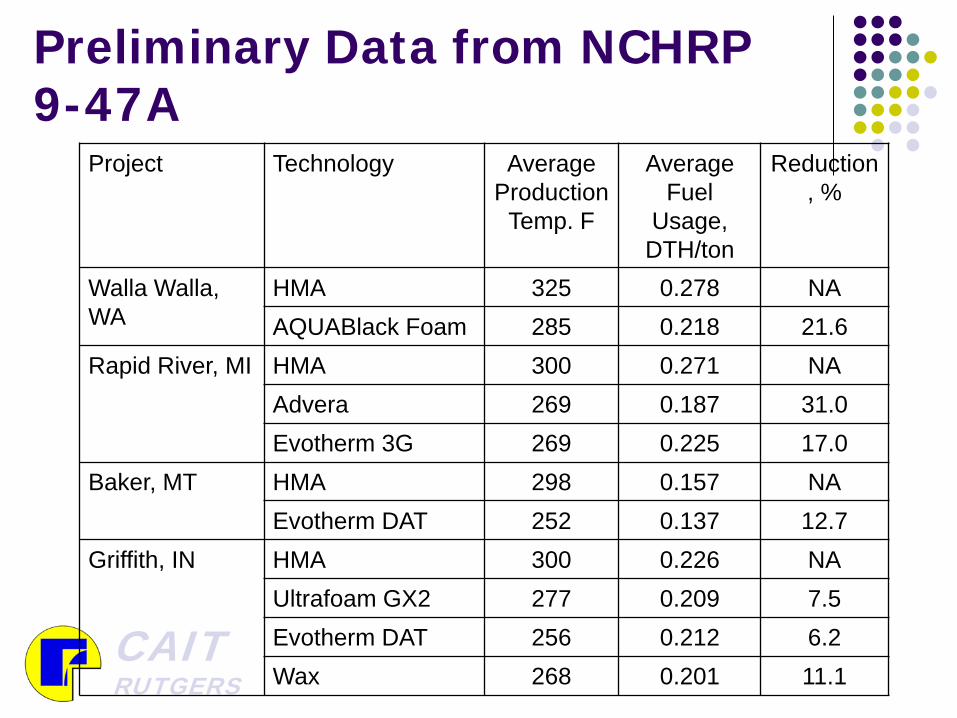
Preliminary Data from NCHRP 9-47A
Project Technology Average Production
Temp. F
Average Fuel
Usage, DTH/ton
Reduction, %
Walla Walla, WA
HMA 325 0.278 NA AQUABlack Foam 285 0.218 21.6
Rapid River, MI HMA 300 0.271 NA Advera 269 0.187 31.0 Evotherm 3G 269 0.225 17.0
Baker, MT HMA 298 0.157 NA Evotherm DAT 252 0.137 12.7
Griffith, IN HMA 300 0.226 NA Ultrafoam GX2 277 0.209 7.5 Evotherm DAT 256 0.212 6.2 Wax 268 0.201 11.1
CAIT RUTGERS
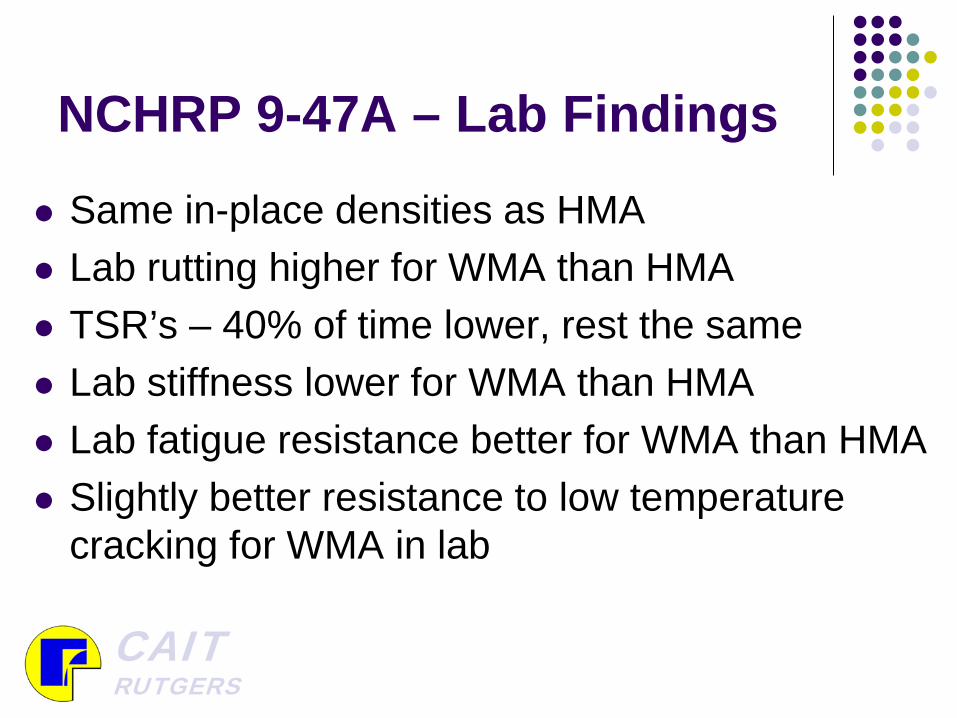
NCHRP 9-47A – Lab Findings
Same in-place densities as HMA Lab rutting higher for WMA than HMA TSR’s – 40% of time lower, rest the same Lab stiffness lower for WMA than HMA Lab fatigue resistance better for WMA than HMA Slightly better resistance to low temperature
cracking for WMA in lab
CAIT RUTGERS
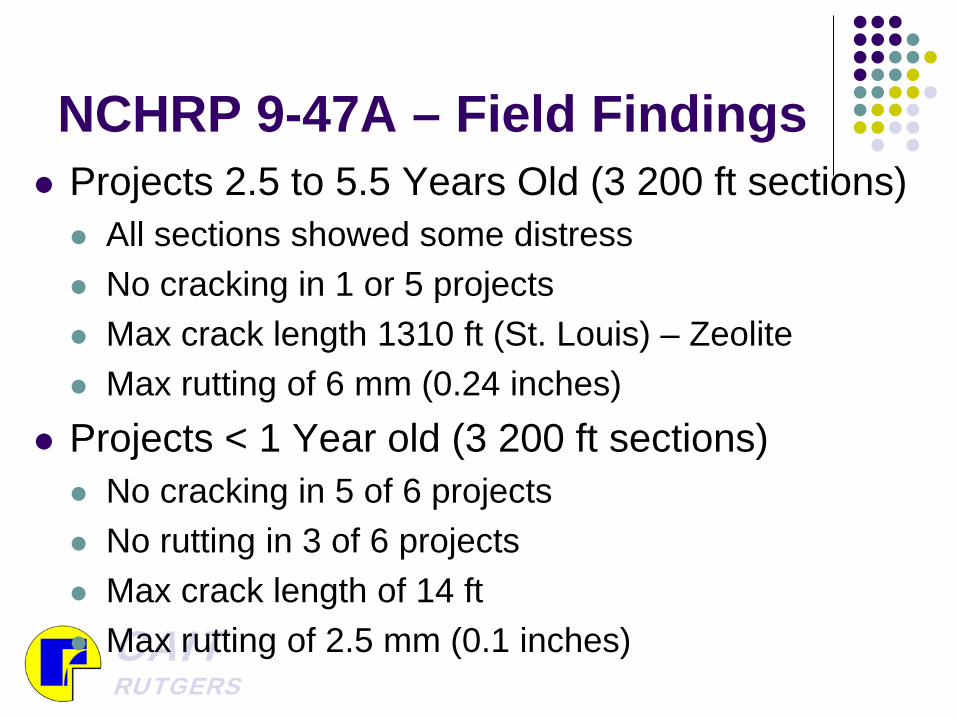
NCHRP 9-47A – Field Findings Projects 2.5 to 5.5 Years Old (3 200 ft sections) All sections showed some distress No cracking in 1 or 5 projects Max crack length 1310 ft (St. Louis) – Zeolite Max rutting of 6 mm (0.24 inches)
Projects < 1 Year old (3 200 ft sections) No cracking in 5 of 6 projects No rutting in 3 of 6 projects Max crack length of 14 ft Max rutting of 2.5 mm (0.1 inches)
CAIT RUTGERS
NCHRP 9-47A – Mix Design
All field projects evaluated used a “drop in” method for WMA
Project also looked at AASHTO Appendix to R35 Average optimum AC% decreased almost 0.3%
for WMA compare to HMA Lower rutting resistance for lab-produced material
CAIT RUTGERS
NCHRP 9-47A - Summary Continue to use “drop in” procedure Reduction in AC% is resultant of extra
compactability due to WMA - tricking gyratory Superpave mixes dry enough already
Field showed excellent rutting resistance although lab testing does pick up initial differences Do these differences quickly disappear with in-
service life?
CAIT RUTGERS
National Perspective
On-going research building on these findings Moisture Damage Established Long Term WMA Pavement
Performance sections Short-term aging in plants Long-term aging in the field

CAIT RUTGERS
NJDOT PERSPECTIVE
CAIT RUTGERS
NJDOT Perspective Conducting both laboratory research and pilot
program evaluation Laboratory Research Polymer Degradation Appendix R35 for NJ mixes General rutting and fatigue cracking performance
Pilot Program Plant produced WMA and companion HMA Rutting, fatigue, stiffness, and moisture damage
CAIT RUTGERS
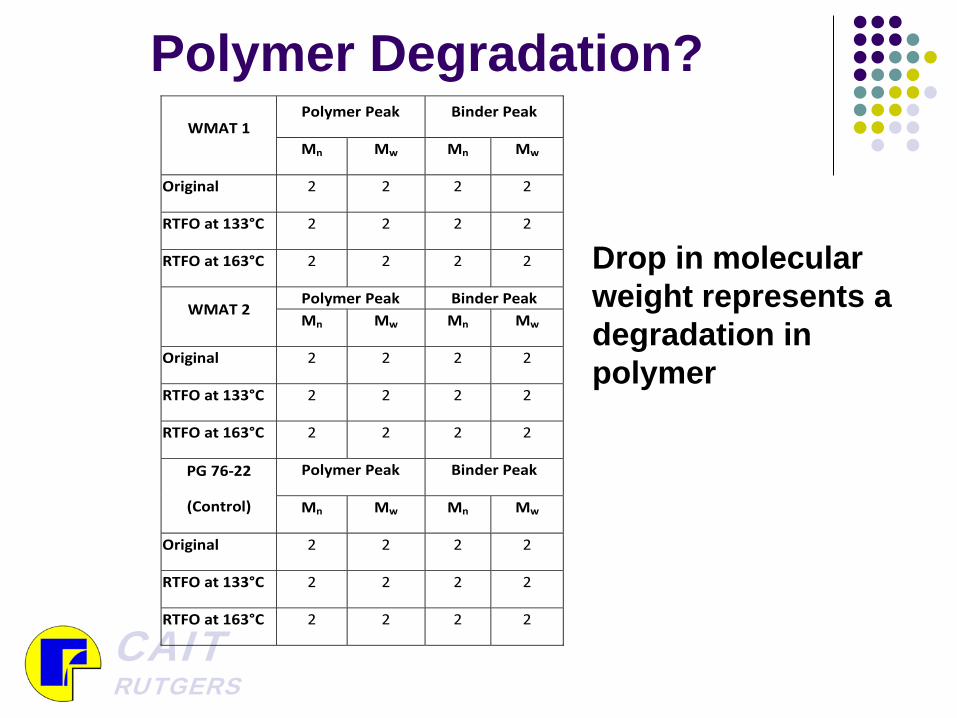
Polymer Degradation?
Drop in molecular weight represents a degradation in polymer
WMAT 1 Polymer Peak Binder Peak
Mn Mw Mn Mw
Original 2 2 2 2
RTFO at 133°C 2 2 2 2
RTFO at 163°C 2 2 2 2
WMAT 2 Polymer Peak Binder Peak Mn Mw Mn Mw
Original 2 2 2 2
RTFO at 133°C 2 2 2 2
RTFO at 163°C 2 2 2 2
PG 76-22
(Control)
Polymer Peak Binder Peak
Mn Mw Mn Mw
Original 2 2 2 2
RTFO at 133°C 2 2 2 2
RTFO at 163°C 2 2 2 2
CAIT RUTGERS
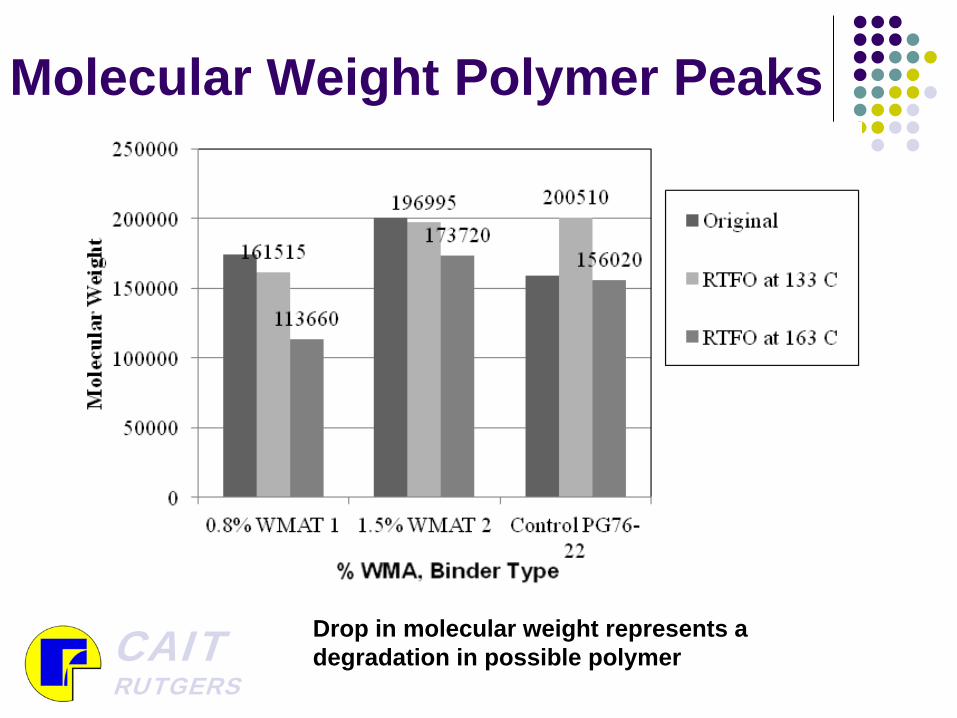
Molecular Weight Polymer Peaks
Drop in molecular weight represents a degradation in possible polymer
CAIT RUTGERS
Molecular Weight Results
All binders showed a reduction in Molecular Weight going from 133C to 163C (current RTFO standard) conditioning 42% for Evotherm 13% for Sasobit 29% for normal 76-22
Evidence that reduced production temperatures may help in reducing polymer degradation
CAIT RUTGERS
NJDOT – Appendix to R35
Looked at NJDOT Approved JMF’s @ 2 RAP contents Normal (315F mixing) Advera, Sasobit, Evotherm (275F mixing) 0 and 25% RAP contents
Determined Optimum asphalt content Rutting resistance, fatigue resistance, and TSR
CAIT RUTGERS
NJDOT - Appendix R35
For virgin mixes, an average 0.45% reduction in optimum AC% was found Function of extra “lubricity” in the mixture due to
the WMA technology For 25% RAP mixes, no change was found Does this mean the 25% RAP mixes were under-
asphalted if same level of “lubricity” occurred in both mixes?
CAIT RUTGERS
How to Ensure Not Under-Asphalted in Field
Allow mix to cool, or condition, at expected and slightly lower compaction temperatures Example: Sampled from back of truck at 280oF,
allow to cool to 265 to 260oF prior to gyratory compaction
Reduce low end of allowable air voids to 2.5% (currently 3 to 5% during production) Specify no adjustment (taking out AC%) to
increase compacted air voids
CAIT RUTGERS
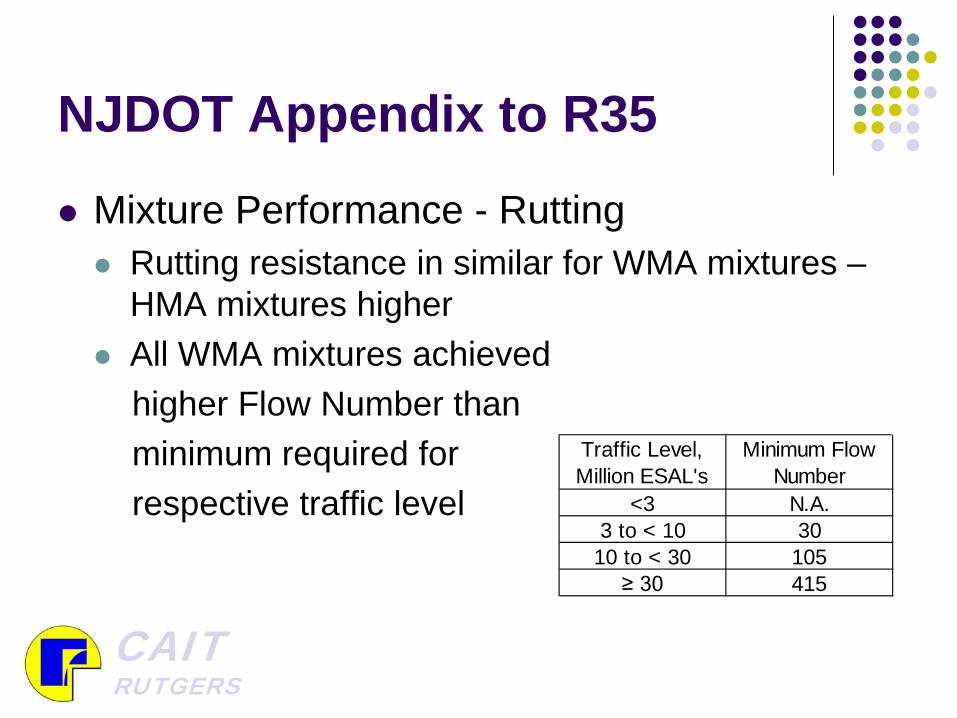
NJDOT Appendix to R35
Mixture Performance - Rutting Rutting resistance in similar for WMA mixtures –
HMA mixtures higher All WMA mixtures achieved higher Flow Number than minimum required for respective traffic level <3 N.A.
3 to < 10 3010 to < 30 105
≥ 30 415
Minimum Flow Number
Traffic Level, Million ESAL's
CAIT RUTGERS
NJDOT Appendix to R35
Mixture Performance – Fatigue Cracking When using WMA, all fatigue cracking results
improved 0% RAP at HMA temperatures were found to be
statistically equal to 25% RAP at WMA temperatures Based on optimum AC% found during mixture design 25% RAP WMA were approximately 0.5% higher in asphalt
content
CAIT RUTGERS
NJDOT Appendix to R35
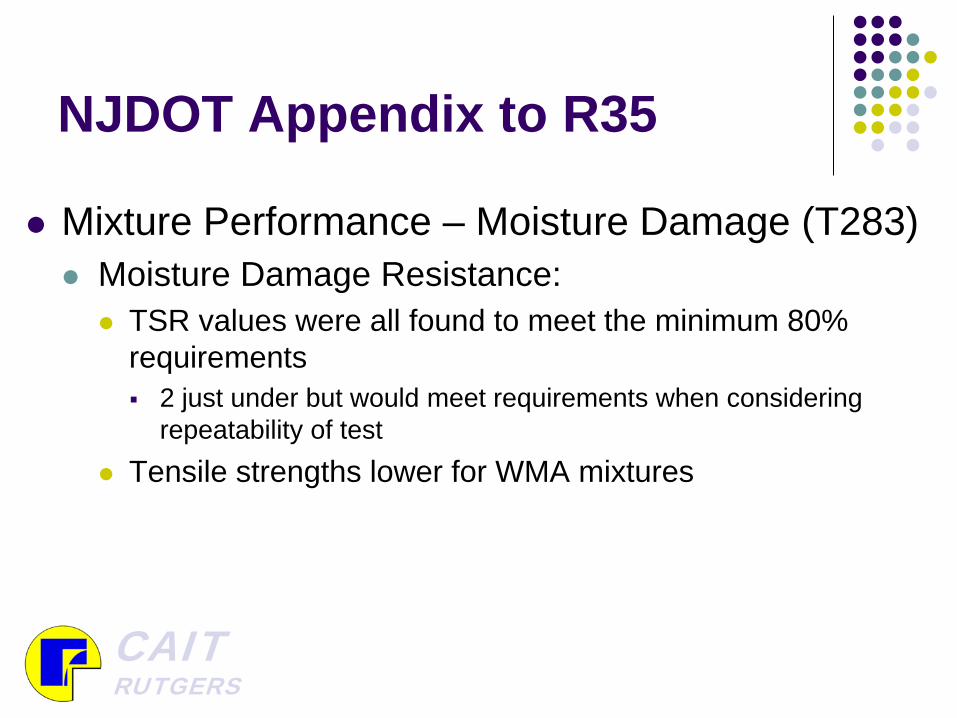
Mixture Performance – Moisture Damage (T283) Moisture Damage Resistance: TSR values were all found to meet the minimum 80%
requirements 2 just under but would meet requirements when considering
repeatability of test Tensile strengths lower for WMA mixtures
CAIT RUTGERS
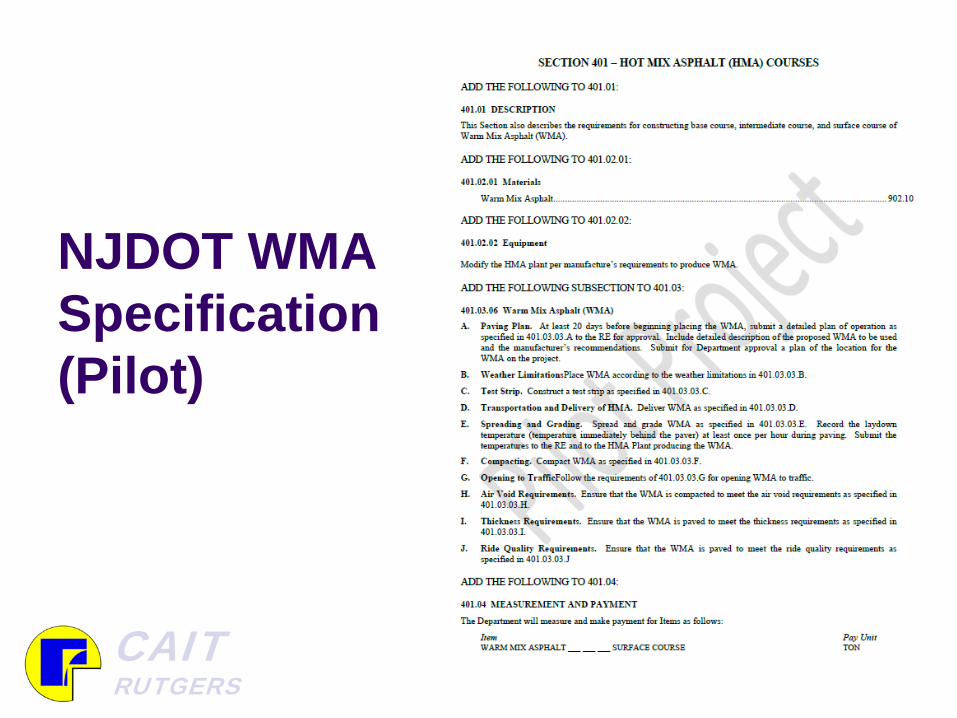
NJDOT WMA Specification (Pilot)
CAIT RUTGERS
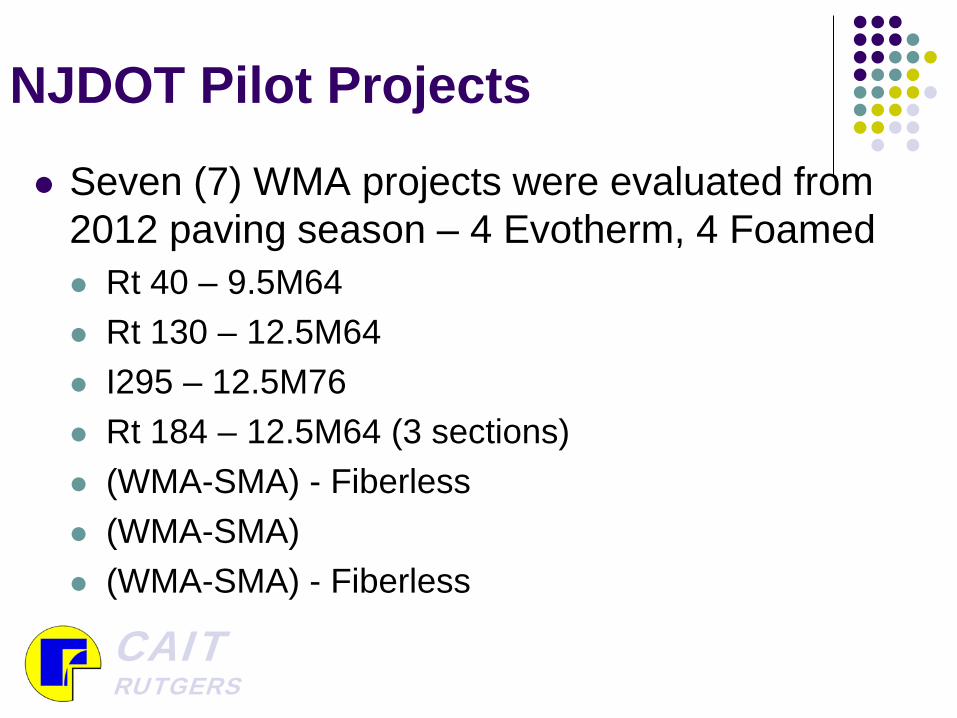
NJDOT Pilot Projects
Seven (7) WMA projects were evaluated from 2012 paving season – 4 Evotherm, 4 Foamed Rt 40 – 9.5M64 Rt 130 – 12.5M64 I295 – 12.5M76 Rt 184 – 12.5M64 (3 sections) (WMA-SMA) - Fiberless (WMA-SMA) (WMA-SMA) - Fiberless
CAIT RUTGERS
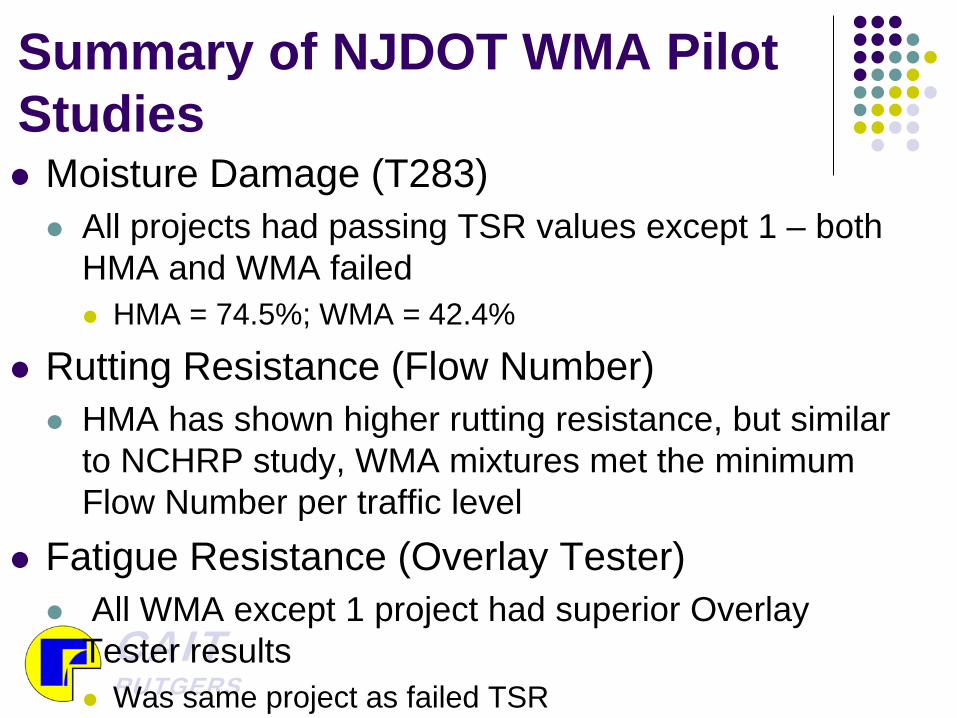
Summary of NJDOT WMA Pilot Studies Moisture Damage (T283) All projects had passing TSR values except 1 – both
HMA and WMA failed HMA = 74.5%; WMA = 42.4%
Rutting Resistance (Flow Number) HMA has shown higher rutting resistance, but similar
to NCHRP study, WMA mixtures met the minimum Flow Number per traffic level
Fatigue Resistance (Overlay Tester) All WMA except 1 project had superior Overlay
Tester results Was same project as failed TSR

CAIT RUTGERS
MOVING FORWARD – OTHER USES FOR WMA
CAIT RUTGERS
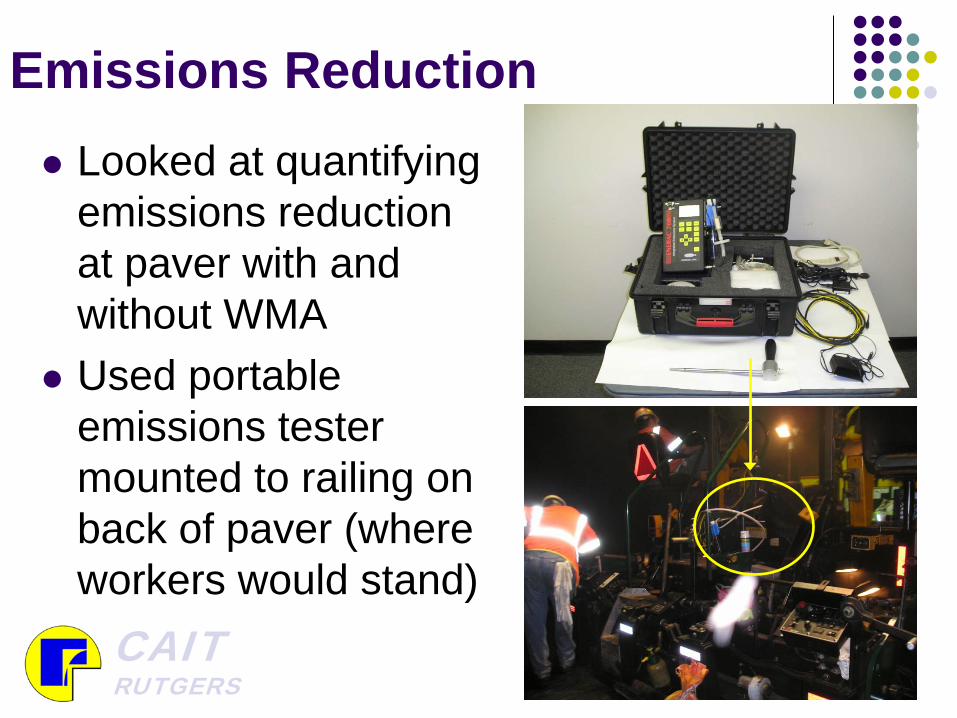
Emissions Reduction Looked at quantifying
emissions reduction at paver with and without WMA
Used portable emissions tester mounted to railing on back of paver (where workers would stand)
CAIT RUTGERS
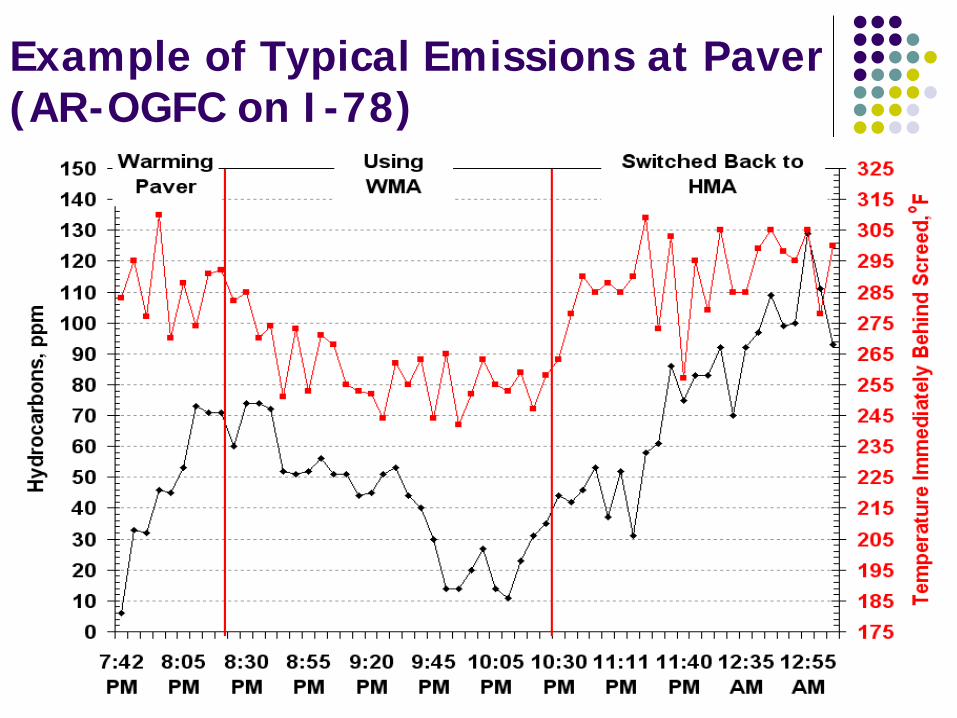
Example of Typical Emissions at Paver (AR-OGFC on I-78)
CAIT RUTGERS
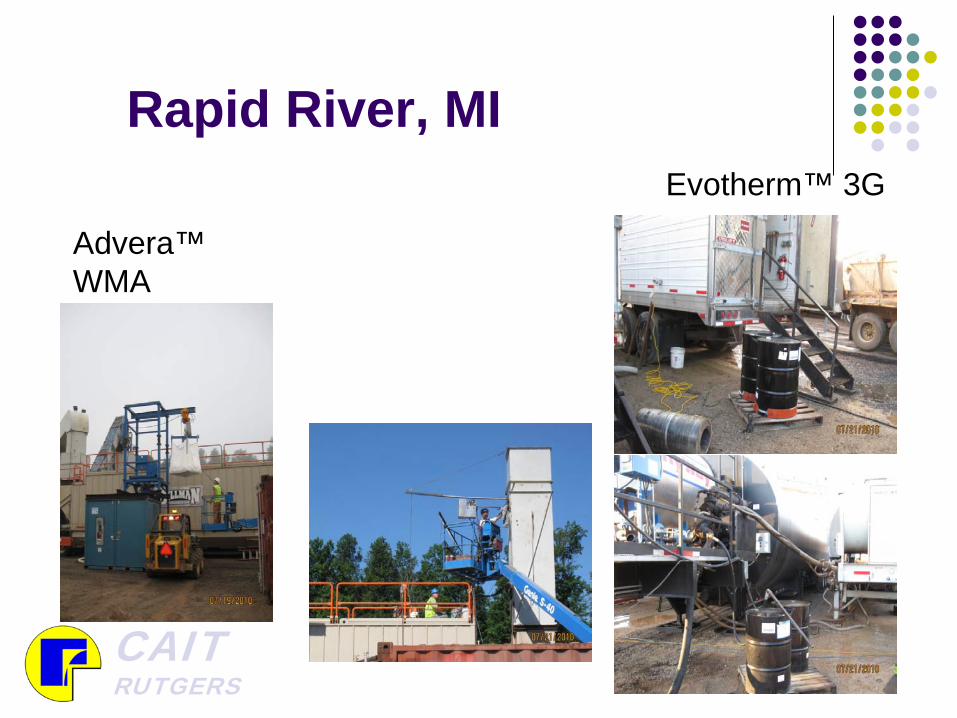
Rapid River, MI Evotherm™ 3G
Advera™ WMA
CAIT RUTGERS
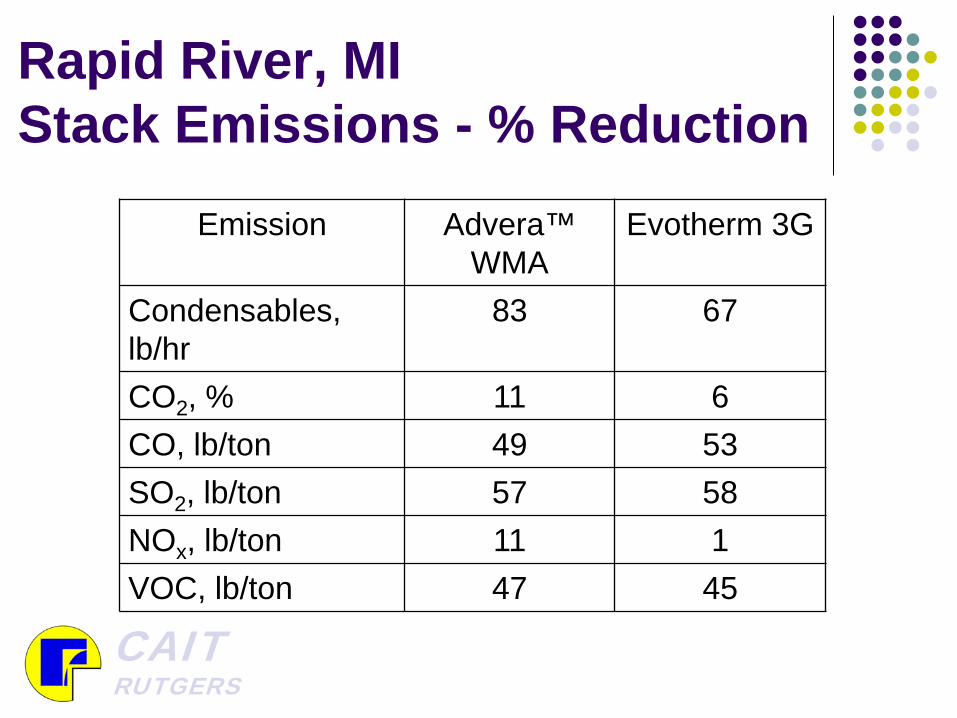
Rapid River, MI Stack Emissions - % Reduction
Emission Advera™ WMA
Evotherm 3G
Condensables, lb/hr
83 67
CO2, % 11 6 CO, lb/ton 49 53 SO2, lb/ton 57 58 NOx, lb/ton 11 1 VOC, lb/ton 47 45
CAIT RUTGERS
THIN LIFT PAVEMENTS – PREVENTATIVE MAINTENANCE
CAIT RUTGERS
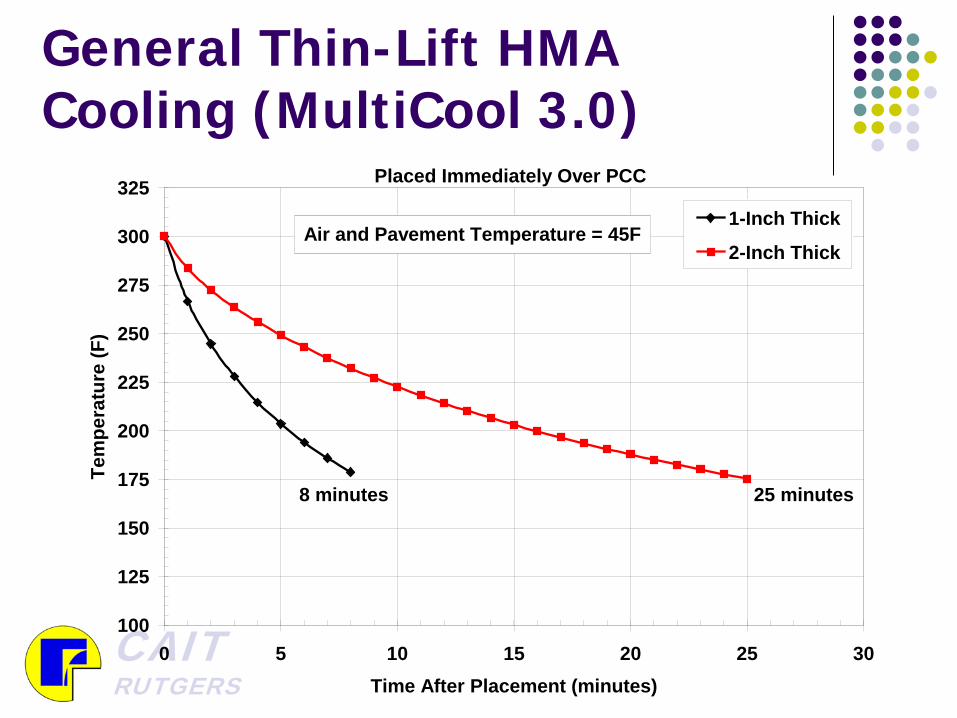
General Thin-Lift HMA Cooling (MultiCool 3.0)
100
125
150
175
200
225
250
275
300
325
0 5 10 15 20 25 30Time After Placement (minutes)
Tem
pera
ture
(F)
1-Inch Thick
2-Inch ThickAir and Pavement Temperature = 45F
8 minutes 25 minutes
Placed Immediately Over PCC
CAIT RUTGERS
REDUCTION OF CRACK/JOINT SEALANT SWELLING
CAIT RUTGERS
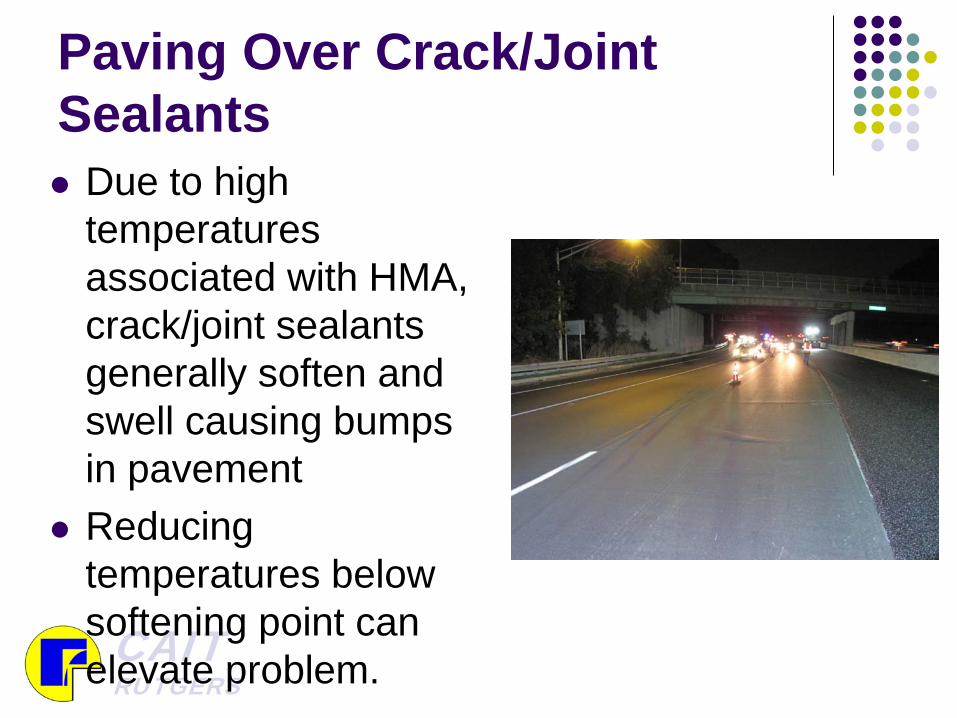
Paving Over Crack/Joint Sealants Due to high
temperatures associated with HMA, crack/joint sealants generally soften and swell causing bumps in pavement
Reducing temperatures below softening point can elevate problem.

CAIT RUTGERS
Paving over Crack Sealant
West Bend Airport – WMA with 20% RAP Photos c/o Payne and Dolan
CAIT RUTGERS
ELIMINATING FIBERS FROM SMA & OGFC MIXTURES
CAIT RUTGERS
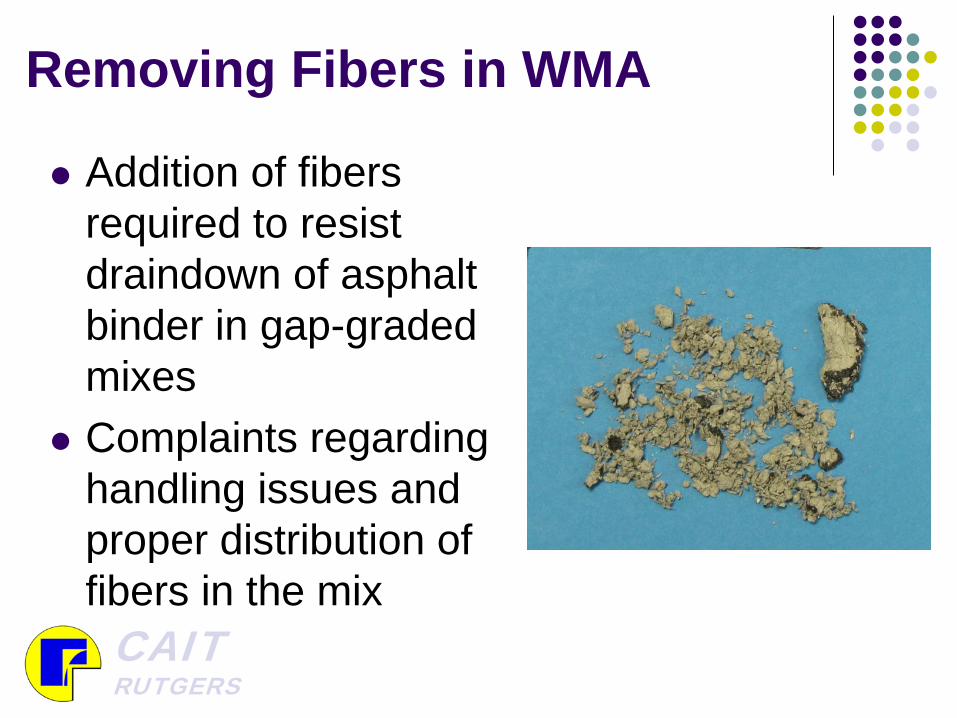
Removing Fibers in WMA
Addition of fibers required to resist draindown of asphalt binder in gap-graded mixes
Complaints regarding handling issues and proper distribution of fibers in the mix
CAIT RUTGERS
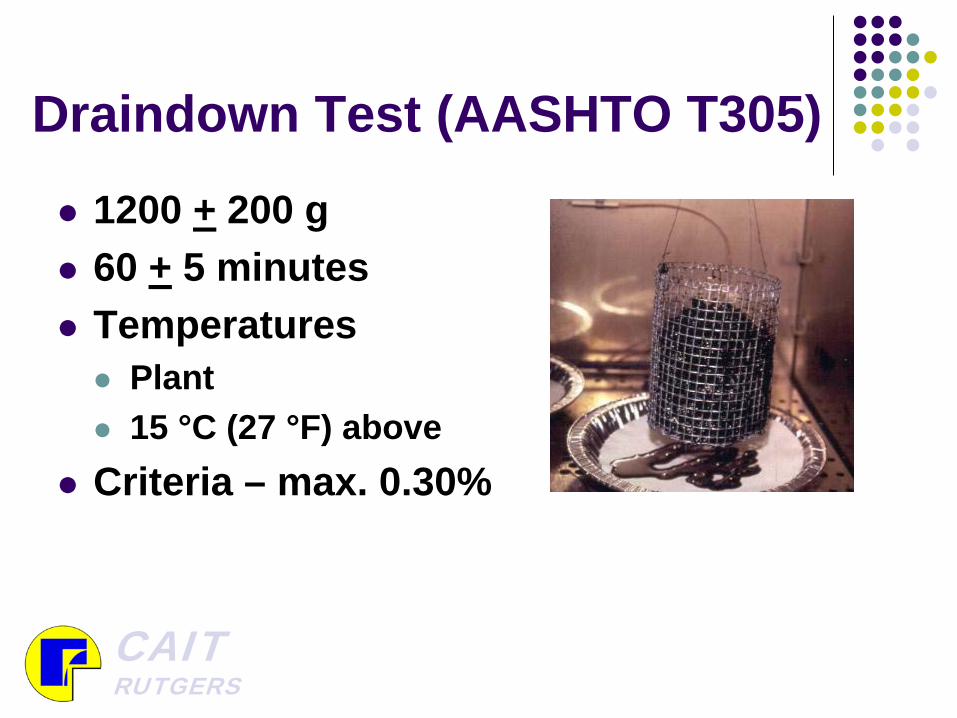
Draindown Test (AASHTO T305)
1200 + 200 g 60 + 5 minutes Temperatures Plant 15 °C (27 °F) above
Criteria – max. 0.30%
CAIT RUTGERS
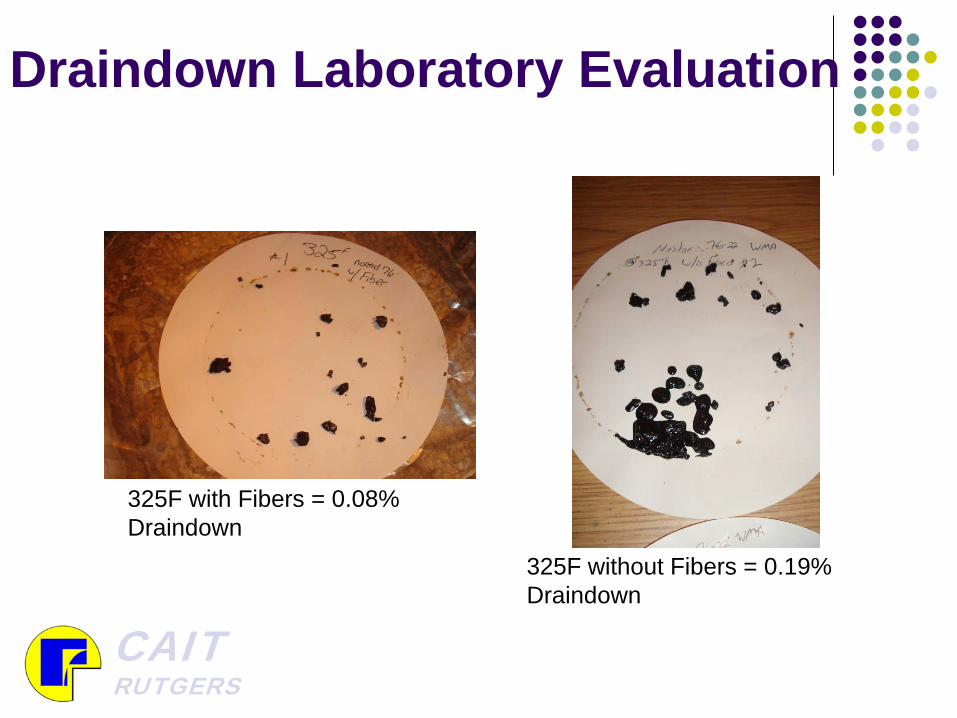
Draindown Laboratory Evaluation
325F with Fibers = 0.08% Draindown
325F without Fibers = 0.19% Draindown
CAIT RUTGERS
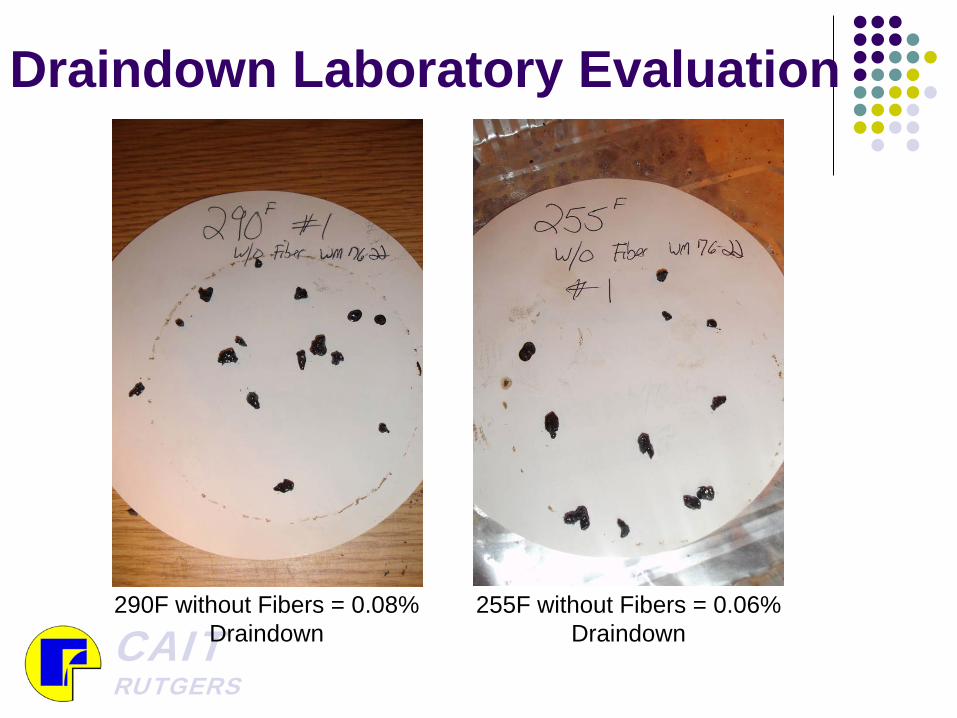
Draindown Laboratory Evaluation
290F without Fibers = 0.08% Draindown
255F without Fibers = 0.06% Draindown
CAIT RUTGERS
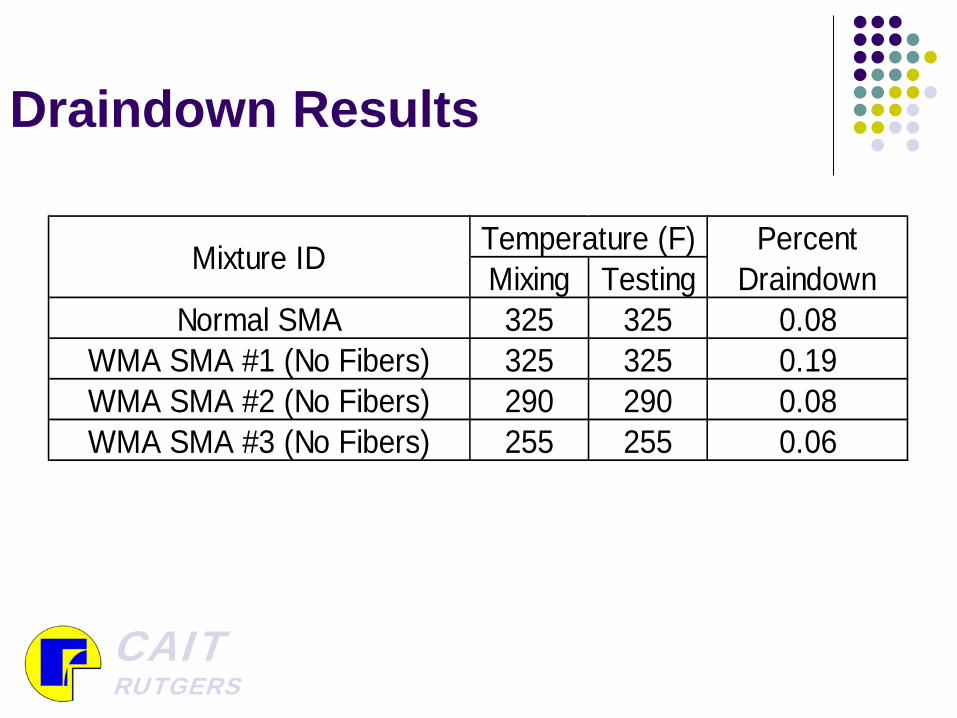
Draindown Results
Mixing TestingNormal SMA 325 325 0.08
WMA SMA #1 (No Fibers) 325 325 0.19WMA SMA #2 (No Fibers) 290 290 0.08WMA SMA #3 (No Fibers) 255 255 0.06
Mixture ID Percent Draindown
Temperature (F)
CAIT RUTGERS
WMA to Eliminate Fibers
WMA technology used to reduce temperatures and achieve density Reduction of production temperature increases
viscosity of binder Increased viscosity adheres to aggregate better
resulting in lower draindown
CAIT RUTGERS
Summary Enough national and regional research to indicate
WMA can perform as well as HMA Laboratory testing able to pick up differences but do
how long do these differences exist Continue to monitor sections in NJ
NCHRP 9-47A and NJDOT research indicates no need to have specific WMA mix design procedure Continue with “drop in” procedure
WMA also has potential to help with other specific needs in NJ Thin-lift mixes, eliminating fibers in SMA, reducing
emissions/odors of asphalt rubber mixtures