overview of steel industry in thailand - eccj ... of steel industry in thailand mr. hin navawongse...
TRANSCRIPT

0
Overview of Steel Industry in Thailand
Mr. Hin NavawongseIron and Steel Institute of Thailand
November 2006
1
Contents
Thailand steel situation
Specific Energy Consumption (SEC) in 1999 - 2004

2
Integrated steel production process
Iron ore + Cokeor
Iron ore + Natural gas
Ironmaking
Pig ironSponge iron
Steelmaking & casting
Steel forming
Scrap
Electric Arc FurnaceBasic oxygen Furnace
Hot metal
BilletBloom
Slab
Heavy Section
Round bar, Deformed bar
Wire rod
Light section
Hot rolled coil Hot rolled plate
Cold rolled coil
HDGEGTin plate, tin free
Pipe
Cold formed section
HDG Pipe
Downstream industry Construction Auto parts Appliance Furniture Packaging

3
Thailand Apparent Steel Consumption (million MT)
0
2
4
6
8
10
12
14
16
1997 1998 1999 2000 2001 2002 2003 2004 2005 2005Jan-Aug
2006Jan-Aug
Production Import Export Apparent Consumption
12.66, 16%
13.88, 9.6%
8.31, -15.7%
Source : ISIT
The decline since second half of 2005 was mainly derived from a slowdown in consumer expenditure and investment.

4
Thailand Long Product Apparent Consumption (million MT)
0
1
2
3
4
5
6
1997 1998 1999 2000 2001 2002 2003 2004 2005 2005Jan-Aug
2006Jan-Aug
Production Import Export Apparent Consumption
5.61, 1%5.56, 22%
3.50, -15.6%
Long Product 2005 Jan-Aug 2006 Jan-Aug %ChangeProduction 3,664 3,134 -14.5%Import 674 618 -8.4%Export 194 252 30.3%Apparent Consumption 4,145 3,500 -15.6%
Unit : 000 MT
Long Products Bar Consumption (000 MT)
050
100150200250300350400450
Jan
Feb
Mar Apr
May
Jun
Jul
Aug
Sep
Oct
Nov Dec Ja
nFe
bM
ar Apr
May
Jun
Jul
Aug
Sep
Oct
Nov Dec Ja
nFe
bM
ar Apr
May
Jun
Jul
Aug
2004 2005 2006
Production Import Export Consumption
Wire rod Consumption (000 MT)
020406080
100120140160180
Jan
Feb
Mar Apr
May
Jun
Jul
Aug
Sep
Oct
Nov Dec Ja
nFe
bM
ar Apr
May
Jun
Jul
Aug
Sep
Oct
Nov Dec Ja
nFe
bM
ar Apr
May
Jun
Jul
Aug
2004 2005 2006
Production Import Export Consumption
Bar Consumption (000 MT)
Wire rod Consumption (000 MT)
Source : ISIT

5
2,7003,293 3,235 2,712
2003 2004 2005 2006E
158 182230 232
45 3588
47
2003 2004 2005 2006E
Main destination (export)
- USA
- Cambodia
- Lao Republic
- Australia
Bar
Bar production
Bar import - export
Production
Major sources (import)
-S.Korea
- Taiwan
- Japan
- China
Producers
- Millineum Steel - Bangsaphan Bar mill
- Bangkok Steel Industry - Chonviriya Steel
- Burapa Steel Industries - Thai Steel Profile
- Other
Unit : 000 MT
Source : ISIT
ImportExport
6
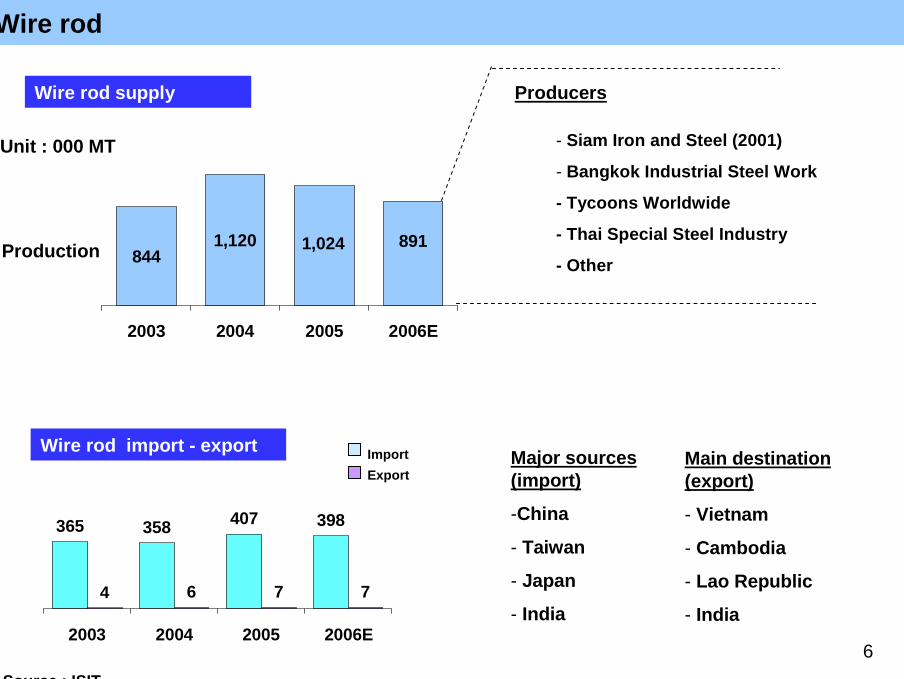
8441,120 1,024 891
2003 2004 2005 2006E
365 358 407 398
6 7 74
2003 2004 2005 2006E
Wire rod
Unit : 000 MT
Wire rod supply
Wire rod import - export
Production
Major sources (import)
-China
- Taiwan
- Japan
- India
Producers
Main destination (export)
- Vietnam
- Cambodia
- Lao Republic
- India
- Siam Iron and Steel (2001)
- Bangkok Industrial Steel Work
- Tycoons Worldwide
- Thai Special Steel Industry
- Other
Source : ISIT
ImportExport

7
Coated consumption (000 MT)
0
50
100
150
200
250
Jan
Feb
Mar Apr
May
Jun
Jul
Aug
Sep
Oct
Nov Dec Ja
nFe
bM
ar Apr
May
Jun
Jul
Aug
Sep
Oct
Nov Dec Ja
nFe
bM
ar Apr
May
Jun
Jul
Aug
2004 2005 2006
Production Import Export Consumption
Flat Products
Flat Product 2005 Jan-Aug 2006 Jan-Aug %ChangeProduction 2,788 2,767 -0.7%Import 3,807 3,020 -20.7%Export 889 982 10.5%Apparent Consumption 5,706 4,805 -15.8%
Unit : 000 MT
Coated Consumption (000 MT)
HR Sheet consumption (000 MT)
0100200300400500600700
Jan
Feb
Mar Apr
May
Jun
Jul
Aug
Sep
Oct
Nov Dec Ja
nFe
bM
ar Apr
May
Jun
Jul
Aug
Sep
Oct
Nov Dec Ja
nFe
bM
ar Apr
May
Jun
Jul
Aug
2004 2005 2006
Production Import Export Consumption
HR Consumption (000 MT)
CR & CR stainless consumption (000 MT)
0
50
100
150
200
250
300
Jan
Feb
Mar Apr
May
Jun
Jul
Aug
Sep
Oct
Nov Dec Jan
Feb
Mar Apr
May
Jun
Jul
Aug
Sep
Oct
Nov Dec Jan
Feb
Mar Apr
May
Jun
Jul
Aug
2004 2005 2006
Production Import Export Consumption
CR&CR Stainless Consumption (000 MT)
Thailand Flat Product Apparent Consumption (million MT)
0
1
2
3
4
5
6
7
8
9
1997 1998 1999 2000 2001 2002 2003 2004 2005 2005Jan-Aug
2006Jan-Aug
Production Import Export Apparent Consumption
7.1, 11%
8.27, 16.5%
4.81, -15.8%
Source : ISIT

8
3,3283,905
4,418 4,090
2003 2004 2005 2006E
2,348 2,354 2,6381,896
613 914 946275
2003 2004 2005 2006E
Hot Rolled Products
Main destination (export)- USA- Europe- Vietnam- Indonesia
Producers
Production
HR supply
HR Import - export
- Sahaviriya Steel Industry
- G Steel
- NSM
- Sahaviriya Plate Mill
- LPN
Major sources (import)
- Japan
- China
- S.Korea
- Taiwan
Unit : 000 MT
Source : ISIT
ImportExport
9
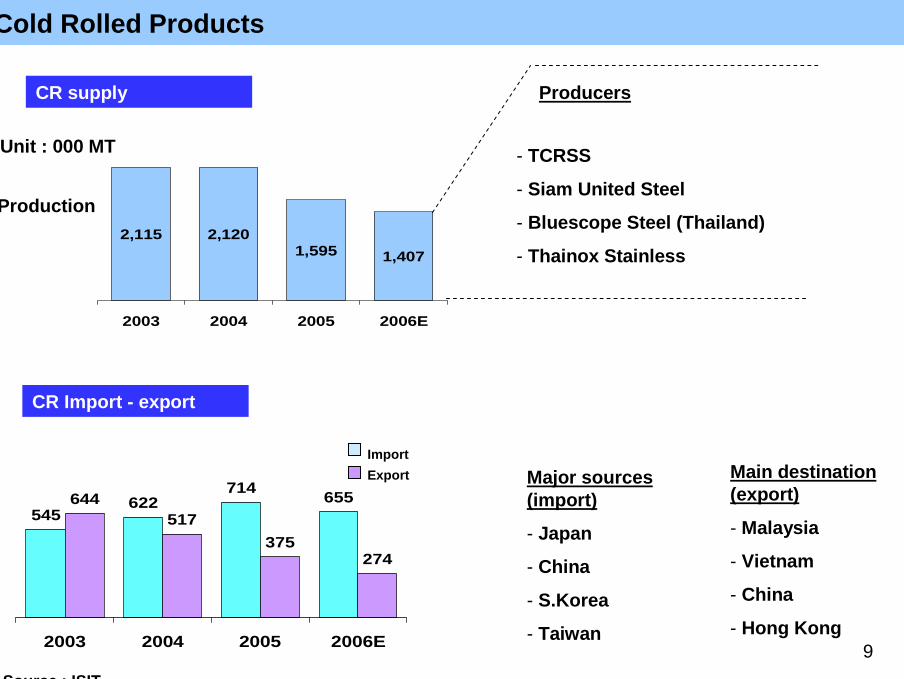
2,115 2,1201,595 1,407
2003 2004 2005 2006E
545622
714 655644
274375
517
2003 2004 2005 2006E
Main destination (export)
- Malaysia
- Vietnam
- China
- Hong Kong
Production
Cold Rolled Products
CR supply
CR Import - export
Producers
- TCRSS
- Siam United Steel
- Bluescope Steel (Thailand)
- Thainox Stainless
Major sources (import)
- Japan
- China
- S.Korea
- Taiwan
Unit : 000 MT
Source : ISIT
ImportExport

10
437 443333 310
2003 2004 2005 2006E
593 6871,018 941
87 38 6976
2003 2004 2005 2006E
Production
Main destination (export)
- Myanmar
- USA
- Malaysia
- Lao Republic
Coated Products - GI
GI supply
GI Import - export
Producers
- Bangkok Steel Industry
- Thai Coated Steel
- Sangasri Thai
- Thailand Iron Work
- Ratchasima Steel
Major sources (import)
-Japan
- China
- S.Korea
- Taiwan
Unit : 000 MT
Source : ISIT
ImportExport

11
407 466360 372
2003 2004 2005 2006E
120 138 112 135
7 6 85
2003 2004 2005 2006E
Main destination (export)
- Lao Republic
- Indonesia
- Cambodia
- Vietnam
Major sources (import)
- S.Korea
- Taiwan
- Japan
- China
Coated Products – TP&TF
TP&TF supply
TP&TF Import - export
Production
Producers
- Siam tinplate
- Thai tinplate
Unit : 000 MT
Source : ISIT
ImportExport

12
148 176 177233
2003 2004 2005 2006E
148
248 239289
42 61 9072
2003 2004 2005 2006E
Main destination (export)
- Lao Republic
- Indonesia
- Cambodia
- Vietnam
Coated Products – Other coated (Zn-Al, color, other metallic coated)
Other coated supply
Other coated import - export
Production
Major sources (import)
-Japan
- China
- S.Korea
- Taiwan
Producer
- Bluescope steel (Thailand)
Unit : 000 MT
Source : ISIT
ImportExport

13
Thailand steel Import – Export in 2005 (Unit : ‘000 tonnes)
-613
-115
-147
-17
-407
-230
-364
-1,368
-1,695
-3,476
-1,825
165
105
36
577
247
7
35
39
149
290
Billet
Wire rod
Section
HRC
HRP
CRC
Coated sheet
Slab
Bar
Seamless pipe
Welded pipe
Import Export
Thailand still relies on imports of both semi-finished and finished steel products, specially for flat steel product group.
Source : ISIT

14
Construction is a major consuming sector, most of its application requires commercial steel grade.
Total consumption in 2005 = 13.88 million tonnes
Consumption per capita in 2005 = 212 kg
Ratio of long : flat steel consumption = 40 : 60
Consumption by downstream sector
- Construction 60%
- Automotive 12%
- Industrial 11%
- Appliance 8%
- Packaging 5%
- Other 4%
Source : ISIT
Construction,60%
Automotive,12%
Industrial, 11%
Appliance, 8%
Packaging, 5%Other, 4%

15
Contents
Thailand steel situation
Specific Energy Consumption (SEC) in 1999 - 2004

16
Specific Energy Consumption for bar products
BAR with EAFRaw material : ScrapProduct : Round bar/deformed bar
Ratio (%)
Elec.51%
Fuel38%
oxygen10%
5,095
Average SEC
(MJ/ton)
BAR without EAFRaw material : BilletProduct : Round bar/deformed bar
Elec.19%
Fuel 81%
2,075
Source: team analysis
Average SEC
(MJ/ton)
Ratio (%)

17
Specific Energy Consumption for wire rod products
Wire rod with EAFRaw material : ScrapProduct : Wire rod
Wire rod without EAFRaw material : BilletProduct : Wire rod
Elec.46%
Fuel 36%
oxygen18%
6,442
3,212
Elec. 33%Fuel
67%
Source: team analysis
Ratio (%)Average SEC
(MJ/ton)
Average SEC
(MJ/ton)
Ratio (%)

18
Specific Energy Consumption for hot rolled section productsHot rolled section with EAFRaw material : ScrapProduct : Hot rolled section
Hot rolled section without EAFRaw material : BilletProduct : Hot rolled section
Elec. 40%
Fuel 47%
oxygen13%
6,051
2,886
Elec. 11%
Fuel 89%
Source: team analysis
Ratio (%)Average SEC
(MJ/ton)
Average SEC
(MJ/ton)
Ratio (%)

19
Specific Energy Consumption for hot rolled sheet productsHR with EAFRaw material : ScrapProduct : Hot rolled coil
HR without EAFRaw material : SlabProduct : Hot rolled coil / Hot rolled plate
Elec. 58%
Fuel 28%oxygen14%
4,710
Elec. 25%
Fuel75%
2,246
Source: team analysis
Ratio (%)Average SEC
(MJ/ton)
Average SEC
(MJ/ton)
Ratio (%)

20
Specific Energy Consumption for cold rolled sheet productsCRCRaw material : Hot rolled coilProduct : Cold rolled coil
HDGRaw material : Cold rolled coilProduct : Hot dip galvanized sheet
1,787 Elec.
42%
Fuel58%
Specific Energy Consumption for hot dip galvanized sheet products
1,439
Elec. 18%
Fuel 82%
Source: team analysis
Ratio (%)Average SEC
(MJ/ton)
Average SEC
(MJ/ton)
Ratio (%)

21
Specific Energy Consumption for electro-galvanized sheet productsEGRaw material : Cold rolled coilProduct : Electro-galvanized sheet
TP&TFRaw material : Cold rolled coil - TMBPProduct : Tin plate & tin free sheet
Specific Energy Consumption for tin-plate & tin-free sheet products
Elec.63%
Fuel37%
1,300
876 Elec.60%
Fuel40%
Source: team analysis
Ratio (%)Average SEC
(MJ/ton)
Average SEC
(MJ/ton)
Ratio (%)

22
Specific Energy Consumption for cold-formed section productsCold formed sectionRaw material : Hot rolled coilProduct : Cold-formed section
ERW pipeRaw material : HRC, CRCProduct : ERW pipe
Specific Energy Consumption for ERW pipe products
Elec.100%
21
235 Elec.100%
Source: team analysis
Ratio (%)Average SEC
(MJ/ton)
Average SEC
(MJ/ton)
Ratio (%)

23
Specific Energy Consumption for galvanized steel pipe productsHDG pipeRaw material : Hot rolled coilProduct : Hot dip galvanized steel pipe 1,67
0Elec. 28%
Fuel72%
Source: team analysis
Ratio (%)Average SEC
(MJ/ton)

24
2,512
2,869
2,553 2,487
2,9003,014
0
500
1,000
1,500
2,000
2,500
3,000
3,500
1999 2000 2001 2002 2004 2004
Thailand specific energy consumption in 1999 -2004
MJ/ton
Source: team analysis

25
Total energy equivalent demand for Thai steel industry is estimated 939 ktoe.Est. total
production in 2004 (‘000
tons)
SEC (MJ/ton) Energy consumption
(ktoe)
X =
Bar_EAF
WR_EAF
Section_EAF
HR_EAF
Bar_no EAF
WR_no EAF
Section_no EAF
HR_no EAF
CRC
HDG
EG
Tin plate
Cold-formed
ERW pipe
Gal. steel pipe
1,600
1,350
550
570
600
430
1,607
2,300
2,100
260
180
467
450
810
252
5,095
2,075
6,442
3,212
6,051
2,886
4,710
2,246
1,787
1439
1,300
876
21
235
1,670
195
67
85
44
87
30
181
123
90
9
6
10
0.22
5
10
EAF –Hot rolling mill
Hot rolling mill
Source: team analysis
26
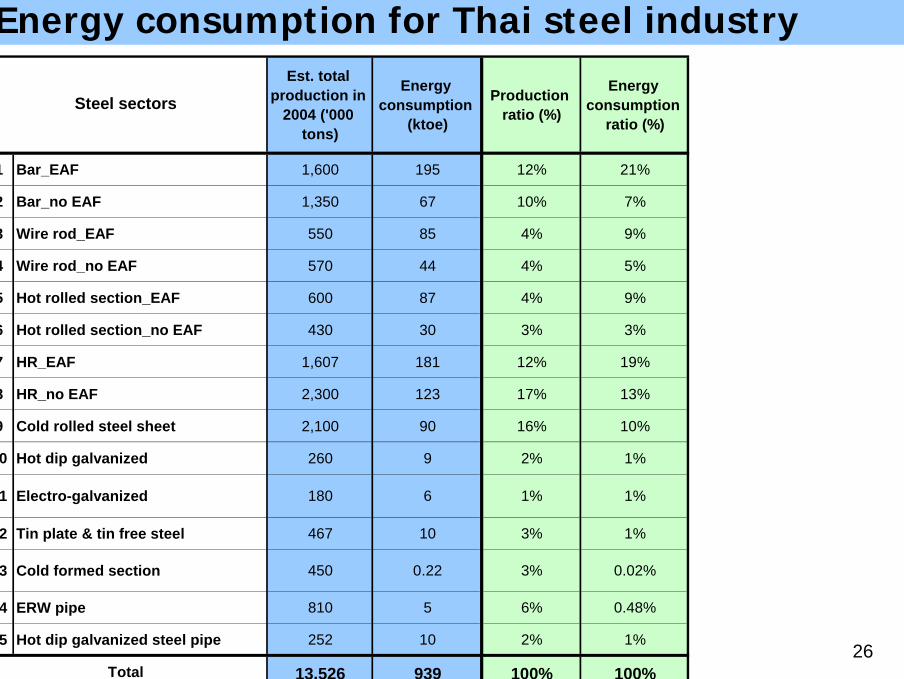
Energy consumption for Thai steel industryEst. total
production in 2004 ('000
tons)
Energy consumption
(ktoe)
Production ratio (%)
Energy consumption
ratio (%)
1 Bar_EAF 1,600 195 12% 21%
2 Bar_no EAF 1,350 67 10% 7%
3 Wire rod_EAF 550 85 4% 9%
4 Wire rod_no EAF 570 44 4% 5%
5 Hot rolled section_EAF 600 87 4% 9%
6 Hot rolled section_no EAF 430 30 3% 3%
7 HR_EAF 1,607 181 12% 19%
8 HR_no EAF 2,300 123 17% 13%
9 Cold rolled steel sheet 2,100 90 16% 10%
10 Hot dip galvanized 260 9 2% 1%
11 Electro-galvanized 180 6 1% 1%
12 Tin plate & tin free steel 467 10 3% 1%
13 Cold formed section 450 0.22 3% 0.02%
14 ERW pipe 810 5 6% 0.48%
15 Hot dip galvanized steel pipe 252 10 2% 1%
13,526 939 100% 100%Total
Steel sectors

27
Conversion factor
Electricity kWh 3.6
Oxygen (EAF)* NM3 18.72 [ = 5.2 (kWh/NM3) x 3.6 (MJ/kWh)]
Natural gas MMBTU 1,055.87
LPG kg 50.23
Bunker oil litre 39.77
Diesel litre 36.42
Kerosene litre 34.53
Unit MJ
Remark: In steelmaking process, oxygen is one source of energy to melt steel scrap. Chemical reaction between oxygen and carbon evolves heat as exothermic reaction.