overview of nitrogen super saturation at the hagerman ... saturation...abstract the hagerman...
TRANSCRIPT

Overview of Total Gas Supersaturation
at the Hagerman National Fish Hatchery
By the
Hagerman Hatchery Evaluation Team:
Funded by
Lower Snake River Compensation Plan U.S. Fish and Wildlife Service
Boise, Idaho
May 2009 Revised June 2010
Cooperators U.S. Fish and Wildlife Service U.S. Fish and Wildlife Service Hagerman National Fish Hatchery Idaho Fishery Resource Office 3059-D National Fish Hatchery Road PO Box 18 Hagerman, Idaho 83332 Ahsahka, Idaho 83520 U.S. Fish and Wildlife Service Idaho Department of Fish and Game Idaho Fish Health Center Nampa Research Office PO Box 272 1414 East Locust Lane Orofino, Idaho 83544 Nampa, Idaho 83688 Hagerman Hatchery Evaluation Team members:
Kathy Clemens, Idaho Fish Health Center Brian Clifford, Hagerman National Fish Hatchery Ray Jones, Idaho Fishery Resource Office Bryan Kenworthy, Hagerman National Fish Hatchery Adam Leija, Hagerman National Fish Hatchery Chris Starr, Lower Snake River Compensation Plan Carl Steifl, Idaho Department of Fish and Game Jeremy Trimpey, Hagerman National Fish Hatchery Nathan Wiese, Hagerman National Fish Hatchery Eric Willet, Hagerman National Fish Hatchery Steve Yundt, Lower Snake River Compensation Plan
2
Table of Contents
Abstract ........................................................................................................................................... 4 Introduction ..................................................................................................................................... 4
Main Spring Intake Structure ...................................................................................................... 4
Gas Supersaturation at the Hatchery ........................................................................................... 4 Methods........................................................................................................................................... 6 Results ............................................................................................................................................. 6 Discussion ....................................................................................................................................... 7 Additional Monitoring .................................................................................................................... 7
Calendar Year 2009..................................................................................................................... 7 References ....................................................................................................................................... 8 Figures............................................................................................................................................. 9 APPENDIX 1. Gas Supersaturation Calculator ............................................................................ 13 APPENDIX 2. Photos of Main Spring Intake Structure ............................................................... 14 APPENDIX 3. Gas Supersaturation Overview............................................................................. 15 APPENDIX 4. Fish Health Exam Forms...................................................................................... 17
3
Abstract The Hagerman National Fish Hatchery (Hatchery) did not routinely monitor total gas saturation prior to 2007. During October 2007, the Hatchery began rehabilitation construction work on the Main Spring Intake. The construction created a temporary plunge pool that warranted gas saturation monitoring. Total gas saturation reached 103.3% during the construction process and gas bubble disease was noted during routine fish health checks. Post-construction (January 2008 to May 2009), total gas saturation decreased to an average of 101.0%. The decrease was influenced by aquatic vegetation on the Main Spring intake screens. Hatchery monitoring did not find a significant difference between total gas saturation levels among the springs. However the gas saturation variance of Bickel and Riley Spring pools was significantly higher than Main Spring and Brailsford Intake. Gas saturation in Bickel and Riley was significantly affected by aquatic vegetation respiration. The Hatchery will continue total gas saturation monitoring to evaluate seasonal trends.
Introduction Main Spring Intake Structure The Main Spring Pool is the primary water source for the Hagerman National Fish Hatchery (Hatchery) and supplied 65% of available production water (40 cfs) in 2007. Main Spring is composed of overflow from the Brailsford Ditch Intake Structure, Springs 13 and 14 overflow, uncaptured water from Spring 14, and from two unnamed springs. This water arrives to Main Spring Pool via an open channel. The Main Spring Intake Structure is constructed of concrete and contains a control gate, a water level control weir, a screened collection box with an overflow weir, and a stoplog controlled side chamber. The control gate on the south side is used to drain the Main Spring Pool through the Display Pond into Riley Creek during non-routine maintenance activities. Overflow from the collection box is maintained at 1 cfs to support habitat in the Display Pond Channel for the threatened Bliss Rapids Snail,Taylorconcha serpenticola . The collection box supplies water to Hatch 1 and the Rainbow Trout Raceways through a 24-inch pipe. The collection box also supplies water to the stoplog controlled side chamber that is the entrance of a 36-inch pipe that supplies water to the Steelhead Raceways.
Gas Supersaturation at the Hatchery The Hatchery contracted Wickham Pipeline Construction to complete Phase 2 of the Main Spring pipeline construction project during mid-October 2007. The Phase 2 project consisted of removing the overflow ramp, replacing the intake pipe, installing a new overflow ramp, and connecting the new intake pipe to the newly replaced pipeline of the Main Spring intake chamber. To accommodate the project, the Hatchery lowered the water level and removed the trash screens from the Main Spring intake to eliminate water spill into the work area (Appendix 4).
4
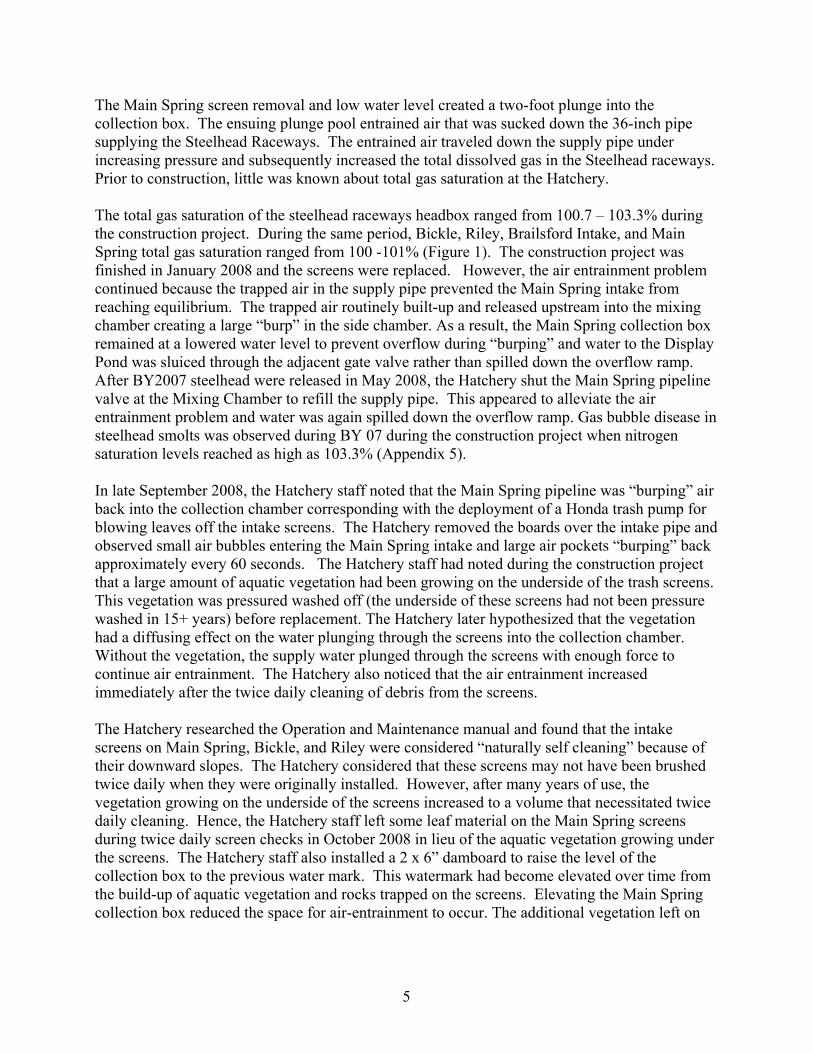
The Main Spring screen removal and low water level created a two-foot plunge into the collection box. The ensuing plunge pool entrained air that was sucked down the 36-inch pipe supplying the Steelhead Raceways. The entrained air traveled down the supply pipe under increasing pressure and subsequently increased the total dissolved gas in the Steelhead raceways. Prior to construction, little was known about total gas saturation at the Hatchery. The total gas saturation of the steelhead raceways headbox ranged from 100.7 – 103.3% during the construction project. During the same period, Bickle, Riley, Brailsford Intake, and Main Spring total gas saturation ranged from 100 -101% (Figure 1). The construction project was finished in January 2008 and the screens were replaced. However, the air entrainment problem continued because the trapped air in the supply pipe prevented the Main Spring intake from reaching equilibrium. The trapped air routinely built-up and released upstream into the mixing chamber creating a large “burp” in the side chamber. As a result, the Main Spring collection box remained at a lowered water level to prevent overflow during “burping” and water to the Display Pond was sluiced through the adjacent gate valve rather than spilled down the overflow ramp. After BY2007 steelhead were released in May 2008, the Hatchery shut the Main Spring pipeline valve at the Mixing Chamber to refill the supply pipe. This appeared to alleviate the air entrainment problem and water was again spilled down the overflow ramp. Gas bubble disease in steelhead smolts was observed during BY 07 during the construction project when nitrogen saturation levels reached as high as 103.3% (Appendix 5). In late September 2008, the Hatchery staff noted that the Main Spring pipeline was “burping” air back into the collection chamber corresponding with the deployment of a Honda trash pump for blowing leaves off the intake screens. The Hatchery removed the boards over the intake pipe and observed small air bubbles entering the Main Spring intake and large air pockets “burping” back approximately every 60 seconds. The Hatchery staff had noted during the construction project that a large amount of aquatic vegetation had been growing on the underside of the trash screens. This vegetation was pressured washed off (the underside of these screens had not been pressure washed in 15+ years) before replacement. The Hatchery later hypothesized that the vegetation had a diffusing effect on the water plunging through the screens into the collection chamber. Without the vegetation, the supply water plunged through the screens with enough force to continue air entrainment. The Hatchery also noticed that the air entrainment increased immediately after the twice daily cleaning of debris from the screens. The Hatchery researched the Operation and Maintenance manual and found that the intake screens on Main Spring, Bickle, and Riley were considered “naturally self cleaning” because of their downward slopes. The Hatchery considered that these screens may not have been brushed twice daily when they were originally installed. However, after many years of use, the vegetation growing on the underside of the screens increased to a volume that necessitated twice daily cleaning. Hence, the Hatchery staff left some leaf material on the Main Spring screens during twice daily screen checks in October 2008 in lieu of the aquatic vegetation growing under the screens. The Hatchery staff also installed a 2 x 6” damboard to raise the level of the collection box to the previous water mark. This watermark had become elevated over time from the build-up of aquatic vegetation and rocks trapped on the screens. Elevating the Main Spring collection box reduced the space for air-entrainment to occur. The additional vegetation left on
5
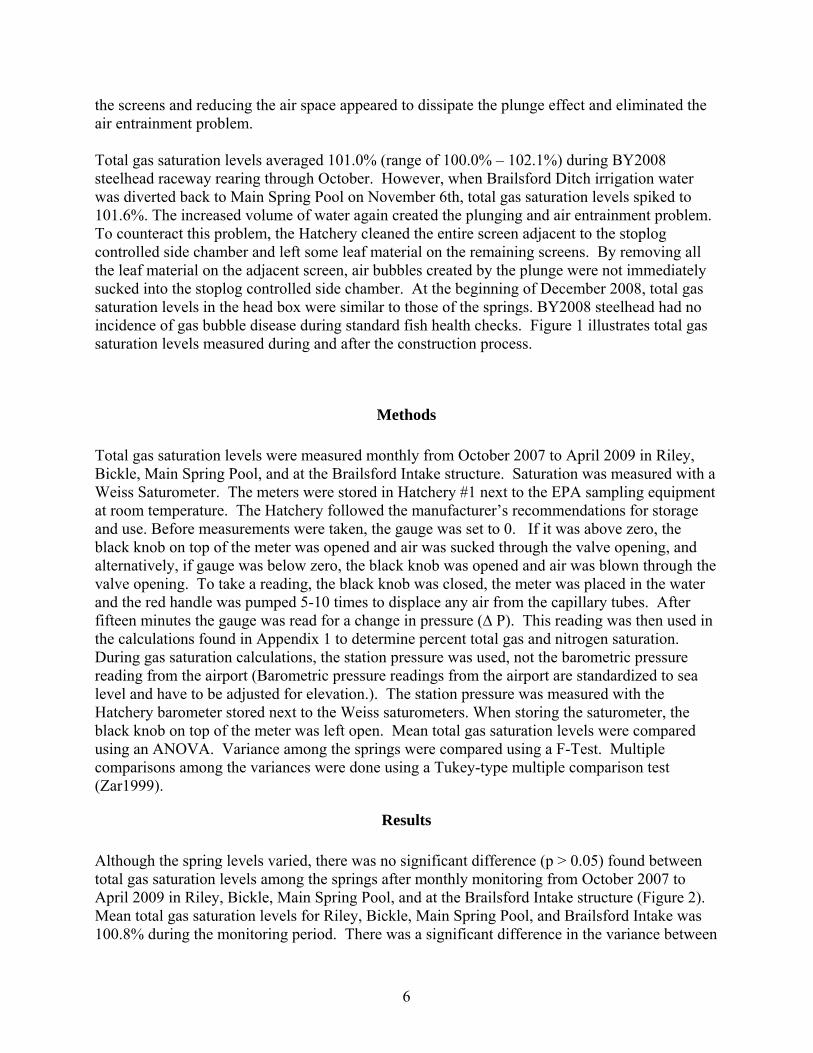
the screens and reducing the air space appeared to dissipate the plunge effect and eliminated the air entrainment problem. Total gas saturation levels averaged 101.0% (range of 100.0% – 102.1%) during BY2008 steelhead raceway rearing through October. However, when Brailsford Ditch irrigation water was diverted back to Main Spring Pool on November 6th, total gas saturation levels spiked to 101.6%. The increased volume of water again created the plunging and air entrainment problem. To counteract this problem, the Hatchery cleaned the entire screen adjacent to the stoplog controlled side chamber and left some leaf material on the remaining screens. By removing all the leaf material on the adjacent screen, air bubbles created by the plunge were not immediately sucked into the stoplog controlled side chamber. At the beginning of December 2008, total gas saturation levels in the head box were similar to those of the springs. BY2008 steelhead had no incidence of gas bubble disease during standard fish health checks. Figure 1 illustrates total gas saturation levels measured during and after the construction process.
Methods Total gas saturation levels were measured monthly from October 2007 to April 2009 in Riley, Bickle, Main Spring Pool, and at the Brailsford Intake structure. Saturation was measured with a Weiss Saturometer. The meters were stored in Hatchery #1 next to the EPA sampling equipment at room temperature. The Hatchery followed the manufacturer’s recommendations for storage and use. Before measurements were taken, the gauge was set to 0. If it was above zero, the black knob on top of the meter was opened and air was sucked through the valve opening, and alternatively, if gauge was below zero, the black knob was opened and air was blown through the valve opening. To take a reading, the black knob was closed, the meter was placed in the water and the red handle was pumped 5-10 times to displace any air from the capillary tubes. After fifteen minutes the gauge was read for a change in pressure (∆ P). This reading was then used in the calculations found in Appendix 1 to determine percent total gas and nitrogen saturation. During gas saturation calculations, the station pressure was used, not the barometric pressure reading from the airport (Barometric pressure readings from the airport are standardized to sea level and have to be adjusted for elevation.). The station pressure was measured with the Hatchery barometer stored next to the Weiss saturometers. When storing the saturometer, the black knob on top of the meter was left open. Mean total gas saturation levels were compared using an ANOVA. Variance among the springs were compared using a F-Test. Multiple comparisons among the variances were done using a Tukey-type multiple comparison test (Zar1999).
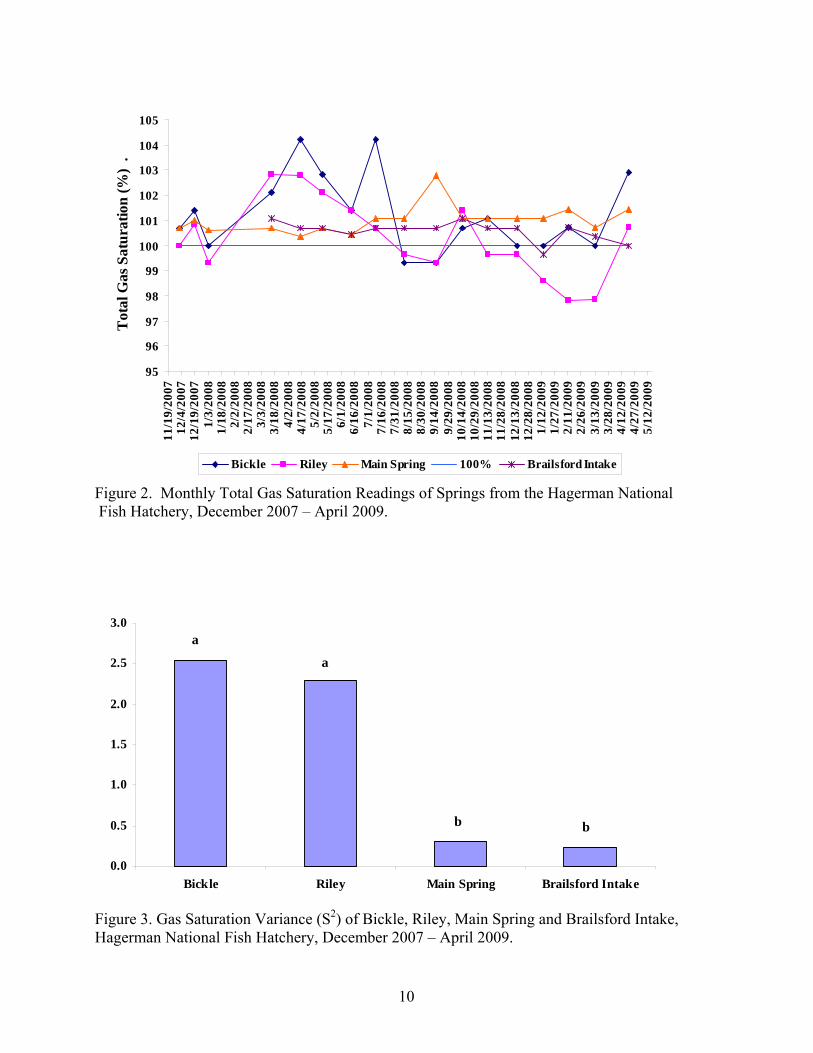
Results Although the spring levels varied, there was no significant difference (p > 0.05) found between total gas saturation levels among the springs after monthly monitoring from October 2007 to April 2009 in Riley, Bickle, Main Spring Pool, and at the Brailsford Intake structure (Figure 2). Mean total gas saturation levels for Riley, Bickle, Main Spring Pool, and Brailsford Intake was 100.8% during the monitoring period. There was a significant difference in the variance between
6
springs (Figure 3). Bickle and Riley had higher variances compared to Mainspring Pool and Brailsford Intake.
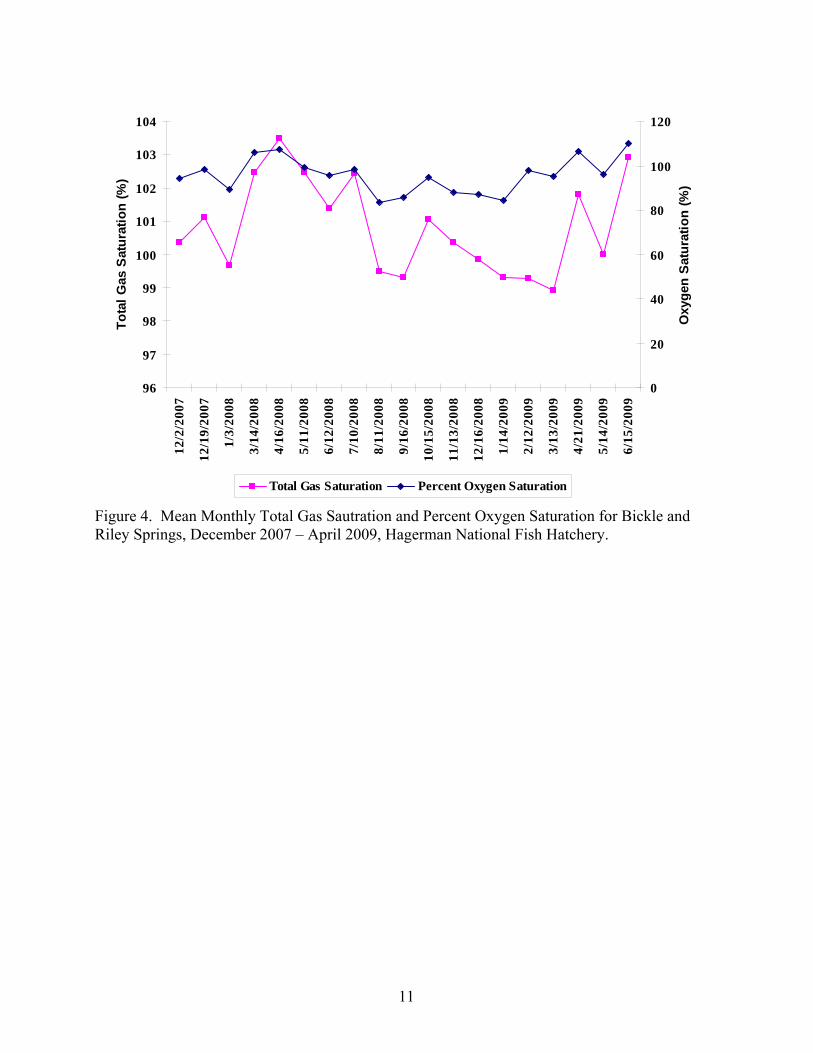
Discussion Spring water used for steelhead production at the Hatchery was supersaturated with dissolved gases at various levels. The highest levels of total gas saturation observed were in Bickle Lake at 104.2% and Riley Lake at 102.8%. Total gas saturation levels measured in Bickle and Riley also fluctuated more than those measured at Brailsford Intake and Main Spring. Bickle and Riley Lakes may have higher saturation levels and more fluctuation because they have relatively large lacustrine environments that are effected more by respiration of aquatic vegetation (Figure 4). Brailsford Intake water averaged 100.6% in total gas saturation before tumbling down to the Main Spring Pool where the average increased to 101.0%. These readings were relatively consistent throughout the monitoring period. These observations suggest that some air entrainment was occurring where the Brailford Intake plunged into the Main Spring Pool and the resulting supersaturation was not allowed to dissipate before it rapidly flowed to the Mixing Chamber. Gas bubble disease was noted in BY2007 when total gas saturation conditions peaked at 103.3% during Main Spring construction. This result was consistent Wedemeyer (1996) recommendations to maintain gas saturation levels below 103% (Appendix 3). BY2008 did not have any incidences of gas bubble disease and average total gas saturation conditions were 101.0%. The Hatchery was able to correct supersaturation conditions by increasing the vegetation load on the screens and raising the water level of the Main Spring collection chamber. The Hatchery will continue to monitor total gas saturation in the springs and steelhead raceways. Any future maintenance on the Main Spring collection chamber should minimize disturbance to vegetation growing on the underside of the debris screens. This vegetation appears to act as a diffuser to lower air entrainment, reduce the plunge pool effect, and ultimately reduce total gas saturation.
Additional Monitoring
Calendar Year 2009 Total gas saturation levels in the top deck head box of the steelhead raceway mirrored total gas saturation levels of Main Spring (Figure 5). Top deck total gas saturation levels ranged from 100.0 – 102.2%. Bickle and Riley total gas saturation levels generally ran lower than that of Main Spring. These readings are consistent with those observed in BY2008 after dealing with problems caused by air entrapment and aquatic vegetation in intake pipes and screens.
7
References Bouck, Gerald. 1984. Annual variation of gas supersaturation in four spring-fed Oregon streams.
The Progressive Fish Culturist 46 (2): 139-140. Boyd, Claude and Craig Tucker. 1998. Pond Aquaculture Water Quality Management. Kluwer
Academic Publishers, Norwell, Massachusetts. Dawley, Earl and Wesley Ebel. 1975. Effects of Various Concentrations of Dissolved
Atmospheric Gas on Juvenile Chinook Salmon and Steelhead Trout. Fisheries Bulletin 73(4): 787-796.
Krise, William. 1993. Effects of One-Year Exposures to Gas Supersaturation. The Progressive
Fish Culturist:55(3):169-176. Krise, Wlliam and Reginald Smith. 1993.Eye Abnormalities of Lake Trout Exposed to Gas
Supersaturation. The Progressive Fish Culturist:55(3):177-179. Krise, Wiliam, James Meade, and Reginald Smith. 1990. Effects of Feeding Rate and Gas
Supersaturation on Survival and Growth of Lake Trout. The Progressive Fish Culturist:52(1):45-50.
Piper, Robert G., Ivan B. McElwain, Leo E. Orme, Joseph P. McCraren, Laurie G. Fowler, and
John R. Leonard. 1982. Fish Hatchery Management. United States Department of the Interior Fish and Wildlife Service Washington, D.C.
Wedemeyer, Gary. 1996. Physiology of Fish in Intensive Culture Systems. Chapman & Hall,
New York, New York. Wedemeyer, Gary. 2001. Fish Hatchery Management, Second Edition. American Fisheries
Society, Bethesda, Maryland. Zar, Jerrold. 1999. Biostatistical Analysis, Fourth Edition. Prentice Hall, Upper Saddle River,
New Jersey.
8
Figures
95
96
97
98
99
100
101
102
103
104
105
11/1
9/20
0712
/4/2
007
12/1
9/20
071/
3/20
081/
18/2
008
2/2/
2008
2/17
/200
83/
3/20
083/
18/2
008
4/2/
2008
4/17
/200
85/
2/20
085/
17/2
008
6/1/
2008
6/16
/200
87/
1/20
087/
16/2
008
7/31
/200
88/
15/2
008
8/30
/200
89/
14/2
008
9/29
/200
810
/14/
2008
10/2
9/20
0811
/13/
2008
11/2
8/20
0812
/13/
2008
12/2
8/20
081/
12/2
009
1/27
/200
92/
11/2
009
2/26
/200
93/
13/2
009
3/28
/200
94/
12/2
009
4/27
/200
95/
12/2
009
Tot
al G
as S
atur
atio
n (%
)
Head Box of Top Deck Bickle, Riley Main Spring Average (Monthly) 100%
A.B. C. D. E.
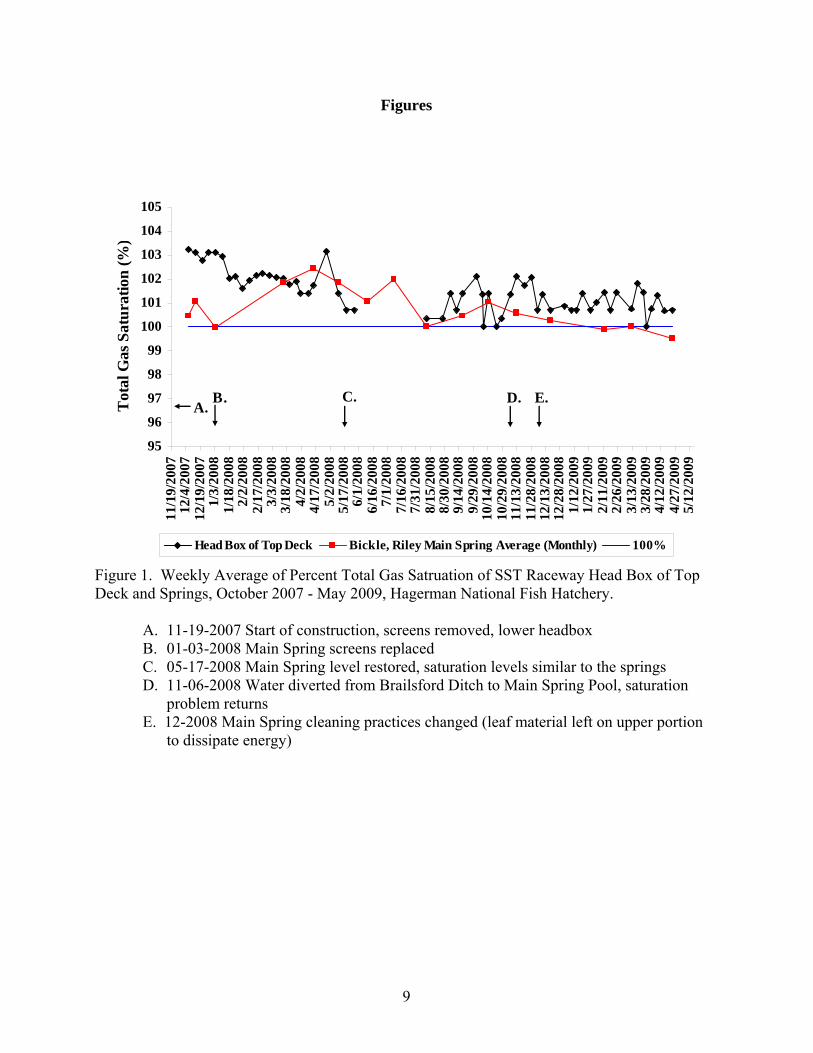
Figure 1. Weekly Average of Percent Total Gas Satruation of SST Raceway Head Box of Top Deck and Springs, October 2007 - May 2009, Hagerman National Fish Hatchery.
A. 11-19-2007 Start of construction, screens removed, lower headbox B. 01-03-2008 Main Spring screens replaced C. 05-17-2008 Main Spring level restored, saturation levels similar to the springs D. 11-06-2008 Water diverted from Brailsford Ditch to Main Spring Pool, saturation
problem returns E. 12-2008 Main Spring cleaning practices changed (leaf material left on upper portion
to dissipate energy)
9
95
96
97
98
99
100
101
102
103
104
105
11/1
9/20
0712
/4/2
007
12/1
9/20
071/
3/20
081/
18/2
008
2/2/
2008
2/17
/200
83/
3/20
083/
18/2
008
4/2/
2008
4/17
/200
85/
2/20
085/
17/2
008
6/1/
2008
6/16
/200
87/
1/20
087/
16/2
008
7/31
/200
88/
15/2
008
8/30
/200
89/
14/2
008
9/29
/200
810
/14/
2008
10/2
9/20
0811
/13/
2008
11/2
8/20
0812
/13/
2008
12/2
8/20
081/
12/2
009
1/27
/200
92/
11/2
009
2/26
/200
93/
13/2
009
3/28
/200
94/
12/2
009
4/27
/200
95/
12/2
009
Tot
al G
as S
atur
atio
n (%
) .
Bickle Riley Main Spring 100% Brailsford Intake
Figure 2. Monthly Total Gas Saturation Readings of Springs from the Hagerman National Fish Hatchery, December 2007 – April 2009.
0.0
0.5
1.0
1.5
2.0
2.5
3.0
Bickle Riley Main Spring Brailsford Intake
b
a
b
a
Figure 3. Gas Saturation Variance (S2) of Bickle, Riley, Main Spring and Brailsford Intake, Hagerman National Fish Hatchery, December 2007 – April 2009.
10
96
97
98
99
100
101
102
103
104
12/2
/200
7
12/1
9/20
07
1/3/
2008
3/14
/200
8
4/16
/200
8
5/11
/200
8
6/12
/200
8
7/10
/200
8
8/11
/200
8
9/16
/200
8
10/1
5/20
08
11/1
3/20
08
12/1
6/20
08
1/14
/200
9
2/12
/200
9
3/13
/200
9
4/21
/200
9
5/14
/200
9
6/15
/200
9
Tota
l Gas
Sat
urat
ion
(%)
0
20
40
60
80
100
120
Oxy
gen
Satu
ratio
n (%
)
Total Gas Saturation Percent Oxygen Saturation
Figure 4. Mean Monthly Total Gas Sautration and Percent Oxygen Saturation for Bickle and Riley Springs, December 2007 – April 2009, Hagerman National Fish Hatchery.
11

9596979899
100101102103104105
12-F
eb
27-F
eb
14-M
ar
29-M
ar
13-A
pr
28-A
pr
13-M
ay
28-M
ay
12-J
un
27-J
un
12-J
ul
27-J
ul
11-A
ug
26-A
ug
10-S
ep
25-S
ep
10-O
ct
25-O
ct
9-N
ov
24-N
ov
9-D
ec
24-D
ec
Tot
al G
as S
atur
atio
n (%
) .
Top Deck Main Spring Bickle, Riley, Brailsford Intake Average 100%
Figure 5. Total Gas Saturation Levels Observed at the Hagerman National Fish Hatchery, 2009.
12
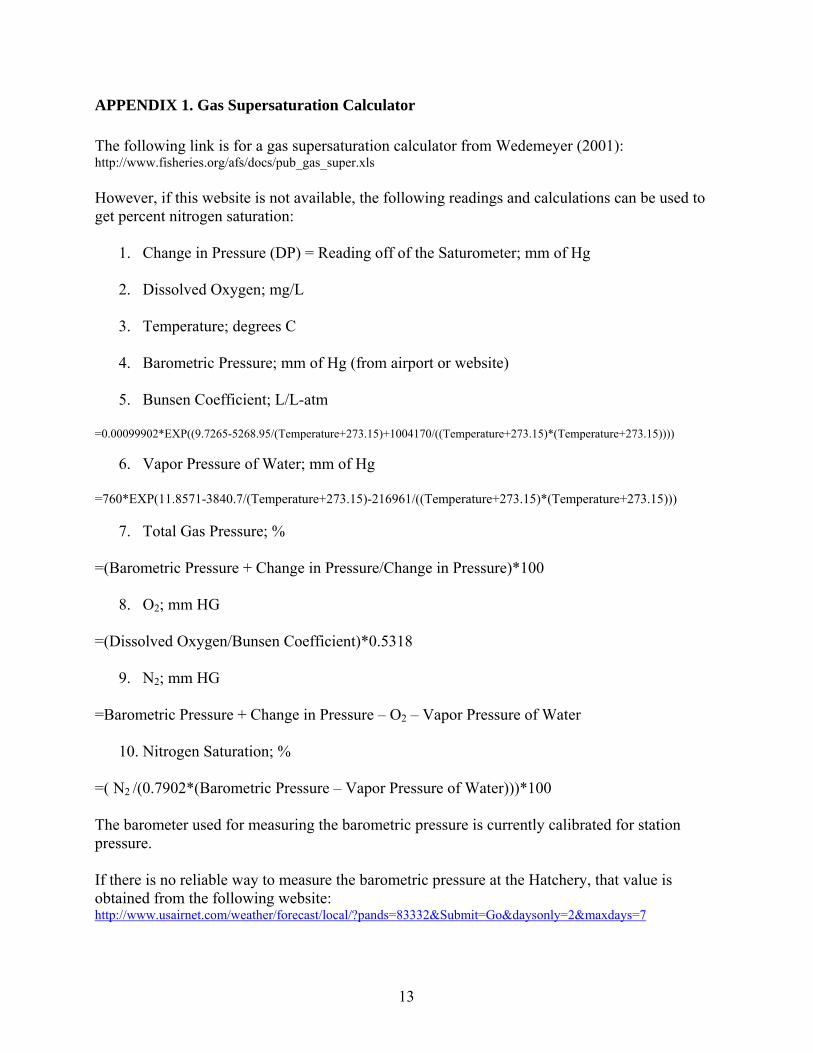
APPENDIX 1. Gas Supersaturation Calculator The following link is for a gas supersaturation calculator from Wedemeyer (2001): http://www.fisheries.org/afs/docs/pub_gas_super.xls However, if this website is not available, the following readings and calculations can be used to get percent nitrogen saturation:
1. Change in Pressure (DP) = Reading off of the Saturometer; mm of Hg 2. Dissolved Oxygen; mg/L
3. Temperature; degrees C
4. Barometric Pressure; mm of Hg (from airport or website)
5. Bunsen Coefficient; L/L-atm
=0.00099902*EXP((9.7265-5268.95/(Temperature+273.15)+1004170/((Temperature+273.15)*(Temperature+273.15))))
6. Vapor Pressure of Water; mm of Hg
=760*EXP(11.8571-3840.7/(Temperature+273.15)-216961/((Temperature+273.15)*(Temperature+273.15)))
7. Total Gas Pressure; %
=(Barometric Pressure + Change in Pressure/Change in Pressure)*100
8. O2; mm HG
=(Dissolved Oxygen/Bunsen Coefficient)*0.5318
9. N2; mm HG
=Barometric Pressure + Change in Pressure – O2 – Vapor Pressure of Water
10. Nitrogen Saturation; %
=( N2 /(0.7902*(Barometric Pressure – Vapor Pressure of Water)))*100
The barometer used for measuring the barometric pressure is currently calibrated for station pressure. If there is no reliable way to measure the barometric pressure at the Hatchery, that value is obtained from the following website: http://www.usairnet.com/weather/forecast/local/?pands=83332&Submit=Go&daysonly=2&maxdays=7
13
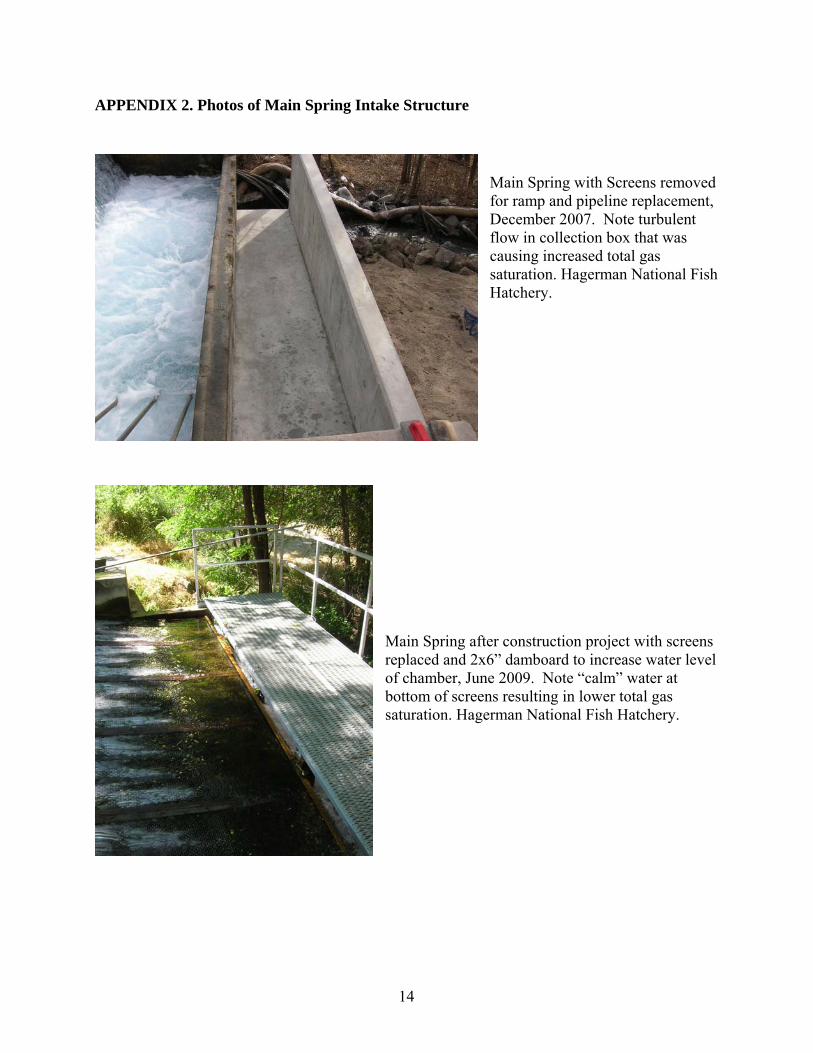
APPENDIX 2. Photos of Main Spring Intake Structure
Main Spring with Screens removed for ramp and pipeline replacement, December 2007. Note turbulent flow in collection box that was causing increased total gas saturation. Hagerman National Fish Hatchery.
Main Spring after construction project with screens replaced and 2x6” damboard to increase water level of chamber, June 2009. Note “calm” water at bottom of screens resulting in lower total gas saturation. Hagerman National Fish Hatchery.
14
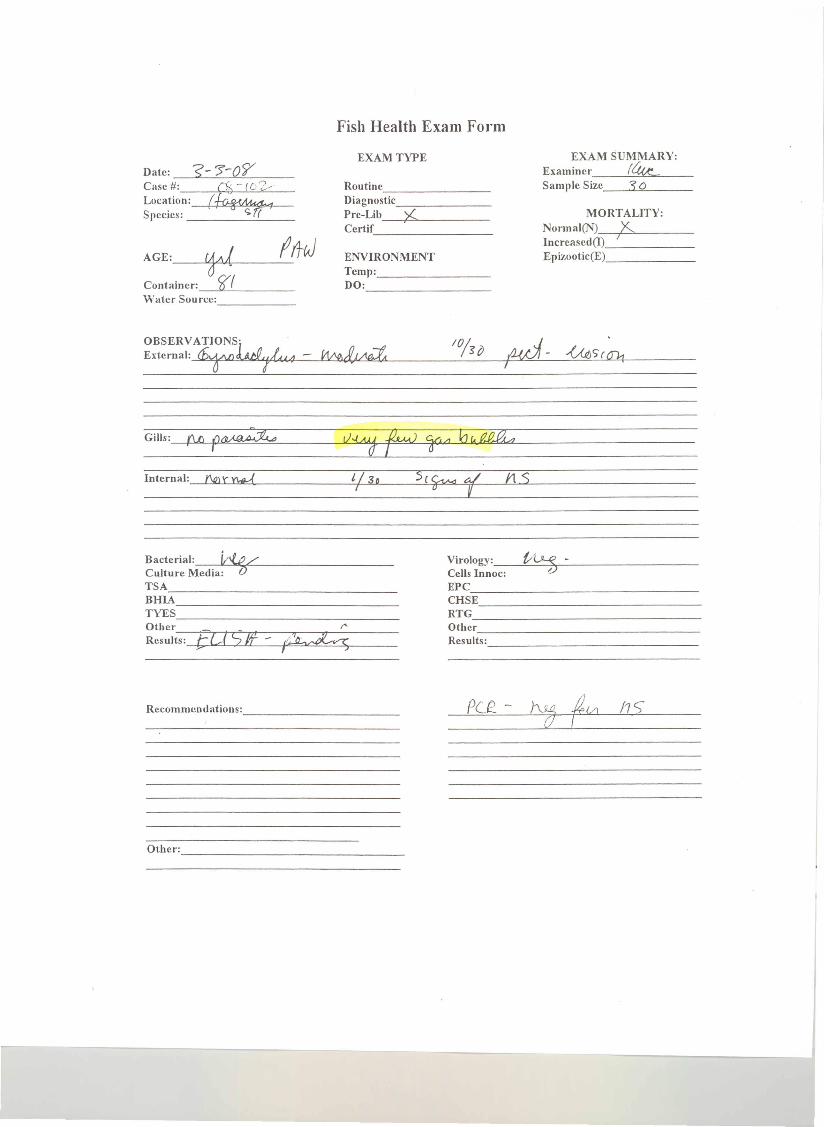
APPENDIX 3. Gas Supersaturation Overview Gas supersaturation is defined as excess dissolved gas beyond equilibrium. Gas supersaturation can occur in natural waters as well as aquaculture settings. Boyd and Tucker (1998) described six processes that promote gas supersaturation:
1.) Heating 2.) Mixing Waters of Different Temperatures 3.) Ice Formation 4.) Air Entrainment 5.) Photosynthesis 6.) Changes in Barometric Pressure
Percent total gas pressure can be calculated as:
TGP(%) = (BP +∆ P)/BP X 100 where: TGP = percent of total gas pressure BP = local barometric pressure ∆ P = difference between total dissolved gas pressure and local barometric pressure Nitrogen saturation problems occur when total gas saturation is above 100% (Piper et al. 1982). Gas bubble disease may occur at 102% nitrogen saturation and trout fingerlings cannot tolerate nitrogen saturation in excess of 105% for five day Gas bubble disease can occur when ∆ P is positive, but generally, anything more than 110% is likely to cause some degree of gas bubble disease (Wedemeyer 1996). Wedemeyer (1996) also explains that if the ∆ P is zero or less, bubbles cannot form, even if one of the individual dissolved gases is over 100%. The ∆ P values vary greatly in nature ranging from -100 to 300 mm of Hg (Boyd and Tucker 1998). Seasonal variation in ∆ P has been measured with Weiss Saturometers in streams in Oregon with the lowest readings observed in November, while higher readings were obtained in August (Bouck 1984). Gas supersaturation can pose health risks to aquatic species. Krise and Smith (1993) found that lake trout that were exposed to gas supersaturation at ∆ P 17 for one year increased the incident of corneal swelling and gas supersaturation of ∆ P 4 can cause corneal rupture. Krise et al. (1990) found that underfed fish consistently showed more injuries as gas supersaturation increased, and fish under stress from gas supersaturation should be fed more frequently to maintain normal weight gain. The ∆ P should be near 0 for optimal growth in lake trout and a ∆ P 17 should not be exceeded (Krise 1993). The ability of fish to detect supersaturation varies with species, level of saturation, and temperature. Anadromous steelhead do not avoid highly supersaturated water, therefore, saturation levels should not be allowed to exceed 103% to protect eggs, fry, and fingerlings, and 105% to protect fish up to smolt size (Wedemeyer 1996). Dawley and Ebel (1975) found that
15

steelhead exhibit significant mortality at 111% total gas supersaturation (115% nitrogen and argon saturation). They also found that sub lethal exposure effects growth and blood chemistry and the first signs of gas bubble disease is the occurrence of bubbles in the lateral line. Steelhead effected by gas supersaturation that are returned to 100% saturated water recover with in 15 days of exposure to the supersaturated water (Dawley and Ebel 1975). Boyd and Tucker (1998) describe clinical signs of chronic gas bubble trauma (delta P values of 25 -75 mm Hg on a continuous basis) as extravascular emboli, hyperinflation or rupture of the swim bladder, and low-level mortality over extended periods of time. Mortality is usually related to a secondary stress induced infection. The delta P value averaged 22.2 mm Hg during the construction project (11-19-07 to 1-03-08) and 9.8 mm Hg during BY 08. Life stage of the fish also affects tolerance to gas supersaturation. Larvae and fry are most sensitive followed by adults, which are somewhat more tolerant than fry, followed by eggs which are very tolerant.
16

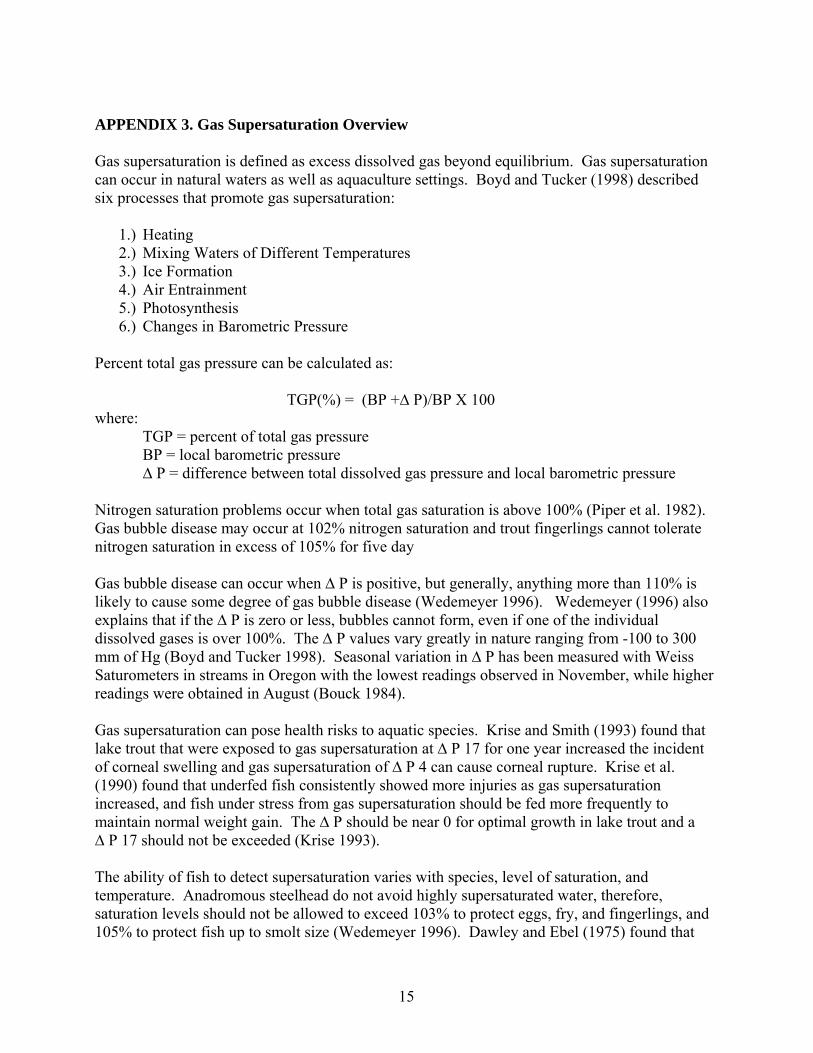
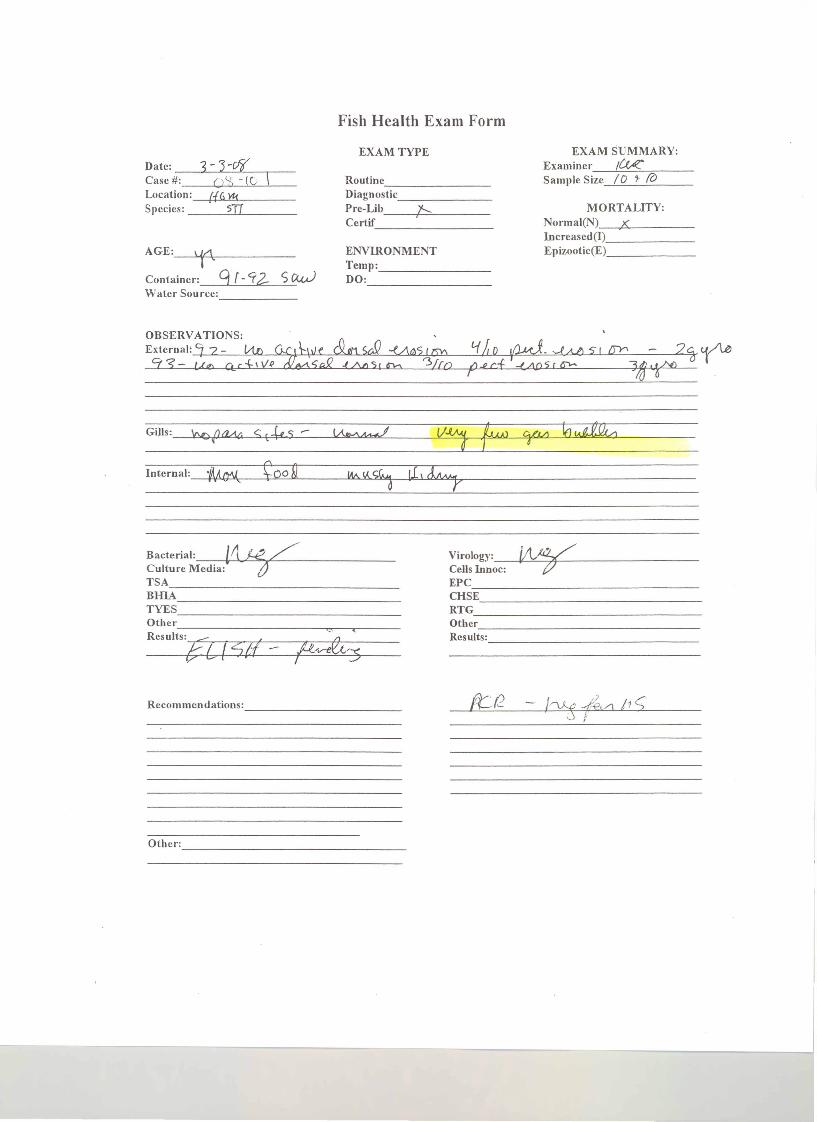
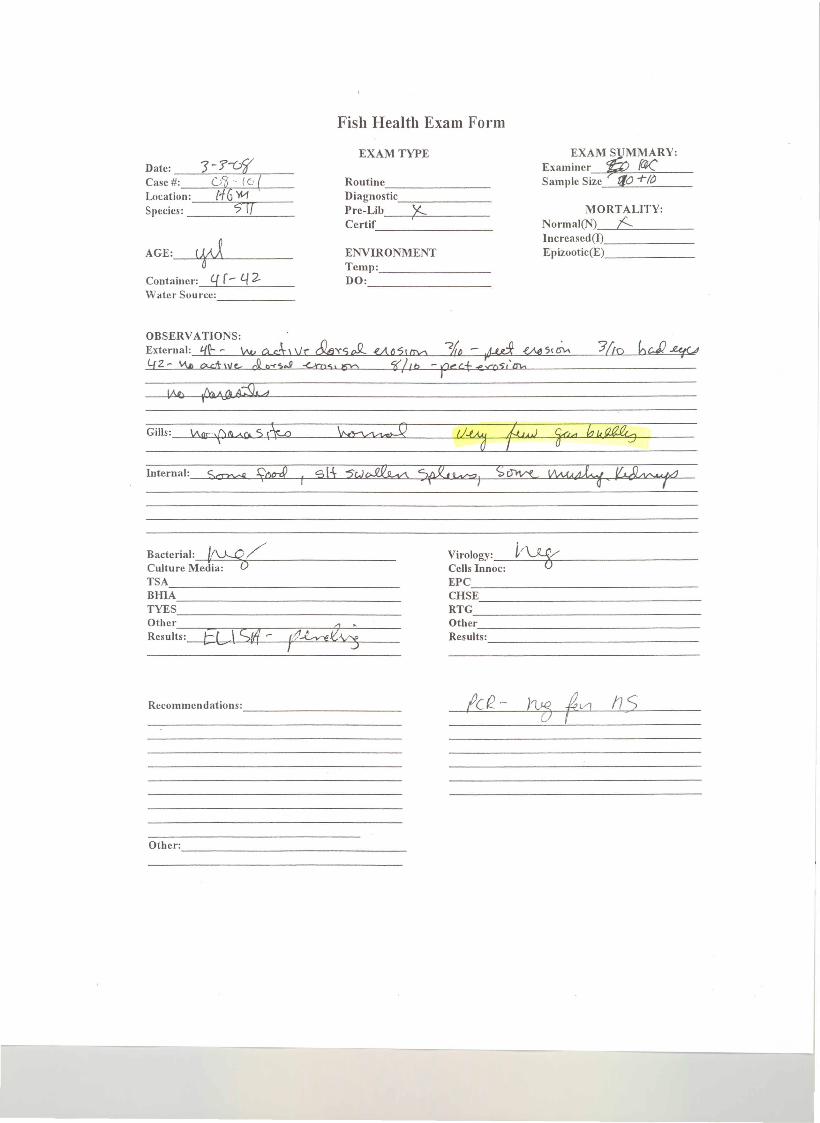
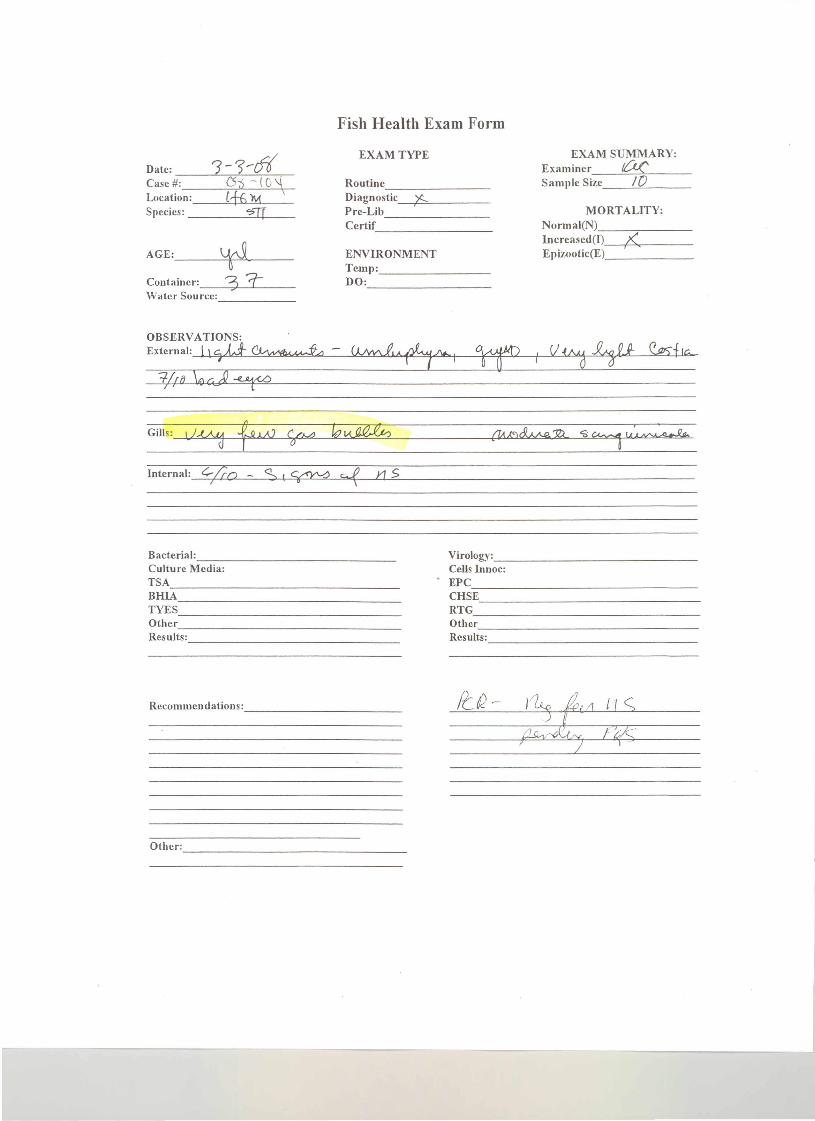
APPENDIX 4. Fish Health Exam Forms
17
EXAM SUMMARY:Examiner 1CVtZ:Sample Size 10 .,. (0
Date:Case #:Location:Species:
3 - }-07o'J) - (C'
({G'r'ksTI
Routine _Diagnostic _Pre-Lib y.......
I
Certif _
AGE:4~c'_----Container: 9 r - 9k SC4...J""'ater Source:
ENVIRONMENTTemp: _DO: _
MORTALITY:Normal(N)_ .....•Ku..- _lncreased(l) _Epizootic(E) _
Gills: ~1J(l.M <; (~5 --- ~&<+L iI?f+6A) 1,(M kJVUQ(;;
Internal: 'Mty'J.,. ~QOa 1MV,sv, IIHI;;::'r
Bacterial: [1HZ../Culture Media: tJTSA _BHlA _TYES _Othcr _Results: --- , '"fJ- •tl f sa - rAriX»:;
Viro)og)': ~Cells !nooc: ~EPC _CHSE _RTG _Other _Results: _
Datc:Casc #:Location:Specics:
EXAM ~MMARV:Examincr FU::Samplc Sizc f!O -t-IoRoutinc _
Diagnostic _Prc-Lib K,Ccrtif _
(td ENVIRONMENTTcmp: _DO: _
MORTALITV:Normal(N),_.J.f..- _lncrcascdCD _Epizootic(E) _
Containcr: q (- 4 z.Water Source: _
OBSERVATIONS: 'External: qt"- ~ \Au CL&tl\/r &YsJ2. .eA,051try1 1{il ~ A..t.d <A¢'}tln-\
42~ '1A> O<.Gt\\Ik ellQ-<'s,JI <KoSI t5Y' -(lib -f"e.t<~ay,
IA() {».~ s:9. d
Jo4 bu~
lMMt1Li<W~
Bacterial: If\.h.O /'Culture Mcdia: 0TSA _BHlA _TYES _OtherRcsult--s:-E~L--\--S-tlf-- -(/)--~-e--'\N--'--
I --:J
I/~Virology: __ /l'--~_.L_ _Cells Innoc:EPC _CHSE _RTG _Othcr _Results: _
AGE:~tt-cJ
Containcr: __ [_( _\\·'at.cr Sourcc: _
Routine _Diagnostic _Pre-Lib __ X-.-...=- _Certif _
ExamincrSample Size
EXAM SUMMARY:(4«.-30
Datc:Casc #:Location:Spccics:
ENVIRONMENTTcmp: _DO: _
MORTALITY:Normal(N) K~----Increascd(l)_! _Epizootic(E) _
OBSERVATIONS' .External: <Ep~t&~4 - 1i1t'0~
Gills: (\.() p~
Bacterial: kv./Culture Media: -0TSA _BHlA _TYES _Ot.hcrResults:
(,
f[;ISlf- I~
Virology: {/U--fj. -Cells lnnoc: ----uEPC _CHSE _RTG _Other _Results: _
Routine _Diagnostic )(..
I
Pre-Lib _Certif _
ExaminerSample Size
EXAM SUMMARY:~/0
Date:Case #:Location:Species:
AGE: ~
Container: '3r\Vater Sourcc: _
ENVIRONMENTTemp: ~DO: _
MORTALITY:Normal(N) _Increased(I) X
--i~<----
Epizootic(E) _
Bacterial: _Culture Media:TSA _BlllA _TYES _Other _Results: _
Virology: _Cel1s Innoc:EPC _CHSE _RTG _Other _Results: _
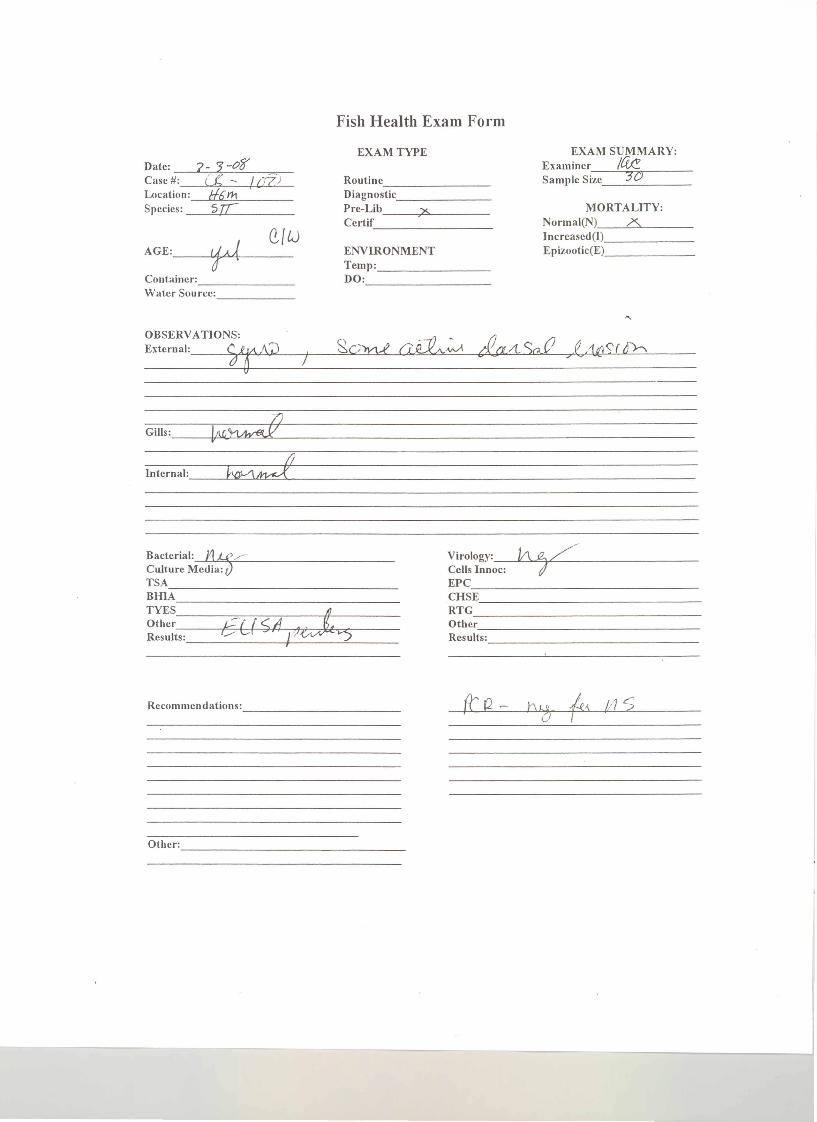
EXAM SUMMARY:Examincr 1t:iJ!Samplc Sizc__ '3_0 _
Datc:Case #:Location:Specics:
7 - '3 -08"it: ~ 1(77)
1i6111 'sTC
Routinc _Diagnostic _Prc-Lib x,Ccrtif _
ENVIRONMENTTemp: _DO: _
MORTALITY:Normal(N), __ -'-,x,,-"- _lncreasedOQ _Epizootic(E) _
Container: _Water Sourcc: _
OBSERVA TIONS:External: ~rA '0
Gi1ls:__ ~Njs;wJ2
k\QV\2
Bacterial: J1 J...t:/Culture Media: tJTSA _BHlA _
TYES ~~:~~~ts:6L( S 11 l ;1.&./;;;-"'5----,
Virology: 1A J;//Cclls lnnoc: tJEPC _CHSE _RTG _Other ---------------Results: _