overview of education issues - lao.ca.gov · special education teacher shortage local solution...
TRANSCRIPT
Presented to:Budget Conference CommitteeHon. Philip Ting, Chair
Overview of Education Issues
L E G I S L A T I V E A N A L Y S T ’ S O F F I C E
1L E G I S L A T I V E A N A L Y S T ’ S O F F I C E
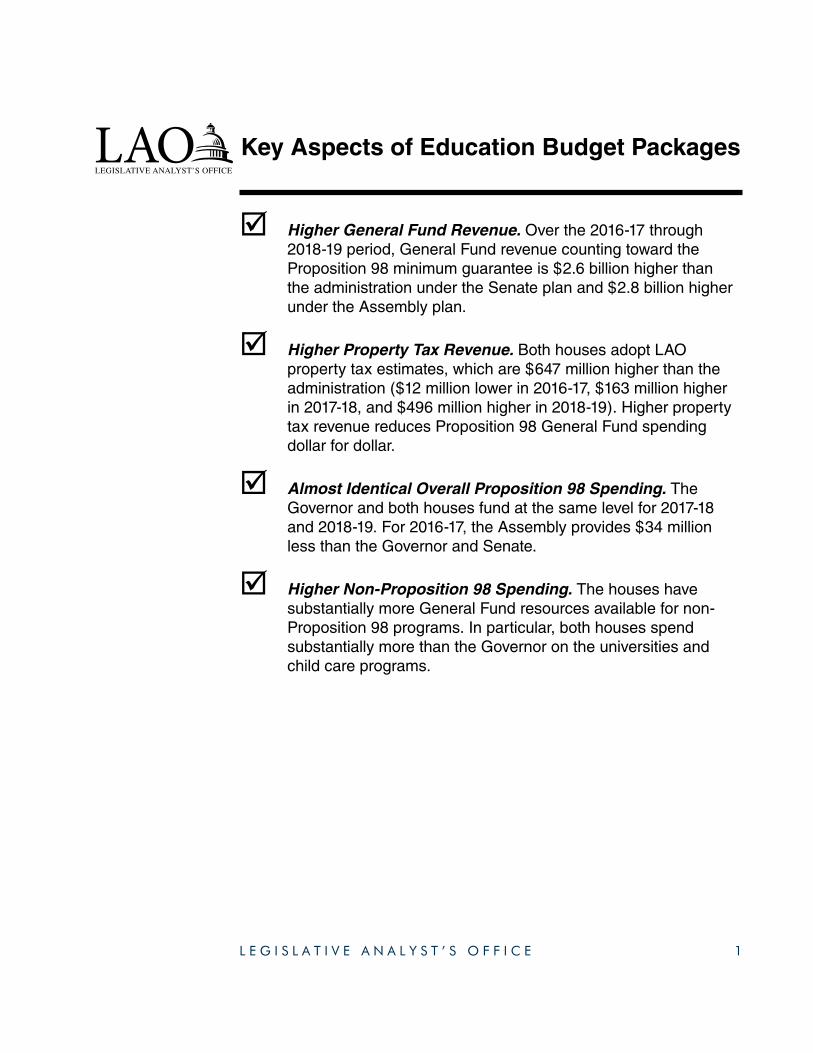
; Higher General Fund Revenue. Over the 2016-17 through 2018-19 period, General Fund revenue counting toward the Proposition 98 minimum guarantee is $2.6 billion higher than the administration under the Senate plan and $2.8 billion higher under the Assembly plan.
; Higher Property Tax Revenue. Both houses adopt LAO property tax estimates, which are $647 million higher than the administration ($12 million lower in 2016-17, $163 million higher in 2017-18, and $496 million higher in 2018-19). Higher property tax revenue reduces Proposition 98 General Fund spending dollar for dollar.
; Almost Identical Overall Proposition 98 Spending. The Governor and both houses fund at the same level for 2017-18 and 2018-19. For 2016-17, the Assembly provides $34 million less than the Governor and Senate.
; Higher Non-Proposition 98 Spending. The houses have substantially more General Fund resources available for non-Proposition 98 programs. In particular, both houses spend substantially more than the Governor on the universities and child care programs.
Key Aspects of Education Budget Packages
2L E G I S L A T I V E A N A L Y S T ’ S O F F I C E
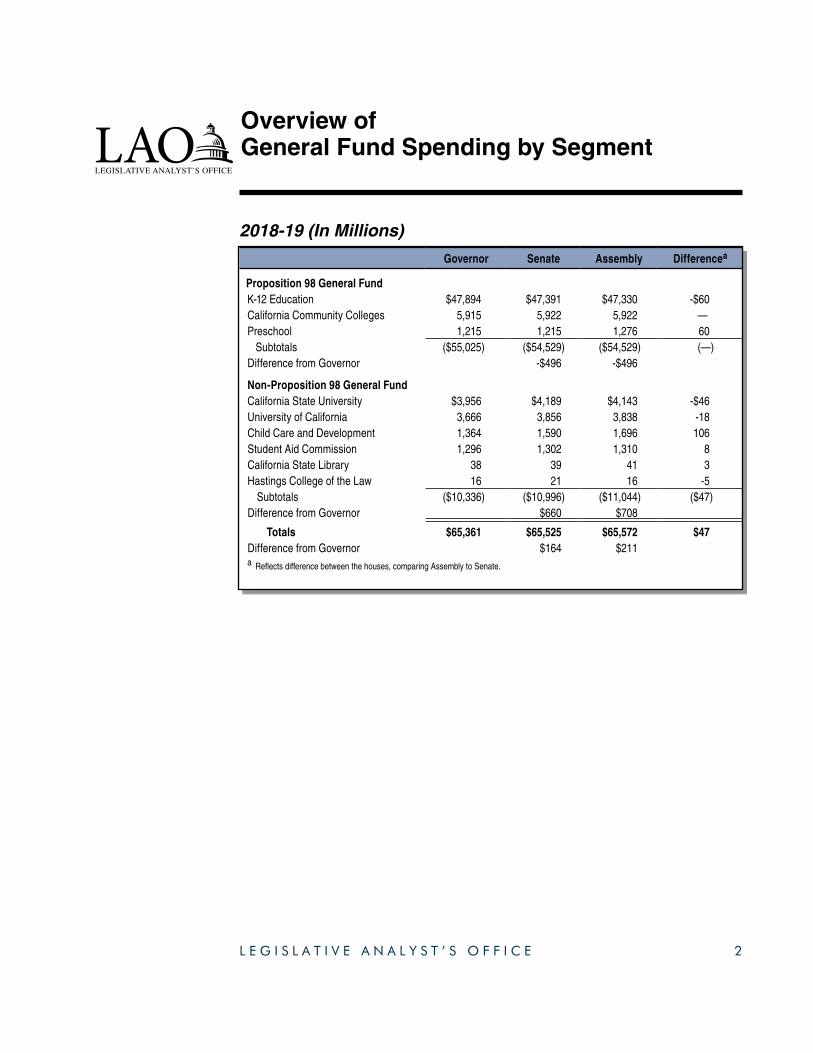
Overview of General Fund Spending by Segment
2018-19 (In Millions)
Governor Senate Assembly Differencea
Proposition 98 General FundK-12 Education $47,894 $47,391 $47,330 -$60California Community Colleges 5,915 5,922 5,922 —Preschool 1,215 1,215 1,276 60 Subtotals ($55,025) ($54,529) ($54,529) (—)Difference from Governor -$496 -$496
Non-Proposition 98 General Fund California State University $3,956 $4,189 $4,143 -$46University of California 3,666 3,856 3,838 -18Child Care and Development 1,364 1,590 1,696 106Student Aid Commission 1,296 1,302 1,310 8California State Library 38 39 41 3Hastings College of the Law 16 21 16 -5 Subtotals ($10,336) ($10,996) ($11,044) ($47)Difference from Governor $660 $708
Totals $65,361 $65,525 $65,572 $47Difference from Governor $164 $211a Reflects difference between the houses, comparing Assembly to Senate.
3L E G I S L A T I V E A N A L Y S T ’ S O F F I C E
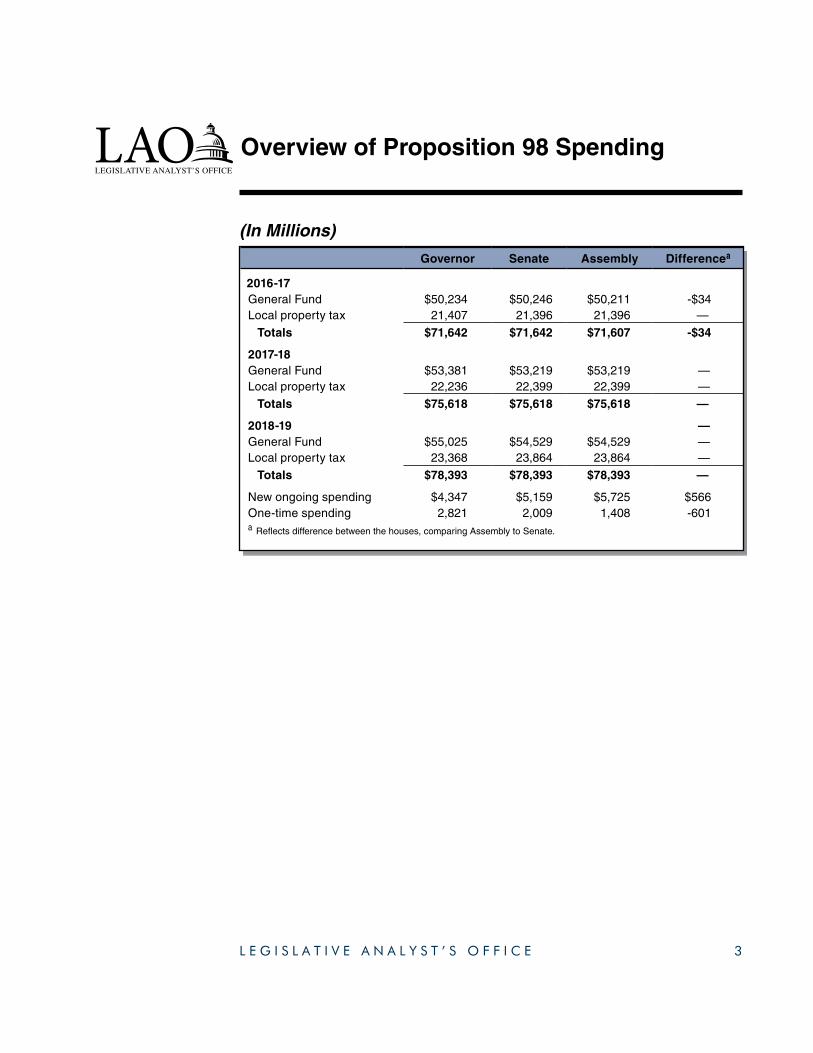
(In Millions)
Overview of Proposition 98 Spending
Governor Senate Assembly Differencea
2016-17General Fund $50,234 $50,246 $50,211 -$34Local property tax 21,407 21,396 21,396 —
Totals $71,642 $71,642 $71,607 -$34
2017-18General Fund $53,381 $53,219 $53,219 —Local property tax 22,236 22,399 22,399 —
Totals $75,618 $75,618 $75,618 —
2018-19 —General Fund $55,025 $54,529 $54,529 —Local property tax 23,368 23,864 23,864 —
Totals $78,393 $78,393 $78,393 —
New ongoing spending $4,347 $5,159 $5,725 $566One-time spending 2,821 2,009 1,408 -601a Reflects difference between the houses, comparing Assembly to Senate.
4L E G I S L A T I V E A N A L Y S T ’ S O F F I C E
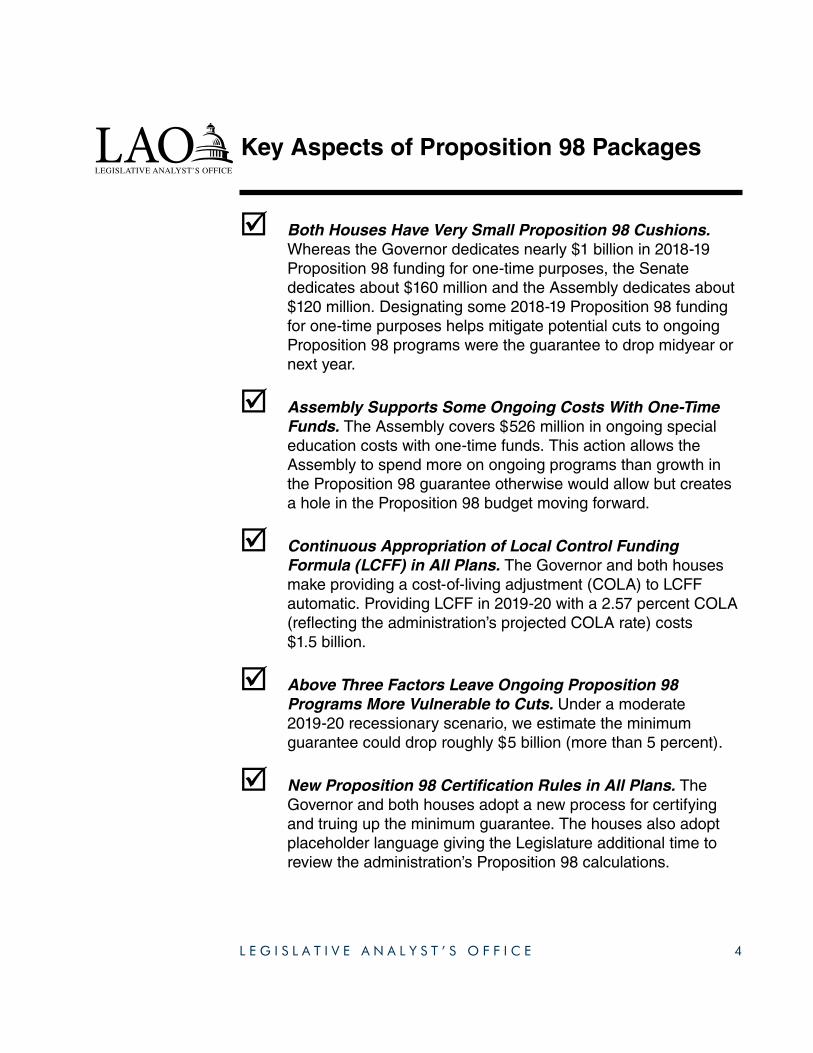
; Both Houses Have Very Small Proposition 98 Cushions. Whereas the Governor dedicates nearly $1 billion in 2018-19 Proposition 98 funding for one-time purposes, the Senate dedicates about $160 million and the Assembly dedicates about $120 million. Designating some 2018-19 Proposition 98 funding for one-time purposes helps mitigate potential cuts to ongoing Proposition 98 programs were the guarantee to drop midyear or next year.
; Assembly Supports Some Ongoing Costs With One-Time Funds. The Assembly covers $526 million in ongoing special education costs with one-time funds. This action allows the Assembly to spend more on ongoing programs than growth in the Proposition 98 guarantee otherwise would allow but creates a hole in the Proposition 98 budget moving forward.
; Continuous Appropriation of Local Control Funding Formula (LCFF) in All Plans. The Governor and both houses make providing a cost-of-living adjustment (COLA) to LCFF automatic. Providing LCFF in 2019-20 with a 2.57 percent COLA (reflecting the administration’s projected COLA rate) costs $1.5 billion.
; Above Three Factors Leave Ongoing Proposition 98 Programs More Vulnerable to Cuts. Under a moderate 2019-20 recessionary scenario, we estimate the minimum guarantee could drop roughly $5 billion (more than 5 percent).
; New Proposition 98 Certification Rules in All Plans. The Governor and both houses adopt a new process for certifying and truing up the minimum guarantee. The houses also adopt placeholder language giving the Legislature additional time to review the administration’s Proposition 98 calculations.
Key Aspects of Proposition 98 Packages

5L E G I S L A T I V E A N A L Y S T ’ S O F F I C E
2016-17 Through 2018-19 (In Millions)
K-12 Education: Spending Overview
Governor Senate Assembly Differencea
Ongoing Increases Over Period $3,764 $4,576 $5,102 $526 Difference from Governor 812 1,338
One-Time Increases Over Period $2,393 $1,581 $1,020 -$561 Difference from Governor -812 -1,373
Total Increases Over Period $6,157 $6,157 $6,122 -$34 Difference from Governor — -342018-19 Proposition 98 Spending $69,390 $69,390 $69,390 —a Reflects difference between the houses, comparing Assembly to Senate.
6L E G I S L A T I V E A N A L Y S T ’ S O F F I C E
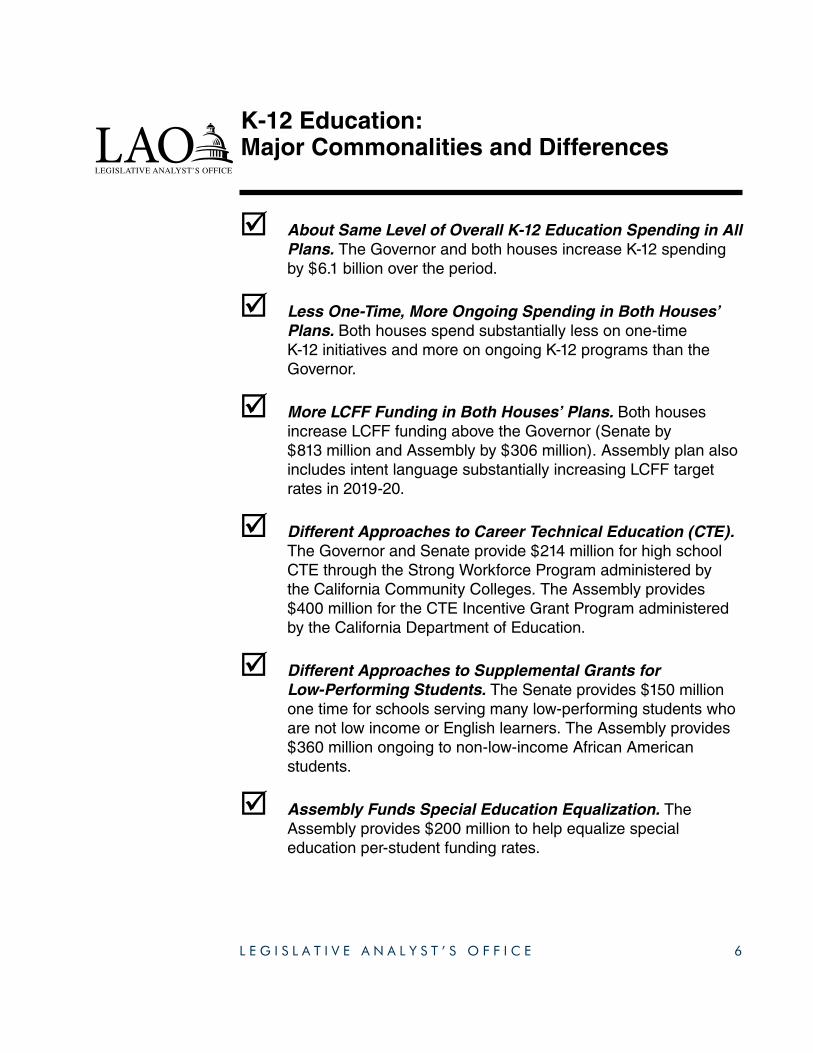
; About Same Level of Overall K-12 Education Spending in All Plans. The Governor and both houses increase K-12 spending by $6.1 billion over the period.
; Less One-Time, More Ongoing Spending in Both Houses’ Plans. Both houses spend substantially less on one-time K-12 initiatives and more on ongoing K-12 programs than the Governor.
; More LCFF Funding in Both Houses’ Plans. Both houses increase LCFF funding above the Governor (Senate by $813 million and Assembly by $306 million). Assembly plan also includes intent language substantially increasing LCFF target rates in 2019-20.
; Different Approaches to Career Technical Education (CTE). The Governor and Senate provide $214 million for high school CTE through the Strong Workforce Program administered by the California Community Colleges. The Assembly provides $400 million for the CTE Incentive Grant Program administered by the California Department of Education.
; Different Approaches to Supplemental Grants for Low-Performing Students. The Senate provides $150 million one time for schools serving many low-performing students who are not low income or English learners. The Assembly provides $360 million ongoing to non-low-income African American students.
; Assembly Funds Special Education Equalization. The Assembly provides $200 million to help equalize special education per-student funding rates.
K-12 Education: Major Commonalities and Differences
7L E G I S L A T I V E A N A L Y S T ’ S O F F I C E
2018-19 (In Millions)
K-12 Education: Detailed Budget Comparison
Governor Senate Assembly Differencea
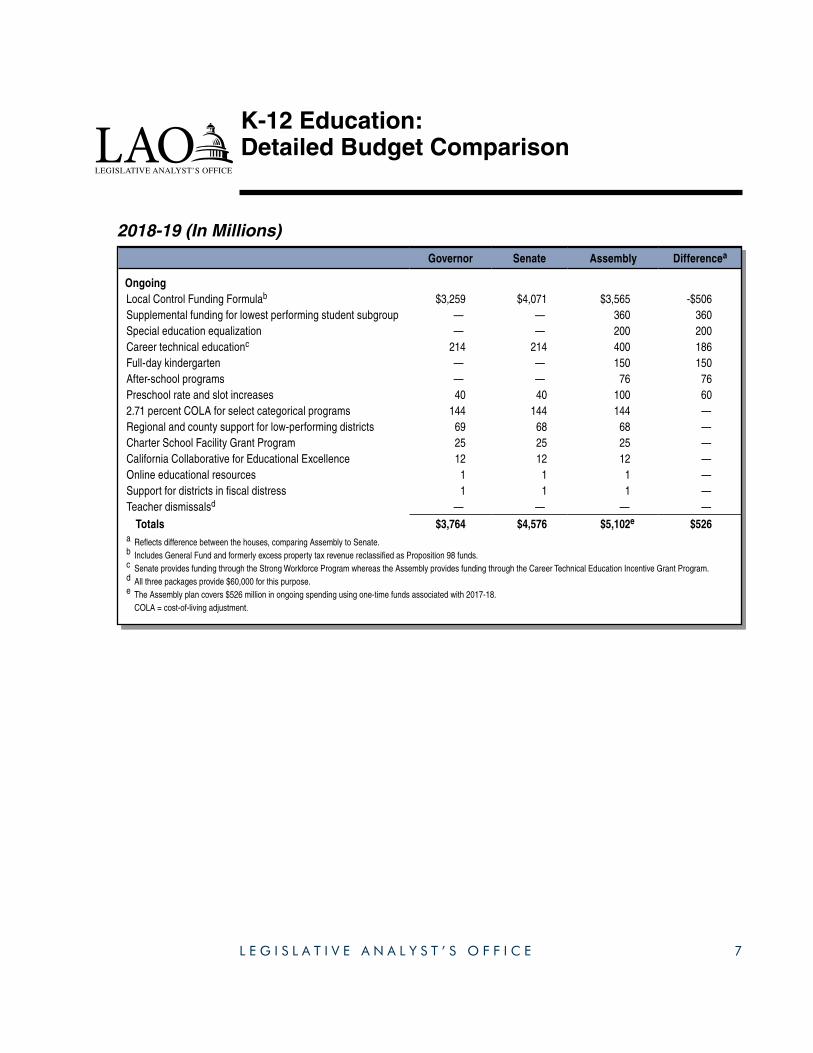
OngoingLocal Control Funding Formulab $3,259 $4,071 $3,565 -$506Supplemental funding for lowest performing student subgroup — — 360 360Special education equalization — — 200 200Career technical educationc 214 214 400 186Full-day kindergarten — — 150 150After-school programs — — 76 76Preschool rate and slot increases 40 40 100 602.71 percent COLA for select categorical programs 144 144 144 —Regional and county support for low-performing districts 69 68 68 —Charter School Facility Grant Program 25 25 25 —California Collaborative for Educational Excellence 12 12 12 —Online educational resources 1 1 1 —Support for districts in fiscal distress 1 1 1 —Teacher dismissalsd — — — —
Totals $3,764 $4,576 $5,102e $526a Reflects difference between the houses, comparing Assembly to Senate. b Includes General Fund and formerly excess property tax revenue reclassified as Proposition 98 funds.c Senate provides funding through the Strong Workforce Program whereas the Assembly provides funding through the Career Technical Education Incentive Grant Program. d All three packages provide $60,000 for this purpose.e The Assembly plan covers $526 million in ongoing spending using one-time funds associated with 2017-18. COLA = cost-of-living adjustment.
8L E G I S L A T I V E A N A L Y S T ’ S O F F I C E
2016-17 Through 2018-19 (In Millions)
K-12 Education: Detailed Budget Comparison (Continued)
Governor Senate Assembly Differencea
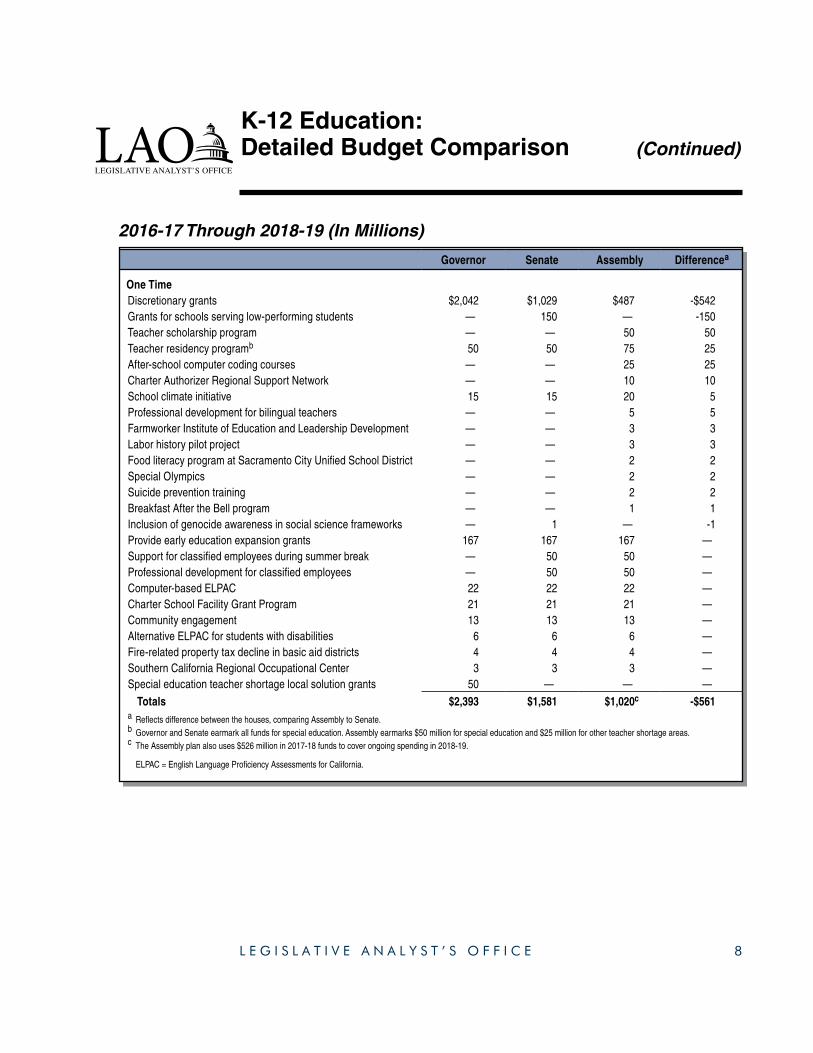
One TimeDiscretionary grants $2,042 $1,029 $487 -$542Grants for schools serving low-performing students — 150 — -150Teacher scholarship program — — 50 50Teacher residency programb 50 50 75 25After-school computer coding courses — — 25 25Charter Authorizer Regional Support Network — — 10 10School climate initiative 15 15 20 5Professional development for bilingual teachers — — 5 5Farmworker Institute of Education and Leadership Development — — 3 3Labor history pilot project — — 3 3Food literacy program at Sacramento City Unified School District — — 2 2Special Olympics — — 2 2Suicide prevention training — — 2 2Breakfast After the Bell program — — 1 1Inclusion of genocide awareness in social science frameworks — 1 — -1Provide early education expansion grants 167 167 167 —Support for classified employees during summer break — 50 50 —Professional development for classified employees — 50 50 —Computer-based ELPAC 22 22 22 —Charter School Facility Grant Program 21 21 21 —Community engagement 13 13 13 —Alternative ELPAC for students with disabilities 6 6 6 —Fire-related property tax decline in basic aid districts 4 4 4 —Southern California Regional Occupational Center 3 3 3 —Special education teacher shortage local solution grants 50 — — —
Totals $2,393 $1,581 $1,020c -$561a Reflects difference between the houses, comparing Assembly to Senate. b Governor and Senate earmark all funds for special education. Assembly earmarks $50 million for special education and $25 million for other teacher shortage areas.c The Assembly plan also uses $526 million in 2017-18 funds to cover ongoing spending in 2018-19.
ELPAC = English Language Proficiency Assessments for California.
9L E G I S L A T I V E A N A L Y S T ’ S O F F I C E
2016-17 Through 2018-19 (In Millions)
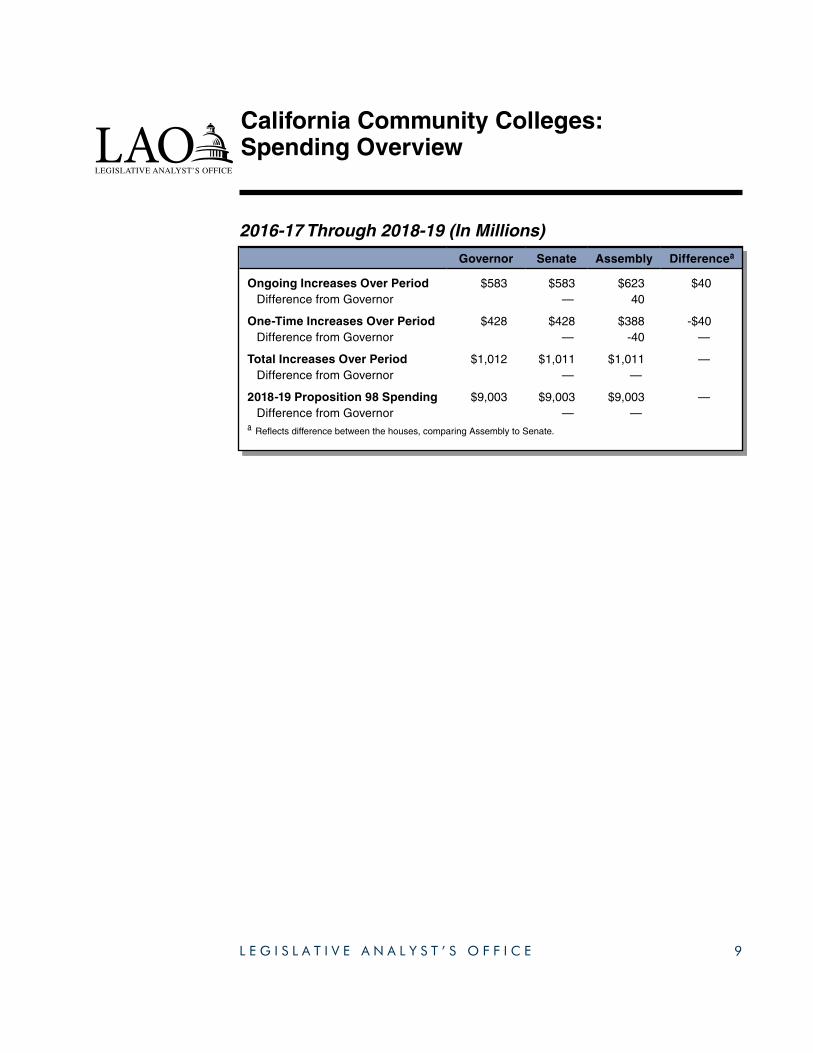
California Community Colleges: Spending Overview
Governor Senate Assembly Differencea
Ongoing Increases Over Period $583 $583 $623 $40 Difference from Governor — 40
One-Time Increases Over Period $428 $428 $388 -$40 Difference from Governor — -40 —
Total Increases Over Period $1,012 $1,011 $1,011 — Difference from Governor — —
2018-19 Proposition 98 Spending $9,003 $9,003 $9,003 — Difference from Governor — —a Reflects difference between the houses, comparing Assembly to Senate.
10L E G I S L A T I V E A N A L Y S T ’ S O F F I C E
; Same Overall Spending Level in All Three Plans. The Governor and both houses increase community college spending by $1 billion over the period.
; Different Approaches to Increasing Apportionments Funding. Both houses rejected the Governor’s proposed new funding formula and an associated $279 million in hold harmless funding. The Senate instead provides a $108 million base apportionment increase. The Assembly provides a $175 million apportionment increase and targets the funding to districts experiencing declining enrollment.
; Different Approaches to New Online Programs. The Governor and Senate provide $120 million ($100 million one time, $20 million ongoing) for a new online community college. The Senate provides an additional $44 million one time for districts to develop content for the new college and provide associated faculty training. The Assembly rejects the online college proposal and instead provides $60 million one time for a new institute at a college or consortium of colleges to develop online programs that lead to short-term stackable credentials and industry certifications.
; Both Houses Provide More for Faculty. Both houses provide $40 million for colleges to employ more full-time faculty. Additionally, the Senate provides $26 million and the Assembly provides $14 million for part-time faculty salary, benefits, and office hours.
; One-Time Funding for Support Services. Both houses provide one-time funding for mental health services ($20 million), legal services for undocumented students ($15 million), and re-entry programs for formerly incarcerated students ($5 million). The Assembly also provides one-time funding for student hunger and basic needs ($20 million) and veteran resource centers ($15 million).
California Community Colleges: Major Commonalities and Differences
11L E G I S L A T I V E A N A L Y S T ’ S O F F I C E
2018-19 (In Millions)
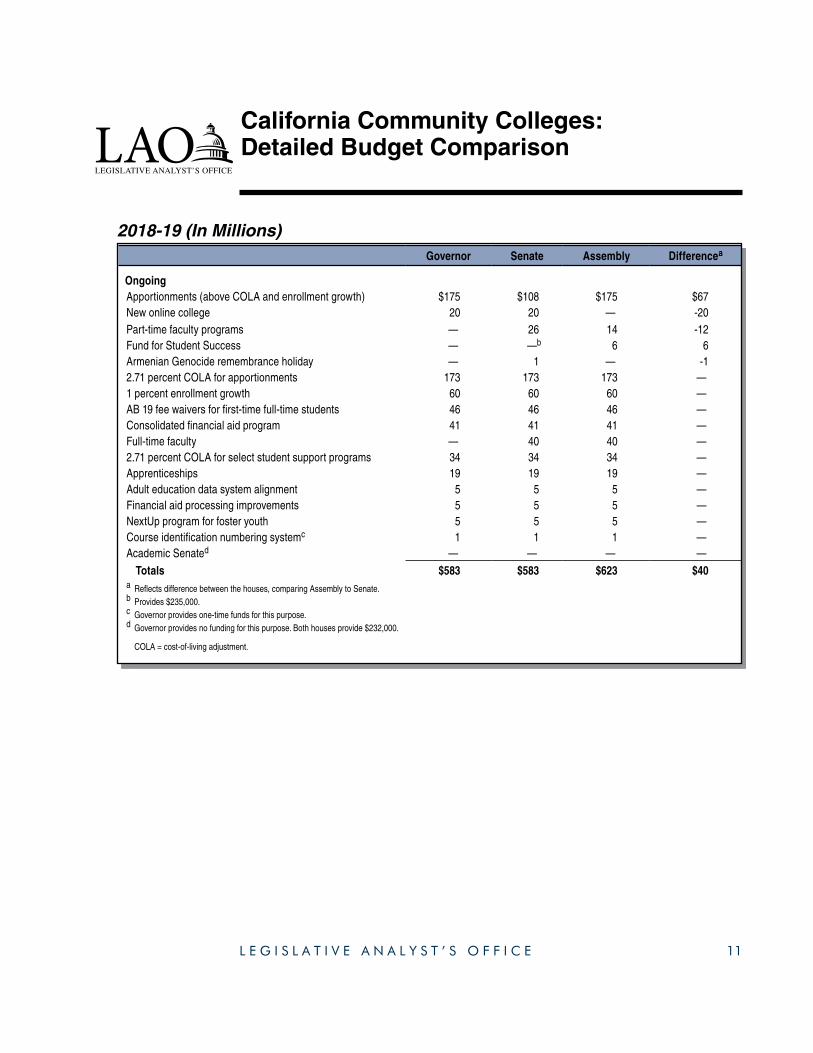
California Community Colleges: Detailed Budget Comparison
Governor Senate Assembly Differencea
OngoingApportionments (above COLA and enrollment growth) $175 $108 $175 $67New online college 20 20 — -20Part-time faculty programs — 26 14 -12Fund for Student Success — —b 6 6Armenian Genocide remembrance holiday — 1 — -12.71 percent COLA for apportionments 173 173 173 —1 percent enrollment growth 60 60 60 —AB 19 fee waivers for first-time full-time students 46 46 46 —Consolidated financial aid program 41 41 41 —Full-time faculty — 40 40 —2.71 percent COLA for select student support programs 34 34 34 —Apprenticeships 19 19 19 —Adult education data system alignment 5 5 5 —Financial aid processing improvements 5 5 5 —NextUp program for foster youth 5 5 5 —Course identification numbering systemc 1 1 1 —Academic Senated — — — —
Totals $583 $583 $623 $40a Reflects difference between the houses, comparing Assembly to Senate. b Provides $235,000.c Governor provides one-time funds for this purpose.d Governor provides no funding for this purpose. Both houses provide $232,000.
COLA = cost-of-living adjustment.
12L E G I S L A T I V E A N A L Y S T ’ S O F F I C E
2016-17 Through 2018-19 (In Millions)
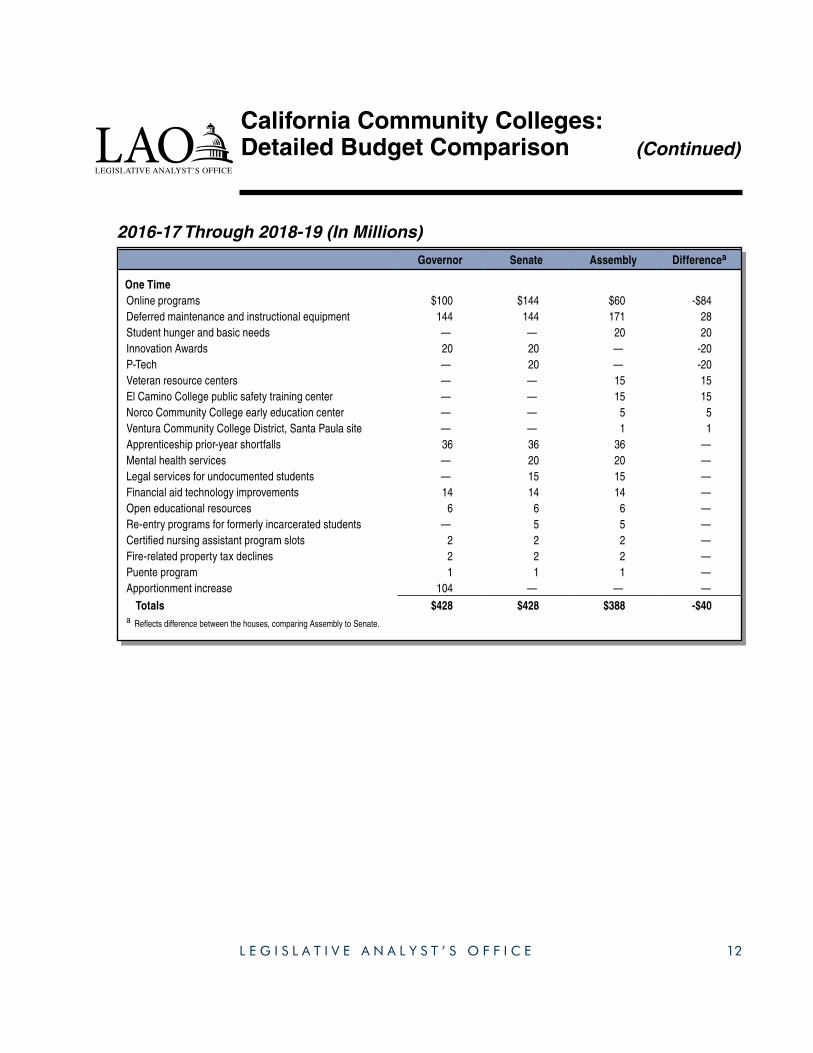
California Community Colleges: Detailed Budget Comparison (Continued)
Governor Senate Assembly Differencea
One TimeOnline programs $100 $144 $60 -$84Deferred maintenance and instructional equipment 144 144 171 28Student hunger and basic needs — — 20 20Innovation Awards 20 20 — -20P-Tech — 20 — -20Veteran resource centers — — 15 15El Camino College public safety training center — — 15 15Norco Community College early education center — — 5 5Ventura Community College District, Santa Paula site — — 1 1Apprenticeship prior-year shortfalls 36 36 36 —Mental health services — 20 20 —Legal services for undocumented students — 15 15 —Financial aid technology improvements 14 14 14 —Open educational resources 6 6 6 —Re-entry programs for formerly incarcerated students — 5 5 —Certified nursing assistant program slots 2 2 2 —Fire-related property tax declines 2 2 2 —Puente program 1 1 1 —Apportionment increase 104 — — —
Totals $428 $428 $388 -$40a Reflects difference between the houses, comparing Assembly to Senate.
13L E G I S L A T I V E A N A L Y S T ’ S O F F I C E
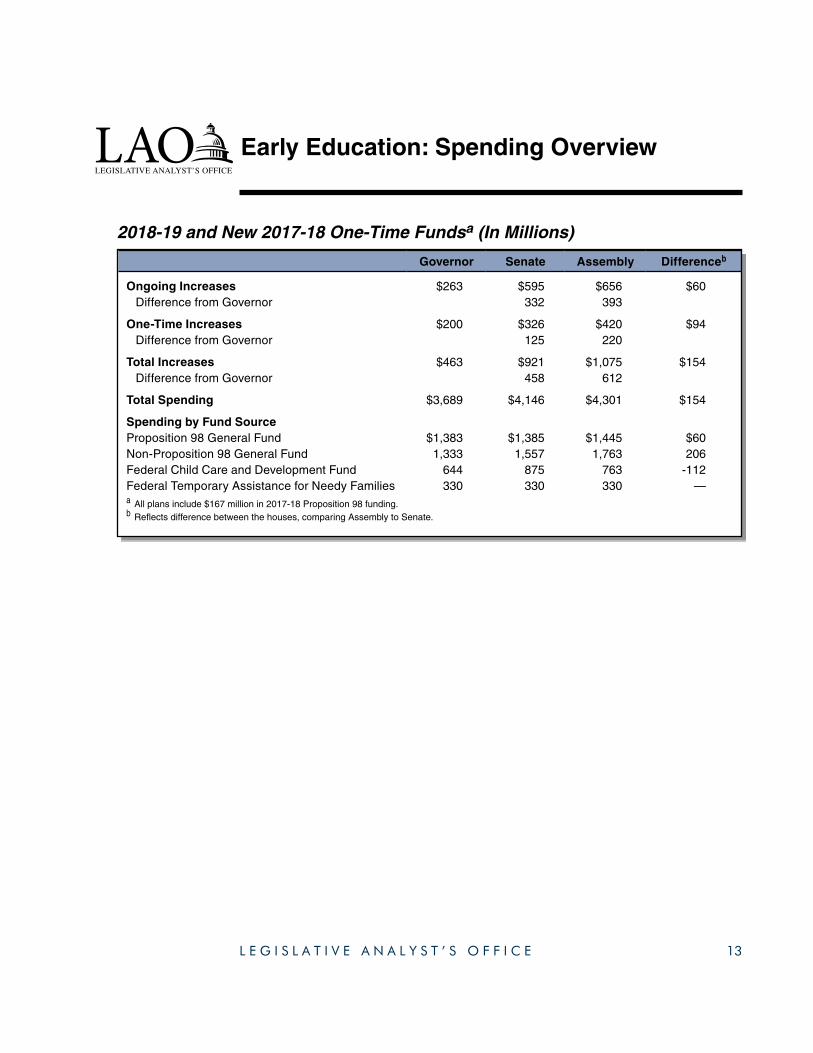
2018-19 and New 2017-18 One-Time Fundsa (In Millions)
Early Education: Spending Overview
Governor Senate Assembly Differenceb
Ongoing Increases $263 $595 $656 $60 Difference from Governor 332 393
One-Time Increases $200 $326 $420 $94 Difference from Governor 125 220
Total Increases $463 $921 $1,075 $154 Difference from Governor 458 612
Total Spending $3,689 $4,146 $4,301 $154
Spending by Fund SourceProposition 98 General Fund $1,383 $1,385 $1,445 $60Non-Proposition 98 General Fund 1,333 1,557 1,763 206Federal Child Care and Development Fund 644 875 763 -112Federal Temporary Assistance for Needy Families 330 330 330 —a All plans include $167 million in 2017-18 Proposition 98 funding.b Reflects difference between the houses, comparing Assembly to Senate.
14L E G I S L A T I V E A N A L Y S T ’ S O F F I C E
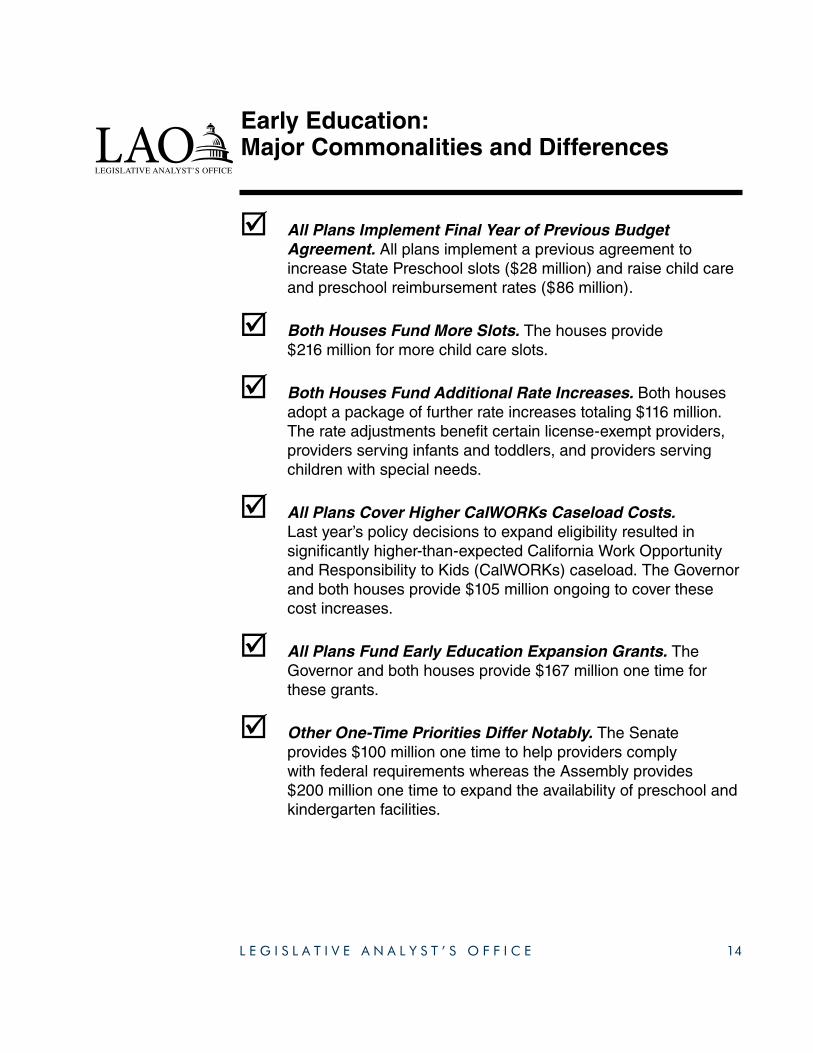
; All Plans Implement Final Year of Previous Budget Agreement. All plans implement a previous agreement to increase State Preschool slots ($28 million) and raise child care and preschool reimbursement rates ($86 million).
; Both Houses Fund More Slots. The houses provide $216 million for more child care slots.
; Both Houses Fund Additional Rate Increases. Both houses adopt a package of further rate increases totaling $116 million. The rate adjustments benefit certain license-exempt providers, providers serving infants and toddlers, and providers serving children with special needs.
; All Plans Cover Higher CalWORKs Caseload Costs. Last year’s policy decisions to expand eligibility resulted in significantly higher-than-expected California Work Opportunity and Responsibility to Kids (CalWORKs) caseload. The Governor and both houses provide $105 million ongoing to cover these cost increases.
; All Plans Fund Early Education Expansion Grants. The Governor and both houses provide $167 million one time for these grants.
; Other One-Time Priorities Differ Notably. The Senate provides $100 million one time to help providers comply with federal requirements whereas the Assembly provides $200 million one time to expand the availability of preschool and kindergarten facilities.
Early Education: Major Commonalities and Differences
15L E G I S L A T I V E A N A L Y S T ’ S O F F I C E
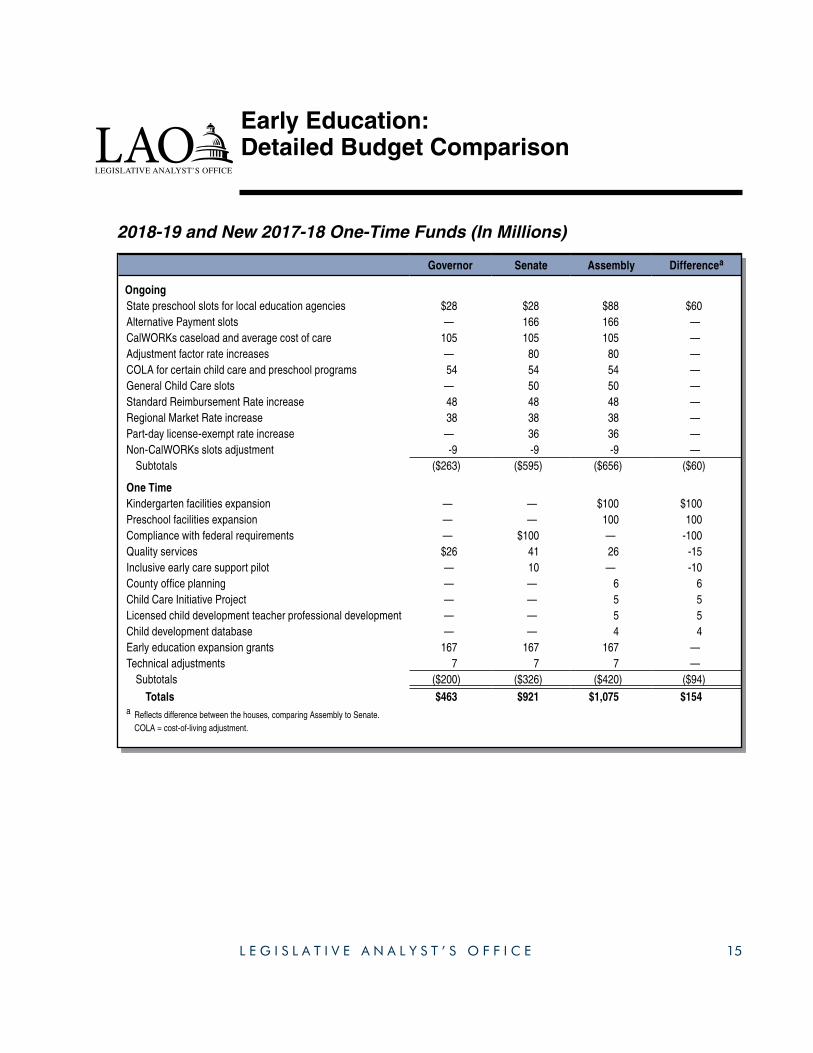
2018-19 and New 2017-18 One-Time Funds (In Millions)
Early Education: Detailed Budget Comparison
Governor Senate Assembly Differencea
OngoingState preschool slots for local education agencies $28 $28 $88 $60Alternative Payment slots — 166 166 —CalWORKs caseload and average cost of care 105 105 105 —Adjustment factor rate increases — 80 80 —COLA for certain child care and preschool programs 54 54 54 —General Child Care slots — 50 50 —Standard Reimbursement Rate increase 48 48 48 —Regional Market Rate increase 38 38 38 —Part-day license-exempt rate increase — 36 36 —Non-CalWORKs slots adjustment -9 -9 -9 — Subtotals ($263) ($595) ($656) ($60)
One Time Kindergarten facilities expansion — — $100 $100Preschool facilities expansion — — 100 100Compliance with federal requirements — $100 — -100Quality services $26 41 26 -15Inclusive early care support pilot — 10 — -10County office planning — — 6 6Child Care Initiative Project — — 5 5Licensed child development teacher professional development — — 5 5Child development database — — 4 4Early education expansion grants 167 167 167 —Technical adjustments 7 7 7 — Subtotals ($200) ($326) ($420) ($94)
Totals $463 $921 $1,075 $154a Reflects difference between the houses, comparing Assembly to Senate. COLA = cost-of-living adjustment.
16L E G I S L A T I V E A N A L Y S T ’ S O F F I C E
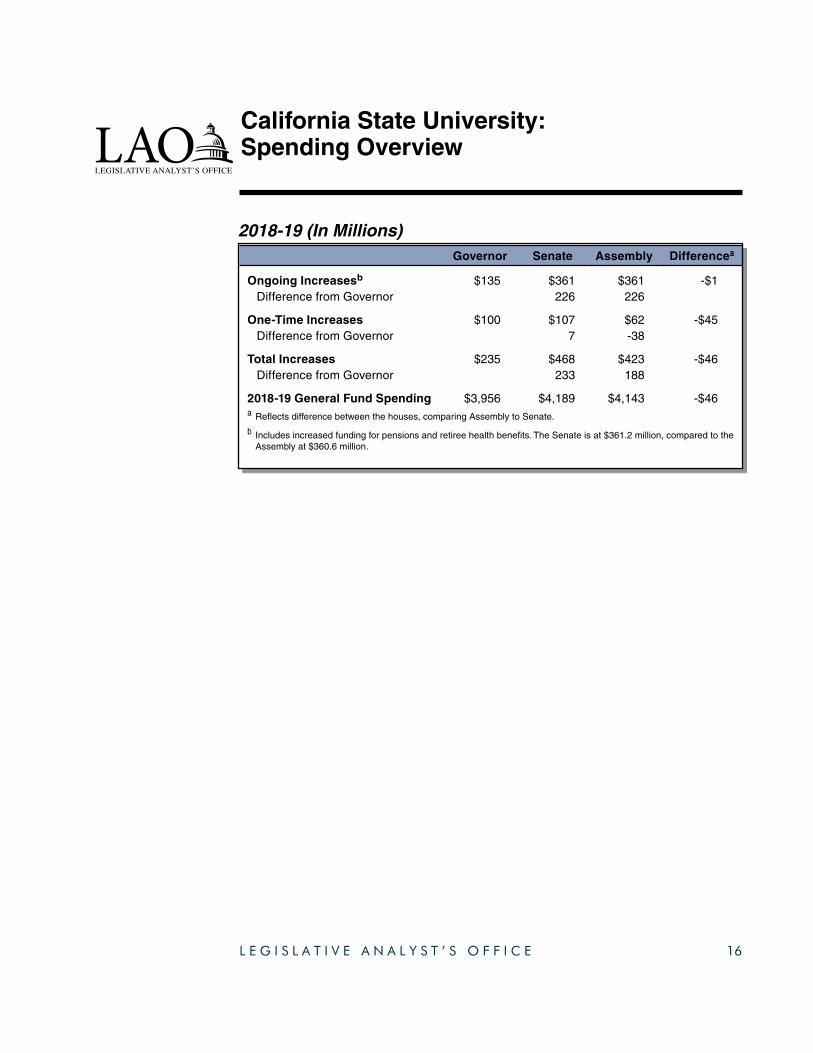
California State University: Spending Overview
Governor Senate Assembly Differencea
Ongoing Increasesb $135 $361 $361 -$1 Difference from Governor 226 226
One-Time Increases $100 $107 $62 -$45 Difference from Governor 7 -38
Total Increases $235 $468 $423 -$46 Difference from Governor 233 188
2018-19 General Fund Spending $3,956 $4,189 $4,143 -$46a Reflects difference between the houses, comparing Assembly to Senate.
b Includes increased funding for pensions and retiree health benefits. The Senate is at $361.2 million, compared to the Assembly at $360.6 million.
2018-19 (In Millions)
17L E G I S L A T I V E A N A L Y S T ’ S O F F I C E
; Both Houses Provide Higher Base Increase Than Governor. Both houses provide a higher unrestricted base increase ($153 million) than the Governor ($92 million). The houses indicate the additional funding is to support staff salary and benefit increases.
; Both Houses Fund Enrollment Growth. Both houses provide $90 million for 3 percent enrollment growth of resident undergraduate students in 2018-19 (equating to 10,923 full-time equivalent students). The Governor does not earmark any new funding for enrollment growth.
; Both Houses Fund Graduation Initiative. Both houses provide $75 million for this initiative, bringing total ongoing funding for the initiative up to $198 million. The Governor has signaled that California State University is to use its unrestricted base increase to support the initiative.
; Different Amounts for Deferred Maintenance. The Governor and Senate approve $100 million one-time funds for deferred maintenance. The Assembly provides $35 million one time for this purpose.
; Different Remaining One-Time Spending Priorities. The Senate spends $7 million for one initiative whereas the Assembly spends a total of $26 million for four initiatives.
California State University: Major Commonalities and Differences
18L E G I S L A T I V E A N A L Y S T ’ S O F F I C E
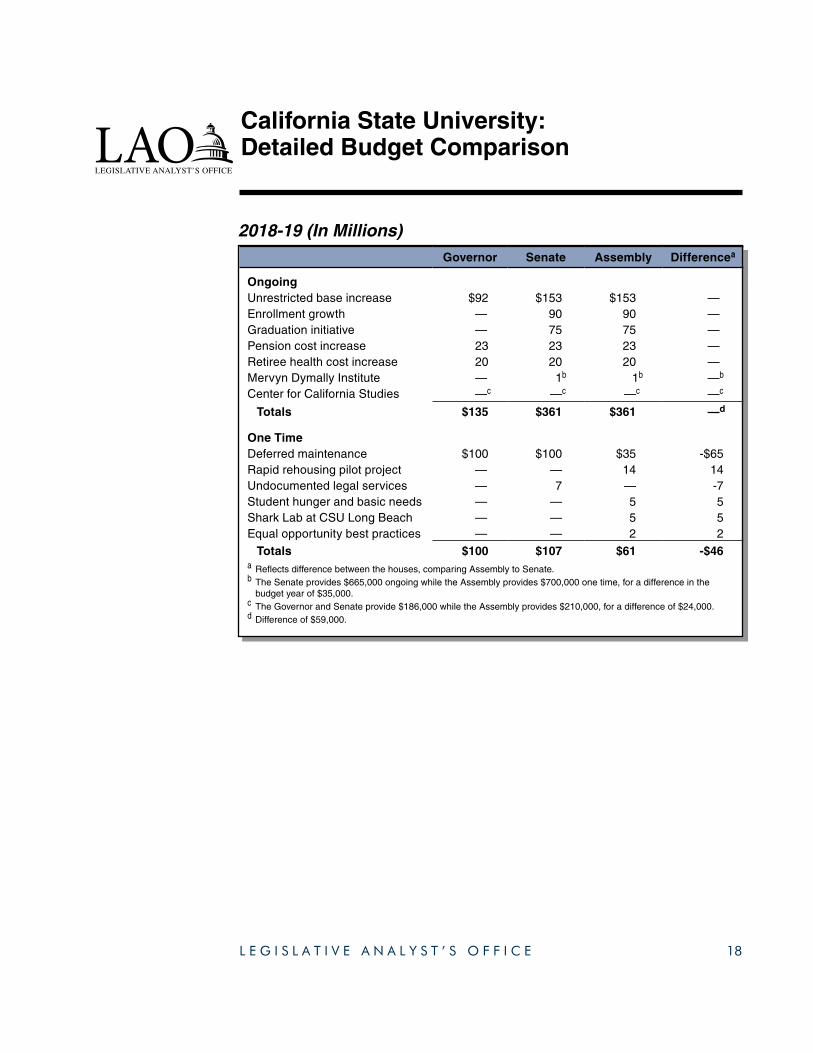
California State University: Detailed Budget Comparison
Governor Senate Assembly Differencea
OngoingUnrestricted base increase $92 $153 $153 —Enrollment growth — 90 90 —Graduation initiative — 75 75 —Pension cost increase 23 23 23 —Retiree health cost increase 20 20 20 —Mervyn Dymally Institute — 1b 1b —b
Center for California Studies —c —c —c —c
Totals $135 $361 $361 —d
One TimeDeferred maintenance $100 $100 $35 -$65Rapid rehousing pilot project — — 14 14Undocumented legal services — 7 — -7Student hunger and basic needs — — 5 5Shark Lab at CSU Long Beach — — 5 5Equal opportunity best practices — — 2 2
Totals $100 $107 $61 -$46a Reflects difference between the houses, comparing Assembly to Senate. b The Senate provides $665,000 ongoing while the Assembly provides $700,000 one time, for a difference in the
budget year of $35,000. c The Governor and Senate provide $186,000 while the Assembly provides $210,000, for a difference of $24,000.d Difference of $59,000.
2018-19 (In Millions)
19L E G I S L A T I V E A N A L Y S T ’ S O F F I C E
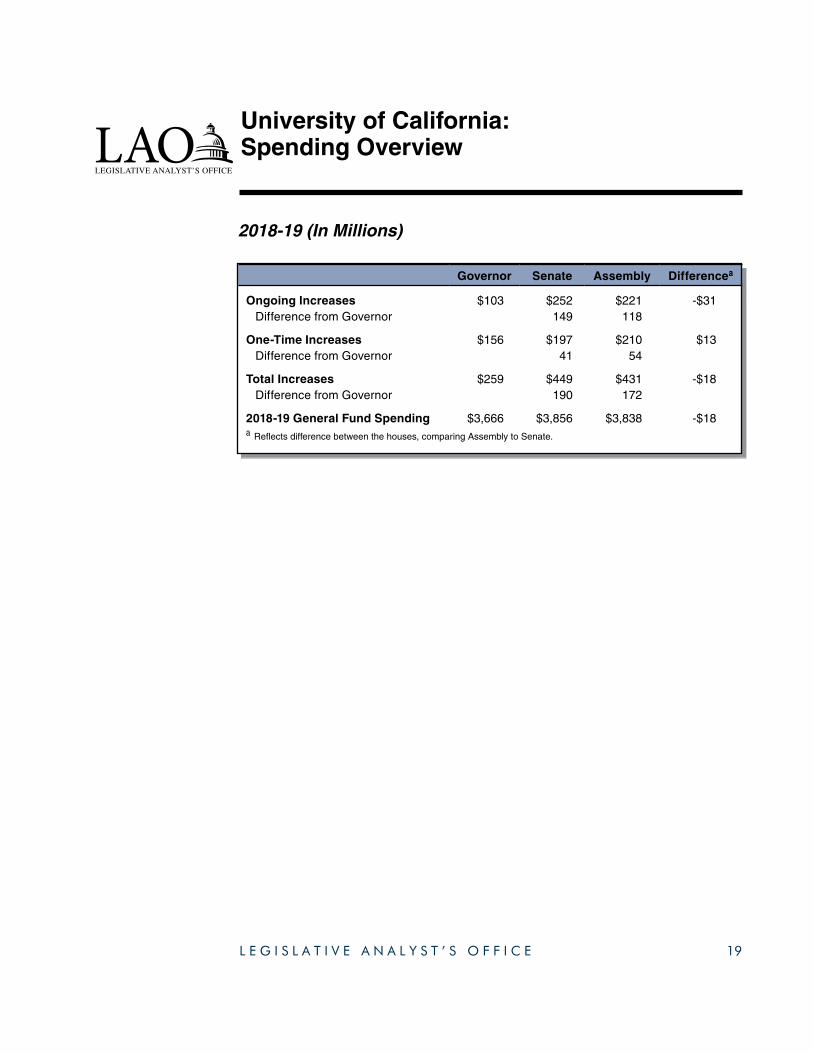
University of California: Spending Overview
Governor Senate Assembly Differencea
Ongoing Increases $103 $252 $221 -$31 Difference from Governor 149 118
One-Time Increases $156 $197 $210 $13 Difference from Governor 41 54
Total Increases $259 $449 $431 -$18 Difference from Governor 190 172
2018-19 General Fund Spending $3,666 $3,856 $3,838 -$18a Reflects difference between the houses, comparing Assembly to Senate.
2018-19 (In Millions)
20L E G I S L A T I V E A N A L Y S T ’ S O F F I C E
; Both Houses Provide Higher Base Increase Than Governor. The houses indicate the additional funding is for compensation increases, academic quality initiatives, and other cost increases. The Assembly ties $50 million of the increase to the University of California (UC) implementing certain recommendations made by the State Auditor.
; Both Houses Fund Resident Enrollment Growth. Both houses fund (1) additional enrollment growth in 2018-19, (2) enrollment growth in 2019-20, and (3) enrollment above budgeted levels in 2016-17 and 2017-18. The houses differ, however, in the level of enrollment they support and the amount of corresponding state funding they provide. The Senate also directs the university to adopt a plan to reduce nonresident enrollment over the next ten years.
; Different Approaches to Augmenting Medical Education and Residency Programs. The Governor and Senate provide funding for physician residency programs, with the Senate providing more one-time and ongoing support. The Assembly provides mostly one-time funding for medical education programs.
; Assembly Links UC Retirement Plan Funding to Budget Condition. The Assembly provides $120 million one time to help pay down a portion of UC’s unfunded pension liability. It conditions the funding on UC eliminating a defined contribution option for represented employees.
; Different Amounts for Deferred Maintenance. The Governor and Senate provide $100 million one time for deferred maintenance. The Assembly provides $35 million.
; Different Priorities for Other One-Time Spending. The Senate spends $43 million and the Assembly $45 million on various research and student service initiatives.
University of California: Major Commonalities and Differences
21L E G I S L A T I V E A N A L Y S T ’ S O F F I C E
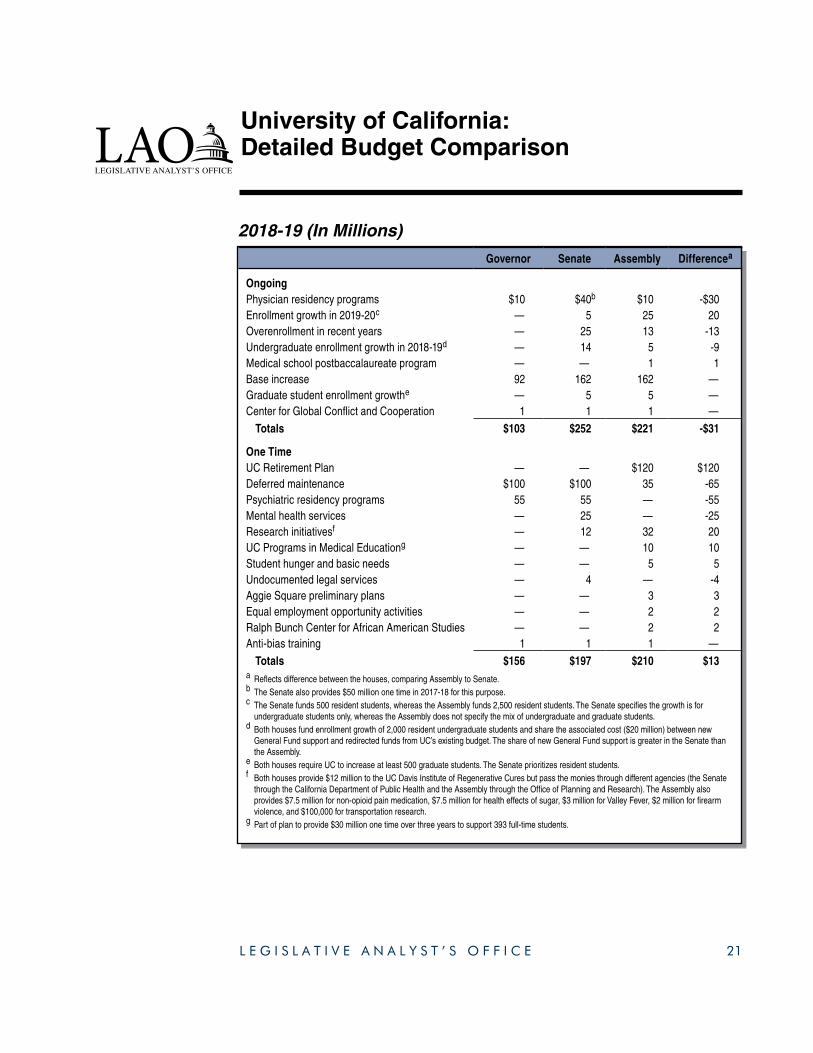
University of California: Detailed Budget Comparison
Governor Senate Assembly Differencea
OngoingPhysician residency programs $10 $40b $10 -$30Enrollment growth in 2019-20c — 5 25 20Overenrollment in recent years — 25 13 -13Undergraduate enrollment growth in 2018-19d — 14 5 -9Medical school postbaccalaureate program — — 1 1Base increase 92 162 162 —Graduate student enrollment growthe — 5 5 —Center for Global Conflict and Cooperation 1 1 1 —
Totals $103 $252 $221 -$31
One TimeUC Retirement Plan — — $120 $120Deferred maintenance $100 $100 35 -65Psychiatric residency programs 55 55 — -55Mental health services — 25 — -25Research initiativesf — 12 32 20UC Programs in Medical Educationg — — 10 10Student hunger and basic needs — — 5 5Undocumented legal services — 4 — -4Aggie Square preliminary plans — — 3 3Equal employment opportunity activities — — 2 2Ralph Bunch Center for African American Studies — — 2 2Anti-bias training 1 1 1 —
Totals $156 $197 $210 $13a Reflects difference between the houses, comparing Assembly to Senate. b The Senate also provides $50 million one time in 2017-18 for this purpose.c The Senate funds 500 resident students, whereas the Assembly funds 2,500 resident students. The Senate specifies the growth is for
undergraduate students only, whereas the Assembly does not specify the mix of undergraduate and graduate students.d Both houses fund enrollment growth of 2,000 resident undergraduate students and share the associated cost ($20 million) between new
General Fund support and redirected funds from UC’s existing budget. The share of new General Fund support is greater in the Senate than the Assembly.
e Both houses require UC to increase at least 500 graduate students. The Senate prioritizes resident students. f Both houses provide $12 million to the UC Davis Institute of Regenerative Cures but pass the monies through different agencies (the Senate
through the California Department of Public Health and the Assembly through the Office of Planning and Research). The Assembly also provides $7.5 million for non-opioid pain medication, $7.5 million for health effects of sugar, $3 million for Valley Fever, $2 million for firearm violence, and $100,000 for transportation research.
g Part of plan to provide $30 million one time over three years to support 393 full-time students.
2018-19 (In Millions)