overview of cpu power consumption and management in smartphones · overview of cpu power...
TRANSCRIPT

Overview of CPU Power Consumption and Management in
Smartphones
Prof. Sasu Tarkoma
University of Helsinki, Aalto University, Helsinki Institute for Information Technology

Contents
• Modern smartphone SoC and CPUs – The CPU: power states – Power management basics
• Smartphone solutions – Linux CPU Frequency subsystem – Power models
• Intra-device task offloading – Sensor hub – Heterogeneous multiprocessing
• Computation offloading

• Smartphones have become hubs for applications and connecting with the Internet
• Cloud has emerged as a backend for mobile applications • Mobile data and WiFi are the dominant protocols for
connecting with Internet resources • The next generation solutions are addressing limitations of
the current smartphones – Coordination of resource usage – Offloading in its many forms – Heterogeneous environment and the emergence of
IoT / M2M / wearables
Smartphones

Observations
• Smartphone and mobile device hardware and software evolve rapidly
• Multiple wireless protocols • Heterogeneous computing over multiple cores
– Dedicated subsystems (sensor hubs) – Increasing number of sensing subsystems – Always-on sensing
• Battery technology has not kept pace with the development • Software is not, in many cases, optimized • Difficult to balance between local versus distributed processing • Difficult to control traffic across interfaces

1995 2000 2005 2010 2015
Processor Single Single Single Dual-core Quad-core and beyond, auxiliary processors, sensor hubs
Cellular generation
2G 2.5-3G 3.5G Transition toward 4G
4G
Standard GSM GPRS HSPA HSPA, LTE LTE, LTE-A
Downlink (Mb/s)
0.01 0.1 1 10 100
Display pixels (x1000)
4 16 64 256 1024
Communications modules
- - WiFi, Bluetooth
WiFi, Bluetooth
WiFi, Bluetooth LE, RFID
Battery capacity (Wh)
1 2 3 4 5
Software (MB) 0.1 1 10 100 1000
Mobile Evolution

KRAIT CPU L1 Cache
LTE World
Modem KRAIT CPU
L1 Cache
GPS,Wi-Fi, BT,FM
Adreno GPU
Audio, Video HW, Accelerator
s
DSP L2 Cache Multim. Proc.
DSP
DSP
Dual channel memory
Snapdragon Adaptive Power Technologies
Modem Subsystem Multicore Subsystem Multimedia Subsystem
Example Smartphone SoC

0 100 200 300 400 500 600 700 800
Android Smartphone Power Profile (mW)
CPU Total Power
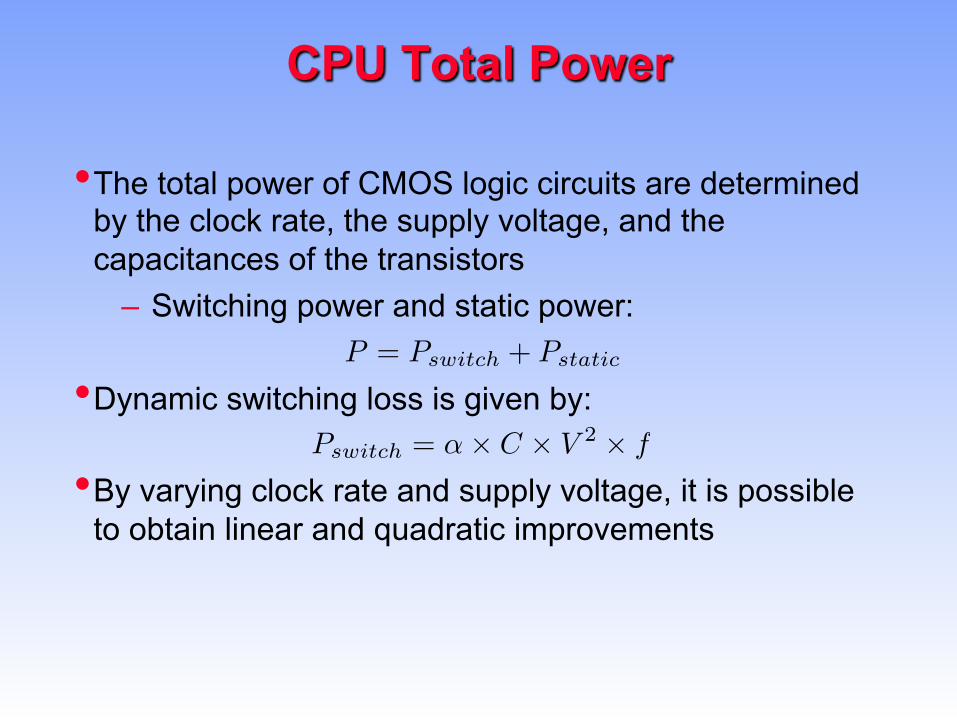
• The total power of CMOS logic circuits are determined by the clock rate, the supply voltage, and the capacitances of the transistors
– Switching power and static power:
• Dynamic switching loss is given by: • By varying clock rate and supply voltage, it is possible
to obtain linear and quadratic improvements
28 Energy and Power Primer
2.3 Power Computation
Energy can be saved on multiple levels in the hardware and software architecture.On circuit and transistor levels energy can be saved by changing the voltage andfrequency of the circuit. The total power of CMOS logic circuits are determinedby the clock rate, the supply voltage, and the capacitances of the transistors.The larger the capacitance, the more the transistors need to work to change theoutput charge. The higher the source voltage, the more the output has to change.The higher the clock frequency, the more power is wasted during switching. Thecapacitances are determined during chip design; however, the clock rate andvoltage can be varied at runtime. By varying clock rate and supply voltage, it ispossible to obtain linear and quadratic improvements, respectively.
The overall power consumption is given by
P = Pswitch + Pstatic, (2.6)
where Pswitch is the dynamic switching power and Pstatic is the static leakagepower. The formula does not include the lost power due to short circuit due toa transistor switching that is a relatively small term in the dynamic switchingpower [4].
The CPU consists of transistors that can switch states every clock cycle. Eachswitch of states between a complementary pair of transistors results in wastedpower. Typically, most of the gates in the CPU switch states every clock cycle.Thus the higher the clock rate, the higher the amount of wasted energy. Inaddition to the clock rate, also the voltage a↵ects the power consumption of theCPU.
The dynamic switching loss is the power used by switching of the state of thetransistors. This loss can be determined by using the formula
Pswitch = ↵⇥ C ⇥ V 2 ⇥ f, (2.7)
where ↵ denote the switching activity, C is the average capacitance of the tran-sistors, V is the supply voltage and f is the clock frequency [5]. The powerconsumption is proportional to the product of the square of the supply voltageand the frequency. The power consumption decreases quadratically with the re-duction of the voltage. The formula is not exact for modern chips, because alsomemory circuits and static leakage current need to be taken into account.
The clock rate and the supply voltage are parameters for the energy optimiza-tion of the CPU [6, 7]. Major energy savings can be gained by adjusting thesupply voltage and the clock rate either one or both of them at the same time.Indeed, dynamic voltage scaling is widely used to improve power consumptionof battery powered devices. Both low voltage and lowered clock frequencies areused to minimize power consumption of components such as CPUs and DSPs.
Operating frequency has an approximately linear relationship with the oper-

CPU Power Saving
• Running a task at a slower speed saves energy; however, it will lake longer to execute the task thus affecting the performance
• Dynamic voltage and frequency scaling favor parallelism and having multiple voltage/frequency scaled cores executing tasks.
Process with running frequency f/2
Time
Power (W)
Process running with frequency f
2.3 Power Computation 29
Process#with#running#frequency#f/2#
Time#
Power#(W)#
Process#running#with#frequency#f#
Figure 2.2 Example of frequency, time and energy consumption
ating voltage given by the following equation [4]:
Vnorm = �1 + �2 ⇥ fnorm, (2.8)
where �1 = Vth/Vmax and �2 = 1 � �1. Vth is the threshold voltage at which atransistor conducts and begins to switch.Figure 2.2 illustrates the relationships of the operating frequency, process com-
pletion time, and energy consumption. The process is executed on two di↵erentsystems at di↵erent voltage and frequency levels. The top process runs at highfrequency and is completed fast. The lower process runs at a halved processorfrequency and supply voltage and takes much longer to complete. The lower fre-quency and supply voltage lead to smaller energy consumption [7]. Suppose thatthe new frequency is f/2, then from Equation 2.7 we obtain the new switchingpower
P 0switch = ↵⇥ C ⇥ (
V
2)2 ⇥ f
2=
1
8Pswitch. (2.9)
Now, the completion time T of the process is doubled for the lower frequency:
E0switch = P 0
switch ⇥ T ⇥ 2 =1
8Pswitch ⇥ T ⇥ 2 =
1
4Pswitch ⇥ T, (2.10)
giving an improvement of 1/4 with the lower frequency while significantly in-creasing the execution time of the task. To compensate for the performance loss,we can divide the task into two subtasks and run these in parallel using twocores. The dynamic power can decrease by a factor two compared to the originalcase.
¼ energy savings with the doubling of the execution time

Scaling SoCs • Static power leakage is affecting the feasibility of
voltage scaling. – A linear decrease of voltage will result in a
quadratic decrease of the switching loss; however, it will only result in a linear decrease of the static leakage.
– Static leakage can become dominant with low voltage integrated circuits with high density of transistors
• To address leakage, SoCs use power gating to allow portions of the system to be switched off when necessary.
• Low power requirements are also driving the trend for multicore systems with many voltage and frequency controlled cores.
• Dynamic voltage and frequency scaling favor parallelism and having multiple voltage/frequency scaled cores executing tasks.

CPU Frequency and Relative Power Consumption
Clock frequency (MHz
Core voltage (V)
Relative power consumption
250 1.075 100%
500 1.2 249%
550 1.275 309%
600 1.35 378%
Source: J. Kurtto, “Mapping and improving the energy efficiency of the Nokia N900”. M.Sc. Thesis. University of Helsinki, Department of Computer Science.

Power Optimization Levels
• Smartphone and mobile device power optimization happens on multiple levels:
– Silicon-level, in which the transistor capacitance and the chip design affect the energy efficiency
– SoC-level, in which multiple power/voltage/clock domains can be used to support granular power management with the help of software and DVFS
– Software-level, in which various power managers monitor and control the energy and power settings.
• A high-level framework is needed to perform system-wide tuning and optimization.

APM and ACPI
• Advanced Power Management (APM) – Firmware and BIOS level – Apps and drivers -> APM Driver-> BIOS APM ->
hardware – Power management via device all and automatic
based on device activity – Power management events
• Advanced Configuration and Power Interface (ACPI) – APM is replaced by ACPI – OS has the control – Power states: global, device, processor,
performance

Smartphone CPU and SoC • The five popular SoCs used by smartphones today are:
– Qualcomm’s Snapdragon consists of four versions from S1 to S4.
– Texas Instrument’s OMAP (Open Media Applications Platform).
– Samsung’s Exynos SoCs used in their smartphones and tablets. The latest version of Exynos is 5 Octa and it features a quad-core Cortex-A15 and a quad-core Cortex-A7, ARM Mali GPU, and auxiliary processors.
– Nvidia’s Tegra SoCs are multi-core and based on ARM cores with an ulta low- power (ULP) GeForce GPU. The latest version, Tegra 4, supports ARM- A15 cores in quad- or octa-core configurations.
– Apple’s CPUs and SoCs are designed by Apple based on the ARM architecture.

Mobile CPU Performance 7.1 CPU and SoC 107
0#
500#
1000#
1500#
2000#
2500#
3000#
3500#
4000#
4500#
5000#
Tegra#3#(Nexus#
7)#1.3GHz#
A6X#(4th#iPad)#
1.4#GHz#
APQ8064#1.5#
GHz#(Nexus#4)#
Exynos5250#
1.7GHz#(Nexus#
10)#
Tegra#4#1.9#GHz# CoreKi5#1.7GHz#
(Ivy#Bridge)#
Geekbe
nch2
%perform
ance%
Figure 7.2 Comparison of mobile CPU and SoC performance
to reduce the number of o↵-chip memory accesses. Caches store most frequentlyused data in on-chip memory supporting fast access. Typically, each core has itsown instruction and data caches (L1 cache). The cores can also share a commonlarger cache (L2 cache).
In addition to multiple CPU cores, an additional low power CPU core hasbeen proposed to address low-intensity background tasks [5]. Nvidias Tegra 4features such a Battery Saver core that is optimized for low power. When thequad-core main CPU is not needed, the system switches to the Battery Savercore and completely switches o↵ the main CPU. The Battery Saver core has itsown L2 cache and the L2 cache used by the other cores can be power gated.
The ARM based SoCs use dedicated controllers for realizing di↵erent func-tions making them very di↵erent from the desktop PCs that rely on the asingle CPU for most of the work. The benefit of dedicated controllers is theire�ciency compared to software based implementations. The dedicated chipsand circuits can carry out the tasks more e�ciently and with fewer cycles thana software implementation. Indeed, it is not uncommon to first have softwarebased implementation of a process or algorithm, such as audio processingor graphics generation, that is then implemented in hardware for increasinge�ciency.

Dynamic Power Management
• Dynamic Power Management (DPM) is a design methodology for energy and power management of dynamically reconfiguring systems. The goal for a DPM system is to provide the requested services and performance with a minimum power consumption.
• DVFS (Dynamic Voltage and Frequency Scaling) – Minimizes power needs by trying to reduce the
operating frequency and the core voltage to levels sufficient to execute current tasks but with no excess resources left.
• DPS (Dynamic Power Switching) – DPS detects the true need of resource utilization in
a CPU and, if there are no current computational tasks, forces the CPU into minimal power state.

Work Idle Work Idle Work
DVFS DVFS DVFS DPS DPS
Time
Example of Dynamic Power Management

P and C States
• At processor level we can manage power consumption with two different strategies:
– Control of the CPU performance states using frequency and core voltage (P-states).
– Use of processor operating states (C-states). • The Advanced Configuration and Power Interface
(ACPI) specification is the industry standard solution for power management used by the desktop and laptop industry.
– Current smartphones use these states as well, but they are not based on ACPI.

Overview of P and C States
Higher voltage/
frequency
Lower voltage/frequency
C0 C1 C2 C3 C4 …
P states
C states
System is active mode
System is in idle mode
Highest power mode
Lowest power mode

Power Management Components
• A subsystem for connecting the low-level technologies and policies at higher level.
• A system of in-kernel policy governors. They are essentially pre-configured power schemes with the ability to modify the clock frequency according to required needs. Typically these governors use the P-states to to change frequencies for lower power consumption. They will switch between clock frequencies, on the basis of current CPU utilization level trying to save power while not unduly losing performance. The governors are tunable allowing some customizing of the frequency scaling.
• Drivers implementing the technology in a CPU-specific way.
P and C States: Example
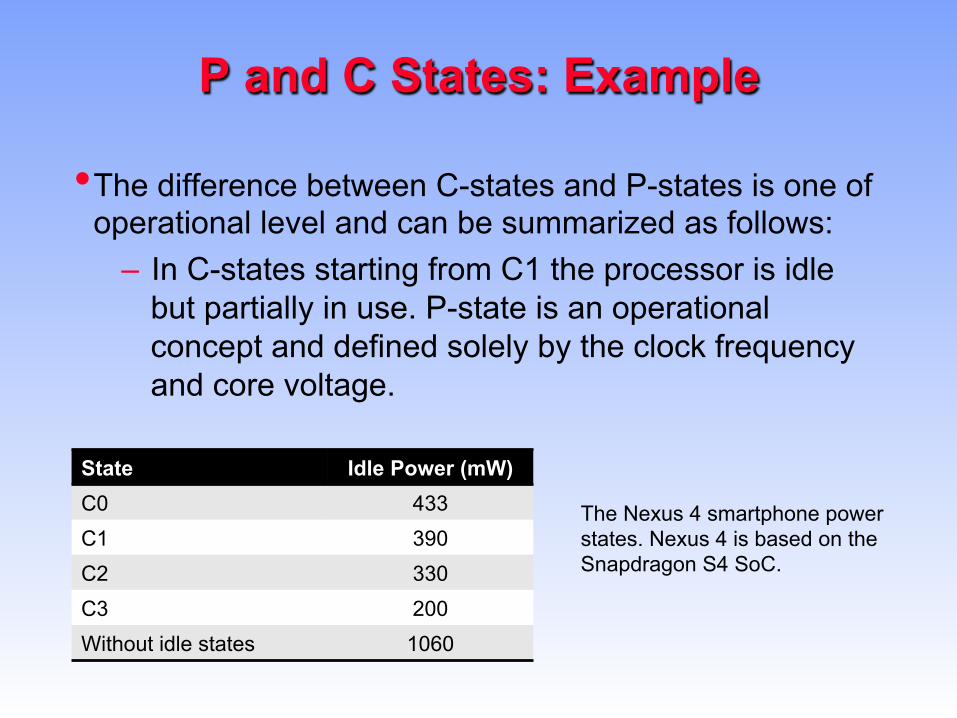
• The difference between C-states and P-states is one of operational level and can be summarized as follows:
– In C-states starting from C1 the processor is idle but partially in use. P-state is an operational concept and defined solely by the clock frequency and core voltage.
State Idle Power (mW) C0 433 C1 390 C2 330 C3 200 Without idle states 1060
The Nexus 4 smartphone power states. Nexus 4 is based on the Snapdragon S4 SoC.

Linux CPU Frequency Subsystem
• The Linux CPU frequency subsystem that has supported dynamic processor frequencies since the 2.6.0 Linux kernel.
• The CPUfreq subsystem uses governors and daemons for implementing a static or dynamic power management policy.
powersaved cpuspeed cpufreqd
User space governors and daemons
LINUX KERNEL (in-kernel governors)
performance
Cpufreq module (/proc and /sys interface)
userspace powersave ondemand

Governors
• Performance governor that gives the highest CPU frequency and performance. This governor statically sets the highest frequency value and allows the tuning of this highest value.
• Powersave governor that sets the lowest CPU frequency and system speed.
• Userspace governor that allows the CPU frequency to be set manually. The component can be used to implement custom power policies.
• Ondemand governor is an in-kernel governor to dynamically set the CPU frequency based on CPU utilization.
• Conservative governor is similar to the on demand governor, but allows a more gradual increase of the power consumption.

Lowest frequency
Highest frequency
Frequency
Time
Ondemand governor
Performance governor
Powersave governor
Example: Governors

Time resolution
• The default governors use millisecond resolution for decisions, the thresholds are specified in microseconds
• Userspace governor can be implemented with finer-grained granularity (microseconds)
• Intel Speedstep Technology can switch frequency with latency of 10 microseconds
• Faster sampling results in quicker response time for changes in the workload

Ondemand Governor • For each CPU:
– Every X milliseconds: • Get Utilization since last check • If utilization > UP_THRESHOLD
– Increase frequency to MAX
– Every Y milliseconds: • Get utilization • If utilization < DOWN_THRESHOLD
– Decrease frequency 20%
• Conservative is similar but more gradual increase • Used on many Android devices, for example Samsung
S4 • V. Pallipadi and A. Starikovskiy, “The Ondemand
Governor,” The Linux Symposium, 2006.

Linux cpufreq • cpufreq-info
– Info on the current governor and settings • cpufreq-set allows setting of:
– d minimum frequency, – u maximum frequency, – f specific frequency (userspace governor must be
set first) and – g governor on a – c specific CPU
• Cpufreq allows activating governors on every available CPU (and core)
• Can access /sys/devices/system/cpu/cpu0/cpufreq and /proc/cpuinfo on Android (as root)

Energy-aware scheduling
• Traditional schedulers do not take the multicore topology or energy issues into account
• Energy-aware aware schedulers – Distribute tasks across CPUs and cores to save
energy – Underlying topology affects the strategy – For example: cluster tasks on a high performance
CPU, then remaining CPUs can enter idle states
• Examples: ARM’s big.LITTLE, NVIDIA battery saver core, …

ARM big.LITTLE
• The ARM big.LITTLE is a computing architecture that combines slow and low-power processor cores with faster and more power demanding cores
• This architecture is used, for example, by Samsung Galaxy Note 3 and S4 smartphones (Exynos 5 Octa).
• Extends DVFS with CPU migration.
Interconnect
Cortex-A15
Cortex-A7
CPU CPU
L2 Cache
CPU
CPU
L2 Cache
Interrupt Control
Low performance tasks, always-on always connected High performance tasks
Seamless migration
big.LITTLE Models
• Clustered model, in which the OS scheduler observes one of the two processor clusters, and the scheduler transitions between the clusters based on the observed load.
• In-kernel switcher pairs a more powerful core with a less powerful core with the option of having many identical pairs on a chip. The active core is selected based on the load.
• Heterogeneous multi-processing (MP) enables the use of all physical cores simultaneously. High priority or computationally demanding threads are run by the powerful cores whereas low priority or less demanding threads are are run on the less powerful cores.

Big.LITTLE Experiments
• The framework allows seamless migration of tasks across the processor cores. The Cortex- A15-Cortex-A7 system is designed to migrate tasks between the processor clusters in less than 20 microseconds with 1GHz processors.
• ARM’s energy efficiency comparison of Cortex-A15 and Cortex-A7 indicates significant power savings with a variety of benchmarks.
• For example, the Dhrystone benchmark gives energy efficiency benefit of 3.5x for A7 with performance benefit of 1.9x for A15. This motivates the use of the slower processor for lightweight tasks.

GPUs • In modern smartphone designs graphics processing is typically
offloaded to the GPU that has a high performance graphics processing pipeline.
• The four well-known mobile GPUs are: – Adreno GPU in the Qualcomm’s Snapdragon line of SoCs. – PowerVR GPU used in TI’s OMAP line of SoCs. – Mali in the ARM architecture. – GeForce ULP (ultra low-power) in the Tegra line of SoCs
from Nvidia. • GPU can be used for generic processing. For example, a Gabor
face feature extraction algorithm was implemented with the Tegra GPU and OpenGL ES and the shader language.
– The resulting GPU based algorithm achieved a 4.25 times speedup compared to the CPU based version

Modelling the CPU
• We outline the development of simple power models for the smartphone SoC and CPU based on utilization and linear regression. The development of our simple model proceeds in the following phases:
– Design of training phase with different CPU loads. The loads should be realistic and reflect the real-life workloads on the device.
– Power measurement of the training loads on the smartphone. An external power monitor tool is typically used for high accuracy measurements.
– Creation of a power model for the CPU energy consumption.
• The training can model construction can happen offline, online or online with offline support.

Processor Power Model based on Counters
• Isci and Martanosi have proposed a power model for CPUs based on performance counters.
– They correlate hardware performance counters and system log with total power measurements with an external power monitor to obtain a fine-grained view of energy consumption of the CPU. A similar approach can be used to model GPUs
120 Smartphone Subsystems
with total power measurements with an external power monitor to obtain a fine-grained view of energy consumption of the CPU. A similar approach can be usedto model GPUs [20]. The monitored CPU components include the bus control, L1and L2 caches, bu↵ers, integer execution, floating point execution, and queues.The performance counter metrics were mapped to the CPU components.The model collects architectural statistics such as cycles per instruction, mem-
ory references, cache misses, and on-chip communication details together withthe application-level details to optimize performance and meet the desired energyand temperature goals. Given a CPU with N components, the ith componentdenoted by Ci, the model is based on component access rates given by a perfor-mance counter or a combination of performance counters. For CPU componentCi, the maximum power, MaxPower(Ci) and ArchitecturalScaling(Ci) are heuris-tics and estimated empirically.
P (Ci) = AccessRate(Ci)⇥ ArchitecturalScaling(Ci)⇥MaxPower(Ci) + (7.2)
NonGatedClockPower(Ci).(7.3)
The total power of the CPU is given by the following equation:
Ptotal =NX
i=1
P (Ci) + Idle power. (7.4)
7.1.12 Single Core Regression Model
Assuming a linear relationship between power consumption and CPU load, thelinear regression model would be the following:
Pcpu = a⇥ Ucpu + b, (7.5)
where a and b are constants, and Ucpu is CPU utilization. The latter term indi-cates the power consumption of the CPU. This simple model does not take theDVFS into account, but it can be extended to take the voltage and frequencyscaling into account.The power model can then be used in power estimation in predicting the
power consumption without power measurements. Following our example, giventhat CPU utilization is 20 % for a give duration T , we can determine the energyconsumption with Etotal = (a20+b)T . The energy consumption of an applicationthat uses the CPU in a dynamic manner can be determined with
Etotal =X
i
P icpu ⇥�T, (7.6)
where P icpu is the i-th measurement of CPU utilization and �T is the time
interval of the measurement.
C. Isci and M. Martonosi, “Runtime power monitoring in high-end processors: Methodology and empirical data,” in Proceedings of the 36th Annual IEEE/ACM International Symposium on Microarchitecture, 2003.

Single Core Regression Model
• Assuming a linear relationship between power consumption and CPU load, the linear regression model would be the following:
• Constants a and b are determined with regression • The energy consumption of an application that uses the
CPU in a dynamic manner can be determined with
• Given that CPU utilization is 20 % for a give duration T , we can determine the energy consumption with Etotal = (a20 + b)T.
120 Smartphone Subsystems
with total power measurements with an external power monitor to obtain a fine-grained view of energy consumption of the CPU. A similar approach can be usedto model GPUs [20]. The monitored CPU components include the bus control, L1and L2 caches, bu↵ers, integer execution, floating point execution, and queues.The performance counter metrics were mapped to the CPU components.The model collects architectural statistics such as cycles per instruction, mem-
ory references, cache misses, and on-chip communication details together withthe application-level details to optimize performance and meet the desired energyand temperature goals. Given a CPU with N components, the ith componentdenoted by Ci, the model is based on component access rates given by a perfor-mance counter or a combination of performance counters. For CPU componentCi, the maximum power, MaxPower(Ci) and ArchitecturalScaling(Ci) are heuris-tics and estimated empirically.
P (Ci) = AccessRate(Ci)⇥ ArchitecturalScaling(Ci)⇥MaxPower(Ci) + (7.2)
NonGatedClockPower(Ci).(7.3)
The total power of the CPU is given by the following equation:
Ptotal =NX
i=1
P (Ci) + Idle power. (7.4)
7.1.12 Single Core Regression Model
Assuming a linear relationship between power consumption and CPU load, thelinear regression model would be the following:
Pcpu = a⇥ Ucpu + b, (7.5)
where a and b are constants, and Ucpu is CPU utilization. The latter term indi-cates the power consumption of the CPU. This simple model does not take theDVFS into account, but it can be extended to take the voltage and frequencyscaling into account.The power model can then be used in power estimation in predicting the
power consumption without power measurements. Following our example, giventhat CPU utilization is 20 % for a give duration T , we can determine the energyconsumption with Etotal = (a20+b)T . The energy consumption of an applicationthat uses the CPU in a dynamic manner can be determined with
Etotal =X
i
P icpu ⇥�T, (7.6)
where P icpu is the i-th measurement of CPU utilization and �T is the time
interval of the measurement.

Single Core Regression Model with DVFS
• DVFS can significantly improve energy efficiency. • The effect of DVFS can be examined with the following
simple equation:
• where E gives the total energy of the workload, P is the average power over the workload, t is the execution time of the workload, Pidle is the idle power of the CPU, and tmax is the maximum running time of the workload over all frequencies.
7.2 Display 121
7.1.13 Single Core Regression Model with DVFS
DVFS can significantly improve energy e�ciency of the CPU. The obtainedbenefit depends on the idle power consumption of the CPU and the executiontime of the tasks with di↵erent CPU voltages and frequency levels. The e↵ect ofDVFS can be examined with the following simple equation [23]:
E = P ⇥ t+ Pidle ⇥ (tmax � t), (7.7)
where E gives the total energy of the workload, P is the average power overthe workload, t is the execution time of the workload, Pidle is the idle powerof the CPU, and tmax is the maximum running time of the workload over allfrequencies.
7.1.14 Multicore Regression Model
Yifan Zhang et al. studied the power modeling of multicore smartphone CPUsand they have identified that the traditional frequency and utilization basedregression techniques are prone to errors in the multicore setting [15]. Based onthis observation they developed a new regression based power model for multicoreCPUs based on the time spent in C states. This model builds on a model of asingle core working at frequency f that is the given by the following equation[15]:
Pcore =X
i
�Ci
⇥WEDCi
+ �U ⇥ U + c, (7.8)
where WEDCi
is the weighted average entry duration for idle state Ci, �Ci
and�U are coe�cients of WEDC
i
, U is the utilization rate, and c is a constant. Apower model is created by obtaining the coe�cients by linear regression on thetraining data with WEDC
i
and U , and the associated Pcore.The multicore model extends the above single core model and it is given by
[15]:
PCPU = PBL,NC
+N
CX
i
P�,core,Ui
,fi
, (7.9)
where NC is the number of cores, PBL,NC
is the baseline CPU power with NC
cores, and P�,core,Ui
,fi
is the power increment due to core i when running atfrequency fi with utilization of Ui. The term P�,core,U
i
,fi
can be predicted usingthe single core model (NC = 1) and with the measurement of the constantPBL,N
C
.
7.2 Display
Display is definitely one of the most energy-consuming components in a mod-ern mobile phone, especially now, when smartphones have started using touch-
A. Carroll and G. Heiser, “An analysis of power consumption in a smartphone,” in Proceedings of the 2010 USENIX conference.

Multicore Regression Model
• Yifan Zhang et al. studied the power modeling of multicore smartphone CPUs and they have identified that the traditional frequency and utilization based regression techniques are prone to errors in the multicore setting.
• Based on this observation they developed a new regression based power model for multicore CPUs based on the time spent in C states.
Y. Zhang, X. Wang, X. Liu, Y. Liu, L. Zhuang, and F. Zhao, “Towards better cpu power management on multicore smartphones,” in Proceedings of the Workshop on Power-Aware Computing and Systems, ser. HotPower ’13. New York, NY, USA: ACM, 2013.

Balancing Between Cores • Given that we have a high performance core and a
lower performance core for sensing tasks, it is clear that computationally heavy operations should be run on the high performance core.
• The low performance core, on the other hand, would be suitable for reading sensors and then handing over the data to the high performance core for intensive processing, such as speech recognition.
• Assuming that the low-cost processor is the most suitable for a specific computation stage i, we have the following bound for the slow-down of the stage:
7.4 Sensors 143
Sensor#hub#coKprocessor#
Sensing#applicaAons#
Sensor#interface#(OS#and#middleware)#
#Bus#
#AcceleraAon# #GPS#
#Temperature# Other#sensors#
Host#CPU#(maximize#sleep)## Sensor#hub#(alwaysKon)#
Figure 7.19 Overview of a sensor hub
Assuming that an application consists of N stages and that we have more thanone processor for running the stages, the central question is how to place thestages across the processors. The placement decision needs to take into accountthe energy characteristics of the processors as well as the processor wakeup andstage/task scheduling cost [50].Given that we have a high performance core and a lower performance core for
sensing tasks, it is clear that computationally heavy operations should be runon the high performance core. The low performance core, on the other hand,would be suitable for reading sensors and then handing over the data to the highperformance core for intensive processing, such as speech recognition.Assuming that the low-cost processor is the most suitable for a specific com-
putation stage i, we have the following bound for the slow-down of the stage[50]:
si <PMactive � PM
sleep
PLactive
+Etrans/PL
active
TMi
, (7.10)
where PMactive and PM
sleep are the power consumptions of the high performancemain core when in active and sleep states, respectively. In a similar fashion,PLactive is the power consumption of the low performance core, Etrans is the
transition cost for stage placement on the main core, and TMi is the execution
time of the stage on the main core.The slow-down factor is dependent on the hardware and on the computation.
For example, memory size of the processor, data parallel instruction sets, floating
M.-R. Ra, B. Priyantha, A. Kansal, and J. Liu, “Improving energy efficiency personal sensing applications with heterogeneous multi-processors,” in Proceedings of the 2012 ACM Conference on Ubiquitous Computing.

Supporting Continuous Sensing
• Continuous sensing involves the constant monitoring of onboard sensors, such as acceleration, microphone or camera. Thus continuous sensing burdens the processor and uses a lot of energy.
• Galaxy S4 smartphone that has a hardware chip for aggregating and optimizing sensor data gathering and processing.

Sensorhub
Sensor hub co-processor
Sensing applications
Sensor interface (OS and middleware)
Bus
Acceleration GPS
Temperature Other sensors
Host CPU (maximize sleep)
Sensor hub (always-on)

Smartphone Platform Overview

Android Linux
iOS Windows Phone 8 Firefox OS Symbian Series 60
Low-level power management
Linux Power Management iOS kernel Windows NT Linux Power Management (Gonk)
Kernel-side framework with power API (Power Manager), peripheral power on/off
High-level power management
Java class PowerManager, JNI binding to OS. Key methods: goToSleep(long), newWakeLock(…), userActivity(long…) BatteryStats monitors energy consumption and uses device specific subsystem models.
I/O Framework
Run-time power management framework
Gaia (OS Shell) Gecko runtime: Power Management Web API is non-standard and reserved for pre-installed applications
Applications use domain manager that follows system-wide power-state policies. Nokia Energy Profiler API
Energy conservation patterns
Wake lock (partial, full) is used to ensure that device stays on. Methods: Create, acquire, release, sensor batching
Coding patterns, multitasking API (since iOS 4), push API, coalesced updates (since iOS7)
Multitasking API (tasks and push notification), asynchronous events
Asynchronous events (system messages) Resource lock in Power Management API
Active object, wakeup events, resource and domain manager
Policies Wake lock specific flags and policies, system-wide power setting
Internal, multitasking API (since iOS4)
Internal Gonk and Gecko level
Domain manager for system-wide and domain-wide policy. Domain-specific policies are possible
Battery information
The BatteryManager class contains strings and constants for different battery related notifications that applications can subscribe to, includes: battery level, temperature, voltage
iOS 3 and later: UIDevice Class allows to query/subscribe battery info
Battery class provides the battery level, remaining operating time, and an event when battery is below 1%.
W3C Battery Status API
Battery API (charge level, external power). Nokia Energy Profiler

Name / Authors Year Purpose
PowerScope 1999 Energy profiling of device and processes
Joule Watcher 2000 Fine-grained thread-level profiling
Nokia Energy Profiler
2006-2007 On-device standalone profiler
Shye et al. 2009 Energy profiling of device and components with a logger application
PowerTutor 2009 Hybrid profiler based on PowerBooter
PowerBooter 2009-2010 Short-term power model for components
BattOr 2011 Portable power monitor
Sesame 2011 Self-constructive on-device power model for device and components
PowerProf 2011 Self-constructive API-level power profiler
MobiBug 2011 Automatic diagnosis of application crashes
Carat 2012-2013 Application energy profiling and debugging
eProf 2012 Fine-grained power model for device, components and applications
DevScope 2012 Self-constructive power model for device and components
AppScope 2012 Fine-grained energy profiler for applications based on DevScope
eDoctor 2012 Automatic diagnosis of battery drain problems
V-Edge 2013 Self-constructive power model for device and components
Power Profilers

PowerTutor

Computation Offloading
• Based on material contributed by Matti Siekkinen, Eemil Lagerspetz and Juhani Toivonen

Environment
!"#$%&'
(#)*"+'!"#$%'#,#-%*./'
&01+%$"*./'
&1-2*./'
2+3"*0-4#.'
0-01*./'
Access network
Web services

What is offloading?
• Consider apps designed and implemented to be run on standalone mobile OS
• Execute part of the application code in a remote machine
Smartphone
Offloading framework
app
app app
app
app
app
Remote server (Cloud)
Offloading framework
app
app app
Mobile OS Mobile OS
Virtualization
callMethod()
return result

Offloading work to save energy • Main objective is to save energy
– Tradeoff: less computing with some extra communication – Transfer state back and forth between smartphone and
cloud
• Often involves dynamic decision making because the tradeoff
is not constant • May also improve other performance metrics (response time)
– High performance computing in cloud
Energy for communication
Energy for computation
• The offloading of a mobile computing task is a trade-off between the energy used for local processing and the energy required for offloading the task, uploading its data, and downloading the result, if necessary.
• One can express the offloading energy trade-off as follows:
– Etrade = Elocal − Edelegate > 0, where Elocal is the energy used for complete local execution, and Edelegate is the energy used if the task is offloaded from the perspective of the mobile device.
• If Etrade is greater than zero, then there is an energy benefit for delegating the task to the cloud.
Offloading
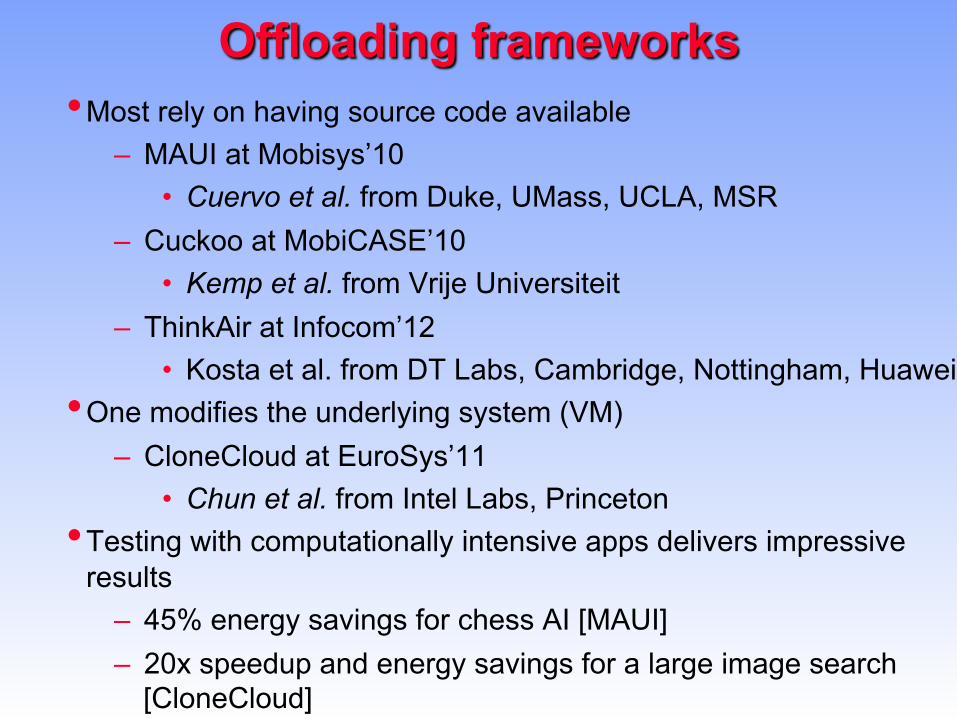
Offloading frameworks • Most rely on having source code available
– MAUI at Mobisys’10 • Cuervo et al. from Duke, UMass, UCLA, MSR
– Cuckoo at MobiCASE’10 • Kemp et al. from Vrije Universiteit
– ThinkAir at Infocom’12 • Kosta et al. from DT Labs, Cambridge, Nottingham, Huawei
• One modifies the underlying system (VM) – CloneCloud at EuroSys’11
• Chun et al. from Intel Labs, Princeton • Testing with computationally intensive apps delivers impressive
results – 45% energy savings for chess AI [MAUI] – 20x speedup and energy savings for a large image search
[CloneCloud]

• Content processing and transformations – Example: Javascript processing in OperaMini
• Completion notification and mobile push • Application execution
– Google docs, Windows Office • Connection management
– BitTorrent! – Large downloads
• Speech recognition – Siri
• Positioning (A-GPS) • NVIDIA cloud enhanced 3D graphics
What can be offloaded?

• Implemented with Dessy: mobile desktop search • To offload indexing
– Transmit entire file to the cloud service – Wait for response – Receive file summary
• High energy savings can be obtained when offloading CPU-intensive tasks
• With N900 and WLAN 700kB/s: 96.5% savings! – 200 000 words, 1 MB file – With WLAN 100kB/s this is reduced to 83.7%
Example of Offloading: Indexing

Fig. 1. The offloading destinations from the point of view of the mobiledevice.
scheme. This includes offloading to the Dessy Cloud servicevia UMTS/GPRS mobile Internet or via IEE 802.11 WLAN, aswell as using Scavenger to offload computation to surrogatespresent in the WLAN. In the absence of Internet connectivityin the local WLAN, represented by a dotted line in the Figure,the local surrogates may still be used for Scavenger-basedoffloading.
In the absence of any surrogates, if the WLAN is connectedto the Internet, cloud offloading is possible. As we willsee below, the choice of the optimal offloading method andcommunication technology depends mostly on the upload rateof the N900 and the energy cost of transmitting.
From the mobile device’s perspective, offloading indexingconsists of uploading a document for indexing, waiting forthe result to become ready, and downloading the result. In theexperiments, the energy consumed by the entire transaction ismeasured.
In the experimental setup, we used the Nokia N900 mobiledevice, with Bluetooth and FM radio disabled. The energy usewas measured using a Monsoon Power Monitor device2. ThePower Monitor allows recording of (time, current, voltage)-tuples at a sample rate of 5 kHz. Internally, the device is ableto measure at 50 kHz, and the recorded samples are averagesof 10 measurements each.
The N900 device was powered through the Power Mon-itor using a fake battery. No USB cable was connected tothe N900 during the experiments. Figure 2 shows the MonsoonPower Monitor and the N900 along with the fake battery. Theinput voltage was set to 4 V. The formula to obtain mWhvalues from the current, voltage and time tuples is
E = I ⇥ U ⇥ t/3600, (1)
where E is the energy in mWh, I is the current in mA, Uis the voltage in V , and t is the time in seconds. The PowerMonitor gave a steady voltage of 4V in all of the experiments.We will therefore use mAh values in the rest of this paper,
2http://msoon.com/LabEquipment/PowerMonitor/
Fig. 2. The Power Monitor, powering the N900 through a fake battery.
omitting U from the formula above. To obtain mWh values,one can just multiply the mAh value by 4. Note that the PowerMonitor records current in mA.
Every experiment run proceeded in the following manner:
1) The experiment script was started and the N900 screenis turned off
2) Measurement was started in Monsoon PowerTool3) Several seconds of idle time elapsed4) The N900 started an upload of the chosen file to the
target server using the chosen communication method5) The N900 finished the upload and started waiting for
the result to be ready6) The N900 downloaded the result7) The experiment script finished8) Several seconds of idle time elapsed9) Measurement was stopped in Monsoon PowerTool
The idle time was used to find the beginning and endof the active experiment time in the measured data. When
53
Dessy Offloading
Cloudlets on a network
Constructed from clip art from pixabay.com
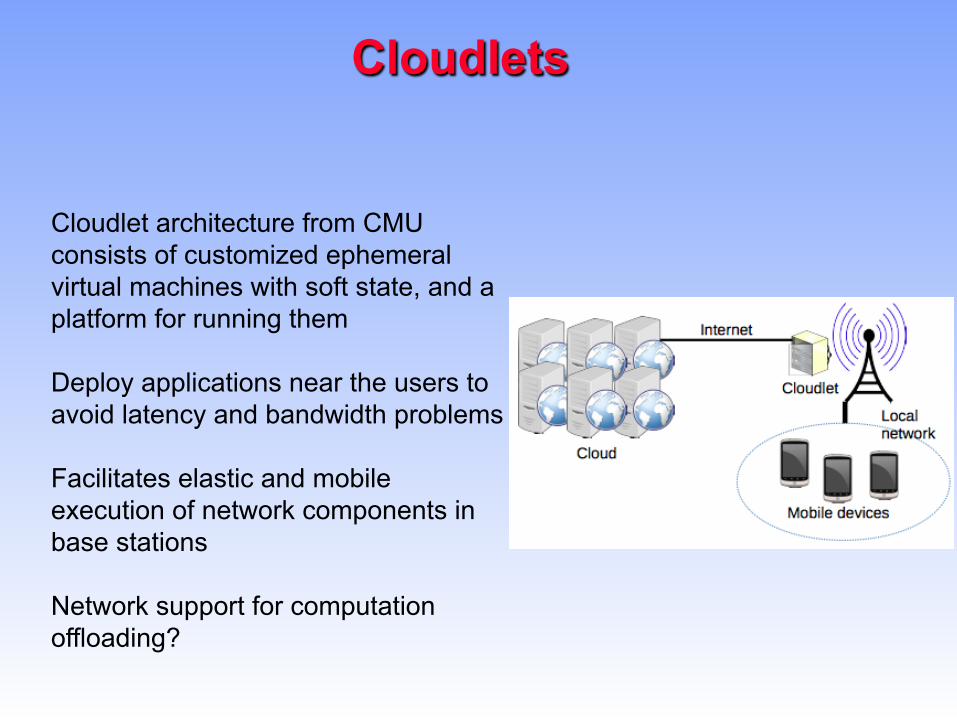
Cloudlets
Cloudlet architecture from CMU consists of customized ephemeral virtual machines with soft state, and a platform for running them Deploy applications near the users to avoid latency and bandwidth problems Facilitates elastic and mobile execution of network components in base stations Network support for computation offloading?