overview of commercial (depository) banking and · pdf filecrisis was difficult for the...
TRANSCRIPT
Overview of Commercial (Depository)
Banking and Industry Conditions
Darryl E. Getter
Specialist in Financial Economics
May 3, 2016
Congressional Research Service
7-5700
www.crs.gov
R44488

Overview of Commercial (Depository) Banking and Industry Conditions
Congressional Research Service
Summary A commercial bank is an institution that obtains either a federal or state charter that allows it to
accept federally insured deposits and pay interest to depositors. In addition, the charter allows
banks to make residential and commercial mortgage loans; to provide check cashing and clearing
services; to underwrite securities that include U.S. Treasuries, municipal bonds, commercial
paper, and Fannie Mae and Freddie Mac issuances; and to conduct other activities as defined by
statute, namely the National Banking Act. Commercial banks are limited in what they can do. For
example, the Glass-Steagall Act separates commercial banking (i.e., activities that are permissible
for depository institutions with a bank charter) from investment banking (i.e., activities that are
permissible for brokerage firms, which do not include taking deposits or providing loans).
Congressional interest in the financial conditions of depository banks, or the commercial banking
industry, has increased in light of the financial crisis that unfolded in 2007-2009, which resulted
in a large increase in the number of distressed institutions. Providing credit during the financial
crisis was difficult for the banking system. Thus, an analysis of post-financial crisis trends that
pertain to lending activity may provide some useful insights about recovery of the banking
system. The financial condition of the banking industry can be examined in terms of profitability,
lending activity, and capitalization levels (to buffer against the financial risks). This report
focuses primarily on profitability and lending activity levels. Issues related to higher bank
capitalization requirements are discussed in CRS Report R42744, U.S. Implementation of the
Basel Capital Regulatory Framework, by Darryl E. Getter.
The banking system generally has substantially more small banks (i.e., those with $1 billion or
less in assets) relative to larger size banks. For several decades, bank assets have increased while
the number of banking institutions has decreased. The banking industry continues consolidating,
with more of the industry’s assets held by a smaller number of institutions.
Generally speaking, by most measures, the health of the banking system has improved since
2009. There are fewer problem banks since the peak in 2011, as well as fewer bank failures in
comparison to the peak amount of failures in 2010. The return on assets (RoA) and return on
equity (RoE) for the banking industry, expressed as percentages, have rebounded since the
financial crisis. Although RoA and RoE have not returned to pre-recessionary levels, the range of
percentages that should be associated with optimal performance of the banking system is
subjective.
The banking system currently has increased its capital reserves that have been designated to
buffer against unforeseen macroeconomic and financial shocks. The banking system also has
loan-loss reserves to sufficiently cover losses expected to be uncollectible. For loans that are
noncurrent (delinquent) but have not yet gone into default, however, the banking system still
needs to rebuild this loan-loss capacity if such loans do become uncollectible. Hence, news of
industry profitability should be tempered by the news that aggregate loan-loss provisions still
must increase to sufficiently buffer against noncurrent loans.

Overview of Commercial (Depository) Banking and Industry Conditions
Congressional Research Service
Contents
Introduction ..................................................................................................................................... 1
The Basics of Commercial (Depository) Banking .......................................................................... 2
Commercial Bank Market Structure and Asset Distribution ..................................................... 3 An Overview of Capital (Equity) Regulation ........................................................................... 5
Recovery from the 2007-2009 Recession ........................................................................................ 6
Post-Recession Lending Activity .................................................................................................. 10
Revenue Composition by Bank Size ............................................................................................. 12
Conclusion ..................................................................................................................................... 15
Figures
Figure 1. FDIC-Insured Institutions by Number of Institutions ...................................................... 4
Figure 2. FDIC-Insured Institutions by Asset Size .......................................................................... 5
Figure 3. FDIC Problem List and Assets of Distressed Institutions ................................................ 7
Figure 4. Return on Assets and Return on Equity ........................................................................... 8
Figure 5. Net Charge-Offs, Noncurrent Assets, ALLL Proxy, and Coverage Ratio ........................ 9
Figure 6. Asset Growth Rate .......................................................................................................... 11
Figure 7. Composition of Industry Assets ..................................................................................... 12
Figure 8. Net Interest Margins (Spreads) by Bank Asset Size Categories .................................... 14
Figure 9. Percentage of Non-Interest Income by Bank Size Asset Categories .............................. 15
Contacts
Author Contact Information .......................................................................................................... 16
Acknowledgments ......................................................................................................................... 16
Overview of Commercial (Depository) Banking and Industry Conditions
Congressional Research Service 1
Introduction A commercial or depository bank is typically a corporation that obtains either a federal or state
charter to accept federally insured deposits and pay interest to depositors. Commercial banks also
make residential and commercial mortgage loans, consumer loans, provide check cashing and
clearing services, and may underwrite securities, including U.S. Treasuries, municipal bonds,
Fannie Mae and Freddie Mac issuances, and commercial paper (unsecured short-term loans to
cover short-term liquidity needs). The permissible activities of depository banks are defined by
statute, namely the Glass-Steagall Act.1 By contrast, investment banks (or brokerage firms) are
not allowed to accept federally insured deposits, and they do not make loans (i.e., a debt
obligation owed to a single lending source). Instead, investment banks receive commissions to
facilitate corporate mergers and corporate issuances of securities, such as corporate stocks and
bonds (i.e., borrowing from the public).2
Congressional interest in the financial conditions of depository banks, also referred to as the
commercial banking system, has increased following challenging economic conditions and
changes in the regulatory environment. Specifically, the recession that began in December 2007
and ended in 2009 is frequently referred to as the Great Recession in part due to the financial
crisis that unfolded.3 Both large and small banking institutions experienced losses related to the
declining asset values (of mortgage-related assets), resulting in a substantial increase in bank
failures.4
Consequently, higher prudential requirements for U.S. banking institutions were implemented.
The Basel Committee on Banking Supervision, which provides an international consensus
framework to promote internationally consistent bank prudential regulatory standards, adopted
the third Basel Accord that was subsequently adopted by U.S. federal banking regulators.5 In
addition, Congress passed the Dodd-Frank Wall Street Reform and Consumer Protection Act of
2010 (P.L. 111-203, 124 Stat. 1376), which also contained enhanced prudential regulatory
requirements for financial institutions. Hence, the challenge for the banking industry is to
determine the sustainable amount of financial (lending) risk-taking while simultaneously facing
1 The Glass-Stegall Act (GSA) is part of the Banking Act of 1933, specifically Sections 16, 20, 21, and 32, 48 Stat.
162. Sections 20 and 32 of the GSA were repealed by the Gramm-Leach-Bliley Act of 1999, P.L. 106-102, to allow for
bank holding companies. Commercial banking and brokerage activities, however, must still occur in separate
subsidiaries of a bank holding company. See, Permissible Securities Activities of Commercial Banks Under the Glass-
Steagall Act (GSA) and the Gramm-Leach-Bliley Act (GLBA), by David H. Carpenter and M. Maureen Murphy. 2 Underwriting in banking refers to two types of activities. Loan underwriting occurs when a bank performs a (default)
risk assessment of a potential borrower to determine whether to extend credit (loanable funds), the amount, and how
much to charge the borrower. Securities underwriting occurs when a bank agrees to take on the risk of distributing
securities (in the form of bonds or stocks) of another entity that wishes to attract outside investors to provide funding.
If, however, the bank is unable to find enough interested investors, then it retains any unsold securities and assumes the
default risk associated with the entity. The remaining provisions of the GSA still restrict the securities underwriting
activities of depository banks. Depository banks and depository subsidiaries of bank holding companies may
underwrite federal, state, and local government securities, as well as the securities guaranteed by federal or state
governments; but they are not allowed to underwrite corporate debt or equity securities. 3 See “U.S. Business Cycle Expansions and Contractions,” National Bureau of Economic Research, at
http://www.nber.org/cycles.html; and “The Financial Crisis Timeline,” Federal Reserve Bank of St. Louis, at
https://www.stlouisfed.org/Financial-Crisis. 4 See CRS InFocus CRS In Focus IF10055, Bank Failures and the FDIC, by Raj Gnanarajah. 5 For more information on the Basel Committee of Banking Supervisors and the Basel III Accord, see
http://www.bis.org/ and CRS Report R42744, U.S. Implementation of the Basel Capital Regulatory Framework, by
Darryl E. Getter.

Overview of Commercial (Depository) Banking and Industry Conditions
Congressional Research Service 2
higher costs associated with greater financial risk-taking (i.e., compliance with prudential
regulations designed to minimize the severity of financial distress under deteriorating
macroeconomic conditions).
This report begins with a general overview of the banking industry. It describes how banks
facilitate the financial intermediation process as well as the associated financial risks. It also
explains the market structure of the banking industry, referring primarily to the asset distribution.
Next, this report summarizes profitability and lending activity levels in the banking industry.
Particular attention is paid to metrics related to capitalization levels, asset performance, and
earnings of depository banks.
The Basics of Commercial (Depository) Banking Financial intermediation is the process of matching savers, who are willing to lend funds to earn a
future rate of return, with borrowers, who are in need of funds to make transactions. It is
expensive for savers to locate, underwrite, and monitor repayment behavior of borrowers.
Similarly, it is expensive for borrowers to locate a sufficient amount of savers with funds and
favorable lending terms. Hence, banks develop expertise in intermediation, or facilitating the
transfer of funds from savers to borrowers.6
The typical intermediation transaction made by commercial banks provides loans to borrowers at
higher rates than the cost to borrow the funds from savers, who provide loanable funds in the
form of bank deposits. Generally speaking, banks (as well as numerous lenders or financial
institution types) profit from the spread between the rates they receive from borrowers and the
rates they pay to depositors.7
Financial intermediation, however, involves risk. Banks face the risk that borrowers will default
on their loans, making it more difficult to repay depositors. In addition, banks face funding or
liquidity risk stemming from more frequent movements in short-term interest rates. Banks must
have access to an uninterrupted source of short-term funding (deposits) until their long-term loans
are fully repaid. Consequently, greater variability in short rates may translate into variable profit
spreads. Furthermore, depositors could suddenly and simultaneously decide to withdraw their
deposits, perhaps due to a sudden change in economic conditions or even speculation about
deteriorating economic conditions, resulting in financial distress for one bank or several banks.8
Hence, bank profitability and financial risk are inextricably linked.
In addition to default and funding risks, financial intermediation increases borrowers’
vulnerability to economic downturns. During business cycle booms, lenders may grow optimistic
and increase credit availability as if the ideal economic and financial market conditions will
persist.9 The trade-off (or costs) associated with greater lending is a greater likelihood of severe
financial distress if macroeconomic conditions were to deteriorate. In other words, recessions that
occur when individuals have more loan repayment obligations (or are more leveraged financially)
6 Other institutions such as credit unions, pension funds, or hedge funds also engage in the financial intermediation
matching process. 7 The spread is also referred to at the net interest margin, discussed later in this report. 8 This phenomenon is known as a bank run. The federal deposit insurance system in the United States was established
in the 1930s to insure deposits, which helps to sustain public confidence and avoid runs on U.S. banks. See CRS Report
R41718, Federal Deposit Insurance for Banks and Credit Unions, by Darryl E. Getter. 9 See Hyman P. Minsky, The Financial Instability Hypothesis, The Jerome Levy Economics Institute, Working Paper
no. 74, May 1992.

Overview of Commercial (Depository) Banking and Industry Conditions
Congressional Research Service 3
are likely to be more arduous, in particular if these borrowers suddenly face lower income
prospects (via job losses or pay cuts).
Bank Balance Sheet Definitions
The following balance sheet terminology is used throughout the report.
Bank assets include long-term consumer, residential, and commercial loans that banks originate as well as
cash and other loans in the form of financial securities (such as Treasury bonds and municipal bonds) that
they are permitted to hold in their asset portfolios. Bank assets will generate earnings (revenues) or losses,
depending upon whether customers repay or default on their loans and whether the issuers of the
securities held in bank portfolios repay their debt obligations.
Bank liabilities include the funds that they borrow. When customers (depositors) make savings or checking deposits into a bank, the bank is essentially borrowing those funds for short periods of time in order to
lend them out for longer periods of time. The interest paid for these borrowings are, therefore, the costs
incurred by the bank to obtain the funds necessary to originate new loans.
Bank capital is the difference between the value of assets and liabilities. Bank capital includes items such as common shareholder equity, retained earnings, and provisions set aside for loan and lease losses.
Commercial Bank Market Structure and Asset Distribution
Assets in the banking industry are not evenly distributed, meaning that banking firms are not
identical and, for some metrics, must be analyzed separately to get a more accurate assessment of
financial conditions. Using data from the Federal Deposit Insurance Corporation (FDIC), Figure
1 shows the number of U.S. banks since 2000 by size categories of bank asset holdings: less than
$100 million, $100 million-$1 billion, $1 billion-$10 billion, and greater than $10 billion.
Community banks have traditionally been considered institutions with total assets at or below $1
billion; however, some institutions with $10 billion in total assets may be considered community
banks.10
At the other extreme are the large financial institutions that have $10 billion or more in
assets. The number of banks with more than $10 billion in assets has remained relatively
constant, ranging from 101 to 107 institutions between year-end 2000 and 2015.
As of 2015, the FDIC reports that total industry assets were $15,967.92 billion.11
For several
decades, bank assets have increased while the number of banking institutions has decreased. The
smallest of the community banks, those with less than $100 million in assets, have accounted for
most of the industry consolidation even prior to the 2007-2009 recession.
10 An alternate and more extensive definition of a community bank is associated with its functions as opposed to its
asset size. See Federal Deposit Insurance Corporation (FDIC), FDIC Community Banking Study, Washington, DC,
December 2012, at http://www.fdic.gov/regulations/resources/cbi/report/cbi-full.pdf. 11 See FDIC Quarterly Banking Report, at https://fdic.gov/bank/analytical/qbp/qbpmenu.html.

Overview of Commercial (Depository) Banking and Industry Conditions
Congressional Research Service 4
Figure 1. FDIC-Insured Institutions by Number of Institutions
2000-2015
Source: Created by CRS using Federal Deposit Insurance Corporation (FDIC) data.
Notes: The number of institutions holding $10 billion or more in assets appears as the smallest bars sitting on
the horizontal axis, ranging from 101to 107 over the entire period.
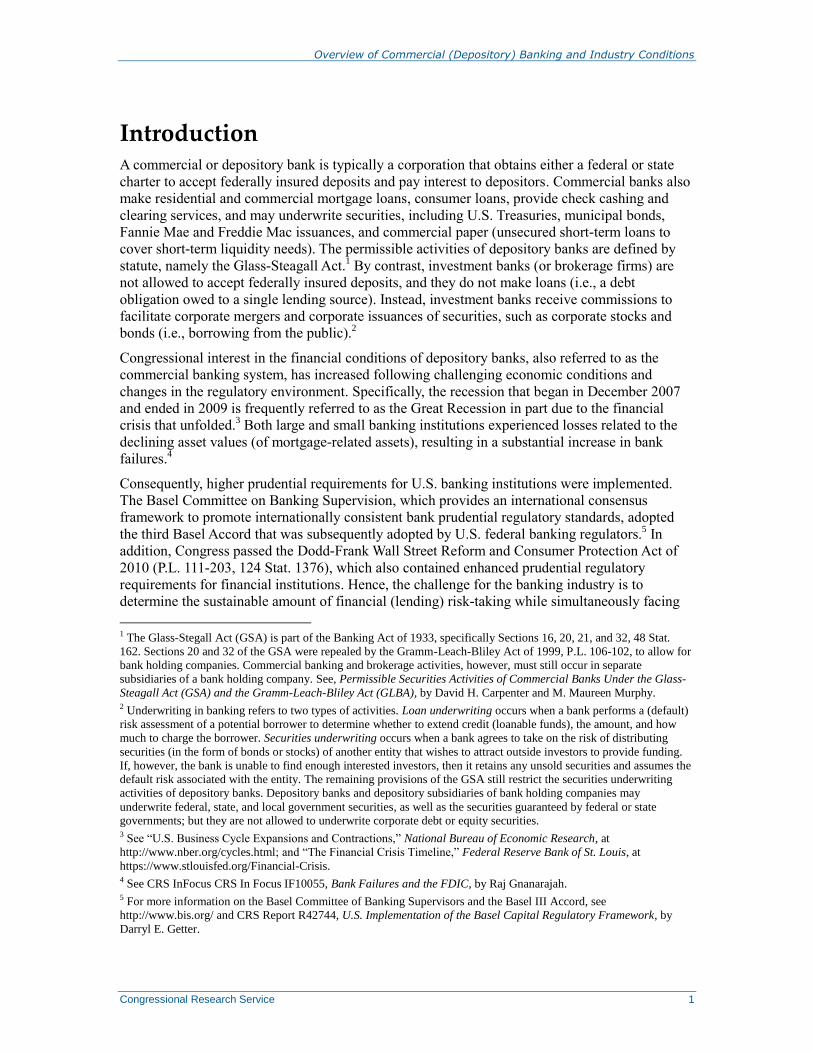
Figure 2 shows the same bank asset categories by asset size rather than by number of institutions.
Banking institutions with less than $100 million in assets collectively hold approximately 1% of
all industry assets. In contrast, banks with more than $10 billion in assets collectively hold
approximately 80% of all industry assets. With this in mind, it can be challenging for industry
analysts to determine whether the banking industry should be viewed as one competitive industry
or as numerous firms with characteristics similar to monopolists. Even though banks generally
accept deposits and take loans, it is unclear the extent that small banks compete with large banks
and for what types of financial services; small banks compete with each other because of their
focus on specialized lending and geographical limitations; or large banks compete with each other
or maintain focus on specialized financial services.12
12 For example, a large bank may have a large student loan operation whereas another large bank may have a large
credit card operation. Midsize banks ($2 billion to $10 billion) may choose to do small scale commercial real estate
lending in comparison to larger banks ($10 billion or greater) that may choose to provide financing for multi-family
apartment buildings and hospitals. Small or community banks, however, are more likely to make less complex business
loans in comparison to large banks that might arrange a loan participation (syndication) structure. Loan participations
allow multiple institutions to jointly provide financing for large-scale, complex projects. See Rachel Witkowski, “Small
Banks Slowly Reconsidering Loan Participations,” American Banker, March 14, 2012.
Overview of Commercial (Depository) Banking and Industry Conditions
Congressional Research Service 5
Figure 2. FDIC-Insured Institutions by Asset Size
2000-2015
Source: Created by CRS using FDIC data.
Notes: The institutions holding $100 million or less in assets appear as the smallest bar below the dots.
An Overview of Capital (Equity) Regulation
Banking regulators (i.e., the Office of the Comptroller of the Currency, the Federal Reserve, the
FDIC, and state banking regulators) require U.S. banking institutions that accept federally insured
deposits to comply with safety and soundness regulations, which are designed to monitor and
buffer against the types of financial intermediation risks that can result in financial distress for
banks and the broader economy.13
Asset (loan) defaults are less likely to result in the inability of a
bank to repay its shorter-term obligations to its creditors (and especially its insured depositors) if
sufficient capital is maintained to absorb the losses. If a bank’s capital falls below minimum
regulatory threshold levels, it would be considered undercapitalized and faces the prospect of
being shut down by its regulator, which appoints the FDIC14
as the receiver of the insolvent
13 See CRS Report R43087, Who Regulates Whom and How? An Overview of U.S. Financial Regulatory Policy for
Banking and Securities Markets, by Edward V. Murphy. 14 When a bank fails, the FDIC typically closes the institution and administers the repayment of depositors. See CRS
Report R41718, Federal Deposit Insurance for Banks and Credit Unions, by Darryl E. Getter.

Overview of Commercial (Depository) Banking and Industry Conditions
Congressional Research Service 6
institution. Hence, compliance with regulatory capital requirements implies that capital reserves
must grow proportionately with bank asset (lending) portfolios.15
The abatement of financial risk, however, may curb lending activity. As previously mentioned,
recessions are likely to be milder when fewer loan repayment obligations are outstanding; but the
trade-off may be fewer loans, translating into fewer transactions that could possibly spur more
robust expansions. Consequently, determining the optimal amount of financial intermediation risk
for the banking system to take while simultaneously trying not to undermine economically
stimulative lending activity is often a regulatory challenge.
Recovery from the 2007-2009 Recession After 2007, the banking system saw unusually high numbers of distressed institutions, with
failures at rates not seen since the savings and loan crisis that began in the 1980s and lasted
through the early 1990s.16
The number of banks that failed, or fell substantially below their
minimum capital reserve requirements, increased as the financial crisis of 2008 unfolded. No
banks failed in 2005 and 2006, and three bank failures occurred in 2007.17
In contrast, the FDIC
administered 489 bank failures over the 2008-2013 period.18
The FDIC maintains a problem bank list, which lists banks at risk of failure because their capital
reserves have fallen below regulatory minimum levels (but perhaps not yet far enough below to
be shut down). The number of depository institutions on the FDIC’s problem list spiked
beginning in 2008 and peaked at 888 in the first quarter of 2011. Figure 3 shows the number of
problem banks and the total assets of those banks relative to the total assets of the entire banking
system. The chart suggests that problem banks were primarily small institutions because of the
small share of total banking assets they held.
15 Regulators require banks to maintain minimum capital-asset ratio levels, thus maintaining the proportional growth of
assets and capital. Capital-asset ratios are computed by placing a financial institution’s total capital in the numerator of
the ratio and then dividing by its total assets, which are usually weighted by degree of default risk. Note that this
analysis will focus primarily on the component of capital most closely associated with loan losses rather than discuss
the more complex aspects of capital regulation. See Douglas J. Elliot, “A Primer on Bank Capital,” The Brookings
Institution, January 28, 2010, at http://www.brookings.edu/~/media/research/files/papers/2010/1/
29%20capital%20elliott/0129_capital_primer_elliott.pdf; and CRS Report R42744, U.S. Implementation of the Basel
Capital Regulatory Framework, by Darryl E. Getter. 16 See FDIC, Division of Research and Statistics, Chapter 4: The Savings and Loan Crisis and Its Relationship to
Banking, History of the Eighties—Lessons for the Future: An Examination of the Banking Crises of the 1980s and
Early 1990s, Washington, DC, at http://www.fdic.gov/bank/historical/history/167_188.pdf. 17 See FDIC Quarterly Banking Report as of December 31, 2009, at http://www2.fdic.gov/qbp/2009dec/qbp.pdf. 18 See FDIC Quarterly Banking Report as of December 31, 2013, at http://www2.fdic.gov/qbp/2013dec/qbp.pdf.

Overview of Commercial (Depository) Banking and Industry Conditions
Congressional Research Service 7
Figure 3. FDIC Problem List and Assets of Distressed Institutions
2000-2015
Source: Created by CRS using FDIC data.
Notes: The “Total Assets” line represents the aggregate assets for all FDIC-insured banking institutions.
The industry has returned to profitability since the recession. Return on assets (RoA) and return
on equity (RoE) are commonly used metrics to gauge bank profitability. RoA is computed with
net revenue (i.e., total revenue minus total expenses) in the numerator and average total assets in
the denominator. The RoA measures the financial return of a bank’s average assets or lending
activities. Because the banking industry relies heavily upon borrowed liabilities to fund assets, the
ratio’s numerator would be significantly smaller than the denominator; therefore, a RoA of
approximately 1% is considered profitable.19
RoE is computed with net income in the numerator
and the total amount of common shareholder equity in the denominator. The RoE is a measure of
financial return for shareholders. Unlike RoA, RoE does not have a barometer of “acceptable”
performance because it can increase due to either asset profitability or depleting capital positions,
making it difficult to establish a benchmark standard.20
Nonetheless, double-digit RoE returns
such as those prior to the recession tend to be more acceptable for shareholders.
The FDIC reported industry declines in both RoA and RoE during the 2007-2009 recession as the
numerators of both ratios fell even faster than their denominators. The negative returns coincided
19 See Ricki Helfer, chairman of FDIC, “On the Release of the Quarterly Banking Profile,” Speech at Federal Deposit
Insurance Corporation, Washington, DC, September 12, 1995, at http://www.fdic.gov/news/news/speeches/archives/
1995/sp12sept95.html. 20 See European Central Bank, Beyond RoE—How to Measure Bank Performance, Appendix to the Report on EU
Banking Structures, Germany, September 2010, at http://www.ecb.europa.eu/pub/pdf/other/
beyondroehowtomeasurebankperformance201009en.pdf.

Overview of Commercial (Depository) Banking and Industry Conditions
Congressional Research Service 8
with the wave of loan defaults that also occurred during the recession, which led to the
deterioration of capital, increases in the number of banks on the FDIC’s problem list, and
increases in bank failures. The RoA and RoE measures, which are illustrated in Figure 4, have
exhibited a reversal in course since the recession.
Figure 4. Return on Assets and Return on Equity
2000-2015
Source: Created by CRS using FDIC data.
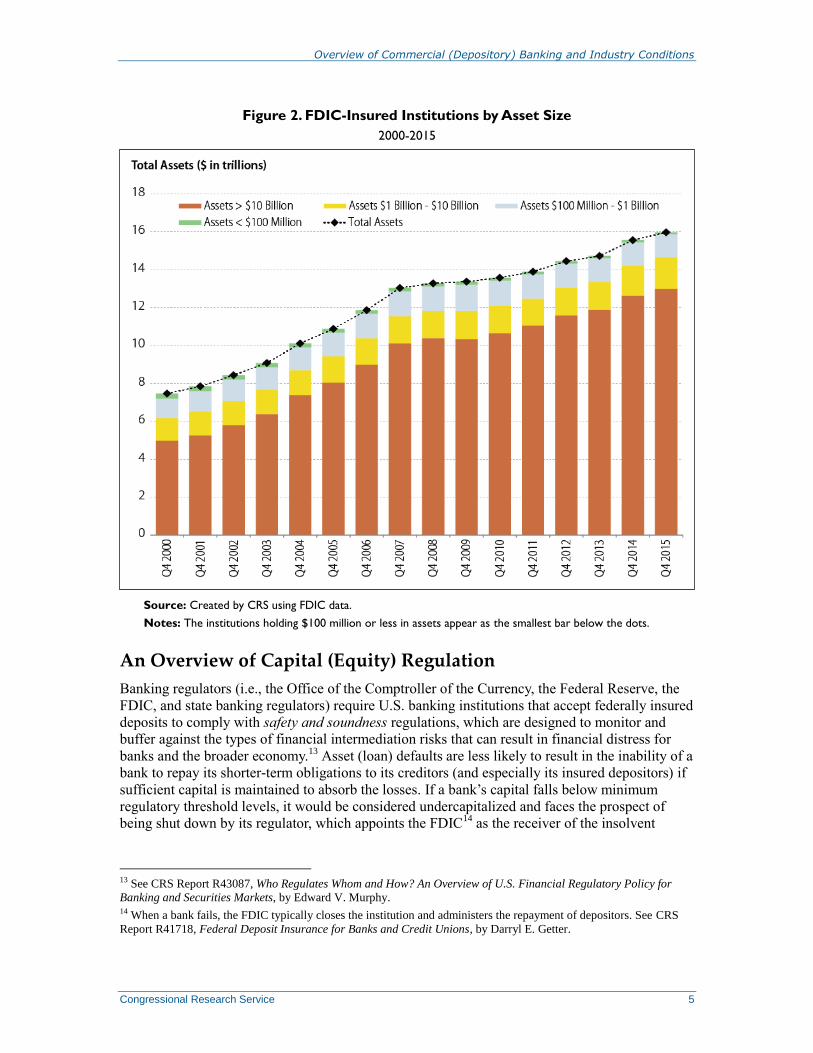
Figure 5 shows the increase in noncurrent assets (i.e., loans or bonds) and charge-offs after 2007.
Non-current assets are loans or bonds that borrowers do not repay as scheduled. The allowance
for loan and lease losses (ALLL) is a component of regulatory bank capital set aside for
anticipated (or estimated) loan losses. Loan loss provisioning refers to increasing the amount of
ALLL when loan default risks increase; decreases are referred to as charge-offs or deductions
from ALLL when lenders determine that noncurrent assets will not be repaid.21
RoA and RoE
movements are essentially related to loan and bond repayment problems.
21 Net charge-offs are charge-offs minus the delinquent loans that recover. Mortgage and credit card charge-offs differ.
A credit card loan charge-off can be recognized immediately, but writing off mortgages takes considerably more time.
When it becomes clear that a mortgage default cannot be cured, the property is generally seized via foreclosure and
must be resold to recover some losses.
Overview of Commercial (Depository) Banking and Industry Conditions
Congressional Research Service 9
Figure 5. Net Charge-Offs, Noncurrent Assets, ALLL Proxy, and Coverage Ratio
2000-2015
Source: Created by CRS using FDIC data.
Notes: The ALLL proxy, discussed further in the text of the report, is computed by CRS using FDIC data.
Bank regulators require banking organizations to hold capital for both anticipated and
unanticipated default risks. Capital requirements pertaining to the maintenance of equity
shareholder levels are designed to buffer against unanticipated losses and generally do not vary.22
In contrast, ALLL requirements change more frequently (quarterly) or when expected credit
losses may have increased. Hence, a bank may have sufficient capital to meet unanticipated
defaults, which may be associated with unforeseen events (such as a sudden increase in the
unemployment rate), but it may still need to increase ALLL provisions should a borrower begin
showing signs of repayment difficulties that may result in default. If banks can absorb anticipated
loan losses using current income earnings, their capital will be left intact for unanticipated losses.
The ratio of aggregate ALLL provisioning to total bank assets, also shown in Figure 5, is an
ALLL proxy. Loan loss provisioning matched and often exceeded the anticipated percentage of
22 In addition to responding to higher balance sheet risks, regulators are implementing Basel II.5, Basel III, and the
Dodd-Frank Wall Street Reform and Consumer Protection Act of 2010 (Dodd-Frank Act; P.L. 111-203), which
collectively will result in higher bank capital requirements. See CRS Report R42744, U.S. Implementation of the Basel
Capital Regulatory Framework, by Darryl E. Getter.
Overview of Commercial (Depository) Banking and Industry Conditions
Congressional Research Service 10
problem assets prior to 2007, which are composed of net charge-offs and noncurrent assets.23
The
ALLL indicator suggests that the amount of loan loss provisioning since the recession covers net
charge-offs. The percentage of noncurrent loans, however, must decline even more relative to the
current level of ALLL provisioning (or ALLL provisioning must increase more) before the
industry can fully cover its anticipated default risks.24
Although the ALLL indicator was constructed for illustrative purposes, the amount of loan loss
allowance of noncurrent loans and leases, also referred to as the coverage ratio, is a more
commonly used metric to assess the ability to absorb losses from nonperforming assets (as shown
in Figure 5).25
A coverage ratio below 100% indicates that there is insufficient provisioning to
cover weak loans that could go into further distress. Since the recession, regulators have required
banks to increase loan-loss provisioning (as well as other components of regulatory capital) levels
to better match the levels of problem loans.26
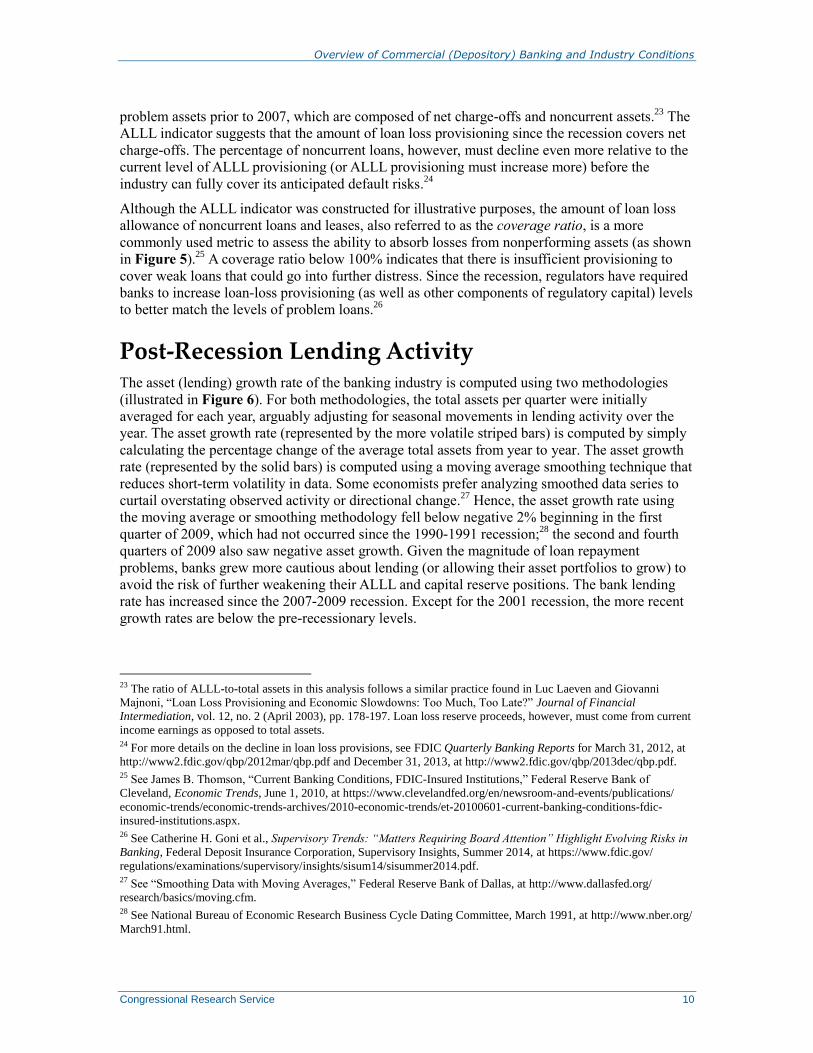
Post-Recession Lending Activity The asset (lending) growth rate of the banking industry is computed using two methodologies
(illustrated in Figure 6). For both methodologies, the total assets per quarter were initially
averaged for each year, arguably adjusting for seasonal movements in lending activity over the
year. The asset growth rate (represented by the more volatile striped bars) is computed by simply
calculating the percentage change of the average total assets from year to year. The asset growth
rate (represented by the solid bars) is computed using a moving average smoothing technique that
reduces short-term volatility in data. Some economists prefer analyzing smoothed data series to
curtail overstating observed activity or directional change.27
Hence, the asset growth rate using
the moving average or smoothing methodology fell below negative 2% beginning in the first
quarter of 2009, which had not occurred since the 1990-1991 recession;28
the second and fourth
quarters of 2009 also saw negative asset growth. Given the magnitude of loan repayment
problems, banks grew more cautious about lending (or allowing their asset portfolios to grow) to
avoid the risk of further weakening their ALLL and capital reserve positions. The bank lending
rate has increased since the 2007-2009 recession. Except for the 2001 recession, the more recent
growth rates are below the pre-recessionary levels.
23 The ratio of ALLL-to-total assets in this analysis follows a similar practice found in Luc Laeven and Giovanni
Majnoni, “Loan Loss Provisioning and Economic Slowdowns: Too Much, Too Late?” Journal of Financial
Intermediation, vol. 12, no. 2 (April 2003), pp. 178-197. Loan loss reserve proceeds, however, must come from current
income earnings as opposed to total assets. 24 For more details on the decline in loan loss provisions, see FDIC Quarterly Banking Reports for March 31, 2012, at
http://www2.fdic.gov/qbp/2012mar/qbp.pdf and December 31, 2013, at http://www2.fdic.gov/qbp/2013dec/qbp.pdf. 25 See James B. Thomson, “Current Banking Conditions, FDIC-Insured Institutions,” Federal Reserve Bank of
Cleveland, Economic Trends, June 1, 2010, at https://www.clevelandfed.org/en/newsroom-and-events/publications/
economic-trends/economic-trends-archives/2010-economic-trends/et-20100601-current-banking-conditions-fdic-
insured-institutions.aspx. 26 See Catherine H. Goni et al., Supervisory Trends: “Matters Requiring Board Attention” Highlight Evolving Risks in
Banking, Federal Deposit Insurance Corporation, Supervisory Insights, Summer 2014, at https://www.fdic.gov/
regulations/examinations/supervisory/insights/sisum14/sisummer2014.pdf. 27 See “Smoothing Data with Moving Averages,” Federal Reserve Bank of Dallas, at http://www.dallasfed.org/
research/basics/moving.cfm. 28 See National Bureau of Economic Research Business Cycle Dating Committee, March 1991, at http://www.nber.org/
March91.html.
Overview of Commercial (Depository) Banking and Industry Conditions
Congressional Research Service 11
Figure 6. Asset Growth Rate
2000-2015
Source: Created by CRS using FDIC data.
Notes: The asset growth rate is shown as a moving average, which was computed by CRS.
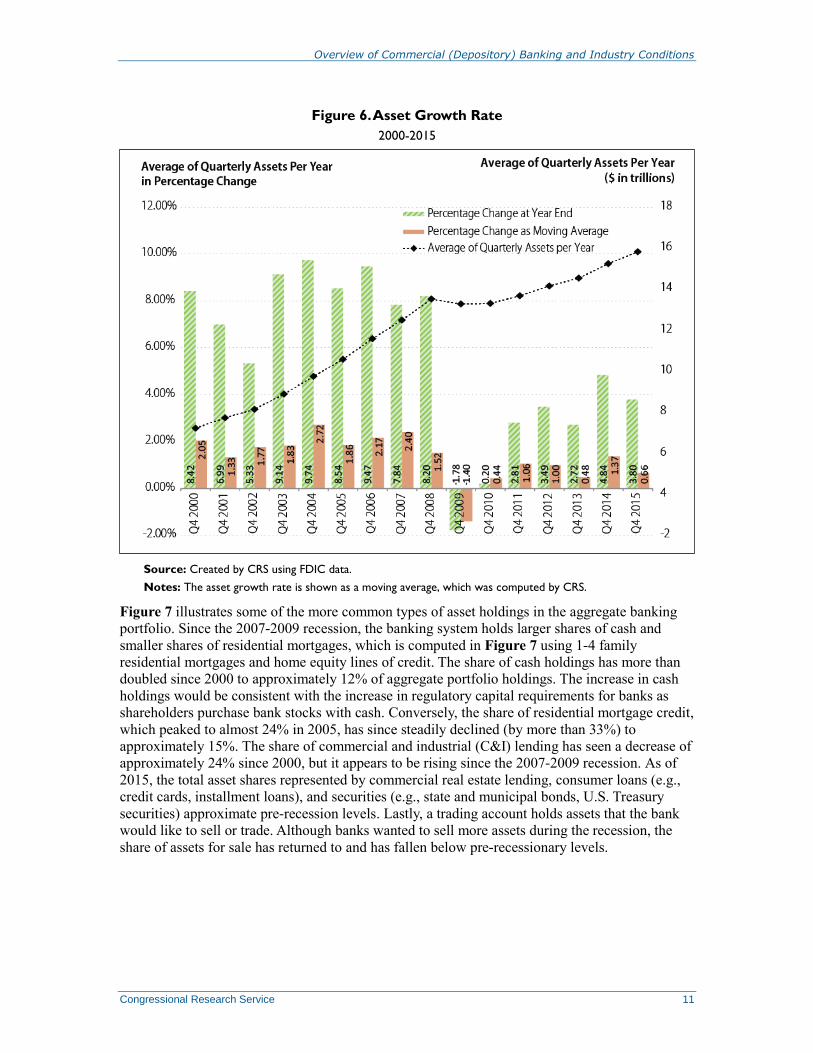
Figure 7 illustrates some of the more common types of asset holdings in the aggregate banking
portfolio. Since the 2007-2009 recession, the banking system holds larger shares of cash and
smaller shares of residential mortgages, which is computed in Figure 7 using 1-4 family
residential mortgages and home equity lines of credit. The share of cash holdings has more than
doubled since 2000 to approximately 12% of aggregate portfolio holdings. The increase in cash
holdings would be consistent with the increase in regulatory capital requirements for banks as
shareholders purchase bank stocks with cash. Conversely, the share of residential mortgage credit,
which peaked to almost 24% in 2005, has since steadily declined (by more than 33%) to
approximately 15%. The share of commercial and industrial (C&I) lending has seen a decrease of
approximately 24% since 2000, but it appears to be rising since the 2007-2009 recession. As of
2015, the total asset shares represented by commercial real estate lending, consumer loans (e.g.,
credit cards, installment loans), and securities (e.g., state and municipal bonds, U.S. Treasury
securities) approximate pre-recession levels. Lastly, a trading account holds assets that the bank
would like to sell or trade. Although banks wanted to sell more assets during the recession, the
share of assets for sale has returned to and has fallen below pre-recessionary levels.
Overview of Commercial (Depository) Banking and Industry Conditions
Congressional Research Service 12
Figure 7. Composition of Industry Assets
2000-2015
Source: Created by CRS using FDIC data.
Revenue Composition by Bank Size As previously stated, banks typically borrow funds from depositors for shorter periods of time
relative to their originated loans. Banks must continuously renew their short-term borrowings
until longer-term loans have been fully repaid. For example, suppose a bank originates a
consumer loan that is expected to be repaid in full over two years. Over the two years that the
loan is being repaid, the bank will simultaneously “fund the loan,” meaning that it will treat its
depositors’ funds as a sequence of quarterly (for a total of eight quarters) or monthly (for a total
of 24 months) short-term loans and make periodic interest payments to depositors.29
The spread
or difference between lending long and borrowing short is known as the net interest margin.
Typically, smaller banks engage in “relationship banking,” meaning that they develop close
familiarity with their respective customer bases and provide financial services within a
circumscribed geographical area. Relationship banking allows these institutions to capture
lending risks that are unique, infrequent, and localized. These institutions, which rely heavily on
commercial (real estate and retail) lending and funding with deposits, typically have higher net
interest margins than large banks. Funding loans with deposits is cheaper than accessing the
29 For example, if a bank originates a two-year loan at a fixed 6% interest rate and pays depositors a 2% return, then the
net interest margin or spread would be 4%. Because the 6% rate is fixed, fluctuations in short-term interest rates mean
that the spread would also fluctuate over the two years that the loan is being repaid.
Overview of Commercial (Depository) Banking and Industry Conditions
Congressional Research Service 13
short-term financial markets, particularly for small institutions that do not have the transaction
volume or size to justify the higher costs.
In contrast, large institutions typically engage in “transactional banking” or high-volume lending
that employs automated underwriting methodologies that often cannot capture atypical lending
risks.30
Large banks are not as dependent upon deposits to fund their lending activities because of
their greater ability to access short-term money markets. Large banks typically have lower
spreads because their large-scale activities generate large amounts of fee income from a wide
range of activities, which can be used to cover the costs of borrowing in the short-term money
markets.31
Revenues are earned by originating and selling large amounts of loans to nonbank
institutions, such as government-sponsored enterprises (Fannie Mae and Freddie Mac) and non-
depository institutions that hold financial assets (e.g., insurance companies, hedge funds). A large
share of fees are still generated from traditional banking activities (e.g., safe deposit, payroll
processing, trust services, payment services) and from facilitating daily purchase and payment
transactions, in which service fees may be collected from checking, money orders, and electronic
payment card (debit and credit) transactions.32
Hence, transactional or high-volume banking
activities allow large banks to generate fee income and engage in financial transactions
characterized by minimum deal size or institutional size requirements, which simultaneously act
as a participation barrier for community banks.33
Because of the differences in the composition of bank revenue streams, the net interest margins
and fee income streams are illustrated by asset size categories. Figure 8 presents the net interest
margins (or spreads) by bank size. By 2009, the net interest margins had declined for small banks,
but they still remained higher over time than the margins for larger banks. The net interest
margins for large banks increased over the recession period as they experienced a large influx of
deposits during the recession, perhaps due to uncertainty in the money market; this “flight to
safety” influx resulted in a substantial drop in their funding costs.34
In other words, large banks
were able to rely relatively less on short-term financial markets and could, instead, take advantage
of cheaper funding from deposits. Although net interest margins may appear to be returning to
pre-recession trends, the future performance of this spread would still be affected by a shift in the
composition of asset holdings. For example, the spread may be affected by an increase in liquid
30 For more information on automated underwriting, see Wayne Passmore and Roger Sparks, The Effect of Automated
Underwriting on the Profitability of Mortgage Securitization, Federal Reserve Board, Finance and Discussion Series
1997-19, Washington, DC, 1997, at http://www.federalreserve.gov/pubs/feds/1997/199719/199719abs.html. 31 See Judy Plock, Mike Anas, and David Van Vickle, “Does Net Interest Margin Matter to Banks?,” Federal Deposit
Insurance Corporation, FDIC Outlook, June 2, 2004, at http://www.fdic.gov/bank/analytical/regional/ro20042q/na/
infocus.html. 32 See CRS Report R41529, Supervision of U.S. Payment, Clearing, and Settlement Systems: Designation of Financial
Market Utilities (FMUs), by Marc Labonte. 33 See Conference of State Bank Supervisors, Community Banks and Capital: Assessing a Community Bank’s Need
and Access to Capital in the Face of Market and Regulatory Challenges, December 2011, at http://CSBS-
CommunityBanksCapitalWhitePaper120811.pdf. 34 For more information on the influx of deposits into the banking system, see Paul Davis, “In Cash Glut, Banks Try to
Discourage New Deposits,” American Banker, July 2010, at http://www.americanbanker.com/bulletins/-1023018-
1.html; Office of the Comptroller of the Currency, Semi-Annual Risk Perspective, Spring 2012, at http://occ.gov/
publications/publications-by-type/other-publications-reports/semiannual-risk-perspective/semiannual-risk-perspective-
spring-2012.pdf. Many depositors may have moved money to larger banks in response to uncertainty in the money
markets. For discussions about money market funds falling below $1 per share, see Nada Mora, “Can Banks Provide
Liquidity in a Financial Crisis?,” Economic Review, Federal Reserve Bank of Kansas City, Third Quarter 2010, pp. 31-
68; CRS Report R42083, Financial Stability Oversight Council: A Framework to Mitigate Systemic Risk, by Edward V.
Murphy; and CRS Report R42787, An Overview of the Transaction Account Guarantee (TAG) Program and the
Potential Impact of Its Expiration or Extension, by Sean M. Hoskins.

Overview of Commercial (Depository) Banking and Industry Conditions
Congressional Research Service 14
asset holdings (e.g., securities backed by the U.S. federal government), perhaps due to weaker
demand for more illiquid loans (e.g., mortgages, commercial loans) or lower capital requirements
associated with holding more liquid loans. Banks may alter the composition of their asset
portfolios, attempting to seek higher yielding lending opportunities (e.g., holding less mortgages
and more credit card loans) to help maintain spreads above 3%. Bank spreads may also be
affected by the amount of deposits that remain or flow out of the banking system as the economy
strengthens. Hence, it has become more challenging to predict future profitability arising from
more traditional lending activities.
Figure 8. Net Interest Margins (Spreads) by Bank Asset Size Categories
2000-2015
Source: Created by CRS using FDIC data.
Figure 9 presents noninterest income as a percentage of assets by bank size. The overall trend of
fee-generating activities has rebounded since the recession, but there appears to be more volatility
in fee-income revenues of smaller institutions. Although greater reliance upon fee income as a
percentage of (large) bank income suggests a reduction in exposure to credit and funding risks, it
may not necessarily translate into greater stability of earnings streams.35
For example, banks no
longer generate as much fee income by selling (mortgage) loans to private-label securitization
markets, particularly those largely abandoned by investors at the beginning of the financial
crisis.36
In other words, high-volume fee-generating transactions are still dependent upon
35 Robert DeYoung and Tara Rice, “How Do Banks Make Money? The Fallacies of Fee Income,” Federal Reserve
Bank of Chicago, Economic Perspectives, 2004, pp. 34-51, at http://www.chicagofed.org/digital_assets/publications/
economic_perspectives/2004/ep_4qtr2004_part3_DeYoung_Rice.pdf. 36 For information on securitization markets issues, see U.S. Congress, Senate Committee on Banking, Housing, and
Urban Affairs, Subcommittee on Securities, Insurance and Investment, Securitization of Assets: Problems and
Solutions, Testimony of George P. Miller, American Securitization Forum, 111th Cong., 1st sess., October 7, 2009.

Overview of Commercial (Depository) Banking and Industry Conditions
Congressional Research Service 15
fluctuations in investor demand for securities created from securitized (structured finance) deals,
which adds variability to income. In addition, regulatory costs may reduce fee income. Recent
regulation of fees that large institutions may collect from debit transactions would affect the
earnings streams.37
Banks might respond by seeking new opportunities to provide financial
services to generate new fee revenues.38
Hence, future fee-generating activities are still affected
by financial market uncertainty.
Figure 9. Percentage of Non-Interest Income by Bank Size Asset Categories
2000-2015
Source: Created by CRS using FDIC data.
Conclusion Since the 2007-2009 financial crisis, the banking industry has exhibited profitability. Net interest
margins and fee income as a percentage of assets are less volatile now than when the U.S.
economy was in recession, but they are still lower in comparison to 2000. The industry is still
accumulating sufficient reserves to cover noncurrent assets. These factors may be influencing the
asset growth rate, which has been positive since 2011, but remains below the average rate of
growth observed over the past two decades.
Profitability in the banking industry should not be interpreted as evidence of a return to previous
lending patterns. The industry is adapting its business models to the post-recession regulatory
37 For example, see CRS Report R41913, Regulation of Debit Interchange Fees, by Darryl E. Getter. 38 See CRS Report R43364, Recent Trends in Consumer Retail Payment Services Delivered by Depository Institutions,
by Darryl E. Getter.

Overview of Commercial (Depository) Banking and Industry Conditions
Congressional Research Service 16
environment in which higher overall capital requirements would be expected to increase funding
costs and the choice of financial assets held in portfolios. Because large banks may be less
dependent upon traditional lending activities than smaller banks, large institutions might be able
to generate sufficient fee income from a wide range of other financial activities to remain
profitable even if lending activity does not resemble pre-recessionary levels. Hence, profitability
trends may differ for banks by size.
Author Contact Information
Darryl E. Getter
Specialist in Financial Economics
[email protected], 7-2834
Acknowledgments
The author acknowledges the contributions of Raj Gnanarajah, Sean Hoskins, Ronda Mason, Bisola
Momoh, Molly Sherlock, and Baird Webel.