overall (1)
TRANSCRIPT
TAYLOR’S UNIVERSITY MTH 10304
STATISTICS OF DENGUE DESEASE 1
SCHOOL OF ARCHITECTURE, BUILDING AND DESIGN
FOUNDATION IN NATURAL BUILD ENVIRONMENT
MATHEMATICS (MTH 10304)
FINAL PROJECT: STATISTICS
GROUP MEMBERS :
NOOR DINNA HANI BINTI MURAD 0323430
VIVIAN TAY HUEY SHUEN 0323869
TAN VIN NIE 0323706
MUHAMMAD ZAYD KHAIRIL ANWAR 0323394
JANSON CHEN 0323047
LECTURER : MRS. ANN SEE PENG
DESEASE : DENGUE
SUBMISSION DATE: 12th JANUARY 2016
TAYLOR’S UNIVERSITY MTH 10304
STATISTICS OF DENGUE DESEASE 2
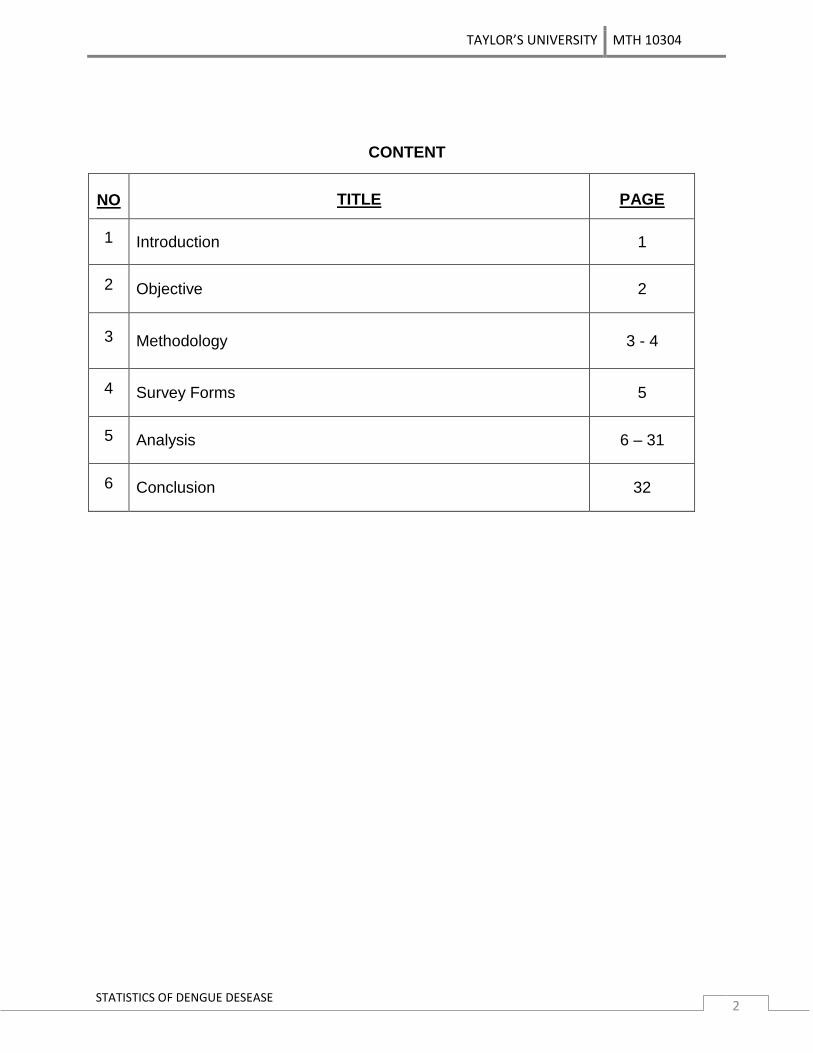
CONTENT
NO TITLE PAGE
1 Introduction 1
2 Objective 2
3 Methodology 3 - 4
4 Survey Forms 5
5 Analysis 6 – 31
6 Conclusion 32
TAYLOR’S UNIVERSITY MTH 10304
STATISTICS OF DENGUE DESEASE 3
Introduction
We are given a task to do a survey on a specific disease in order to find out the
proportion of people who really understand and concern about the disease. Our survey target
are the students in Taylor University, which are aged between 17 to 26 and above.
We chose Dengue as our survey topic because it is a very common and popular disease
that happens frequently in our country. This topic is familiar for every individual who lives in
Malaysia. However, how many of them actually know and understand about this disease?
Malaysia recorded 336 dengue deaths last year. It was the highest number of dengue
deaths ever recorded in the country. Dengue is a mosquito-borne viral infection. The infection
causes flu-like illness and occasionally develops into a potentially lethal complication called
severe dengue. The global incidence of dengue has grown dramatically in recent decades.
Although government has employed a lot of strategies to control the number of dengue cases
from increasing, the data recorded by the Health Ministry is still disappointing.
The dengue cases rise at an alarming rate every year. We always hear from our parents,
teachers as well as mass media about the ways to save us from dengue disease. For example,
one of the ways is that we should remove and change the water inside the vase every day to
avoid the breeding of mosquitos. However, most people fall on deaf ears.
To find out how many people understand about this disease, we form and arrange some
questions to test how well the students from Taylor University know about dengue. We
prepared 17 questions in total. From the survey, we organize and analyze the information and
create several bar charts to show the data.
TAYLOR’S UNIVERSITY MTH 10304
STATISTICS OF DENGUE DESEASE 4
Objective
Study of statistic helps us to collect and analyze information in a systematic and
alternative way. This project gives us an opportunity to explore the ways or processes to
accomplish a statistic by using bar chart, pie chart and graph. Before starting to create a
statistic, we need to form a survey to collect data from the targeted individuals. The survey
helps us to see the proportion or ratio of people based on the topic we choose. After that, we
start to differentiate and classify the data into groups with similar characteristic such as age and
gender. We investigate and analysis the number of students who understand the disease based
on the number of correct answers they chose. Then, we form a bar chart for each of the
question to show the statistic data.
This survey allows us to analyze and solve the problems that involves various
mathematic principles. For instance, we apply mathematics principle, statistics to calculate the
mean, frequency, median and etc. to get a more accurate result for this survey. It gives us a
chance to learn how math principle complete a statistic in an easier and rapid way.
Furthermore, we have a chance to improve our communication skills. We develop this
skill by distributing the survey forms for others to fill. We feel pleasant when people are willing
to scarify their precious time to do our survey forms. Through a simple and brief interaction, we
can meet some new friends as well. In this project, we learnt to be more confident and brave to
speak to people we don’t know.
We learnt and gained a lot of knowledge while doing this project. Before we prepare the
survey papers, we do research through internet and look for books that are related to dengue
disease. We tend to discover some extra information and new knowledge which makes us feel
interesting and fun to complete this project. Other than that, we would be aware and concern
about this disease after understanding all the symptoms and effects of dengue.
TAYLOR’S UNIVERSITY MTH 10304
STATISTICS OF DENGUE DESEASE 5
Methodology
This section will explain how we obtained the data followed by pictures revealing areas
and the interview. We brainstormed on the areas and the age group of students to aim for. We
chose 3 areas, the campus itself, SS15, or Bandar Sunway. We discussed the age group, the type
of students, the present time and the willingness of the students. We started with Bandar
Sunway. Clearly Bandar Sunway is filled with students as two of the biggest universities reside
in the Area, being Sunway University followed by University of Monash. Both universities
provide Undergraduate and Foundation programs. Hence, we roughly assumed the age group
would be from 17 years old to 25 years old. This age group is quite suitable for our assignment
as we aimed for young adults as participants. We then discussed the current time and the
events that were occurring during this period of time. It was during the month of December
and January. Based on statistics and sources, we concluded that most students would be on
Semester break. Hence, even though the age group was ideal, most students wouldn’t be
available to participate let alone approached.
We then discussed the potential of SS15. The age group would be around 16 years old
to 20 years old as the universities there, being Taylor’s College and Inti College, only provide
Pre-University and Diploma programs. This was not ideal to us as we aimed for a bigger age
group. Hence, the area of SS15 was not chosen. Finally, we discussed our own area, the campus
of Taylor’s University. We know that this university provides Foundation, Undergraduate, and
Postgraduate programs. Hence, the age group would be from 17 years old to 26+ years old. This
was ideal to us due to its big range and we could get multiple opinions and answers. During this
period of time some of the Undergraduate students and the Foundation students will be
present. Hence, since we are students of Taylor’s University, furthermore they would be
comfortable with out approach due to this reason; we chose our university as the area to
conduct our surveys.
TAYLOR’S UNIVERSITY MTH 10304
STATISTICS OF DENGUE DESEASE 6
We conducted our surveys in multiple areas. We approached students studying in the
library, with the permission of our teacher we passed the survey sheets around our class during
lectures, and some of us even managed to approach fellow hostel mates. We were appreciative
that our fellow university mates could spare time and answer these surveys.

TAYLOR’S UNIVERSITY MTH 10304
STATISTICS OF DENGUE DESEASE 7
SURVEY
FORMS
TAYLOR’S UNIVERSITY MTH 10304
STATISTICS OF DENGUE DESEASE 8
Statistical analysis
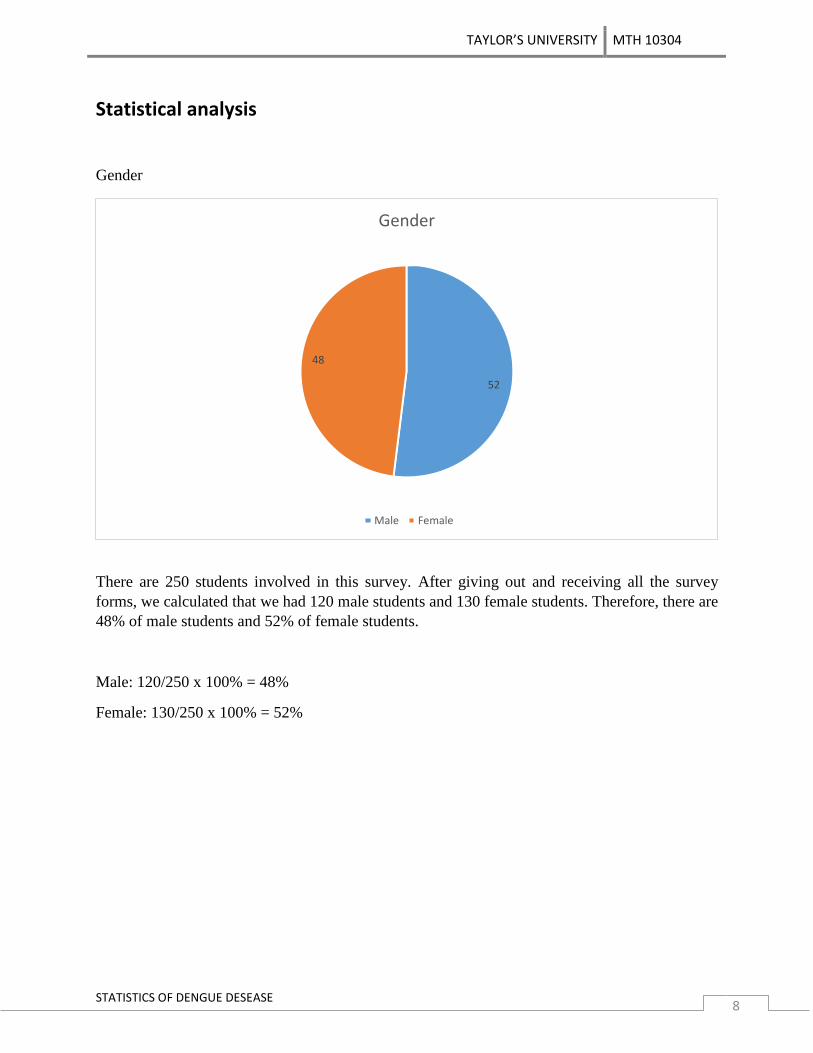
Gender
There are 250 students involved in this survey. After giving out and receiving all the survey
forms, we calculated that we had 120 male students and 130 female students. Therefore, there are
48% of male students and 52% of female students.
Male: 120/250 x 100% = 48%
Female: 130/250 x 100% = 52%
52
48
Gender
Male Female
TAYLOR’S UNIVERSITY MTH 10304
STATISTICS OF DENGUE DESEASE 9
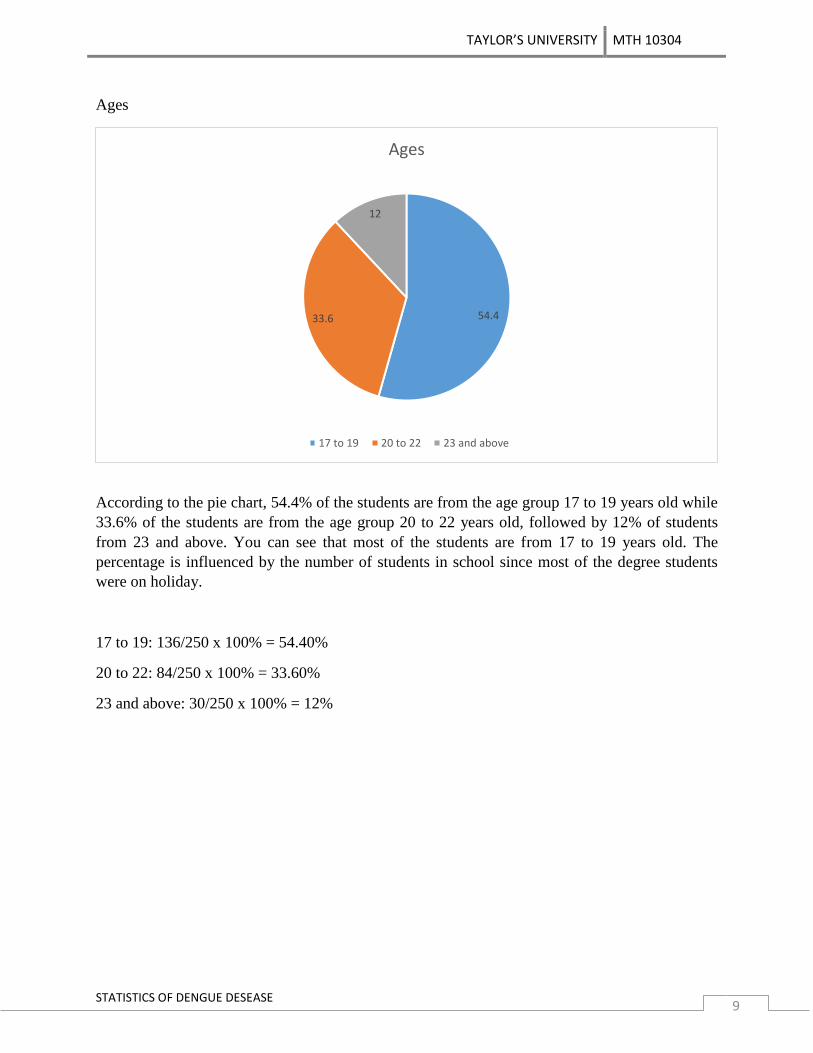
Ages
According to the pie chart, 54.4% of the students are from the age group 17 to 19 years old while
33.6% of the students are from the age group 20 to 22 years old, followed by 12% of students
from 23 and above. You can see that most of the students are from 17 to 19 years old. The
percentage is influenced by the number of students in school since most of the degree students
were on holiday.
17 to 19: 136/250 x 100% = 54.40%
20 to 22: 84/250 x 100% = 33.60%
23 and above: 30/250 x 100% = 12%
54.4 33.6
12
Ages
17 to 19 20 to 22 23 and above
TAYLOR’S UNIVERSITY MTH 10304
STATISTICS OF DENGUE DESEASE 10
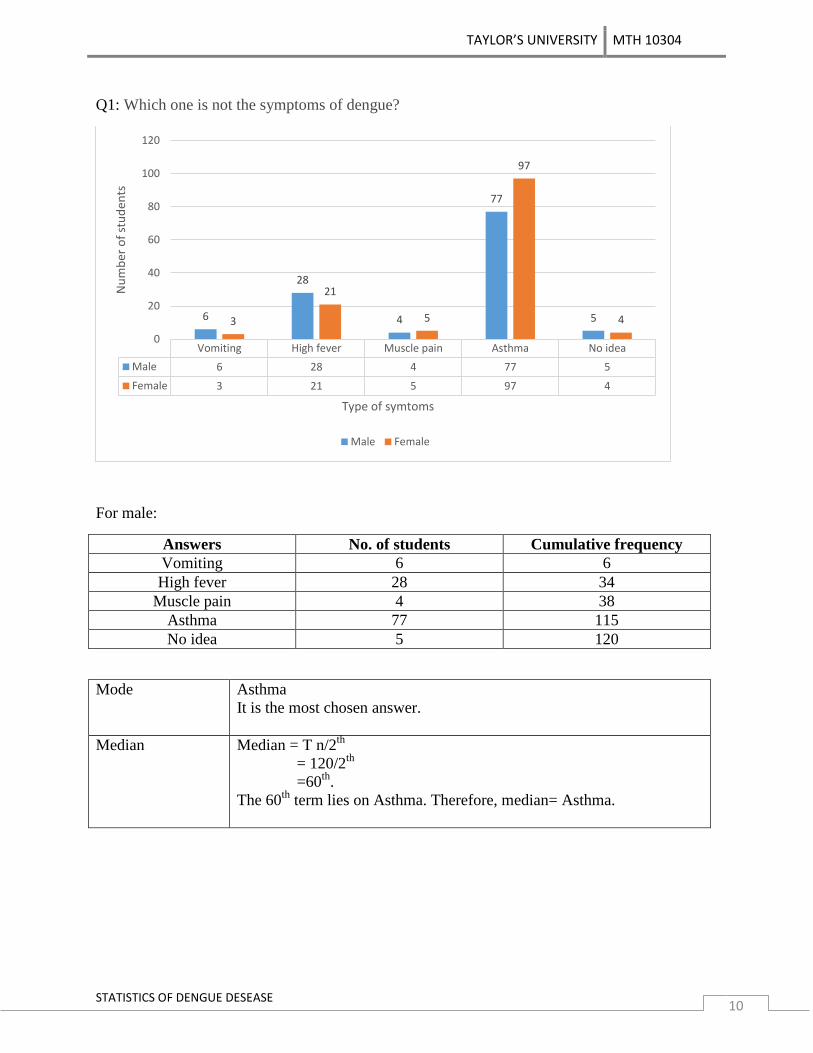
Q1: Which one is not the symptoms of dengue?
For male:
Answers No. of students Cumulative frequency
Vomiting 6 6
High fever 28 34
Muscle pain 4 38
Asthma 77 115
No idea 5 120
Mode Asthma
It is the most chosen answer.
Median Median = T n/2th
= 120/2th
=60th
.
The 60th
term lies on Asthma. Therefore, median= Asthma.
Vomiting High fever Muscle pain Asthma No idea
Male 6 28 4 77 5
Female 3 21 5 97 4
6
28
4
77
5 3
21
5
97
4
0
20
40
60
80
100
120
Nu
mb
er o
f st
ud
ents
Type of symtoms
Male Female
TAYLOR’S UNIVERSITY MTH 10304
STATISTICS OF DENGUE DESEASE 11
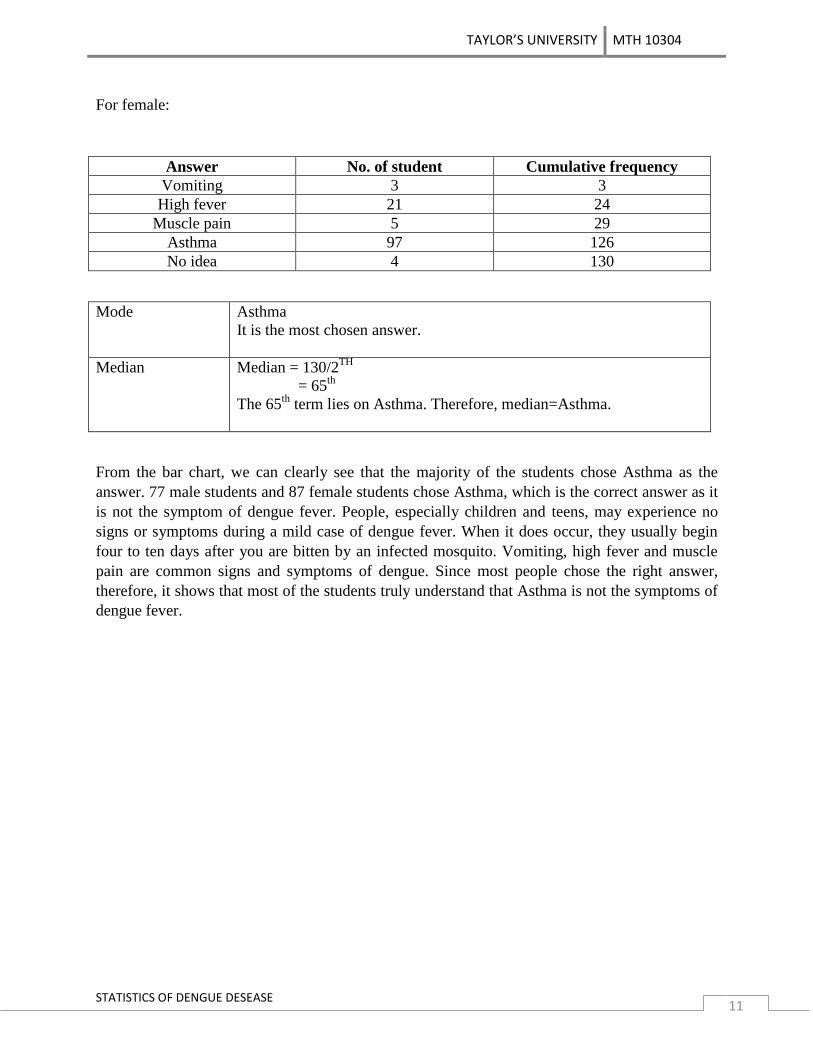
For female:
Answer No. of student Cumulative frequency
Vomiting 3 3
High fever 21 24
Muscle pain 5 29
Asthma 97 126
No idea 4 130
Mode Asthma
It is the most chosen answer.
Median Median = 130/2TH
= 65
th
The 65th
term lies on Asthma. Therefore, median=Asthma.
From the bar chart, we can clearly see that the majority of the students chose Asthma as the
answer. 77 male students and 87 female students chose Asthma, which is the correct answer as it
is not the symptom of dengue fever. People, especially children and teens, may experience no
signs or symptoms during a mild case of dengue fever. When it does occur, they usually begin
four to ten days after you are bitten by an infected mosquito. Vomiting, high fever and muscle
pain are common signs and symptoms of dengue. Since most people chose the right answer,
therefore, it shows that most of the students truly understand that Asthma is not the symptoms of
dengue fever.
TAYLOR’S UNIVERSITY MTH 10304
STATISTICS OF DENGUE DESEASE 12
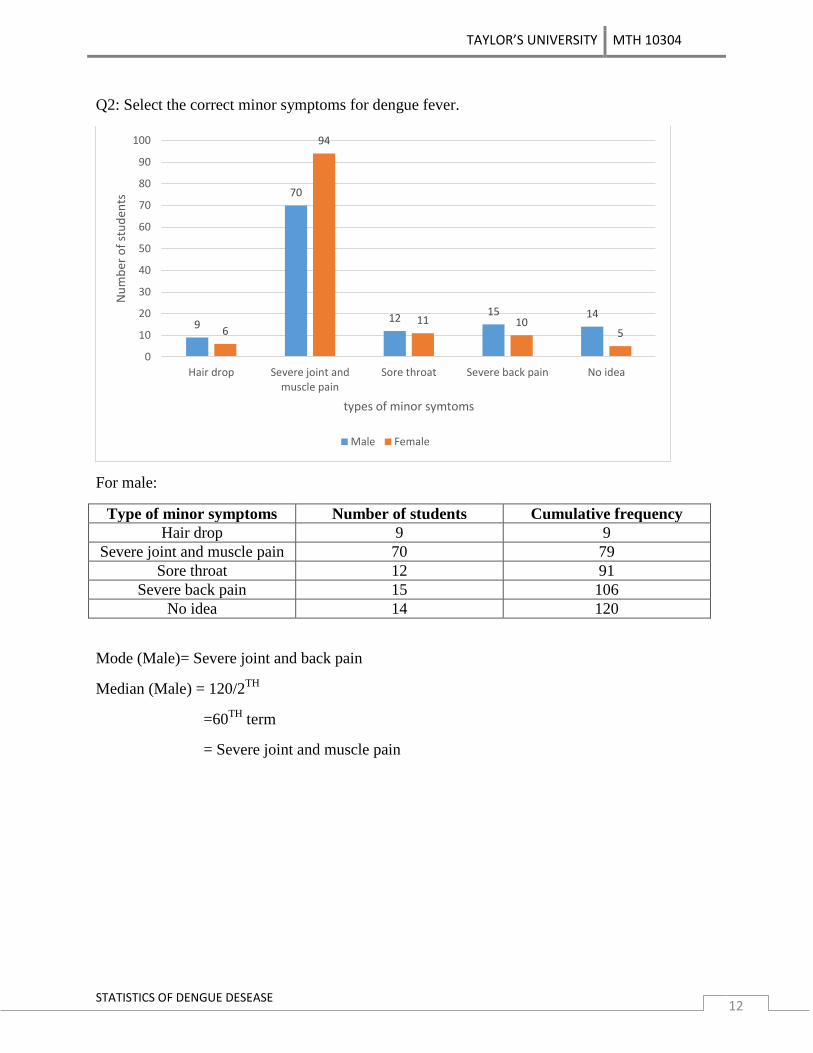
Q2: Select the correct minor symptoms for dengue fever.
For male:
Type of minor symptoms Number of students Cumulative frequency
Hair drop 9 9
Severe joint and muscle pain 70 79
Sore throat 12 91
Severe back pain 15 106
No idea 14 120
Mode (Male)= Severe joint and back pain
Median (Male) = 120/2TH
=60TH
term
= Severe joint and muscle pain
9
70
12 15 14
6
94
11 10 5
0
10
20
30
40
50
60
70
80
90
100
Hair drop Severe joint andmuscle pain
Sore throat Severe back pain No idea
Nu
mb
er o
f st
ud
ents
types of minor symtoms
Male Female
TAYLOR’S UNIVERSITY MTH 10304
STATISTICS OF DENGUE DESEASE 13
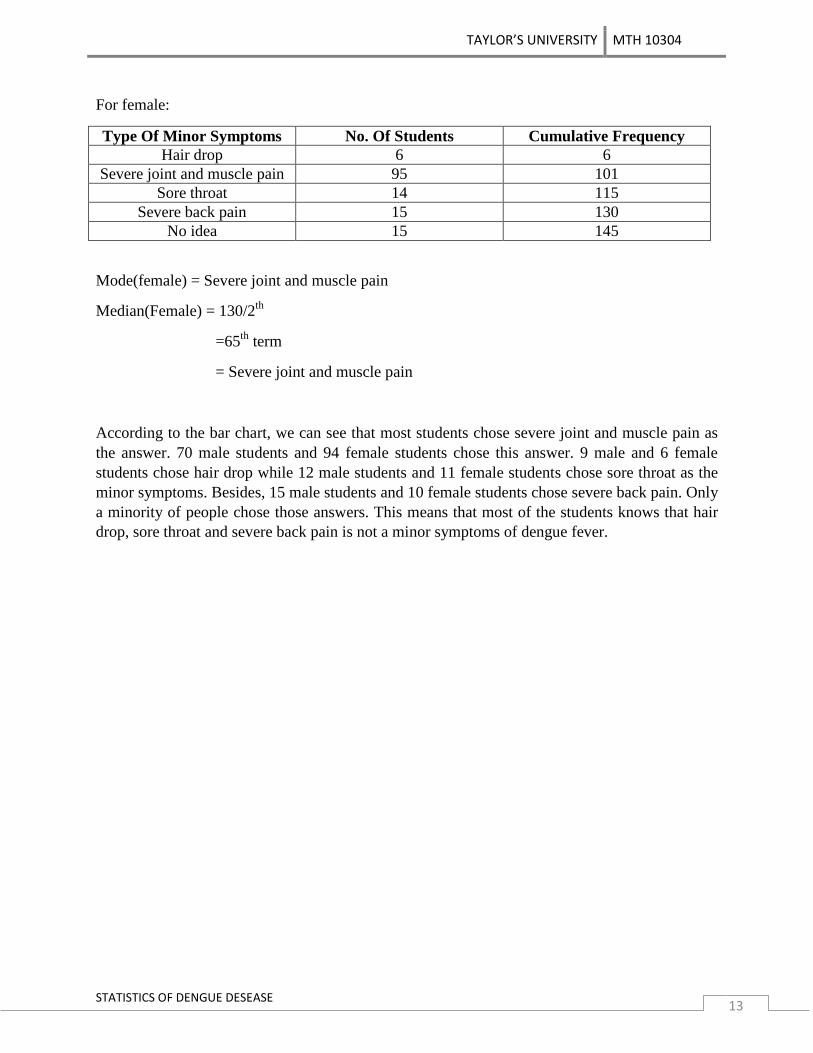
For female:
Type Of Minor Symptoms No. Of Students Cumulative Frequency
Hair drop 6 6
Severe joint and muscle pain 95 101
Sore throat 14 115
Severe back pain 15 130
No idea 15 145
Mode(female) = Severe joint and muscle pain
Median(Female) = 130/2th
=65th
term
= Severe joint and muscle pain
According to the bar chart, we can see that most students chose severe joint and muscle pain as
the answer. 70 male students and 94 female students chose this answer. 9 male and 6 female
students chose hair drop while 12 male students and 11 female students chose sore throat as the
minor symptoms. Besides, 15 male students and 10 female students chose severe back pain. Only
a minority of people chose those answers. This means that most of the students knows that hair
drop, sore throat and severe back pain is not a minor symptoms of dengue fever.
TAYLOR’S UNIVERSITY MTH 10304
STATISTICS OF DENGUE DESEASE 14
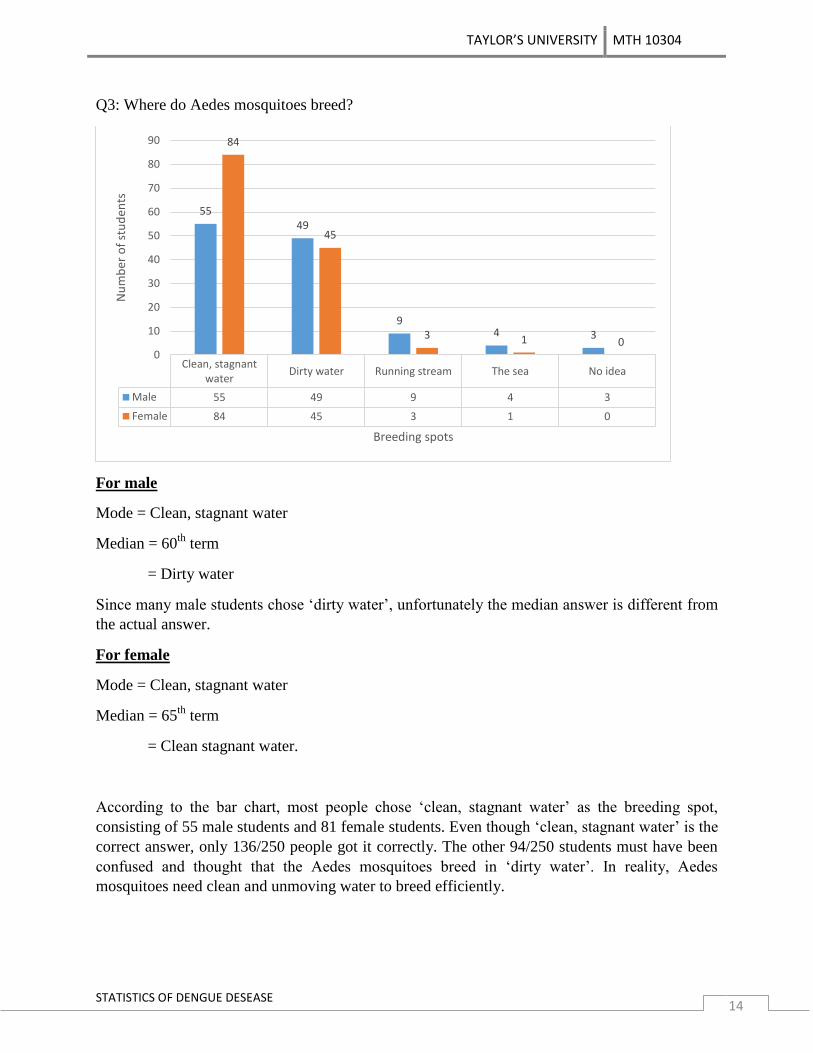
Q3: Where do Aedes mosquitoes breed?
For male
Mode = Clean, stagnant water
Median = 60th
term
= Dirty water
Since many male students chose „dirty water‟, unfortunately the median answer is different from
the actual answer.
For female
Mode = Clean, stagnant water
Median = 65th
term
= Clean stagnant water.
According to the bar chart, most people chose „clean, stagnant water‟ as the breeding spot,
consisting of 55 male students and 81 female students. Even though „clean, stagnant water‟ is the
correct answer, only 136/250 people got it correctly. The other 94/250 students must have been
confused and thought that the Aedes mosquitoes breed in „dirty water‟. In reality, Aedes
mosquitoes need clean and unmoving water to breed efficiently.
Clean, stagnantwater
Dirty water Running stream The sea No idea
Male 55 49 9 4 3
Female 84 45 3 1 0
55 49
9 4 3
84
45
3 1 0 0
10
20
30
40
50
60
70
80
90
Nu
mb
er o
f st
ud
ents
Breeding spots
TAYLOR’S UNIVERSITY MTH 10304
STATISTICS OF DENGUE DESEASE 15
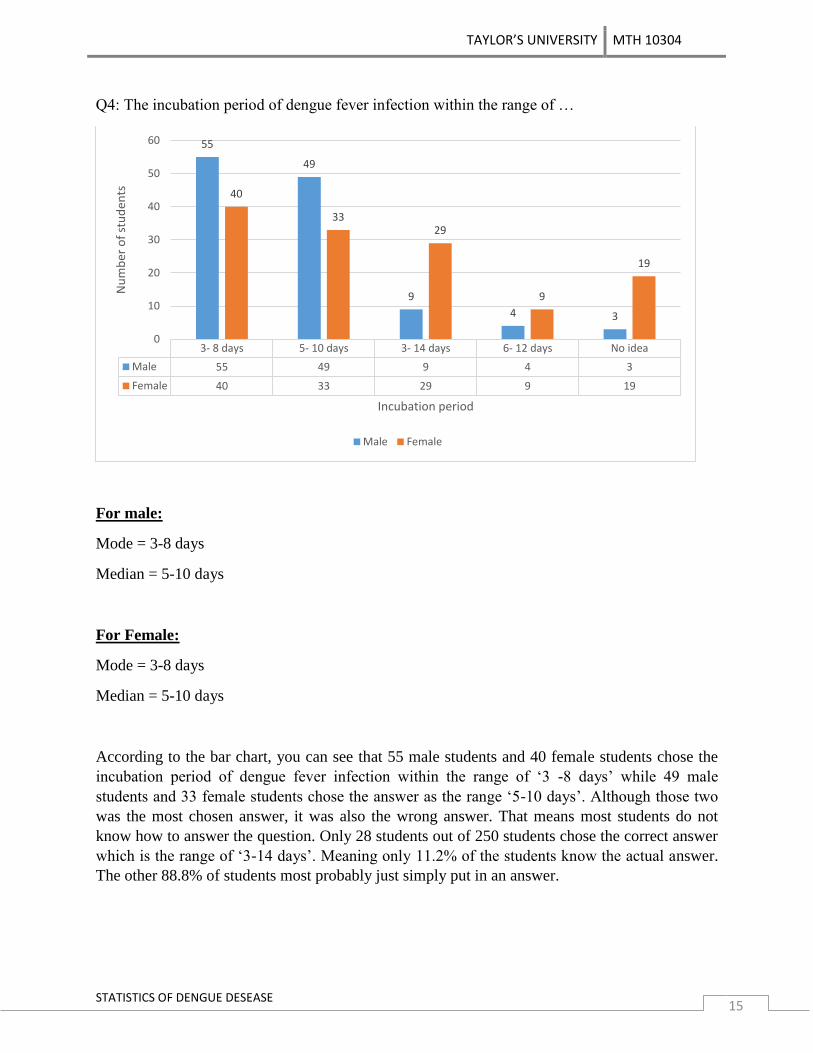
Q4: The incubation period of dengue fever infection within the range of …
For male:
Mode = 3-8 days
Median = 5-10 days
For Female:
Mode = 3-8 days
Median = 5-10 days
According to the bar chart, you can see that 55 male students and 40 female students chose the
incubation period of dengue fever infection within the range of „3 -8 days‟ while 49 male
students and 33 female students chose the answer as the range „5-10 days‟. Although those two
was the most chosen answer, it was also the wrong answer. That means most students do not
know how to answer the question. Only 28 students out of 250 students chose the correct answer
which is the range of „3-14 days‟. Meaning only 11.2% of the students know the actual answer.
The other 88.8% of students most probably just simply put in an answer.
3- 8 days 5- 10 days 3- 14 days 6- 12 days No idea
Male 55 49 9 4 3
Female 40 33 29 9 19
55
49
9
4 3
40
33 29
9
19
0
10
20
30
40
50
60
Nu
mb
er o
f st
ud
ents
Incubation period
Male Female
TAYLOR’S UNIVERSITY MTH 10304
STATISTICS OF DENGUE DESEASE 16
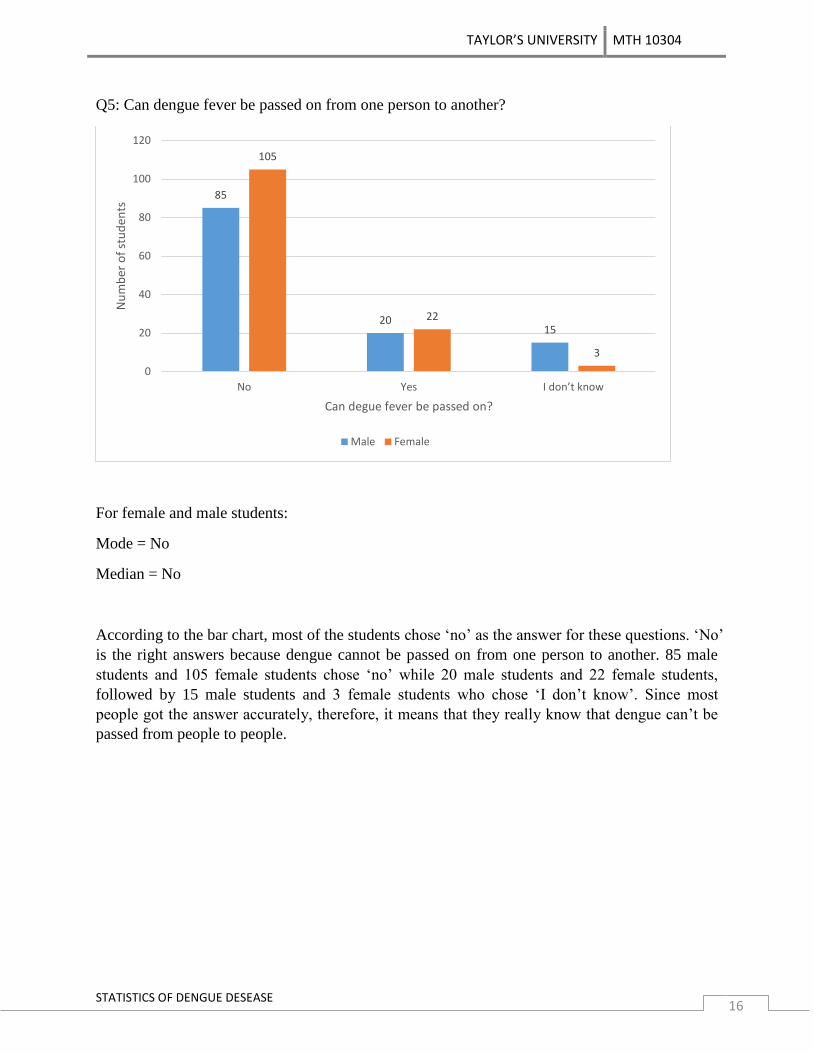
Q5: Can dengue fever be passed on from one person to another?
For female and male students:
Mode = No
Median = No
According to the bar chart, most of the students chose „no‟ as the answer for these questions. „No‟
is the right answers because dengue cannot be passed on from one person to another. 85 male
students and 105 female students chose „no‟ while 20 male students and 22 female students,
followed by 15 male students and 3 female students who chose „I don‟t know‟. Since most
people got the answer accurately, therefore, it means that they really know that dengue can‟t be
passed from people to people.
85
20 15
105
22
3
0
20
40
60
80
100
120
No Yes I don’t know
Nu
mb
er o
f st
ud
ents
Can degue fever be passed on?
Male Female
TAYLOR’S UNIVERSITY MTH 10304
STATISTICS OF DENGUE DESEASE 17
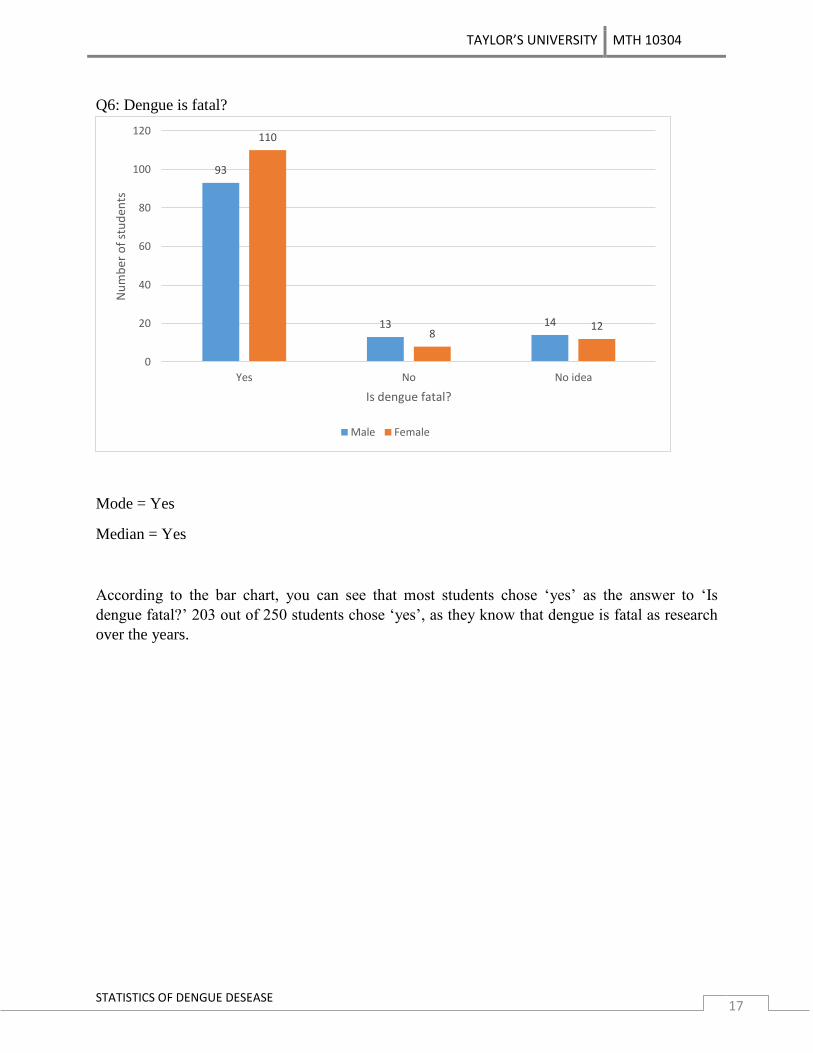
Q6: Dengue is fatal?
Mode = Yes
Median = Yes
According to the bar chart, you can see that most students chose „yes‟ as the answer to „Is
dengue fatal?‟ 203 out of 250 students chose „yes‟, as they know that dengue is fatal as research
over the years.
93
13 14
110
8 12
0
20
40
60
80
100
120
Yes No No idea
Nu
mb
er o
f st
ud
ents
Is dengue fatal?
Male Female
TAYLOR’S UNIVERSITY MTH 10304
STATISTICS OF DENGUE DESEASE 18
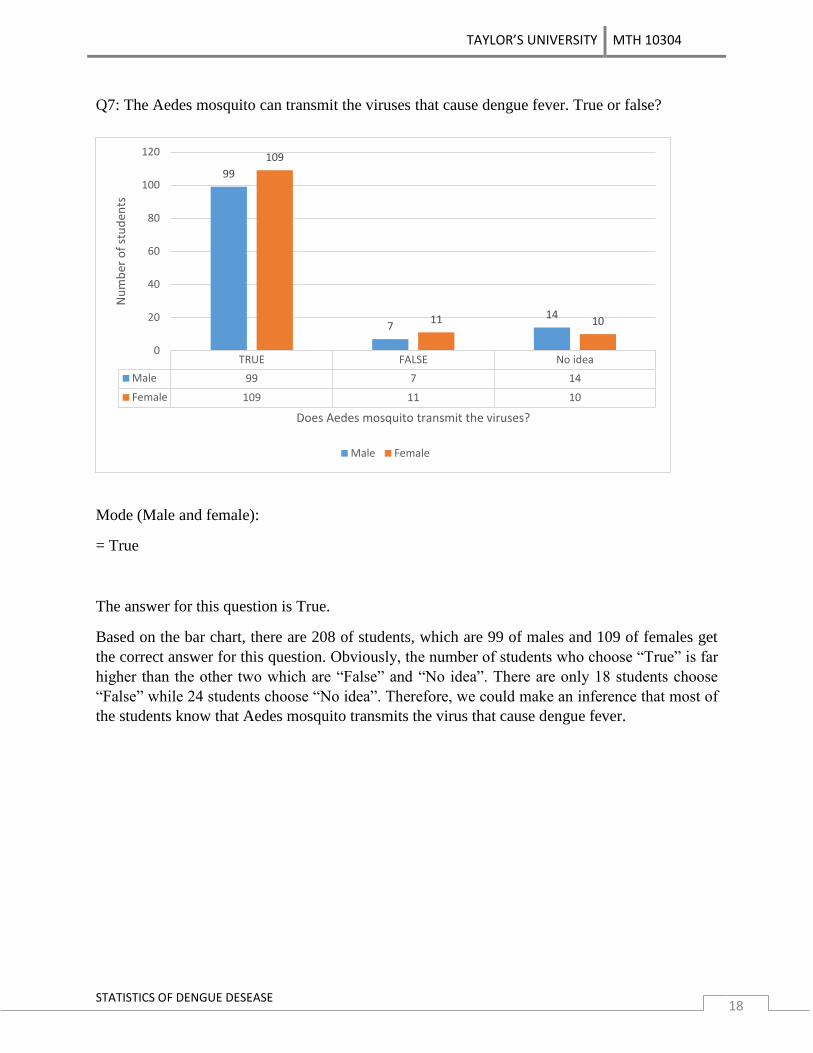
Q7: The Aedes mosquito can transmit the viruses that cause dengue fever. True or false?
Mode (Male and female):
= True
The answer for this question is True.
Based on the bar chart, there are 208 of students, which are 99 of males and 109 of females get
the correct answer for this question. Obviously, the number of students who choose “True” is far
higher than the other two which are “False” and “No idea”. There are only 18 students choose
“False” while 24 students choose “No idea”. Therefore, we could make an inference that most of
the students know that Aedes mosquito transmits the virus that cause dengue fever.
TRUE FALSE No idea
Male 99 7 14
Female 109 11 10
99
7 14
109
11 10
0
20
40
60
80
100
120
Nu
mb
er o
f st
ud
ents
Does Aedes mosquito transmit the viruses?
Male Female
TAYLOR’S UNIVERSITY MTH 10304
STATISTICS OF DENGUE DESEASE 19
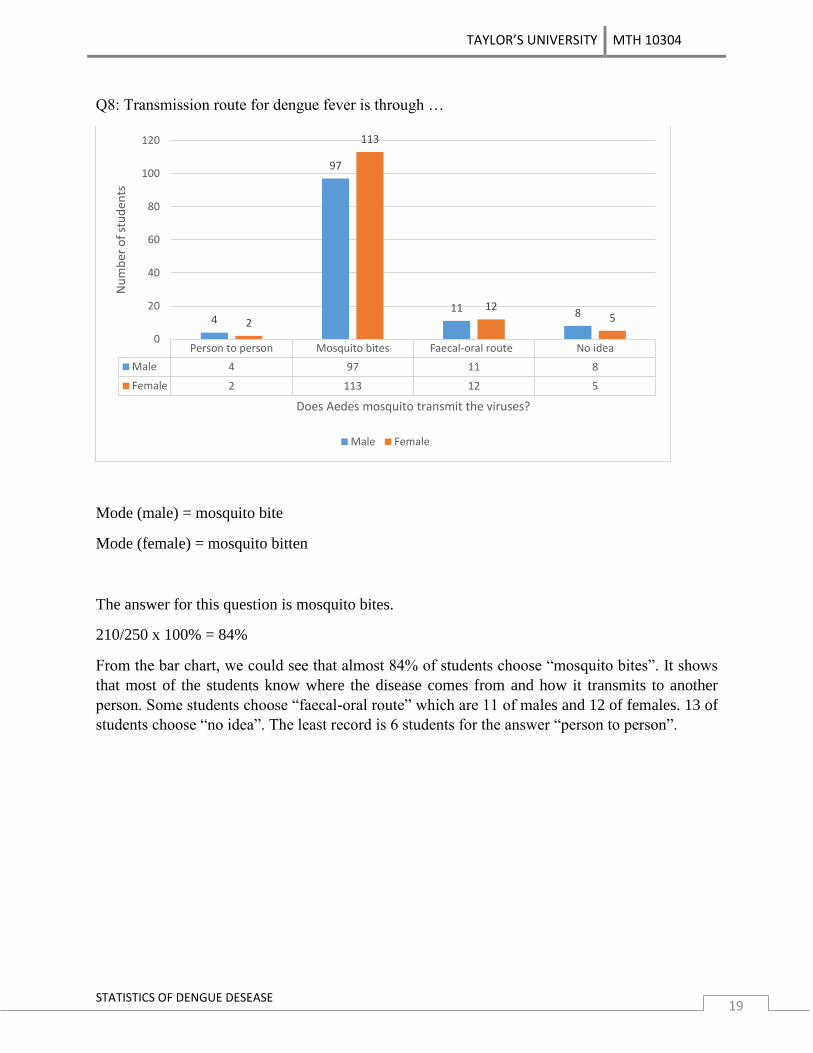
Q8: Transmission route for dengue fever is through …
Mode (male) = mosquito bite
Mode (female) = mosquito bitten
The answer for this question is mosquito bites.
210/250 x 100% = 84%
From the bar chart, we could see that almost 84% of students choose “mosquito bites”. It shows
that most of the students know where the disease comes from and how it transmits to another
person. Some students choose “faecal-oral route” which are 11 of males and 12 of females. 13 of
students choose “no idea”. The least record is 6 students for the answer “person to person”.
Person to person Mosquito bites Faecal-oral route No idea
Male 4 97 11 8
Female 2 113 12 5
4
97
11 8 2
113
12 5
0
20
40
60
80
100
120
Nu
mb
er o
f st
ud
ents
Does Aedes mosquito transmit the viruses?
Male Female
TAYLOR’S UNIVERSITY MTH 10304
STATISTICS OF DENGUE DESEASE 20
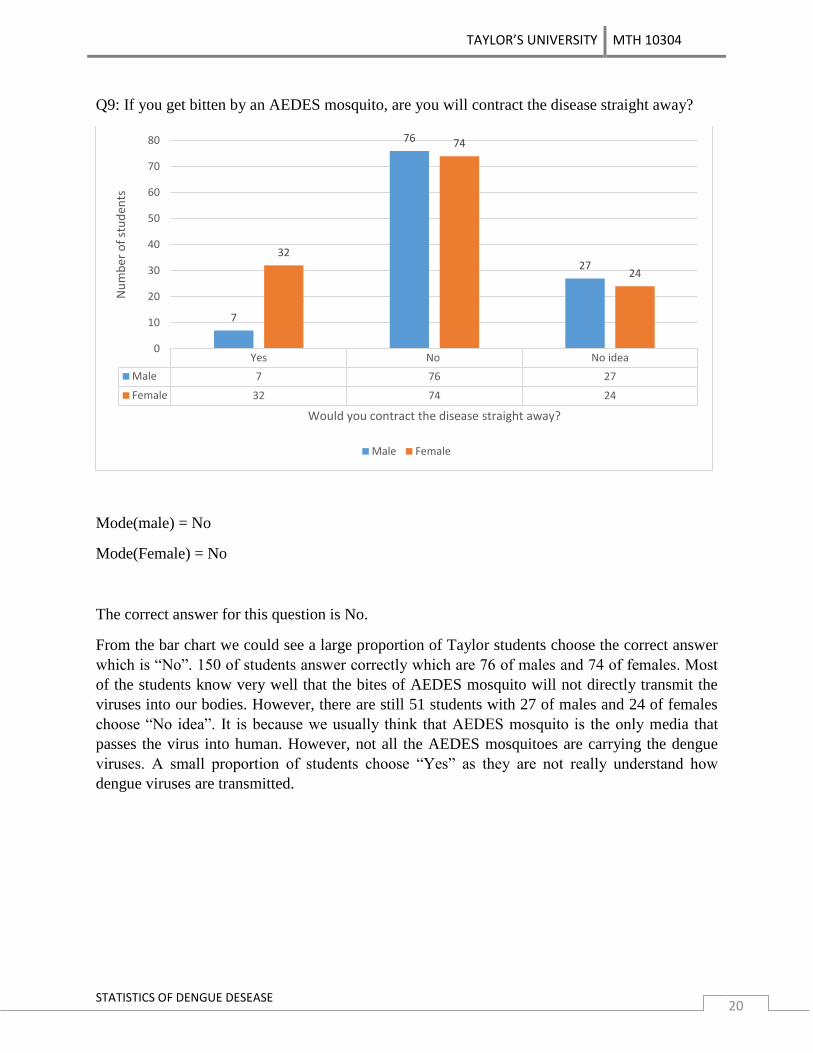
Q9: If you get bitten by an AEDES mosquito, are you will contract the disease straight away?
Mode(male) = No
Mode(Female) = No
The correct answer for this question is No.
From the bar chart we could see a large proportion of Taylor students choose the correct answer
which is “No”. 150 of students answer correctly which are 76 of males and 74 of females. Most
of the students know very well that the bites of AEDES mosquito will not directly transmit the
viruses into our bodies. However, there are still 51 students with 27 of males and 24 of females
choose “No idea”. It is because we usually think that AEDES mosquito is the only media that
passes the virus into human. However, not all the AEDES mosquitoes are carrying the dengue
viruses. A small proportion of students choose “Yes” as they are not really understand how
dengue viruses are transmitted.
Yes No No idea
Male 7 76 27
Female 32 74 24
7
76
27 32
74
24
0
10
20
30
40
50
60
70
80
Nu
mb
er o
f st
ud
ents
Would you contract the disease straight away?
Male Female
TAYLOR’S UNIVERSITY MTH 10304
STATISTICS OF DENGUE DESEASE 21
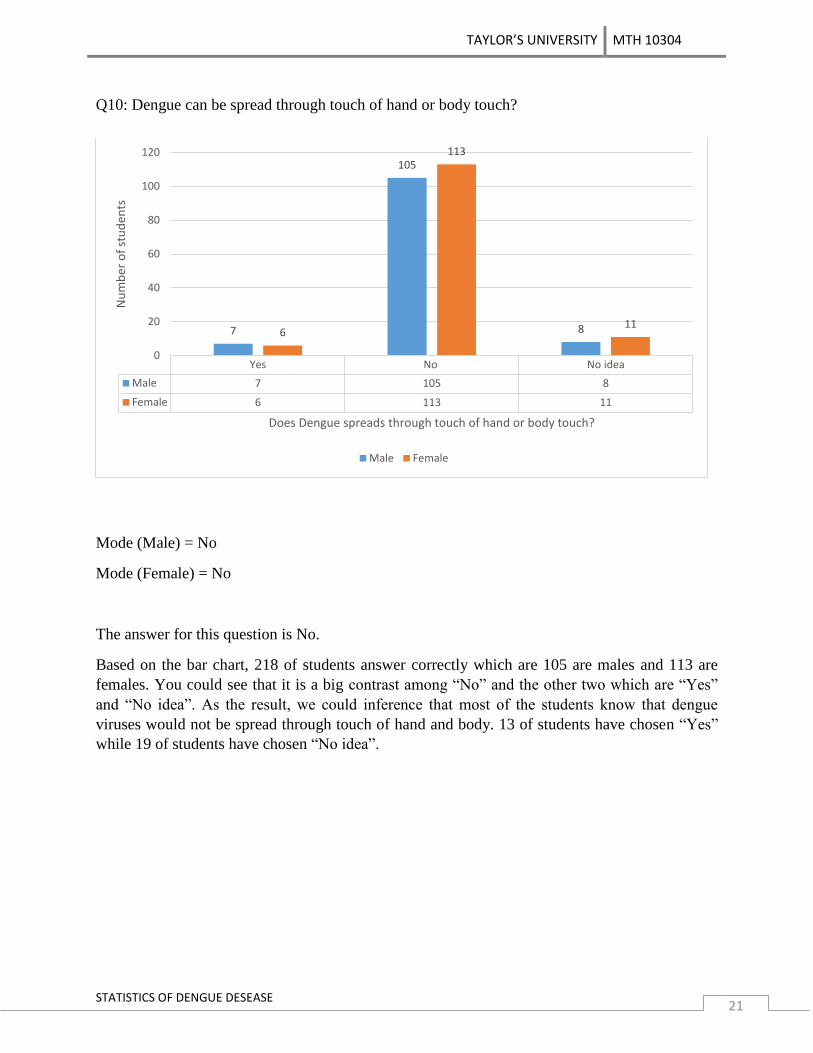
Q10: Dengue can be spread through touch of hand or body touch?
Mode (Male) = No
Mode (Female) = No
The answer for this question is No.
Based on the bar chart, 218 of students answer correctly which are 105 are males and 113 are
females. You could see that it is a big contrast among “No” and the other two which are “Yes”
and “No idea”. As the result, we could inference that most of the students know that dengue
viruses would not be spread through touch of hand and body. 13 of students have chosen “Yes”
while 19 of students have chosen “No idea”.
Yes No No idea
Male 7 105 8
Female 6 113 11
7
105
8 6
113
11
0
20
40
60
80
100
120
Nu
mb
er o
f st
ud
ents
Does Dengue spreads through touch of hand or body touch?
Male Female
TAYLOR’S UNIVERSITY MTH 10304
STATISTICS OF DENGUE DESEASE 22
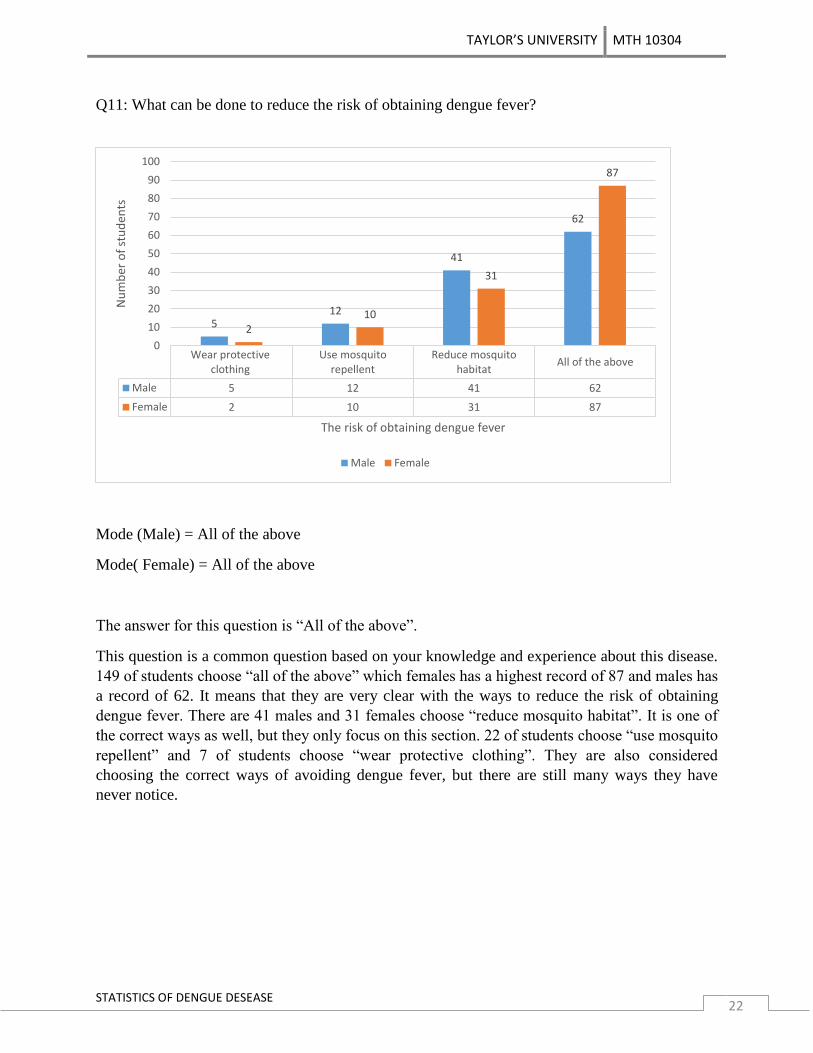
Q11: What can be done to reduce the risk of obtaining dengue fever?
Mode (Male) = All of the above
Mode( Female) = All of the above
The answer for this question is “All of the above”.
This question is a common question based on your knowledge and experience about this disease.
149 of students choose “all of the above” which females has a highest record of 87 and males has
a record of 62. It means that they are very clear with the ways to reduce the risk of obtaining
dengue fever. There are 41 males and 31 females choose “reduce mosquito habitat”. It is one of
the correct ways as well, but they only focus on this section. 22 of students choose “use mosquito
repellent” and 7 of students choose “wear protective clothing”. They are also considered
choosing the correct ways of avoiding dengue fever, but there are still many ways they have
never notice.
Wear protectiveclothing
Use mosquitorepellent
Reduce mosquitohabitat
All of the above
Male 5 12 41 62
Female 2 10 31 87
5 12
41
62
2 10
31
87
0
10
20
30
40
50
60
70
80
90
100
Nu
mb
er o
f st
ud
ents
The risk of obtaining dengue fever
Male Female
TAYLOR’S UNIVERSITY MTH 10304
STATISTICS OF DENGUE DESEASE 23
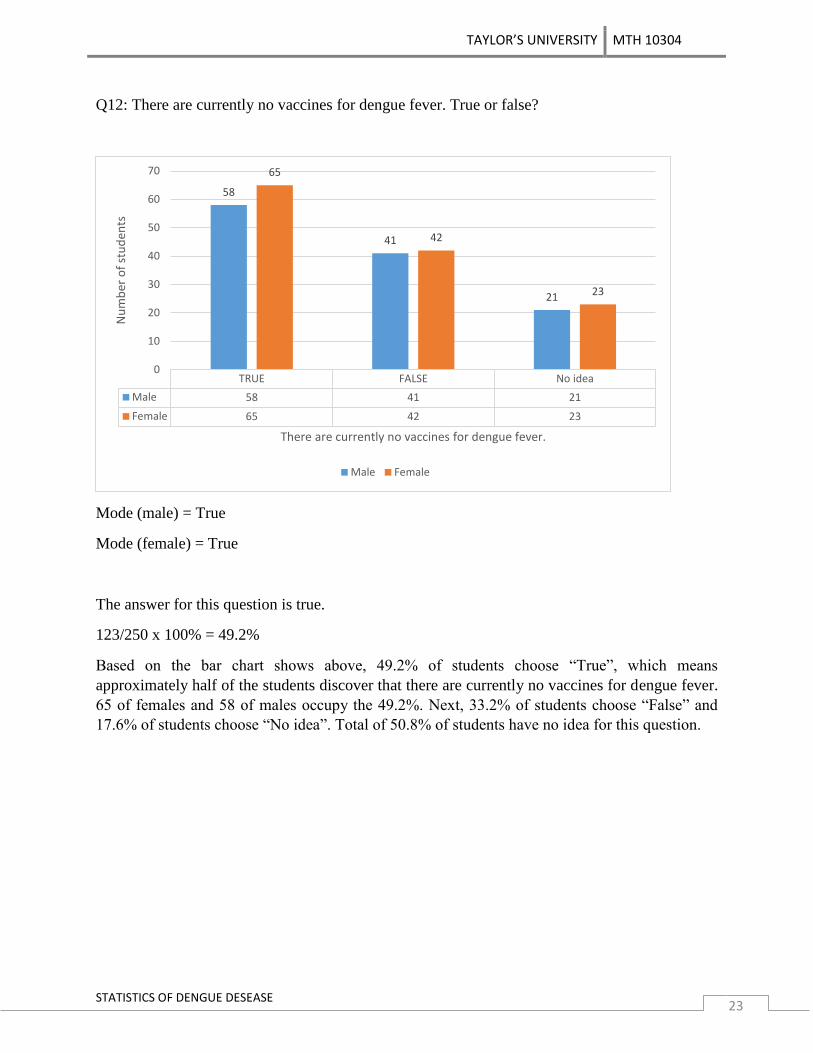
Q12: There are currently no vaccines for dengue fever. True or false?
Mode (male) = True
Mode (female) = True
The answer for this question is true.
123/250 x 100% = 49.2%
Based on the bar chart shows above, 49.2% of students choose “True”, which means
approximately half of the students discover that there are currently no vaccines for dengue fever.
65 of females and 58 of males occupy the 49.2%. Next, 33.2% of students choose “False” and
17.6% of students choose “No idea”. Total of 50.8% of students have no idea for this question.
TRUE FALSE No idea
Male 58 41 21
Female 65 42 23
58
41
21
65
42
23
0
10
20
30
40
50
60
70
Nu
mb
er o
f st
ud
ents
There are currently no vaccines for dengue fever.
Male Female
TAYLOR’S UNIVERSITY MTH 10304
STATISTICS OF DENGUE DESEASE 24
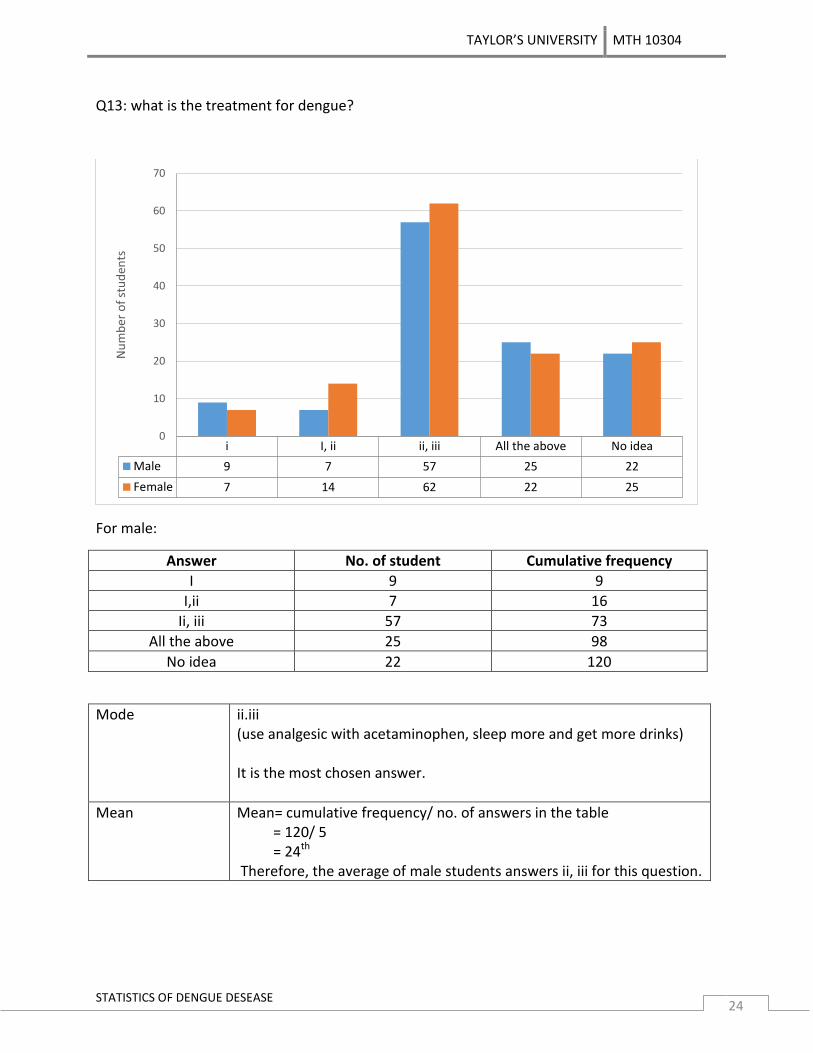
Q13: what is the treatment for dengue?
For male:
Answer No. of student Cumulative frequency
I 9 9
I,ii 7 16
Ii, iii 57 73
All the above 25 98
No idea 22 120
Mode ii.iii (use analgesic with acetaminophen, sleep more and get more drinks) It is the most chosen answer.
Mean Mean= cumulative frequency/ no. of answers in the table = 120/ 5 = 24th Therefore, the average of male students answers ii, iii for this question.
i I, ii ii, iii All the above No idea
Male 9 7 57 25 22
Female 7 14 62 22 25
0
10
20
30
40
50
60
70
Nu
mb
er o
f st
ud
ents
TAYLOR’S UNIVERSITY MTH 10304
STATISTICS OF DENGUE DESEASE 25
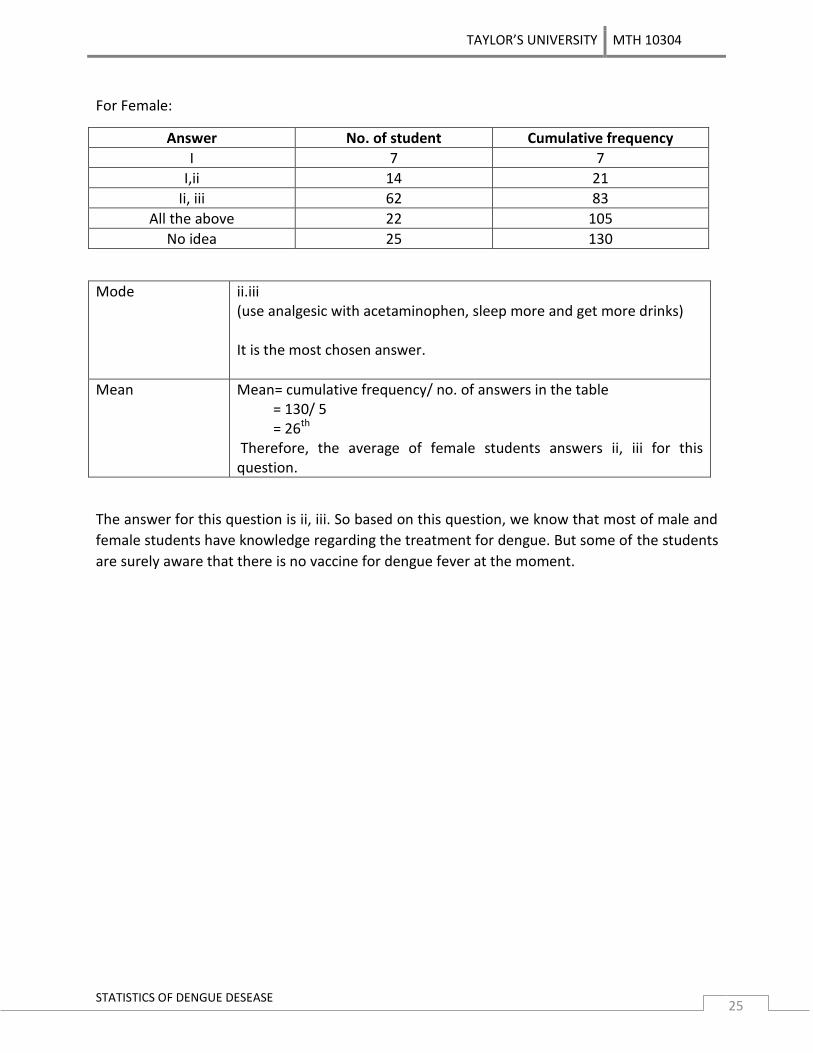
For Female:
Answer No. of student Cumulative frequency
I 7 7
I,ii 14 21
Ii, iii 62 83
All the above 22 105
No idea 25 130
Mode ii.iii (use analgesic with acetaminophen, sleep more and get more drinks) It is the most chosen answer.
Mean Mean= cumulative frequency/ no. of answers in the table = 130/ 5 = 26th Therefore, the average of female students answers ii, iii for this question.
The answer for this question is ii, iii. So based on this question, we know that most of male and
female students have knowledge regarding the treatment for dengue. But some of the students
are surely aware that there is no vaccine for dengue fever at the moment.
TAYLOR’S UNIVERSITY MTH 10304
STATISTICS OF DENGUE DESEASE 26
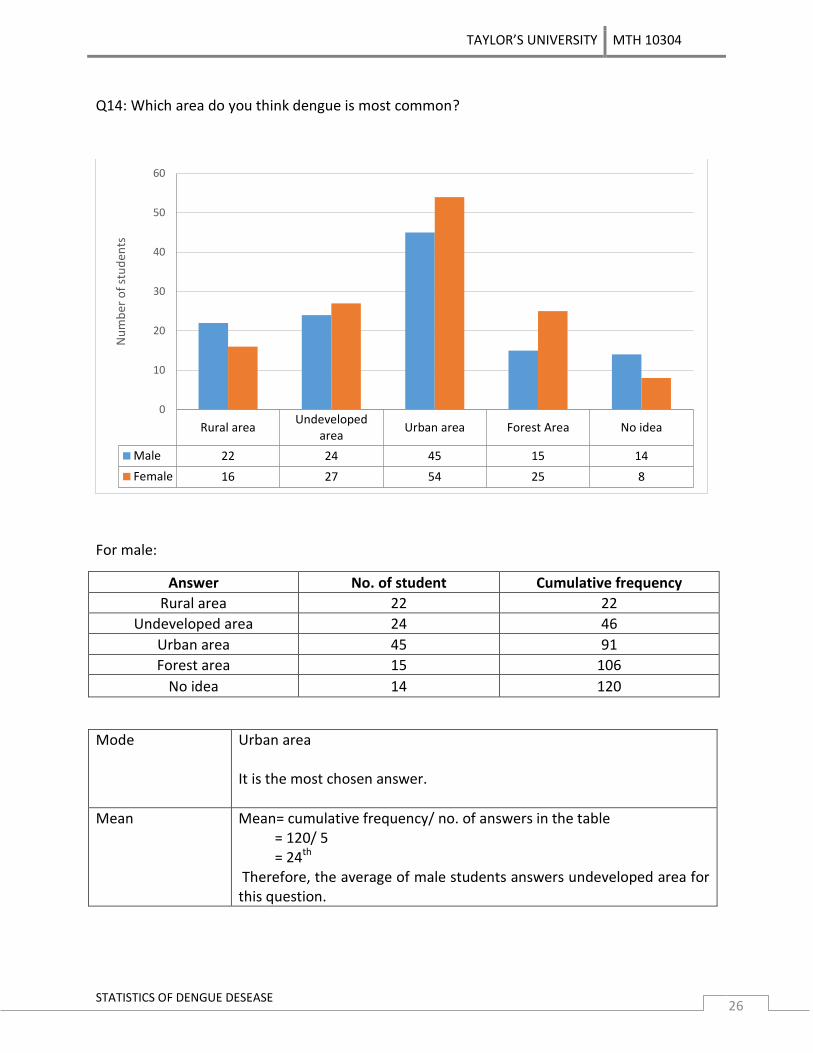
Q14: Which area do you think dengue is most common?
For male:
Answer No. of student Cumulative frequency
Rural area 22 22
Undeveloped area 24 46
Urban area 45 91
Forest area 15 106
No idea 14 120
Mode Urban area It is the most chosen answer.
Mean Mean= cumulative frequency/ no. of answers in the table = 120/ 5 = 24th Therefore, the average of male students answers undeveloped area for this question.
Rural areaUndeveloped
areaUrban area Forest Area No idea
Male 22 24 45 15 14
Female 16 27 54 25 8
0
10
20
30
40
50
60
Nu
mb
er o
f st
ud
ents
TAYLOR’S UNIVERSITY MTH 10304
STATISTICS OF DENGUE DESEASE 27
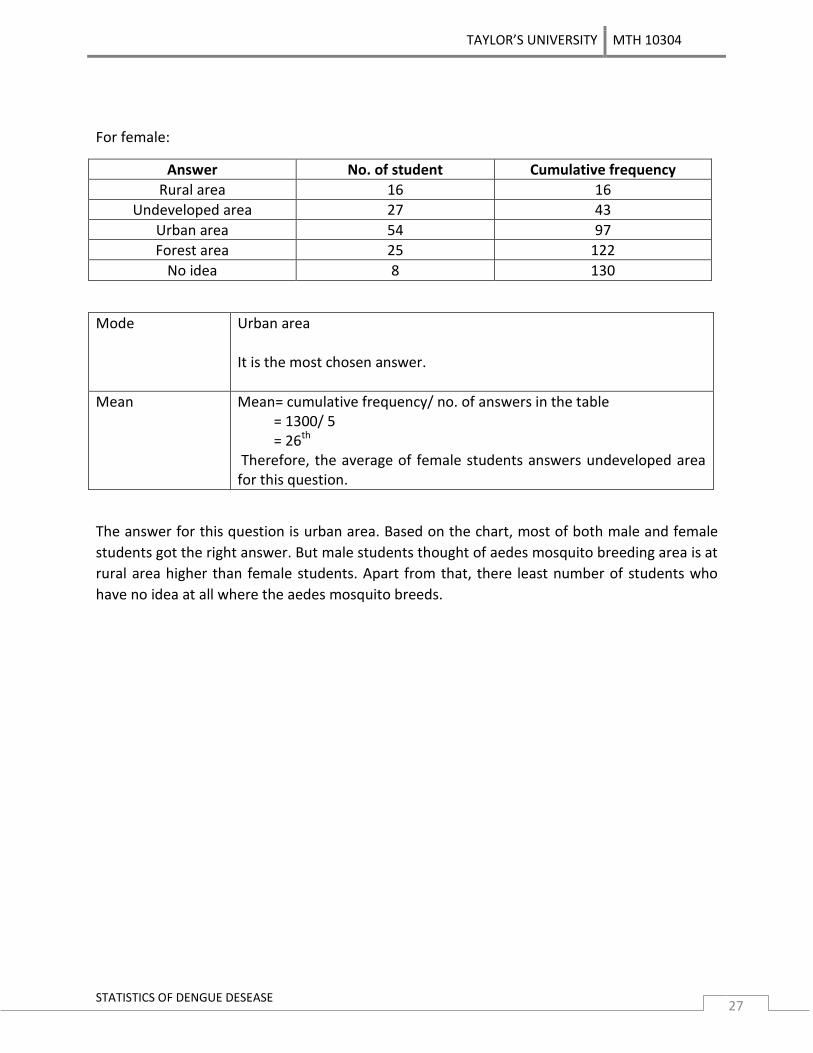
For female:
Answer No. of student Cumulative frequency
Rural area 16 16
Undeveloped area 27 43
Urban area 54 97
Forest area 25 122
No idea 8 130
Mode Urban area It is the most chosen answer.
Mean Mean= cumulative frequency/ no. of answers in the table = 1300/ 5 = 26th Therefore, the average of female students answers undeveloped area for this question.
The answer for this question is urban area. Based on the chart, most of both male and female
students got the right answer. But male students thought of aedes mosquito breeding area is at
rural area higher than female students. Apart from that, there least number of students who
have no idea at all where the aedes mosquito breeds.
TAYLOR’S UNIVERSITY MTH 10304
STATISTICS OF DENGUE DESEASE 28
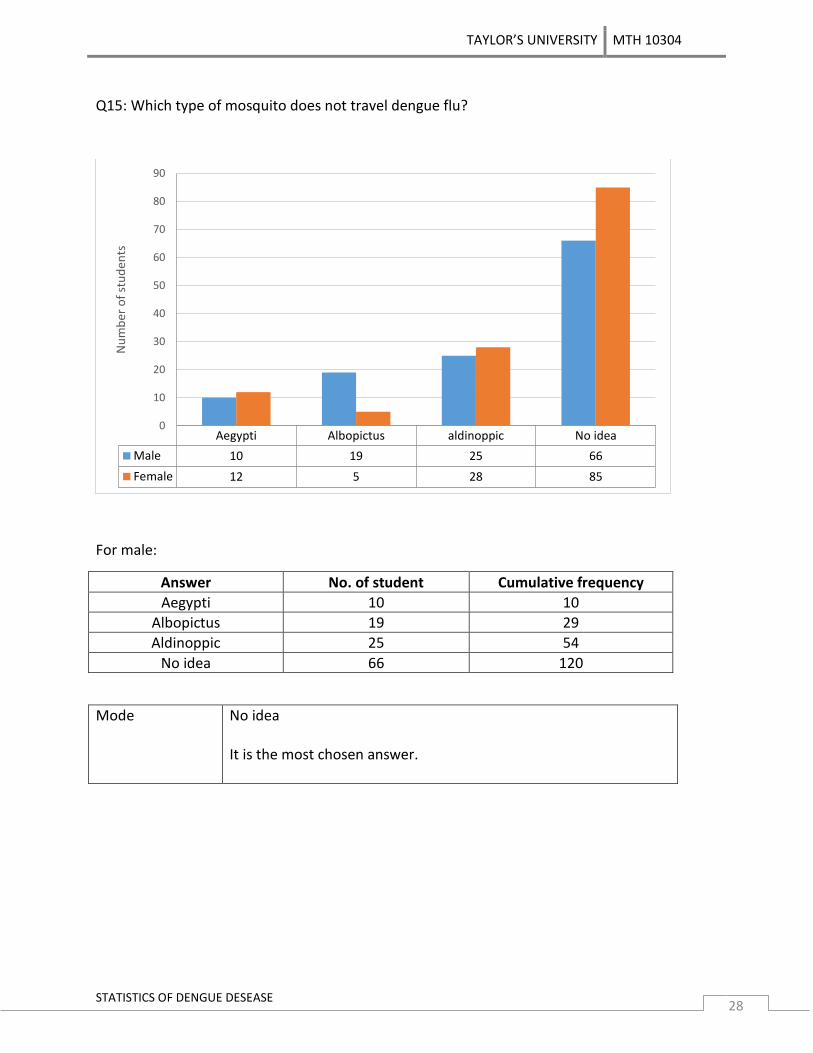
Q15: Which type of mosquito does not travel dengue flu?
For male:
Answer No. of student Cumulative frequency
Aegypti 10 10
Albopictus 19 29
Aldinoppic 25 54
No idea 66 120
Mode No idea It is the most chosen answer.
Aegypti Albopictus aldinoppic No idea
Male 10 19 25 66
Female 12 5 28 85
0
10
20
30
40
50
60
70
80
90
Nu
mb
er o
f st
ud
ents
TAYLOR’S UNIVERSITY MTH 10304
STATISTICS OF DENGUE DESEASE 29
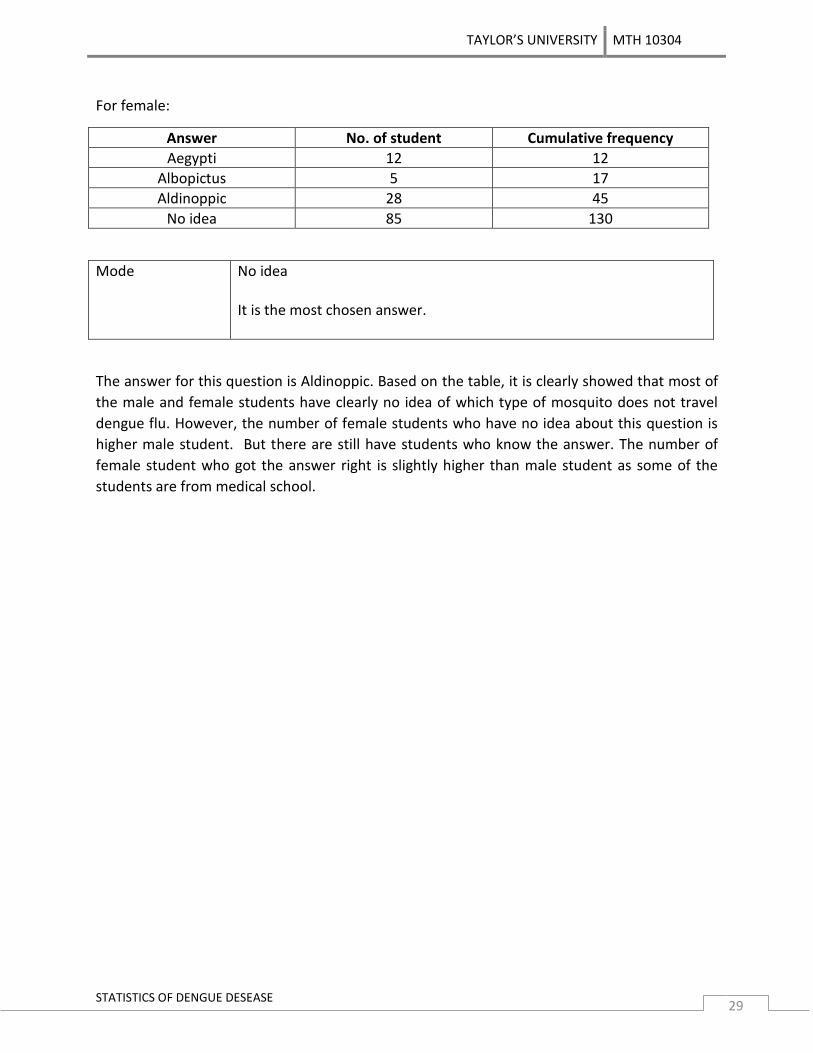
For female:
Answer No. of student Cumulative frequency
Aegypti 12 12
Albopictus 5 17
Aldinoppic 28 45
No idea 85 130
Mode No idea It is the most chosen answer.
The answer for this question is Aldinoppic. Based on the table, it is clearly showed that most of
the male and female students have clearly no idea of which type of mosquito does not travel
dengue flu. However, the number of female students who have no idea about this question is
higher male student. But there are still have students who know the answer. The number of
female student who got the answer right is slightly higher than male student as some of the
students are from medical school.
TAYLOR’S UNIVERSITY MTH 10304
STATISTICS OF DENGUE DESEASE 30
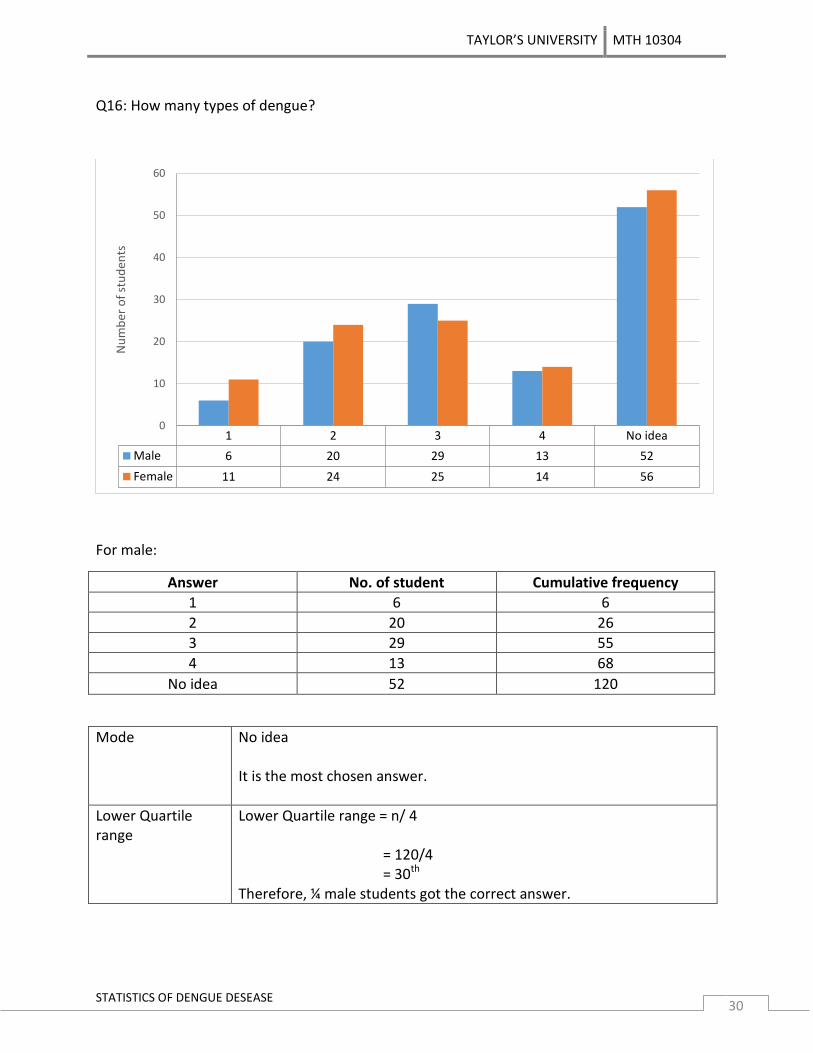
Q16: How many types of dengue?
For male:
Answer No. of student Cumulative frequency
1 6 6
2 20 26
3 29 55
4 13 68
No idea 52 120
Mode No idea It is the most chosen answer.
Lower Quartile range
Lower Quartile range = n/ 4 = 120/4 = 30th Therefore, ¼ male students got the correct answer.
1 2 3 4 No idea
Male 6 20 29 13 52
Female 11 24 25 14 56
0
10
20
30
40
50
60
Nu
mb
er o
f st
ud
ents
TAYLOR’S UNIVERSITY MTH 10304
STATISTICS OF DENGUE DESEASE 31
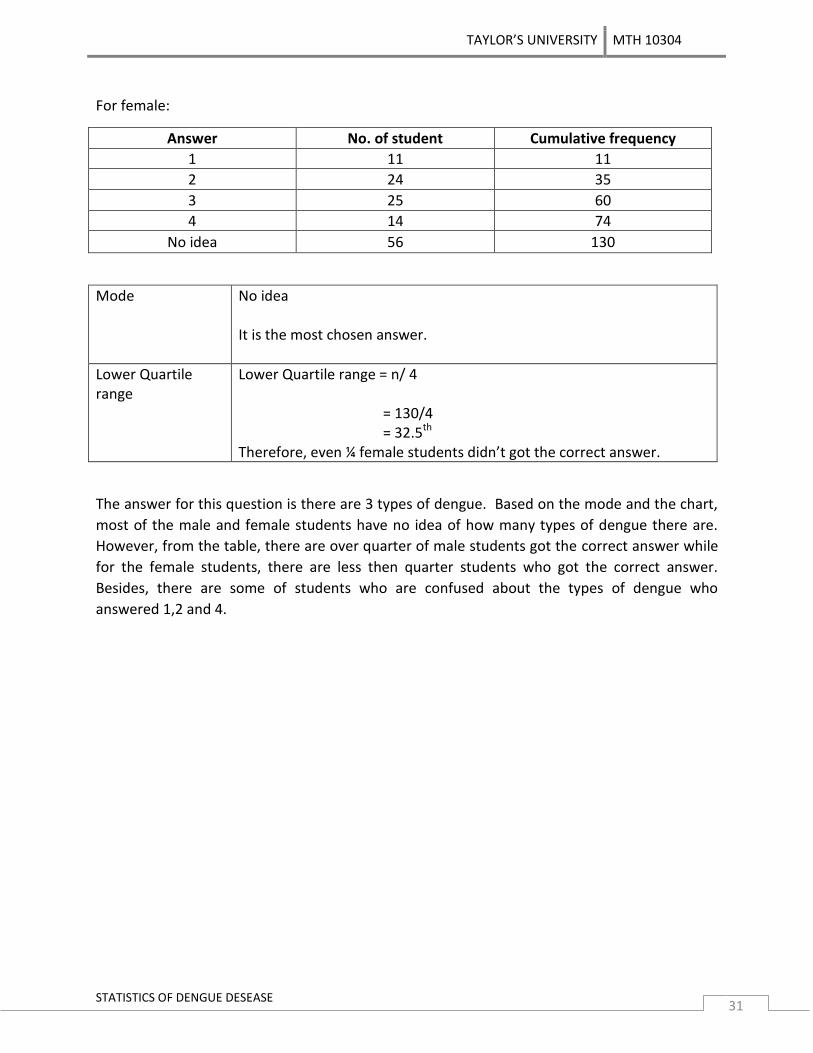
For female:
Answer No. of student Cumulative frequency
1 11 11
2 24 35
3 25 60
4 14 74
No idea 56 130
Mode No idea It is the most chosen answer.
Lower Quartile range
Lower Quartile range = n/ 4 = 130/4 = 32.5th Therefore, even ¼ female students didn’t got the correct answer.
The answer for this question is there are 3 types of dengue. Based on the mode and the chart,
most of the male and female students have no idea of how many types of dengue there are.
However, from the table, there are over quarter of male students got the correct answer while
for the female students, there are less then quarter students who got the correct answer.
Besides, there are some of students who are confused about the types of dengue who
answered 1,2 and 4.
TAYLOR’S UNIVERSITY MTH 10304
STATISTICS OF DENGUE DESEASE 32
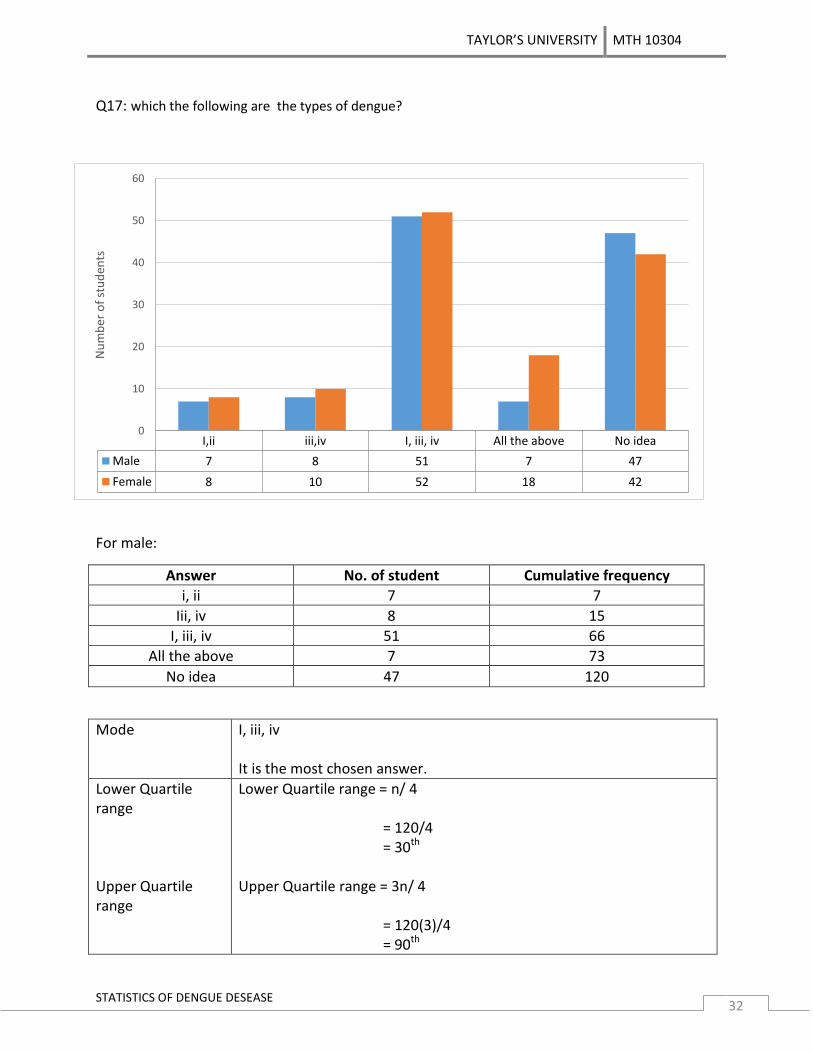
Q17: which the following are the types of dengue?
For male:
Answer No. of student Cumulative frequency
i, ii 7 7
Iii, iv 8 15
I, iii, iv 51 66
All the above 7 73
No idea 47 120
Mode I, iii, iv It is the most chosen answer.
Lower Quartile range
Lower Quartile range = n/ 4 = 120/4 = 30th
Upper Quartile range
Upper Quartile range = 3n/ 4 = 120(3)/4 = 90th
I,ii iii,iv I, iii, iv All the above No idea
Male 7 8 51 7 47
Female 8 10 52 18 42
0
10
20
30
40
50
60
Nu
mb
er o
f st
ud
ents
TAYLOR’S UNIVERSITY MTH 10304
STATISTICS OF DENGUE DESEASE 33
Interquartile range Upper quartile range – lower quartile range = 90 – 30 = 60th
For female:
Answer No. of student Cumulative frequency
i, ii 8 8
Iii, iv 10 18
I, iii, iv 52 70
All the above 18 88
No idea 42 130
Mode I, iii, iv It is the most chosen answer.
Lower Quartile range
Lower Quartile range = n/ 4 = 130/4 = 32.5th
Upper Quartile range
Upper Quartile range = 3n/ 4 = 130(3)/4 = 97.5th
Interquartile range Upper quartile range – lower quartile range = 97.5 – 32.5 = 65th
The answer for this question is I, iii, iv (Dengue fever, Dengue Shock Syndrome, Dengue
Hemorrhagic Syndrome). Based on the graph, it showed most of the male and female students
got the correct answer. Surprisingly compared to previous question which is relatable, most of
the students have no idea of how many types of dengue there are. The interquartile range
shows there are students who have no idea about the question even though there have clue of
the type of dengue. Somehow, there are least number of student tried to answer the question
but got it wrong.

TAYLOR’S UNIVERSITY MTH 10304
STATISTICS OF DENGUE DESEASE 34