outcome, prognosis, and risk in a longitudinal follow-up study
TRANSCRIPT
Outcome, Prognosis, and Risk in a Longitudinal Follow-up Study
DAVID R. OFFORD, M.D., MICHAEL H. BOYLE, PH.D., YVONNE' A. RACINE, M.A., JAN E. FLEMING, M.D.,DAVID T. CADMAN, M.D., HEATHER MUNROE BLUM, PH.D., CAROLYN BYRNE, R.N., M.Sc.,
PAUL S. LINKS, M.D., ELLEN L. LIPMAN, M.D., HARRIET L. MACMILLAN, M.D.,NAOMI I. RAE GRANT, M.D., MARK N. SANFORD, M.D., PETER SZATMARI, M.D.,
HELEN THOMAS, R.N., M.Sc., AND CHRISTEL A. WOODWARD, PH.D.
Abstract. This study reports the results of a 4-year follow-up of a community sample of children who wereages 4 to 12 in 1983 at the first wave of data collection. Results on outcomes revealed that conduct disorder showedthe greatest stability especially from late childhood to early adolescence. In multivariate analyses, both familydysfunction and problems getting along with others significantly predicted the persistence of one or more psychiatricdisorders 4 years later, and low income predicted one or more psychiatric disorders among children free of disorder4 years earlier. The implications of the results for the child psychiatric field, especially prevention, are discussed.J. Am. Acad. ChildAdolesc. Psychiatry, 1992,31,5:916-923. Key Words: follow-up, outcome, prognostic factors,risk factors.
Much useful knowledge in child psychiatric epidemiologyhas come from large-scale cross-sectional community surveys (Offord and Fleming, 1991). These surveys are able toprovide data on the prevalence of psychiatric disorders aswell as on their correlates and associated features such asimpairments and use of services (Costello, 1989; Offordet al., 1987)
Follow-up studies can add to this knowledge in threemajor areas. First, they can provide data on the outcome ofdisorder so that the proportion of children with a disorderwho display clinically important sequelae, including the persistence of the disorder itself, can be established. Second,prognostic factors that predict the outcome of disorder canbe identified. Thus, among children with a disorder at onepoint in time, factors predicting its persistence at a later timemay be ascertained. Third, risk factors for the onset of newdisorders can be discovered. Here, children without disorderat one point in time become the focus of study. The strengthof factors having an independent effect in predicting theonset of disorder can be determined.
This report uses data from the Ontario Child Health Study(OCHS) and follow-up 4 years later to address issues ofoutcome, prognosis, and risk in child psychiatric disorders.
Accepted November 19, 1991.The authors are from the Child Epidemiology Unit, Department of
Psychiatry, McMaster University, and the Child and Family Centre,Chedoke Division, Chedoke-McMaster Hospitals, Hamilton, Ontario.
This work was supported by funds from the Ontario Ministry ofCommunity and Social Services and the Ontario Ministry of Health.
Dr. Offord is supported by a National Health Scientist Award,Health and Welfare Canada, Dr. Boyle by a William T. Grant FacultyScholar Award, Drs. Szatmari, Lipman and MacMillan by ResearchFellowships, Ontario Mental Health Foundation, and Dr. Fleming bya NARSAD Young Investigator Award.
Reprint requests to Dr. Offord, Patterson Building, Chedoke Division, Chedoke-McMaster Hospitals, Box 2000, Station A, Hamilton,Ontario, Canada, UN 325.
0890-8567/92/31 05-O916$03.00/0© 1992 by the American Academy of Child and Adolescent Psychiatry.
916
Methodology of the Original OCHS and Follow-up
ORIGINAL OCHS
The methodology used in the original OCHS is describedin detail elsewhere (Boyle et al., 1987). Briefly, the targetpopulation of the OCHS included all children 4 to 16 yearsof age on January 1, 1983, whose usual place of residencewas a household dwelling. Children living on Indian reserves, in collective dwellings such as institutions, and indwellings constructed since June 1, 1981 (Census Day),were excluded systematically from the survey, but accounted for only 3.3% of the target population. The samplingframe (source of subjects) was the 1981 Canada Census withthe sampling units being household dwellings. The samplewas obtained by stratified, clustered, and random samplingfrom the census file. The entire province was divided intofour major strata corresponding to the administrative regionsdefined by the Ontario Ministry of Community and SocialServices. Each region was divided further into three stratabased on the population of the 1981 census: large urbanareas with a population of more than 25,000; small urbanareas varying in population from 3,000 to 25,000; and ruralareas with populations less than 3,000. In large urban areas,a simple random sample of households was taken. In smallurban and rural areas, two-stage sampling procedures wereused. The first stage consisted of a random sample of areas;the second stage, a random sample of households.
Interviewers collected information from the female headof household (parents) and youth aged 12 to 16 during ahome visit. With parental consent, teachers of children inschool were mailed a problem checklist to be completed andreturned in a stamped, self-addressed envelope. The fieldwork was done in January and February 1983 by StatisticsCanada, which is responsible at the federal level for thecensus, labor force survey, and other data collection forgovernment. Among all eligible households, 91.1 % (1,869)participated.
OCHS FOLLOW-UP
All children and families who participated in the original
J.Am. Acad. Child Adolesc. Psychiatry, 31:5,September 1992
OUTCOME, PROGNOSIS, AND RISK
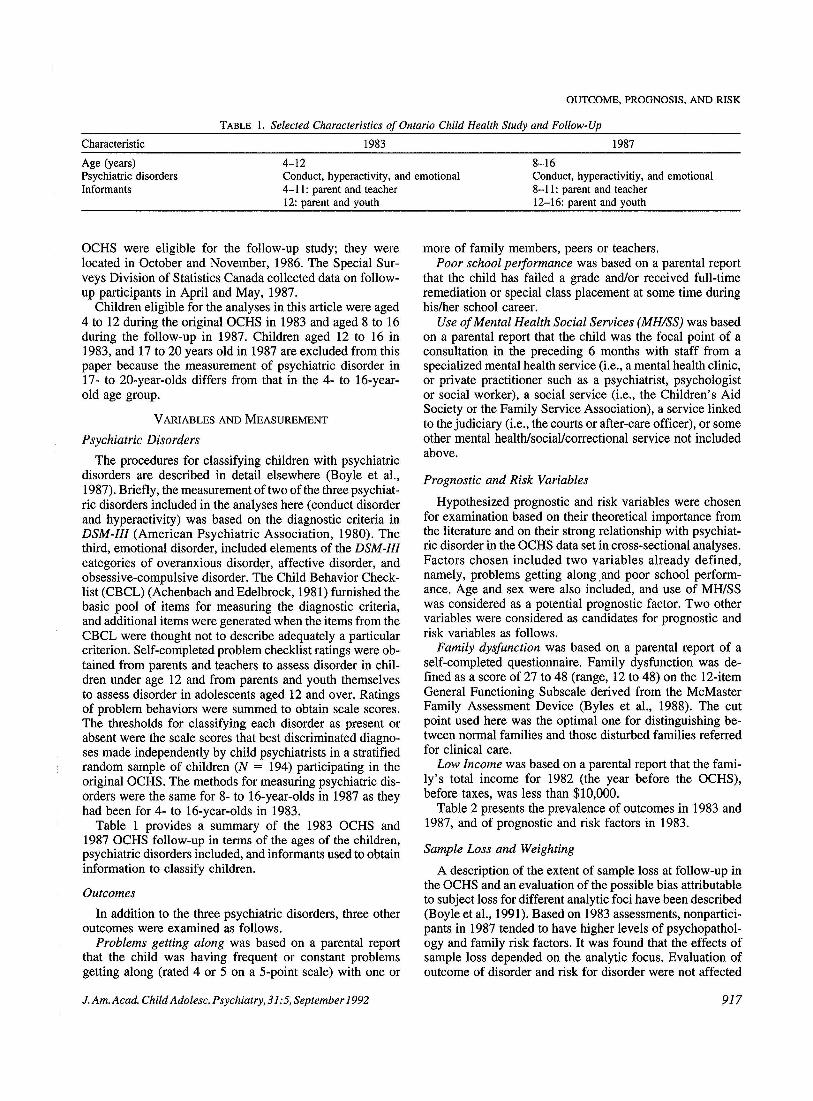
TABLE 1. Selected Characteristics of Ontario Child Health Study and Follow-Up
Characteristic
Age (years)Psychiatric disordersInformants
1983
4-12Conduct, hyperactivity, and emotional4-11: parent and teacher12: parent and youth
1987
8-16Conduct, hyperactivitiy, and emotional8-11: parent and teacher12-16: parent and youth
OCHS were eligible for the follow-up study; they werelocated in October and November, 1986. The Special Surveys Division of Statistics Canada collected data on followup participants in April and May, 1987.
Children eligible for the analyses in this article were aged4 to 12 during the original OCHS in 1983 and aged 8 to 16during the follow-up in 1987. Children aged 12 to 16 in1983, and 17 to 20 years old in 1987 are excluded from thispaper because the measurement of psychiatric disorder in17- to 20-year-olds differs from that in the 4- to 16-yearold age group.
VARIABLES AND MEASUREMENT
Psychiatric Disorders
The procedures for classifying children with psychiatricdisorders are described in detail elsewhere (Boyle et aI.,1987). Briefly, the measurement of two of the three psychiatric disorders included in the analyses here (conduct disorderand hyperactivity) was based on the diagnostic criteria inDSM-III (American Psychiatric Association, 1980). Thethird, emotional disorder, included elements of the DSM-IIIcategories of overanxious disorder, affective disorder, andobsessive-compulsive disorder. The Child Behavior Checklist (CBCL) (Achenbach and Edelbrock, 1981) furnished thebasic pool of items for measuring the diagnostic criteria,and additional items were generated when the items from theCBCL were thought not to describe adequately a particularcriterion. Self-completed problem checklist ratings were obtained from parents and teachers to assess disorder in children under age 12 and from parents and youth themselvesto assess disorder in adolescents aged 12 and over. Ratingsof problem behaviors were summed to obtain scale scores.The thresholds for classifying each disorder as present orabsent were the scale scores that best discriminated diagnoses made independently by child psychiatrists in a stratifiedrandom sample of children (N = 194) participating in theoriginal OCHS. The methods for measuring psychiatric disorders were the same for 8- to 16-year-olds in 1987 as theyhad been for 4- to 16-year-olds in 1983.
Table 1 provides a summary of the 1983 OCHS and1987 OCHS follow-up in terms of the ages of the children,psychiatric disorders included, and informants used to obtaininformation to classify children.
Outcomes
In addition to the three psychiatric disorders, three otheroutcomes were examined as follows.
Problems getting along was based on a parental reportthat the child was having frequent or constant problemsgetting along (rated 4 or 5 on a 5-point scale) with one or
J. Am. Acad. Child Adolesc. Psychiatry, 31:5, September 1992
more of family members, peers or teachers.Poor school performance was based on a parental report
that the child has failed a grade and/or received full-timeremediation or special class placement at some time duringhis/her school career.
Use ofMental Health Social Services (MH/SS) was basedon a parental report that the child was the focal point of aconsultation in the preceding 6 months with staff from aspecialized mental health service (i.e., a mental health clinic,or private practitioner such as a psychiatrist, psychologistor social worker), a social service (i.e., the Children's AidSociety or the Family Service Association), a service linkedto the judiciary (i.e., the courts or after-care officer), or someother mental healthlsociallcorrectional service not includedabove.
Prognostic and Risk Variables
Hypothesized prognostic and risk variables were chosenfor examination based on their theoretical importance fromthe literature and on their strong relationship with psychiatric disorder in the OCHS data set in cross-sectional analyses.Factors chosen included two variables already defined,namely, problems getting along .and poor school performance. Age and sex were also included, and use of MHISSwas considered as a potential prognostic factor. Two othervariables were considered as candidates for prognostic andrisk variables as follows.
Family dysfunction was based on a parental report of aself-completed questionnaire. Family dysfunction was defined as a score of 27 to 48 (range, 12 to 48) on the 12-itemGeneral Functioning Subscale derived from the McMasterFamily Assessment Device (Byles et aI., 1988). The cutpoint used here was the optimal one for distinguishing between normal families and those disturbed families referredfor clinical care.
Low Income was based on a parental report that the family's total income for 1982 (the year before the OCHS),before taxes, was less than $10,000.
Table 2 presents the prevalence of outcomes in 1983 and1987, and of prognostic and risk factors in 1983.
Sample Loss and Weighting
A description of the extent of sample loss at follow-up inthe OCHS and an evaluation of the possible bias attributableto subject loss for different analytic foci have been described(Boyle et aI., 1991). Based on 1983 assessments, nonparticipants in 1987 tended to have higher levels of psychopathology and family risk factors. It was found that the effects ofsample loss depended on the analytic focus. Evaluation ofoutcome of disorder and risk for disorder were not affected
917
OFFORD ET AL.
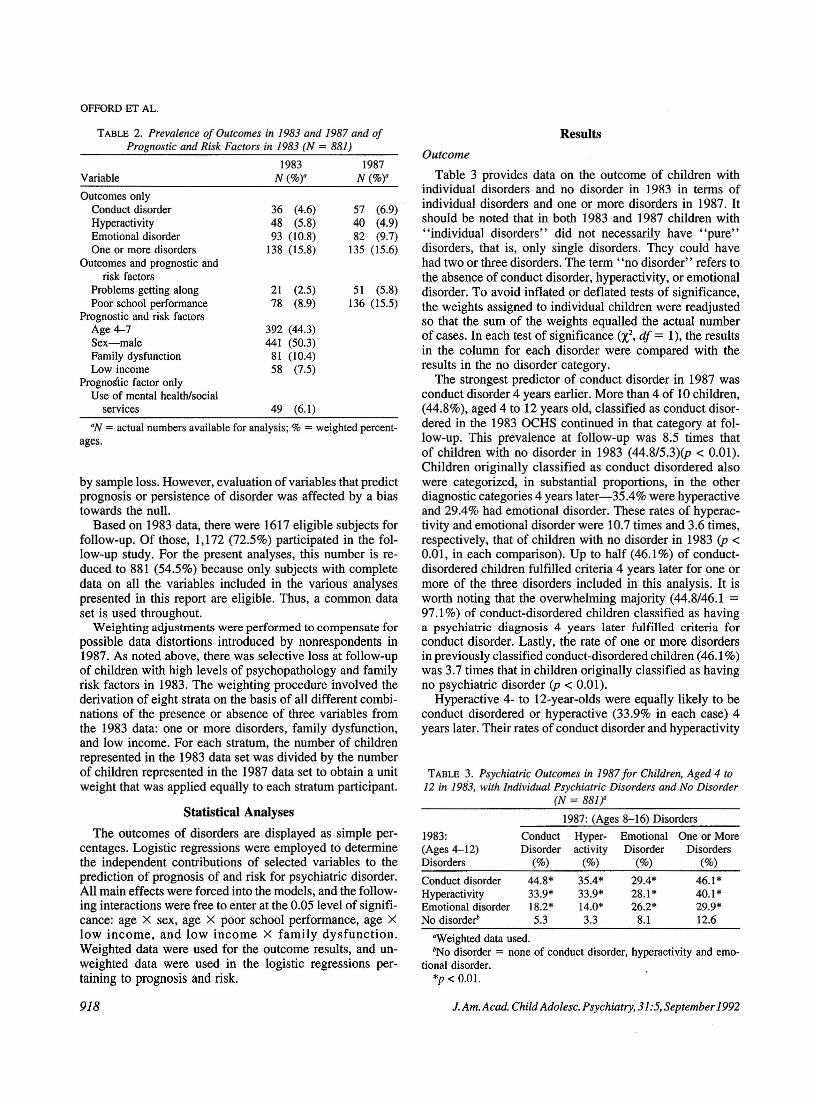
TABLE 2. Prevalence of Outcomes in 1983 and 1987 and ofPrognostic and Risk Factors in 1983 (N = 881)
"N = actual numbers available for analysis; % = weighted percentages.
by sample loss. However, evaluation of variables that predictprognosis or persistence of disorder was affected by a biastowards the null.
Based on 1983 data, there were 1617 eligible subjects forfollow-up. Of those, 1,172 (72.5%) participated in the follOW-Up study. For the present analyses, this number is reduced to 881 (54.5%) because only subjects with completedata on all the variables included in the various analysespresented in this report are eligible. Thus, a common dataset is used throughout.
Weighting adjustments were performed to compensate forpossible data distortions introduced by nonrespondents in1987. As noted above, there was selective loss at follow-upof children with high levels of psychopathology and familyrisk factors in 1983. The weighting procedure involved thederivation of eight strata on the basis of all different combinations of the presence or absence of three variables fromthe 1983 data: one or more disorders, family dysfunction,and low income. For each stratum, the number of childrenrepresented in the 1983 data set was divided by the numberof children represented in the 1987 data set to obtain a unitweight that was applied equally to each stratum participant.
Statistical Analyses
The outcomes of disorders are displayed as simple percentages. Logistic regressions were employed to determinethe independent contributions of selected variables to theprediction of prognosis of and risk for psychiatric disorder.All main effects were forced into the models, and the following interactions were free to enter at the 0.05 level of significance: age X sex, age X poor school performance, age Xlow income, and low income X family dysfunction.Weighted data were used for the outcome results, and unweighted data were used in the logistic regressions pertaining to prognosis and risk.
Results
1987: (Ages 8-16) Disorders
44.8* 35.4* 29.4* 46.1*33.9* 33.9* 28.1* 40.1*18.2* 14.0* 26.2* 29.9*5.3 3.3 8.1 12.6
Conduct Hyper- Emotional One or MoreDisorder activity Disorder Disorders
(%) (%) (%) (%)
Conduct disorderHyperactivityEmotional disorderNo disorder!'
TABLE 3. Psychiatric Outcomes in 1987 for Children, Aged 4 to12 in 1983, with Individual Psychiatric Disorders and No Disorder
(N = 881)"
1983:(Ages 4-1 2)Disorders
aWeighted data used.bNodisorder = none of conduct disorder, hyperactivity and emo
tional disorder.*p < om.
Outcome
Table 3 provides data on the outcome of children withindividual disorders and no disorder in 1983 in terms ofindividual disorders and one or more disorders in 1987. Itshould be noted that in both 1983 and 1987 children with" individual disorders" did not necessarily have " pure"disorders, that is, only single disorders. They could havehad two or three disorders. The term " no disorder" refers tothe absence of conduct disorder, hyperactivity, or emotionaldisorder. To avoid inflated or deflated tests of significance,the weights assigned to individual children were readjustedso that the sum of the weights equalled the actual numberof cases. In each test of significance (X2
, df = 1), the resultsin the column for each disorder were compared with theresults in the no disorder category .
The strongest predictor of conduct disorder in 1987 wasconduct disorder 4 years earlier. More than 4 of 10 children,(44.8%), aged 4 to 12 years old, classified as conduct disordered in the 1983 OCHS continued in that category at follOW-Up. This prevalence at follow-up was 8.5 times thatof children with no disorder in 1983 (44.8/5.3)(p < 0.01).Children originally classified as conduct disordered alsowere categorized, in substantial proportions, in the otherdiagnostic categories 4 years later-35.4% were hyperactiveand 29.4% had emotional disorder. These rates of hyperactivity and emotional disorder were 10.7 times and 3.6 times,respectively, that of children with no disorder in 1983 (p <0.01, in each comparison). Up to half (46.1%) of conductdisordered children fulfilled criteria 4 years later for one ormore of the three disorders included in this analysis. It isworth noting that the overwhelming majority (44.8/46.1 =97.1%) of conduct-disordered children classified as havinga psychiatric diagnosis 4 years later fulfilled criteria forconduct disorder. Lastly, the rate of one or more disordersin previously classified conduct-disordered children (46.1%)was 3.7 times that in children originally classified as havingno psychiatric disorder (p < 0.01).
Hyperactive 4- to 12-year-olds were equally likely to beconduct disordered or hyperactive (33.9% in each case) 4years later. Their rates of conduct disorder and hyperactivity
1987N (%)a
57 (6.9)40 (4.9)82 (9.7)
135 (15.6)
51 (5.8)136 (15.5)
21 (2.5)78 (8.9)
1983N (%)a
49 (6.1)
36 (4.6)48 (5.8)93 (10.8)
138 (15.8)
392 (44.3)441 (50.3)
81 (10.4)58 (7.5)
Variable
Outcomes onlyConduct disorderHyperactivityEmotional disorderOne or more disorders
Outcomes and prognostic andrisk factors
Problems getting alongPoor school performance
Prognostic and risk factorsAge 4-7Sex-maleFamily dysfunctionLow income
Prognostic factor onlyUse of mental health/social
services
918 J.Am.Acad. Child Adolesc. Psychiatry,31: 5, September 1992
OUTCOME, PROGNOSIS, AND RISK
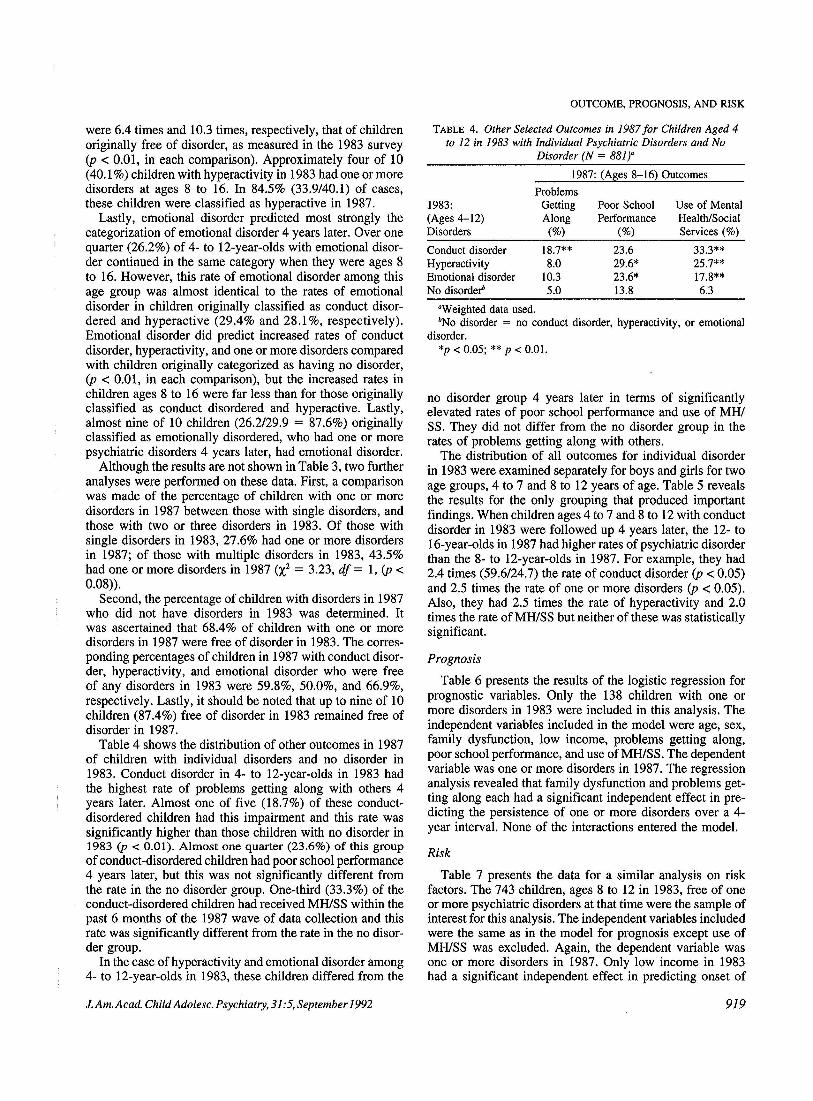
TABLE 4. Other Selected Outcomes in 1987 for Children Aged 4to 12 in 1983 with 1ndividual Psychiatric Disorders and No
Disorder (N = 881)"
"Weighted data used.bNo disorder = no conduct disorder, hyperactivity, or emotional
disorder.*p < 0.05; ** p < 0.01.
no disorder group 4 years later in terms of significantlyelevated rates of poor school performance and use of MHISS. They did not differ from the no disorder group in therates of problems getting along with others.
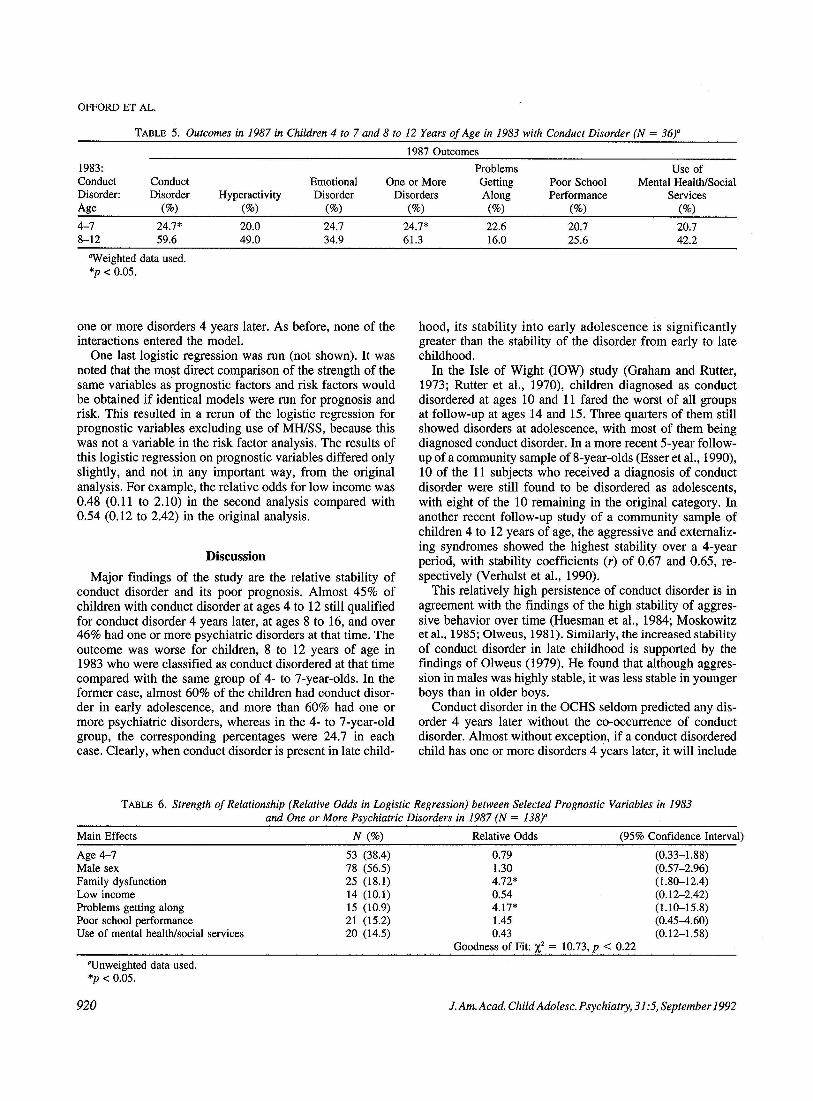
The distribution of all outcomes for individual disorderin 1983 were examined separately for boys and girls for twoage groups, 4 to 7 and 8 to 12 years of age. Table 5 revealsthe results for the only grouping that produced importantfindings. When children ages 4 to 7 and 8 to 12 with conductdisorder in 1983 were followed up 4 years later, the 12- to16-year-olds in 1987 had higher rates of psychiatric disorderthan the 8- to 12-year-01ds in 1987. For example, they had2.4 times (59.6/24.7) the rate of conduct disorder (p < 0.05)and 2.5 times the rate of one or more disorders (p < 0.05).Also, they had 2.5 times the rate of hyperactivity and 2.0times the rate of MH/SS but neither of these was statisticallysignificant.
Prognosis
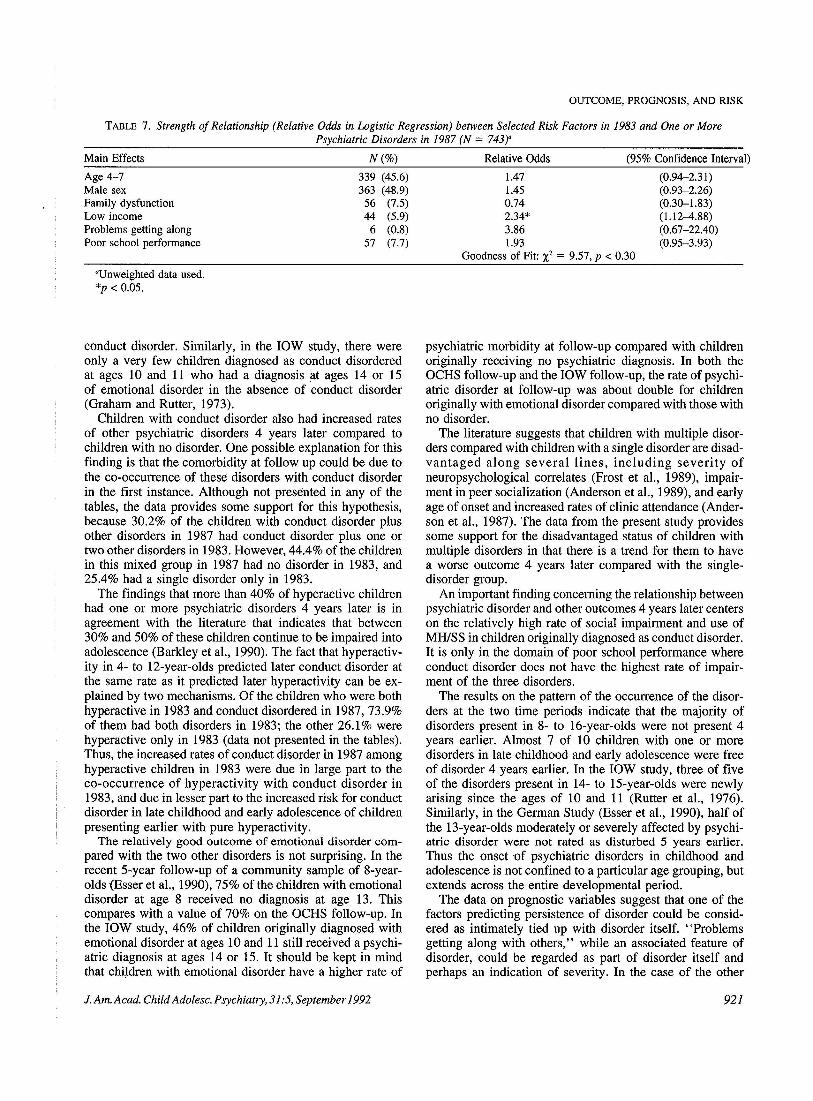
Table 6 presents the results of the logistic regression forprognostic variables. Only the 138 children with one ormore disorders in 1983 were included in this analysis. Theindependent variables included in the model were age, sex,family dysfunction, low income, problems getting along,poor school performance, and use ofMHlSS. The dependentvariable was one or more disorders in 1987. The regressionanalysis revealed that family dysfunction and problems getting along each had a significant independent effect in predicting the persistence of one or more disorders over a 4year interval. None of the interactions entered the model.
Risk
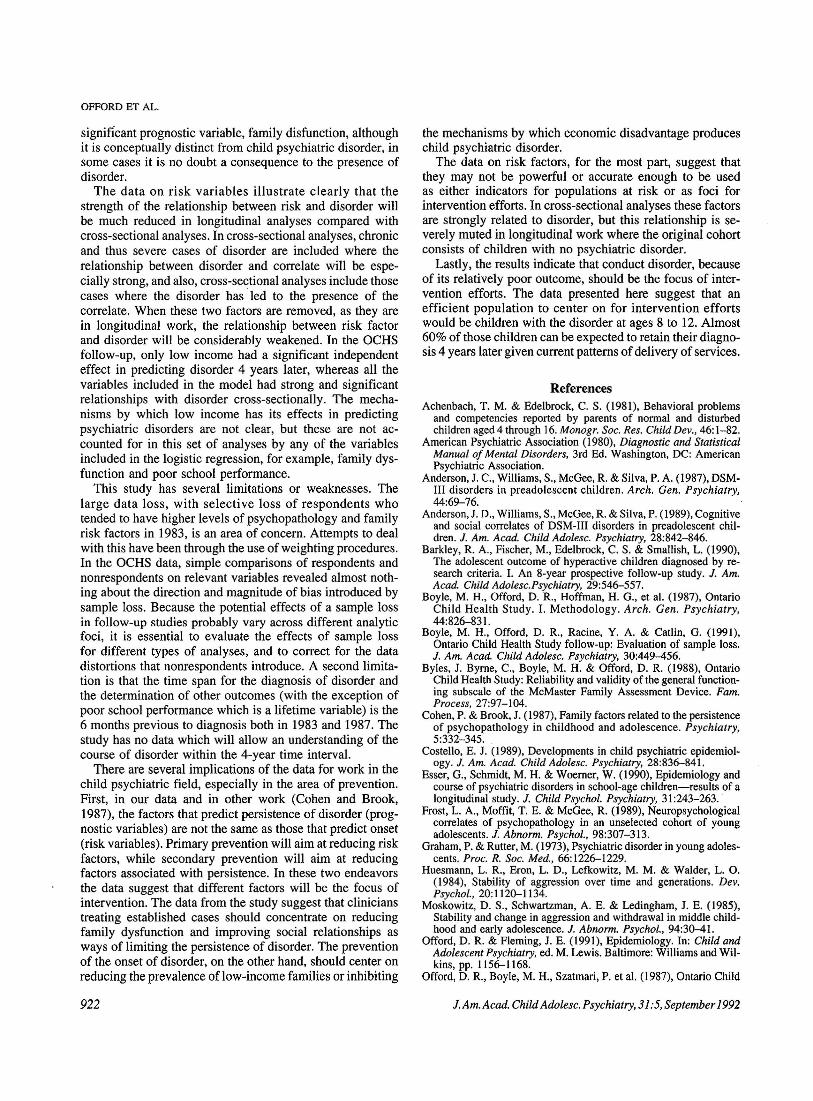
Table 7 presents the data for a similar analysis on riskfactors. The 743 children, ages 8 to 12 in 1983, free of oneor more psychiatric disorders at that time were the sample ofinterest for this analysis. The independent variables includedwere the same as in the model for prognosis except use ofMHiSS was excluded. Again, the dependent variable wasone or more disorders in 1987. Only low income in 1983had a significant independent effect in predicting onset of
33.3**25.7**17.8**6.3
Use of MentalHealth/SocialServices (%)
23.629.6*23.6*13.8
Poor SchoolPerformance
(%)
1987: (Ages 8-16) Outcomes
18.7**8.0
10.35.0
ProblemsGettingAlong
(%)
Conduct disorderHyperactivityEmotional disorderNo disorder!'
1983:(Ages 4-12)Disorders
were 6.4 times and 10.3 times, respectively, that of childrenoriginally free of disorder, as measured in the 1983 survey(p < 0.01, in each comparison). Approximately four of 10(40.1%) children with hyperactivity in 1983 had one or moredisorders at ages 8 to 16. In 84.5% (33.9/40.1) of cases,these children were classified as hyperactive in 1987.
Lastly, emotional disorder predicted most strongly thecategorization of emotional disorder 4 years later. Over onequarter (26.2%) of 4- to 12-year-olds with emotional disorder continued in the same category when they were ages 8to 16. However, this rate of emotional disorder among thisage group was almost identical to the rates of emotionaldisorder in children originally classified as conduct disordered and hyperactive (29.4% and 28.1 %, respectively).Emotional disorder did predict increased rates of conductdisorder, hyperactivity, and one or more disorders comparedwith children originally categorized as having no disorder,(p < 0.01, in each comparison), but the increased rates inchildren ages 8 to 16 were far less than for those originallyclassified as conduct disordered and hyperactive. Lastly,almost nine of 10 children (26.2/29.9 = 87.6%) originallyclassified as emotionally disordered, who had one or morepsychiatric disorders 4 years later, had emotional disorder.
Although the results are not shown in Table 3, two furtheranalyses were performed on these data. First, a comparisonwas made of the percentage of children with one or moredisorders in 1987 between those with single disorders, andthose with two or three disorders in 1983. Of those withsingle disorders in 1983, 27.6% had one or more disordersin 1987; of those with multiple disorders in 1983, 43.5%had one or more disorders in 1987 (X2 = 3.23, df = 1, (p <0.08»).
Second, the percentage of children with disorders in 1987who did not have disorders in 1983 was determined. Itwas ascertained that 68.4% of children with one or moredisorders in 1987 were free of disorder in 1983. The corresponding percentages of children in 1987 with conduct disorder, hyperactivity, and emotional disorder who were freeof any disorders in 1983 were 59.8%, 50.0%, and 66.9%,respectively. Lastly, it should be noted that up to nine of 10children (87.4%) free of disorder in 1983 remained free ofdisorder in 1987.
Table 4 shows the distribution of other outcomes in 1987of children with individual disorders and no disorder in1983. Conduct disorder in 4- to 12-year-olds in 1983 hadthe highest rate of problems getting along with others 4years later. Almost one of five (18.7%) of these conductdisordered children had this impairment and this rate wassignificantly higher than those children with no disorder in1983 (p < 0.01). Almost one quarter (23.6%) of this groupof conduct-disordered children had poor school performance4 years later, but this was not significantly different fromthe rate in the no disorder group. One-third (33.3%) of theconduct-disordered children had received MHiSS within thepast 6 months of the 1987 wave of data collection and thisrate was significantly different from the rate in the no disorder group.
In the case of hyperactivity and emotional disorder among4- to 12-year-01ds in 1983, these children differed from the
J.Am. Acad. Child Adolesc. Psychiatry, 31: 5, September 1992 919
OFFORD ET AL.
TABLE 5. Outcomes in 1987 in Children 4 to 7 and 8 to 12 Years of Age in 1983 with Conduct Disorder (N = 36)"
1987 Outcomes
1983:ConductDisorder:Age
4-78-12
ConductDisorder
(%)
24.7*59.6
Hyperactivity(%)
20.049.0
EmotionalDisorder
(%)
24.734.9
One or MoreDisorders
(%)
24.7*61.3
ProblemsGettingAlong
(%)
22.616.0
Poor SchoolPerformance
(%)
20.725.6
Use ofMental Health/Social
Services(%)
20.742.2
"Weighted data used.*p < 0.05.
one or more disorders 4 years later. As before, none of theinteractions entered the model.
One last logistic regression was run (not shown). It wasnoted that the most direct comparison of the strength of thesame variables as prognostic factors and risk factors wouldbe obtained if identical models were run for prognosis andrisk. This resulted in a rerun of the logistic regression forprognostic variables excluding use of MHlSS, because thiswas not a variable in the risk factor analysis. The results ofthis logistic regression on prognostic variables differed onlyslightly, and not in any important way, from the originalanalysis. For example, the relative odds for low income was0.48 (0.11 to 2.10) in the second analysis compared with0.54 (0.12 to 2.42) in the original analysis.
Discussion
Major findings of the study are the relative stability ofconduct disorder and its poor prognosis. Almost 45% ofchildren with conduct disorder at ages 4 to 12 still qualifiedfor conduct disorder 4 years later, at ages 8 to 16, and over46% had one or more psychiatric disorders at that time. Theoutcome was worse for children, 8 to 12 years of age in1983 who were classified as conduct disordered at that timecompared with the same group of 4- to 7-year-olds. In theformer case, almost 60% of the children had conduct disorder in early adolescence, and more than 60% had one ormore psychiatric disorders, whereas in the 4- to 7-year-oldgroup, the corresponding percentages were 24.7 in eachcase. Clearly, when conduct disorder is present in late child-
hood, its stability into early adolescence is significantlygreater than the stability of the disorder from early to latechildhood.
In the Isle of Wight (lOW) study (Graham and Rutter,1973; Rutter et al., 1970), children diagnosed as conductdisordered at ages 10 and 11 fared the worst of all groupsat follow-up at ages 14 and 15. Three quarters of them stillshowed disorders at adolescence, with most of them beingdiagnosed conduct disorder. In a more recent 5-year followup of a community sample of 8-year-olds (Esser et al., 1990),10 of the 11 subjects who received a diagnosis of conductdisorder were still found to be disordered as adolescents,with eight of the 10 remaining in the original category. Inanother recent follow-up study of a community sample ofchildren 4 to 12 years of age, the aggressive and externalizing syndromes showed the highest stability over a 4-yearperiod, with stability coefficients (r) of 0.67 and 0.65, respectively (Verhulst et al., 1990).
This relatively high persistence of conduct disorder is inagreement with the findings of the high stability of aggressive behavior over time (Huesman et al., 1984; Moskowitzet aI., 1985; Olweus, 1981). Similarly, the increased stabilityof conduct disorder in late childhood is supported by thefindings of Olweus (1979). He found that although aggression in males was highly stable, it was less stable in youngerboys than in older boys.
Conduct disorder in the OCHS seldom predicted any disorder 4 years later without the co-occurrence of conductdisorder. Almost without exception, if a conduct disorderedchild has one or more disorders 4 years later, it will include
TABLE 6. Strength of Relationship (Relative Odds in Logistic Regression) between SelectedPrognostic Variables in 1983and One or More Psychiatric Disorders in 1987 (N = 138)"
Main Effects N (%) Relative Odds (95% Confidence Interval)
Age 4-7Male sexFamily dysfunctionLow incomeProblems getting alongPoor school performanceUse of mental health/social services
"Unweighted data used.*p < 0.05.
53 (38.4) 0.7978 (56.5) 1.3025 (18.1) 4.72*14 (10.1) 0.5415 (10.9) 4.17*21 (15.2) 1.4520 (14.5) 0.43
Goodness of Fit: X2 = 10.73, p < 0.22
(0.33-1.88)(0.57-2.96)(1.80-12.4)(0.12-2.42)(1.10-15.8)(0.45-4.60)(0.12-1.58)
920 J.Am.Acad.ChildAdolesc.Psychiatry, 31:5,September1992
OUTCOME, PROGNOSIS, AND RISK
TABLE 7. Strength of Relationship (Relative Odds in Logistic Regression) between Selected Risk Factors in 1983 and One or MorePsychiatric Disorders in 1987 (N = 743)"
Main Effects N (%) Relative Odds (95% Confidence Interval)Age4-7Male sexFamily dysfunctionLow incomeProblems getting alongPoor school performance
"Unweighted data used.*p < 0.05.
339 (45.6) 1.47363 (48.9) 1.4556 (7.5) 0.7444 (5.9) 2.34*
6 (0.8) 3.8657 (7.7) 1.93
Goodness of Fit: X2 = 9.57, P < 0.30
(0.94-2.31 )(0.93-2.26)(0.30-1.83)(1.12-4.88)(0.67-22.40)(0.95-3.93)
conduct disorder. Similarly, in the lOW study, there wereonly a very few children diagnosed as conduct disorderedat ages 10 and II who had a diagnosis at ages 14 or 15of emotional disorder in the absence of conduct disorder(Graham and Rutter, 1973).
Children with conduct disorder also had increased ratesof other psychiatric disorders 4 years later compared tochildren with no disorder. One possible explanation for thisfinding is that the comorbidity at follow up could be due tothe co-occurrence of these disorders with conduct disorderin the first instance. Although not presented in any of thetables, the data provides some support for this hypothesis,because 30.2% of the children with conduct disorder plusother disorders in 1987 had conduct disorder plus one ortwo other disorders in 1983. However, 44.4% of the childrenin this mixed group in 1987 had no disorder in 1983, and25.4% had a single disorder only in 1983.
The findings that more than 40% of hyperactive childrenhad one or more psychiatric disorders 4 years later is inagreement with the literature that indicates that between30% and 50% of these children continue to be impaired intoadolescence (Barkley et aI., 1990). The fact that hyperactivity in 4- to 12-year-olds predicted later conduct disorder atthe same rate as it predicted later hyperactivity can be explained by two mechanisms. Of the children who were bothhyperactive in 1983 and conduct disordered in 1987,73.9%of them had both disorders in 1983; the other 26.1% werehyperactive only in 1983 (data not presented in the tables).Thus, the increased rates of conduct disorder in 1987 amonghyperactive children in 1983 were due in large part to theco-occurrence of hyperactivity with conduct disorder in1983, and due in lesser part to the increased risk for conductdisorder in late childhood and early adolescence of childrenpresenting earlier with pure hyperactivity.
The relatively good outcome of emotional disorder compared with the two other disorders is not surprising. In therecent 5-year follow-up of a community sample of 8-yearolds (Esser et aI., 1990), 75% of the children with emotionaldisorder at age 8 received no diagnosis at age 13. Thiscompares with a value of 70% on the OCHS follow-up. Inthe lOW study, 46% of children originally diagnosed withemotional disorder at ages 10 and 11 still received a psychiatric diagnosis at ages 14 or 15. It should be kept in mindthat children with emotional disorder have a higher rate of
J.Am.Acad.ChildAdolesc.Psychiatry, 31 :5, September1992
psychiatric morbidity at follow-up compared with childrenoriginally receiving no psychiatric diagnosis. In both theOCHS follow-up and the lOW follow-up, the rate of psychiatric disorder at follow-up was about double for childrenoriginally with emotional disorder compared with those withno disorder.
The literature suggests that children with multiple disorders compared with children with a single disorder are disadvantaged along several lines, including severity ofneuropsychological correlates (Frost et aI., 1989), impairment in peer socialization (Anderson et aI., 1989), and earlyage of onset and increased rates of clinic attendance (Anderson et aI., 1987). The data from the present study providessome support for the disadvantaged status of children withmultiple disorders in that there is a trend for them to havea worse outcome 4 years later compared with the singledisorder group.
An important finding concerning the relationship betweenpsychiatric disorder and other outcomes 4 years later centerson the relatively high rate of social impairment and use ofMHISS in children originally diagnosed as conduct disorder.It is only in the domain of poor school performance whereconduct disorder does not have the highest rate of impairment of the three disorders.
The results on the pattern of the occurrence of the disorders at the two time periods indicate that the majority ofdisorders present in 8- to 16-year-olds were not present 4years earlier. Almost 7 of 10 children with one or moredisorders in late childhood and early adolescence were freeof disorder 4 years earlier. In the lOW study, three of fiveof the disorders present in 14- to 15-year-olds were newlyarising since the ages of 10 and 11 (Rutter et aI., 1976).Similarly, in the German Study (Esser et aI., 1990), half ofthe 13-year-olds moderately or severely affected by psychiatric disorder were not rated as disturbed 5 years earlier.Thus the onset of psychiatric disorders in childhood andadolescence is not confined to a particular age grouping, butextends across the entire developmental period.
The data on prognostic variables suggest that one of thefactors predicting persistence of disorder could be considered as intimately tied up with disorder itself. "Problemsgetting along with others," while an associated feature ofdisorder, could be regarded as part of disorder itself andperhaps an indication of severity. In the case of the other
921
OFFORD ET AL.
significant prognostic variable, family disfunction, althoughit is conceptually distinct from child psychiatric disorder , insome cases it is no doubt a consequence to the presence ofdisorder.
The data on risk variables illustrate clearly that thestrength of the relationship between risk and disorder willbe much reduced in longitudinal analyses compared withcross-sectional analyses. In cross-sectional analyses, chronicand thus severe cases of disorder are included where therelationship between disorder and correlate will be especially strong, and also, cross-sectional analyses include thosecases where the disorder has ·led to the presence of thecorrelate . When these two factors are removed, as they arein longitudinal work, the relationship between risk factorand disorder will be considerably weakened. In the OCHSfollow-up , only low income had a significant independenteffect in predicting disorder 4 years later, whereas all thevariables included in the model had strong and significantrelationships with disorder cross-sectionally. The mechanisms by which low income has its effects in predictingpsychiatric disorders are not clear, but these are not accounted for in this set of analyses by any of the variablesincluded in the logistic regression, for example, family dysfunction and poor school performance.
This study has several limitations or weaknesses. Thelarge data loss, with selective loss of respondents whotended to have higher levels of psychopathology and familyrisk factors in 1983, is an area of concern . Attempts to dealwith this have been through the use of weighting procedures.In the OCHS data, simple comparisons of respondents andnonrespondents on relevant variables revealed almost nothing about the direction and magnitude of bias introduced bysample loss. Because the potential effects of a sample lossin follow-up studies probably vary across different analyticfoci, it is essential to evaluate the effects of sample lossfor different types of analyses, and to correct for the datadistortions that nonrespondents introduce. A second limitation is that the time span for the diagnosis of disorder andthe determination of other outcomes (with the exception ofpoor school performance which is a lifetime variable) is the6 months previous to diagnosis both in 1983 and 1987. Thestudy has no data which will allow an understanding of thecourse of disorder within the 4-year time interval.
There are several implications of the data for work in thechild psychiatric field, especially in the area of prevention.First, in our data and in other work (Cohen and Brook,1987), the factors that predict persistence of disorder (prognostic variables) are not the same as those that predict onset(risk variables). Primary prevention will aim at reducing riskfactors, while secondary prevention will aim at reducingfactors associated with persistence . In these two endeavorsthe data suggest that different factors will be the focus ofintervention. The data from the study suggest that clinicianstreating established cases should concentrate on reducingfamily dysfunction and improving social relationships asways of limiting the persistence of disorder. The preventionof the onset of disorder, on the other hand, should center onreducing the prevalence oflow-income families or inhibiting
922
the mechanisms by which economic disadvantage produceschild psychiatric disorder.
The data on risk factors, for the most part, suggest thatthey may not be powerful or accurate enough to be usedas either indicators for populations at risk or as foci forintervention efforts. In cross-sectional analyses these factorsare strongly related to disorder, but this relationship is severely muted in longitudinal work where the original cohortconsists of children with no psychiatric disorder .
Lastly, the results indicate that conduct disorder, becauseof its relatively poor outcome, should be the focus of intervention efforts. The data presented here suggest that anefficient population to center on for intervention effortswould be children with the disorder at ages 8 to 12. Almost60% of those children can be expected to retain their diagnosis 4 years later given current patterns of delivery of services.
ReferencesAchenbach, T. M. & Edelbrock, C. S. (1981 ), Behavioral problems
and competencies reported by parents of normal and disturbedchildren aged 4 through 16. Monogr. Soc. Res. Child Dev., 46:1-82.
American Psychiatric Association (1980), Diagnostic and StatisticalManual of Mental Disorders, 3rd Ed. Washington, DC: AmericanPsychiatric Association.
Anderson, 1. C., Williams, S., McGee, R. & Silva, P. A. (1987), DSMIII disorders in preadolescent children. Arch. Gen. Psychiatry,44:69-76.
Anderson, J. D., Williams, S., McGee, R. & Silva, P. (1989), Cognitiveand social correlates of DSM-III disorders in preadolescent chil dren . J. Am. Acad. Child Adolesc. Psychiatry, 28:842-846.
Barkley, R. A., Fischer, M., Edelbrock, C. S. & Smallish, L. (1990),The adolescent outcome of hypera ctive children diagnosed by research criteria. I. An 8-year prospective follow-up study. J. Am.Acad. Child Adolesc.Psychiatry, 29:546-557.
Boyle, M. H., Offord, D. R., Hoffman, H. G., et al. (1987 ), OntarioChild Health Study.!. Methodology. Arch. Gen. Psychiatry,44 :826-831 .
Boyle, M. H., Offord , D. R., Racine, Y. A. & Catlin, G. (1991),Ontario Child Health Study follow-up: Evaluation of sample loss.J. Am. Acad. Child Adolesc. Psychiatry, 30:449-456.
Byles, J. Byrne, c, Boyle, M. H. & Offord, D. R. (1988 ), OntarioChild Health Study: Reliability and validity of the general functioning subscale of the McMaster Family Assessment Device. Fam.Process, 27:97- 104.
Cohen, P. & Brook, J. (1987), Family factors related to the persistenceof psychopathology in childhood and adolescence. Psychiatry,5:332-345.
Costello , E. J. (1989), Developments in child psychiatric epidemiology . J. Am. Acad. Child Adolesc. Psychiatry, 28:836-84 1.
Esser, G., Schmidt, M. H. & Woerner, W. (1990), Epidemiology andcourse of psychiatric disorders in school-age children-results of alongitudinal study. J. Child Psychol. Psychiatry, 31:243-263.
Frost, L. A., Moffit, T. E. & McGee, R. (1989), Neuropsychologicalcorrelates of psychopathology in an unselected cohort of youngadolescents. J. Abnorm. Psychol., 98:307-313.
Graham, P. & Rutter, M. (1973), Psychiatric disorder in young adolescents. Proc. R. Soc. Med., 66:1226-1229.
Huesmann, L. R., Eron, L. D., Lefkowitz, M. M. & Walder, L. O.(1984), Stability of aggression over time and generations . Dev.Psychol., 20:1120-1134.
Moskowitz, D. S., Schwartzman, A. E. & Ledingham, J. E. (1985),Stability and change in aggression and withdrawal in middle childhood and early adolescence. J. Abnorm. Psychol., 94:30-41.
Offord , D. R. & Fleming, J. E. (1991), Epidemiology. In: Child andAdolescent Psychiatry, ed. M. Lewis . Baltimore: Williams and Wilkins, pp. 1156-1168.
Offord, D. R, Boyle, M. H., Szatmari, P. et al. (1987), Ontario Child
J.Am. Acad. Child Adolesc. Psychiatry,3J:5,September J992
Health Study. II. Six-month prevalence of disorder and rates ofservice utilization. Arch. Gen. Psychiatry, 44:832-836.
Olweus, D. (1979), Stability of aggressive reaction patterns in males:A review. Psycho!. Bull., 86:852-875.
Olweus, D. (1981), Continuity in aggressive and withdrawn, inhibitedbehavior patterns. Psychiatry of Social Sciences, 1:141-159.
Rutter, M., Tizard, J. & Whitmore, K. (1970), Education, Health and
OUTCOME, PROGNOSIS, AND RISK
Behaviour. London: Longman.Rutter, M. Tizard, J., Yule, W., Graham, P. & Whitmore, K. (1976),
Isle of Wight studies, 1964-1974. Psychol. Med., 6:313-332.Verhulst, F. C., Koot, H. M. & Burden, F. M. G. (1990), Four year
follow-up of an epidemiological sample. J. Am. Acad. Child Adolesc. Psychiatry, 29:440-448.
From Pediatrics
CocaineIPolydrug Use in Pregnancy: Two-Year Follow-up. Ira J. Chasnoff, M.D., Dan R. Griffith, Ph.D., CatherineFreier, Ph.D., and James Murray, Ph.D.
Abstract. The impact of cocaine on pregnancy and neonatal outcome has been well documented over the past few years,but little information regarding long-term outcome of the passively exposed infants has been available. In the present study,the 2-year growth and developmental outcome for three groups of infants is presented: group I infants exposed to cocaineand usually marijuana and/or alcohol (N = 106), group 2 infants exposed to marijuana and/or alcohol but no cocaine (N= 45), and group 3 infants exposed to no drugs during pregnancy. All three groups were similar in racial and demographiccharacteristics and received prenatal care through a comprehensive drug treatment and follow-up program for addictedpregnant women and their infants. The group I infants demonstrated significant decreases in birth weight. length, and headcircumference, but by a year of age had caught up in mean length and weight compared with control infants. The group 2infants exhibited only decreased head circumference at birth. Head size in the two drug-exposed groups remained significantly smaller than in control infants through 2 years of age. On the Bayley Scales of Infant Development, mean developmental scores of the two groups of drug-exposed infants did not vary significantly from the control group, although anincreased proportion of group I and 2 infants scored greater than two standard deviations below the standardized meanscore on both the Mental Developmental Index and the Psychomotor Developmental Index compared with the controlinfants. Cocaine exposure was found to be the single best predictor of head circumference. Across all infants in the study,a significant correlation between small head size and developmental scores was found. The present study demonstrates thatintrauterine drug exposure may place infants at risk for developmental outcome and that head growth after birth may be animportant biological marker in predicting long-term development in children exposed in utero to cocaine and other drugs.Pediatrics 1992;89:284-289.
J. Am. Acad. Child Adolesc. Psychiatry, 31.'5,September 1992 923