oskar englund - methods and concepts for mapping and analysing ecosystem services in landscapes: a...
TRANSCRIPT

Oskar Englund
Methods and Concepts for Mapping and Analysing Ecosystem Services in Landscapes:
a Systematic Review
Oskar Englund, PhD
Dept. of Energy and Environment Div. of Physical Resource Theory
Chalmers University of Technology [email protected]

Oskar Englund
Introduction
• We want to understand how biomass production systems can be designed to support other ecosystem services (ES) in the landscape - Requires methods for assessing how biomass production
affects other ES - Requires methods for mapping ES at the landscape scale
In this study, we 1.Review methods for mapping ES in landscapes
- Systematic review (1112 screened, 171 reviewed) 2.Attempt to clarify the terminology and typology in ES research,
primarily the concept of landscape and landscape scale - Meta-review - Outcome from systematic review
Oskar Englund
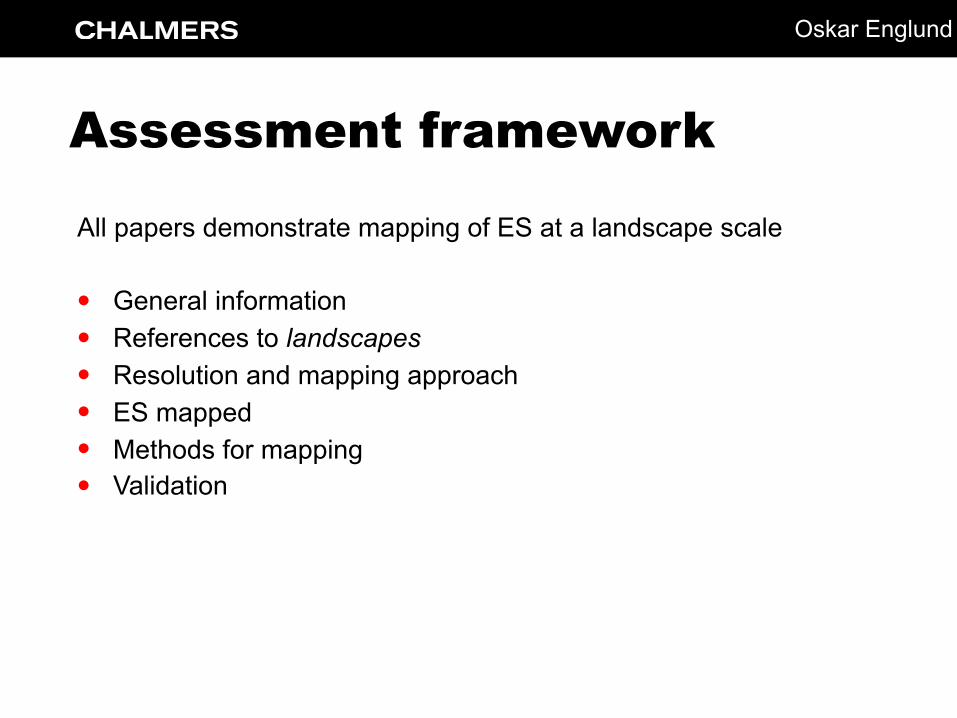
Assessment framework
All papers demonstrate mapping of ES at a landscape scale
• General information • References to landscapes • Resolution and mapping approach • ES mapped • Methods for mapping • Validation
Oskar Englund
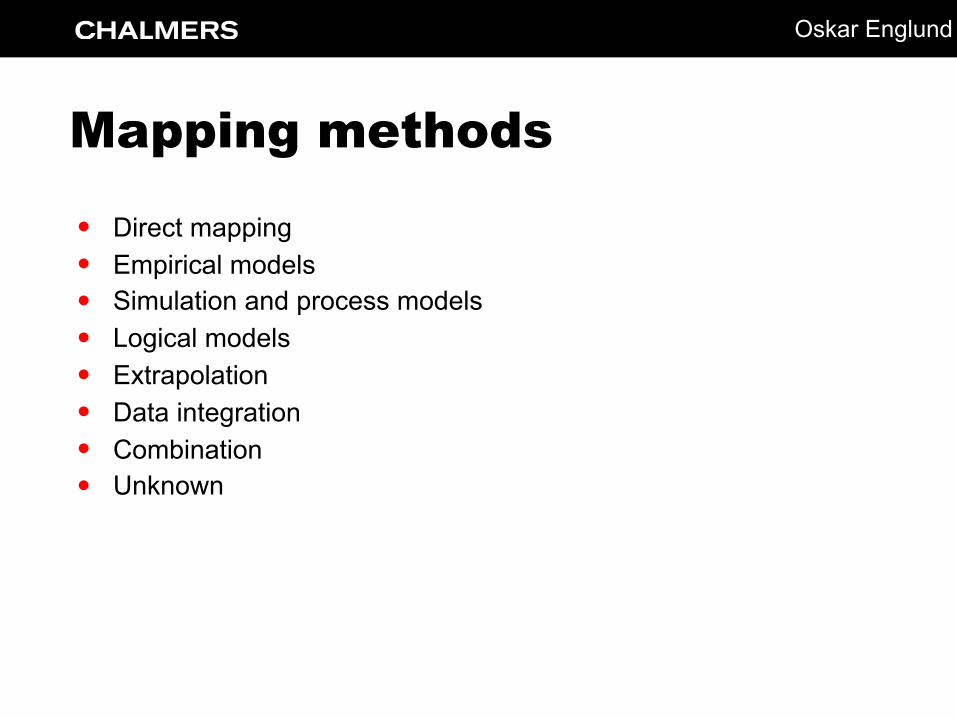
Mapping methods
• Direct mapping • Empirical models • Simulation and process models • Logical models • Extrapolation • Data integration • Combination • Unknown

Oskar Englund
Landscape scale
• An intermediate integration level between the field and the physiographic region
• Extent: 100 - 10 000 ha - Lacoste et al. (2014)

Oskar Englund
Size of the “landscapes”
23
Only 12 percent of the mapping attempts include efforts to validate the results with empirical data. The majority of validation efforts was found in studies that map ES using empirical models, or simulation and process models (fed with empirical data), which indicates that validation is most often done when empirical data must be collected anyway. Different ES can be more or less easy to validate, but validation efforts were found for all the mapped ES. As Nemec & Raudsepp-Hearn (2013), we find it difficult to generalize about which methods that provide the most credible results. Carefully calibrated empirical or process based models, validated against empirical data, can provide accurate and easily evaluated results, but they might not be relevant for certain ES, study areas, or research groups. Thus, it appears preferable that several methods are considered and that selection is done on the basis of research question and, e.g., competence, data availability, and time frame. It is hoped that this review can serve as a resource for information on how different types of methods can be used to map different ES, and in that way be useful for the design of new studies.
Figure 4: Size of the 94 areas referred to as “landscape” in the reviewed papers. Size is specified using absolute numbers for the areas at the far left of the figure, and using countries of an approximately equivalent size for the areas at the far right.
-1
0
1
2
3
4
5
6
7
8
9
-2 0 2 4 6 8 10 12
≈Germany
2,360
540
0.024
1.3
6.2
20
44
134
228
22,536
(thousandhectares) ≈SouthAfrica
≈Greece
≈Israel
≈SanMarino
≈Luxembourg
≈Malta

Oskar Englund
Landscape scale
• An intermediate integration level between the field and the physiographic region
• Extent: 100 - 10 000 ha - Lacoste et al. (2014)
• 23 of 94 areas referred to as landscape fall within the above range
Differing views on the spatial extent of a “landscape”
Oskar Englund
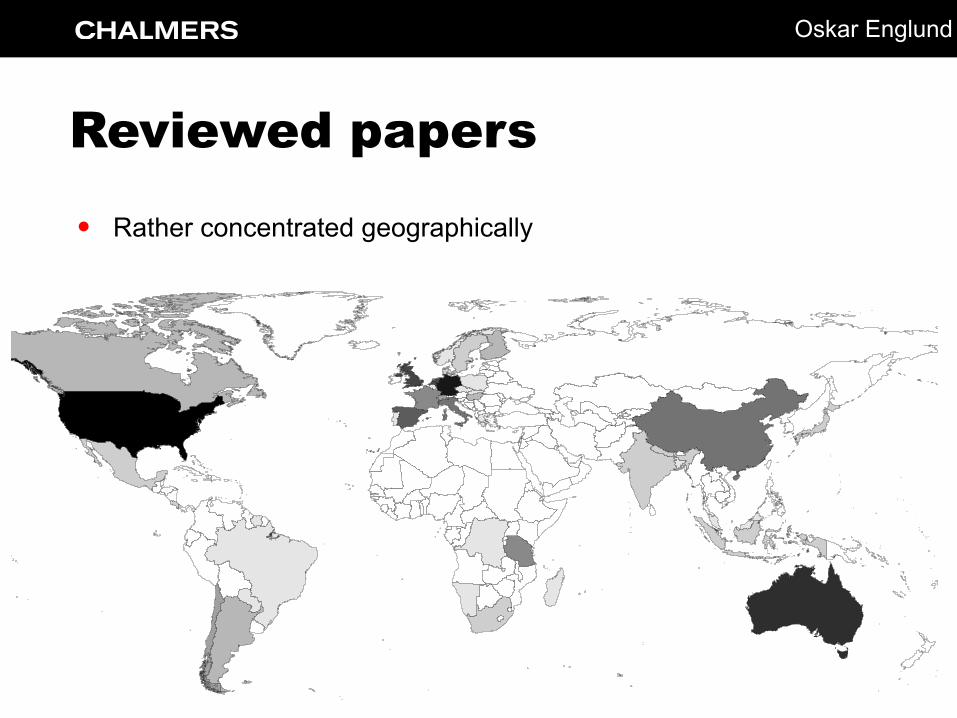
Reviewed papers
• Rather concentrated geographically
Englund et al. – working paper
11
5MethodsformappingecosystemservicesatalandscapescaleA total number of 171 papers were identified as having mapped ES at a landscape scale, of which 122 papers mapped the ES at a relatively high resolution across landscapes. The remaining papers mapped ES at a coarser resolution (approximately 1 km or coarser), in monetary terms only, or aggregated for administrative units. Almost half of the papers were published in 2015 and 2016, while only 14% of the papers were published before 2010 (Fig. 2). This is in line with observations by, e.g, Andrew et al. (2015) and Martínez-Harms & Balvanera (2012) and confirms that research on ES is relatively recent and rapidly growing also when concerning the landscape scale. Over half of the studies were carried out in Europe (89), followed by North America (31) and Asia (18). South America, Africa, and Australia had 12 studies each (Fig. 3). This is similar to the geographical distribution of similar studies irrespective of scale (Crossman et al. 2013). At a country level, most studies were carried out in the USA (26), followed by Germany (15), Australia (12), United Kingdom (11), the Netherlands (11), and Spain (10).
Figure 2: Chronological distribution of reviewed papers.
Figure 3: Geographical distribution of reviewed studies. Shades of grey indicate number of studies performed in each country. Ranges between 1 (light grey) to 26 (black). White = zero.
0
5
10
15
20
25
30
35
40
45
1997 2000 2005 2006 2007 2008 2009 2010 2011 2012 2013 2014 2015
Numberofpapers
Publication year

Oskar Englund
Mapping attempts
24
Figure 5: Number of attempts to map different (groups of) ecosystem services at a landscape scale in the reviewed papers. Divided into different method types (Andrew et al. 2015) used for mapping.
0 10 20 30 40 50 60
Biomass
Surfacewater
Groundwater
Mechanicalenergy
Mediationofwaste,toxicsandothernuisances
Mediationofmass flows
Mediationofwaterflows
Mediationofgaseous/air flows
Lifecyclemaintenance
Pestanddisease control
Soilformationandcomposition
Waterconditions
Atmosphericcompositionandclimateregulation
Physicalandexperientialinteractionswithnature
Intellectualandrepresentativeinteractionswithnature
Spiritualand/oremblematicinteractionswithnature
Existenceandbequest
Otherorcombination
Provisioning
Regulatingand
maintenance
Cultural
Other
Numberofmappingattempts
Directmapping Empiricalmodel Simulationorprocessmodel Logicalmodel
Extrapolation Dataintegration Combination Unknown
∑ = 347

Oskar Englund
Method types used0 20 40 60 80 100
Logicalmodel
Empiricalmodel
Extrapolation
Simulationorprocessmodel
Dataintegration
Directmapping
Combination
Unknown

Oskar Englund
Validation efforts (1/2)Englund et al. – working paper
25
Figure 7: Number of attempts to validate mapping results with empirical data, for the different ecosystem services and the different method types.
0 10 20 30 40 50 60
Biomass
Surfacewater
Groundwater
Mechanicalenergy
Mediationofwaste,toxicsandothernuisances
Mediationofmass flows
Mediationofwaterflows
Mediationofgaseous/air flows
Lifecyclemaintenance
Pestanddisease control
Soilformationandcomposition
Waterconditions
Atmosphericcompositionandclimateregulation
Physicalandexperientialinteractionswithnature
Intellectualandrepresentativeinteractionswithnature
Spiritualand/oremblematicinteractionswithnature
Existenceandbequest
Otherorcombination
Provisioning
Regulatingandmaintenance
Cultural
-
Numberofmappingattempts
Validated Notvalidated
(13% validated)

Oskar Englund
Validation efforts (2/2)Englund et al. – working paper
24
Figure 5: Number of mapping efforts with (blue) and without (red) validation efforts, for the different method types.
Figure 6: Percentage of mapping efforts with (blue) and without (red) validation efforts, for the different method types.
0 20 40 60 80 100
Directmapping
Empiricalmodel
Simulationorprocessmodel
Logicalmodel
Extrapolation
Dataintegration
Combination
Unknown
Validated Notvalidated
0% 20% 40% 60% 80% 100%
Directmapping
Empiricalmodel
Simulationorprocessmodel
Logicalmodel
Extrapolation
Dataintegration
Combination
Unknown
Validated Notvalidated

Oskar Englund
Conclusions (1/2)
• A high level of detail and accuracy is necessary for ES mapping at the landscape scale
• Assessments can thus be challenging - Data collection - Computation capacity
• Mapping attempts: - Regulating and maintenance services (165) - Cultural services (85) - Provisioning services (73)
• Cultural services more frequently mapped at the landscape scale

Oskar Englund
Conclusions (2/2)
• Type of method in several cases difficult to determine - Insufficient method descriptions, failed to facilitate reproducibility - Problematic in an emerging research area
• Only 13% included efforts to validate results against empirical data - Important given the need for high resolution and accuracy
• Difficult to generalise which methods that are most appropriate: several methods should be considered • Research question • Competence • Data availability • Time frame
• This review can serve as a resource for information on methods
Oskar Englund
Methods and Concepts for Mapping and Analysing Ecosystem Services in Landscapes:
a Systematic Review
Oskar Englund, PhD
Dept. of Energy and Environment Div. of Physical Resource Theory
Chalmers University of Technology [email protected]