osc de-noising method based on nir for detecting cellulose of...
TRANSCRIPT
OSC de-noising method based on NIR for detecting
cellulose of straw
Shen Weizheng, JI Nan, Kong Qingming, Han Mingming, Wang Jingjing
School of Electrical and Information Northeast Agricultural UniversityHarbin, 150030, China E-mail: [email protected]
Abstract. This paper aimed to establish the model of detecting straw
composition rapidly based on OSC (Orthogonal Signal Correction) straw
pretreatment. The study select soybean straw as research subjects, building
predictive models for its main ingredient, namely, cellulose. Compared to the
traditional denoising method respectively, calibration set model processed by
the second derivative + smoothing and OSC has significantly higher
determination coefficients. Applying OSC-PLS compared to the second
derivative-smoothing denoising resulted in removal of non-correlated variation
in spectra and improved interpretative ability of variation. Meanwhile, analysis
and convergence velocity has improved significantly.
Keywords: Near-infrared Spectroscopy; Orthogonal Signal Correction; Partial
Least Squares; Denoising
1 Introduction
Straw, as a renewable and recyclable energy, are widely used in the manufacture
of biofuels and ethanol alcohol industry.[3] Straw composition and proportion
will affect yield and quality of biofuels directly. But in day-to-day production,
the existing methods are based on chemical determination aimed at its main
components cellulose, hemicellulose and lignin, which is subject to testing costs
and cycles and other factors so that it is difficult to complete the accurate
determination of straw components. Over the last few years, Near-infrared
spectroscopy analysis has attracted much attention for its high speed and efficiency,
low cost, easy on-line analysis and other advantages. But the near-infrared spectral
region contains a large number of sample information and spectrum bandwidth
overlaps seriously, which have certain impact on the qualitative analysis. Hence,
enhancing the signal specificity is crucial in terms of how to effectively place the
environment and instrument noise and eliminate random errors. In this paper, using
soybean straw as the research object, cellulose, the main component of soybean straw,
is applied to quantitative analysis combined with orthogonal signal correction and
partial least squares modeling. A variety of de-noising method are compared to
choose the optimal method including SG smoothing (Savitzky-Golay), SNV
Advanced Science and Technology Letters Vol.78 (MulGrab 2014), pp.10-15
http://dx.doi.org/10.14257/astl.2014.78.03
ISSN: 2287-1233 ASTL Copyright © 2014 SERSC
(Standard Normal Variate), derivative processing (1st derivative; 2nd derivative),
normalization, orthogonal signal correction (OSC).
2 Material and Methods
2.1 Theory
Orthogonal signal correction is a pretreatment method first proposed by Svante.
Fundamental principle is that before establishing a quantitative calibration model, the
spectral matrix and chemical values are arranged to orthogonal array, filtering
unrelated signals for multivariate calibration.
OSC specific method is as follows:
(1) The original spectral matrix X and density matrix Y are standarded.
(2) t which is orthogonal to Y is assigned.
(3) calculate tnew=(1-Y(Y’Y)-1Y’)t,feature vector newt-Xω
(4) According to the new calculations to get X, ω , which are used to calculate
the
orthogonal principal component t, t=X ω
(5) Convergence is tested, if
610t/oldt -t
, convergence switch to (6),
or to(3)
(6) Load vector is computational, p’=t’X/(t tnew)
(7) Orthogonal part of Y is subtracted from X,E=X-tp’
(8) Taking E as a new X, new principal component which is orthogonal to X is
calculated until it gets the optimal value. In general, two orthogonal principal
components can obtain good precision.
(9) X which is corrected by orthogonal signal is used to be a new spectrum
matrix, modeling.
(10) After corrected by orthogonal signal, unknown samples are predicted.
Residual vector e is obtained.
ω'xtnew1
11new1
pt'x'e
(1)
'ω'et212
2212
pt'e'e
Advanced Science and Technology Letters Vol.78 (MulGrab 2014)
Copyright © 2014 SERSC
11
(2)
2.2 Sample collection and preparation
In this paper, a total of 159 soybean straw were sampled in the northeast of China in
Heilongjiang province of the soybean planting area. Prior to NIRS scanning of fresh
samples, straw samples were dried for 48 hours in the air condition to determine the
dry matter content. All soybean straw samples were milled about 1min in high-speed
grinder to get all the same. The crushed samples are enclosed into ziplock bag to keep
as backup. Neutral detergent fiber (NDF) and acid detergent fiber (ADF) were
analyzed following the method of Van Soest. The amount, minimum, maximum value
and standard deviation (SD) of the chemical parameters are summarized in Table 1.
Table 1. Summary of the determined chemical properties of soybean straw
Composition Sample Minimum Maximum Average SD
Cellulose 159 37.7410 49.45694 43.0962 3.00
2.3 Spectral acquisition
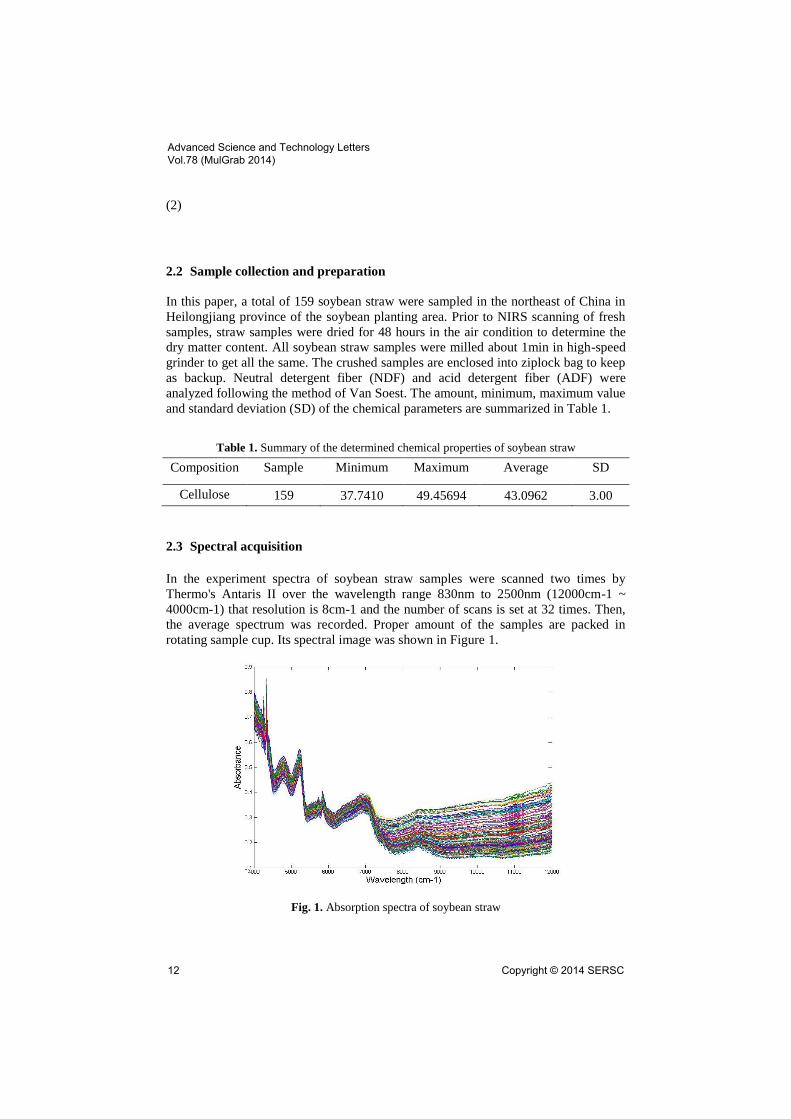
In the experiment spectra of soybean straw samples were scanned two times by
Thermo's Antaris II over the wavelength range 830nm to 2500nm (12000cm-1 ~
4000cm-1) that resolution is 8cm-1 and the number of scans is set at 32 times. Then,
the average spectrum was recorded. Proper amount of the samples are packed in
rotating sample cup. Its spectral image was shown in Figure 1.
Fig. 1. Absorption spectra of soybean straw
Advanced Science and Technology Letters Vol.78 (MulGrab 2014)
12
Copyright © 2014 SERSC

3 Results and Discussion
3.1 Orthogonal signal correction
Orthogonal signal correction method is mainly used to filter out the near-infrared
spectrum matrix system noise (such as baseline drift, light scattering, etc.). The basic
idea of this method is to filter the raw spectral matrix X and Y portion of the signal
under test quality irrelevant. The data analyzing were implemented in
UnscramblerV9.5 and matlab7.0. Also, the study is conducted feasibly for the PLS
models with different OSC factors. Using OSC pretreated the original spectra of
soybean straw. Figure 2 shows the calibration model using different correction factor.
It can be seen from the figure that after pretreatment, RMSECV is the lowest when
PLS factor is 2. RMSEV increases significantly with the increasing number of factors
of PLS while it maximizes in the OSC factor of 10. The whole process keeps volatile
and unstable. Compared to several other de-noising method, OSC did not increase the
accuracy of the model significantly, but fit was greatly accelerated the speed of the
models.
Fig. 2. PLS factors using OSC pretreatment
Analyzing various methods of de-noising, we find that second derivative + smoothing
and OSC obtain optimal correction results. Denoising smoothing is apt to lose useful
spectra information due to different smoothing window size, so it spends plenty of
time on window selection. Normalization eliminates optical path, sample dilution and
other changes. Because it does not change fundamentally, it has little effect on the
de-noising results. SNV and MSC are mainly applied to erase scattering and improve
the spectrum, but particle size and uniform distribution of solid powder generates
Advanced Science and Technology Letters Vol.78 (MulGrab 2014)
Copyright © 2014 SERSC
13

significant interference on spectral information. The shift of wavelength-independent
can be removed by first derivative, while the second derivative can be removed with a
wavelength-dependent drift. However, high-frequency noise will be amplified when
the second derivative eliminate the low-frequency baseline at the same time. So it is
often smoothed before using it. From the results, it can be seen that results of model
validation have improved significantly after the second derivative smoothing.
Fig. 3. RMSEC in different de-noising method
Fig. 4. R2 in different de-noising method
Advanced Science and Technology Letters Vol.78 (MulGrab 2014)
14
Copyright © 2014 SERSC

4 Conclusions
The study discusses denoising approach to the cellulose of soybean straw in different
way. The spectra were pretreated with the method of S-G smoothing, 1st derivative,
2nd derivative, orthogonal signal correction, normalization, SNV as well as MSC.
Comparisons are made among different methods. Statistical analysis showed that
RMSEC had 0.8356439 for smoothing, 0.7024261 for 1st derivative, 0.9394095 for
2nd derivative, 0.6762902 for 2nd +Smoothing, 0.839797 for Normalization,
0.8579724 for SNV, 0.7757527 for MSC and 0.6696454 for OSC. It turns out that
using orthogonal signal correction is feasible to correct reasonably filtering out
independent signal in the spectral density matrix and the matrix. This way is valid for
reducing the number of model factors, which decreases model complexity and
enhance robustness of model. It has a significant role in detecting the composition of
the straw finely and guiding the manufacturing process of biomass in future.
References
1. David W. Templeton, Amie D. Sluiter, Tammy K. Hayward, Bonnie R. Hames, Steven R.
Thomas. Assessing corn stover composition and sources of variability via NIRS. Springer
Science+Business Media B.V. 16(4),621-639.(2009)
2. Cheng He, Longjian Chen , Zengling Yang , Guangqun Huang , Na Liao , Lujia Han . A
rapid and accurate method for on-line measurement of straw–coal blends using near infrared
spectroscopy. Bioresource Technology , 314-320.(2012)
3. Hui Jiang, Guohai Liu, Xiahong Xiao, Congli Mei, Yuhang Ding, Shuang Yu. Monitoring
of solid-state fermentation of wheat straw in a pilot scale using FT-NIR spectroscopy and
support vector data description. Microchemical Journal 102, 68-74.(2012)
4. G. W. Mathison, H. Hsu, R. Soofi-Siawash, G. Recinos-Diaz, E. K. Okine, J. Helm, P.
Juskiw. Prediction of composition and ruminal degradability characteristics of barley straw
by near infrared reflectance spectroscopy. Canadian Journal of Animal Science,79(4):
519-523.(1999)
5. Caijin Huang, Lujia Han , Zengling Yang , Xian Liu. Prediction of heating value of straw by
proximate data, and nearinfrared spectroscopy. Energy Conversion and Management
Volume 49, 3433–3438(2008)
Advanced Science and Technology Letters Vol.78 (MulGrab 2014)
Copyright © 2014 SERSC
15