original research quantification of the hawthorne cohort … · quantification of the hawthorne...
TRANSCRIPT

Quantification of the Hawthorneeffect in hand hygiene compliancemonitoring using an electronicmonitoring system: a retrospectivecohort study
Jocelyn A Srigley,1,2 Colin D Furness,3,4 G Ross Baker,1 Michael Gardam5,6
1Institute of Health Policy,Management & Evaluation,University of Toronto, Toronto,Ontario, Canada2Department of Medicine,McMaster University, Hamilton,Ontario, Canada3Infonaut Inc, Toronto, Ontario,Canada4Faculty of Information,University of Toronto, Toronto,Ontario, Canada5Department of InfectionPrevention & Control, UniversityHealth Network, Toronto,Ontario, Canada6Department of Medicine,University of Toronto, Toronto,Ontario, Canada
Correspondence toDr Jocelyn A Srigley, Departmentof Medicine, McMasterUniversity, 711 ConcessionStreet, M1-Room 8, Hamilton,ON, Canada, L8V 1C3;[email protected]
Received 31 March 2014Revised 20 June 2014Accepted 21 June 2014Published Online First7 July 2014
▸ http://dx.doi.org/10.1136/bmjqs-2014-003507
To cite: Srigley JA,Furness CD, Baker GR, et al.BMJ Qual Saf 2014;23:974–980.
ABSTRACTBackground The Hawthorne effect, orbehaviour change due to awareness of beingobserved, is assumed to inflate hand hygienecompliance rates as measured by directobservation but there are limited data tosupport this.Objective To determine whether the presenceof hand hygiene auditors was associated with anincrease in hand hygiene events as measured bya real-time location system (RTLS).Methods The RTLS recorded all uses of alcohol-based hand rub and soap for 8 months in twounits in an academic acute care hospital. The RTLSalso tracked the movement of hospital handhygiene auditors. Rates of hand hygiene eventsper dispenser per hour as measured by the RTLSwere compared for dispensers within sight ofauditors and those not exposed to auditors.Results The hand hygiene event rate in dispensersvisible to auditors (3.75/dispenser/h) wassignificantly higher than in dispensers not visible tothe auditors at the same time (1.48; p=0.001) andin the same dispensers during the week prior (1.07;p<0.001). The rate increased significantly whenauditors were present compared with 1–5 min priorto the auditors’ arrival (1.50; p=0.009). There wereno significant changes inside patient rooms.Conclusions Hand hygiene event rates wereapproximately threefold higher in hallways withineyesight of an auditor compared with when noauditor was visible and the increase occurred afterthe auditors’ arrival. This is consistent with theexistence of a Hawthorne effect localised to areaswhere the auditor is visible and calls into questionthe accuracy of publicly reported hospital handhygiene compliance rates.
BACKGROUNDHealthcare worker (HCW) hand hygieneis an important strategy to prevent
healthcare-associated infections (HAIs),which are the most common adverseevent experienced by patients duringmedical care.1 HCW hand hygiene isknown to be suboptimal2 and multifa-ceted improvement programmes arerecommended, including measurementand feedback of compliance rates.3 Directobservation, in which human auditorsmonitor the hand hygiene compliance ofHCWs as they carry out clinical tasks, isthe most commonly used method ofmeasurement. However, this method issubject to biases, including observer bias,selection bias and possibly theHawthorne effect.3 4 If the resulting dataare publicly reported, as is the case inmany jurisdictions around the world, thepotential for bias may be even greater.5
The Hawthorne effect, also calledobservation bias, refers to the tendencyof people to change their behaviourwhen they are aware of an observer.3 4 Itis widely assumed that the Hawthorneeffect transiently increases HCW handhygiene compliance rates when auditorsare present, despite the fact that the exist-ence of the Hawthorne effect has beenextensively debated in the psychologicalliterature6 and studies that examine theHawthorne effect specifically in handhygiene behaviour have significant meth-odological limitations. Much of the evi-dence in hospital hand hygienecompliance monitoring comes fromstudies demonstrating that compliancerates are higher when audits areannounced in advance or the auditors areknown to the units.7–11 However, thepotential for observer and selection biasis high, particularly since it was not
Open AccessScan to access more
free content
ORIGINAL RESEARCH
974 Srigley JA, et al. BMJ Qual Saf 2014;23:974–980. doi:10.1136/bmjqs-2014-003080
on 11 February 2019 by guest. P
rotected by copyright.http://qualitysafety.bm
j.com/
BM
J Qual S
af: first published as 10.1136/bmjqs-2014-003080 on 7 July 2014. D
ownloaded from
stated in any of these studies whether the observerswere blinded to the study hypothesis.The recent development of electronic systems for
hand hygiene monitoring offers an alternativeapproach to direct observation.12 These systemsmonitor HCW hand hygiene on a constant, real-timebasis, making them a promising tool for determiningwhether the Hawthorne effect exists and characteris-ing the nature of the effect. Furthermore, electronicsystems apply consistent algorithms to measure handhygiene events and compliance rates, eliminatingmany of the biases inherent to direct observation. Theobjective of this retrospective cohort study was to usea real-time location system (RTLS) to determinewhether the presence of human auditors on inpatientunits was associated with an increase in hand hygieneevents.
METHODSSetting and participantsAn RTLS was installed on two multi-organ transplantunits at an academic acute care hospital as part of alarger research study and was operational between 18July 2012 and 11 March 2013. The RTLS used smallbattery-operated tags that could be worn by people orattached to equipment. Tags emitted ultrasoundsignals at regular intervals, which were picked up by anetwork of 618 wireless receivers situated in patientrooms, hallways, and above all 257 alcohol-basedhand rub (ABHR) and 148 soap dispensers. Signalsfrom the receivers were processed by a geographicalinformation systems engine, which computed move-ment, location and proximity of tags to each other.All HCWs on the study units, including physicians,
nurses and allied health professionals, were invited toparticipate in the overall study of the RTLS throughpresentations by study personnel. Posters describingthe RTLS and the study were also displayed on theparticipating units. HCWs who volunteered to weartags contacted the research assistant to providewritten informed consent. There were 60 tags avail-able for HCWs, which represented approximately aquarter of the staff who routinely worked on theseunits. The tags were a component of the overall studybut did not contribute data to the current study. Theobjective of the overall study was to determine theeffect of the RTLS in combination with a behaviourchange approach called ‘positive deviance’ on HAIs.Data from the RTLS, including movement of equip-ment and trends in hand hygiene (but not specificcompliance rates as measured by the RTLS), were pre-sented to front line HCWs, who were then empow-ered to make changes on the units to address theidentified issues. HCWs were aware that the RTLSwas used to monitor hand hygiene but were notinformed that the Hawthorne effect would be studiedand were blinded to this study’s hypothesis.Institutional research ethics board (REB) approval was
obtained for the overall study, and administrative REBapproval was obtained from the University of Torontospecifically for this component of the study on theHawthorne effect.
MeasuresThe RTLS measured hand hygiene events by countingall times that ABHR and soap dispensers were used.Tags installed on the dispensers transmitted a signal toa nearby receiver each time the levers were pushed,and a time-stamped hand hygiene event was recordedin a centralised database. If multiple dispensesoccurred at a single dispenser within 4 s of each other,only one dispense event was counted. Prior to thestart of this study, the RTLS was tested in a simulatedclinical environment and 100% of dispenses weredetected. The hand hygiene event rate was defined asthe total number of ABHR and soap dispenses mea-sured by the RTLS per dispenser per hour.Auditors also measured directly observed hand
hygiene compliance rates on the study units as part ofthe overall hospital hand hygiene programme.Auditors wore white lab coats as per usual hospitalpractice and were not specifically identified as audi-tors but may have been recognisable to some HCWs.Auditors were blinded to the study hypothesis andconducted audits in accordance with the Ontario JustClean Your Hands programme,13 once or twicemonthly on each unit from 29 November 2012 to 11March 2013. No more than two audits were con-ducted per unit per month so as to prevent HCWsfrom noticing an increased frequency of auditing andchanging their behaviour as a result. The duration ofeach audit was variable due to the requirement forauditors to remain on the unit until they had observed60 hand hygiene opportunities. Auditors wereinstructed not to enter patient rooms in order tomaintain privacy.
Study designThe Hawthorne effect was conceptualised as anexposure–outcome relationship, in which the expos-ure was the presence of a hand hygiene auditor andthe outcome was hand hygiene events. This studyused a retrospective cohort design, defining theexposed cohort as the ABHR and soap dispensers onthe two multi-organ transplant units that were withineyesight of an auditor.The auditors who rotated through the study units
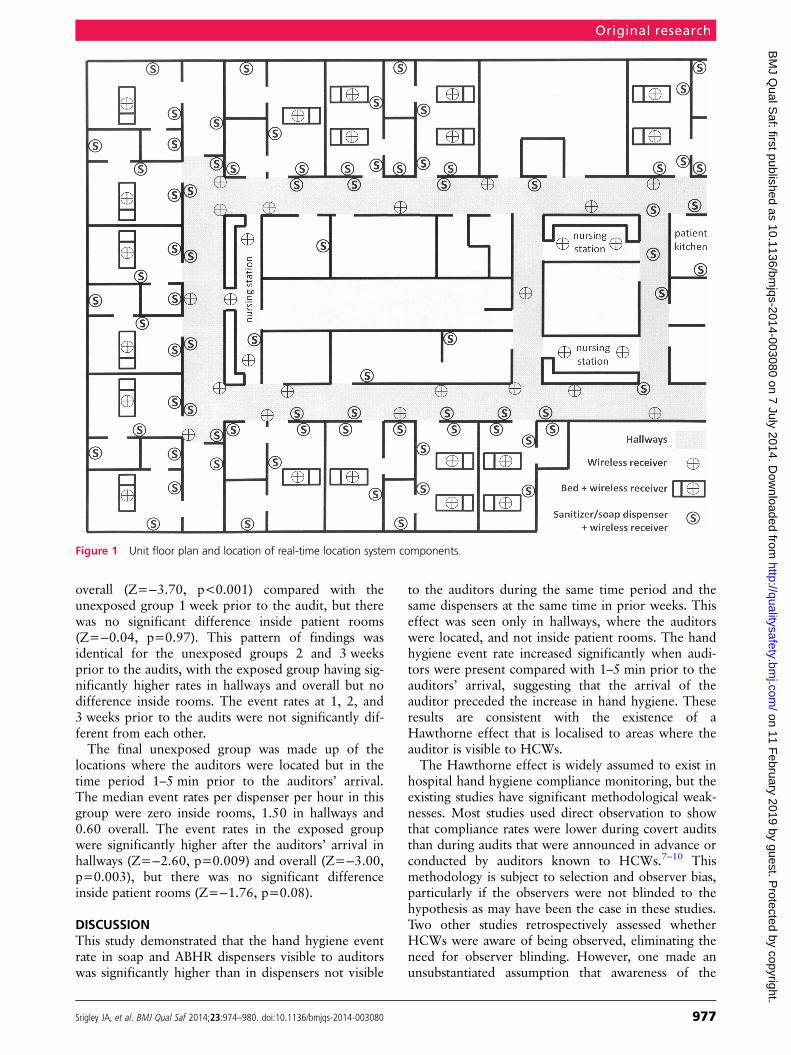
wore staff RTLS tags to track the exact time and loca-tion of auditing. After audits, a list of receivers thathad detected the tag and the time period duringwhich the tag was within that zone was obtained. Theauditor’s location was then assessed by sequentiallylocating on a unit map each of those receivers thathad detected the auditor tag. Figure 1 shows a sectionof the unit map with receivers represented by circles.When the tag was localised within a straight section
Original research
Srigley JA, et al. BMJ Qual Saf 2014;23:974–980. doi:10.1136/bmjqs-2014-003080 975
on 11 February 2019 by guest. P
rotected by copyright.http://qualitysafety.bm
j.com/
BM
J Qual S
af: first published as 10.1136/bmjqs-2014-003080 on 7 July 2014. D
ownloaded from

of the hallway (ie, where all dispensers would bewithin eyesight) for at least 5 min, the number of dis-penses in that area was determined during that timeperiod. The time period started when the auditor tagwas first detected in that area, and ended when theauditor turned a corner or left the unit. The outerboundaries of the area were defined as the two recei-vers furthest from each other that had picked up asignal from the auditor’s tag in that time period andwere within eyesight of each other. The number ofdispenses were counted for all dispensers inside thepatient rooms within those boundaries and in the hall-ways outside those rooms during the defined timeperiod. The count was then converted into an eventrate per dispenser per hour. This procedure wasrepeated for the duration of each audit, dividing eachaudit into a variable number of time periods in whichthe auditor was visible within a defined location. Thedispensers within these time-location blocks made upthe exposed group.Event rates in the exposed dispensers were compared
with three separate unexposed groups in order to addressthe potential for confounding. The first comparison groupwas another area of the unit that would not have beenvisible to the auditors at the same time period during theaudit. Since the day and time were the same, this compari-son controlled for any differences in hand hygiene patternsthat might be attributable to temporal factors.3 14
The second group was the same area where theauditors were located at the same time of day, but at1, 2 and 3 weeks prior to the audit. This accountedfor the fact that workload and thus hand hygieneevents may be variable depending on location on theward; for example, patients who are more severely illand therefore require more hands-on care may belocated closer to nursing stations.The final comparison group was the same area where
the auditors were located in the 1–5 min prior to theirarrival on the day of the audit. The 1 min immediatelyprior to the auditors’ arrival was excluded because theymay have been coming into view during that time. Thisgroup addressed the potential for reverse causation bias, inwhich the outcome could cause the exposure since audi-tors typically move to locations where more activities aretaking place. This would be the opposite causal directionto the Hawthorne effect, in which the presence of theauditor results in an increase in hand hygiene event rate.The primary outcome was the hand hygiene event
rate, defined as the combined number of ABHR andsoap dispenses per dispenser per hour. Separate eventrates were calculated for dispensers in the hallways,which would be within eyesight of auditors, and dis-pensers inside patient rooms, which are typically notseen by auditors.
Data analysisHand hygiene event rates in the exposed group werecompared with each of the other three groups using
the Wilcoxon signed rank test. The samples wereassumed to be related since they were taken from afixed group of dispensers on the two study units thatwere used by the same group of HCWs. Data wereanalysed using SPSS Statistics, V.20 software (IBMCorp). A two-sided p value of 0.05 was considered tobe statistically significant.
FINDINGSSummary of auditsThere were 12 audits conducted between 29November 2012 and 11 March 2013. Seven auditstook place on one unit (designated ‘A’) and five on theother (‘B’). The audits were divided into 37 timeperiods when the auditor was in a fixed location forat least 5 min. The median duration of these timeperiods was 9 min, with a range from 5 to 39 min.The median duration of the time periods was 9 minon unit A and 12 min on unit B. The median numberof dispensers included in each location was 20 (range8–34), with a median of six in hallways and 13 insidepatient rooms.
Exposed groupDuring the entire data collection period, a total of562 304 ABHR dispenses and 218 473 soap dispenseswere recorded. Of these, there were 230 handhygiene events that occurred in the exposed groupduring audits, with 31 occurring inside patient roomsand 199 in hallways. Because there were few eventsinside patient rooms and more dispensers in roomscompared with hallways, the modal event rate inrooms was zero. The median event rates per dispenserper hour were zero in patient rooms, 3.75 in halls and1.43 overall. Table 1 shows the median event rates inthe exposed and unexposed groups, with theWilcoxon signed rank test results where applicable.
Unexposed groupsIn the unexposed group consisting of areas of the wardnot visible to the auditors during the time of the audits,the median event rates per dispenser per hour were zeroinside rooms and 1.48 in hallways. The total medianevent rate was 0.67. A Wilcoxon signed rank testshowed that the exposed group had significantly higherevent rates in hallways (Z=−3.39, p=0.001) and overall(Z=−2.65, p=0.008) compared with the unexposedgroup in a different location. There was no significantdifference between the exposed and unexposed groupsinside patient rooms (Z=−0.13, p=0.90).The second unexposed group consisted of the same
areas of the ward where the auditors were visible atthe same time of day measured at 1, 2 and 3 weeksprior to the audit. One week prior to the audits, themedian event rates per dispenser per hour were zeroinside rooms and 1.07 in hallways, with a total rate of0.58. The exposed group had significantly higherevent rates in hallways (Z=−4.53, p<0.001) and
Original research
976 Srigley JA, et al. BMJ Qual Saf 2014;23:974–980. doi:10.1136/bmjqs-2014-003080
on 11 February 2019 by guest. P
rotected by copyright.http://qualitysafety.bm
j.com/
BM
J Qual S
af: first published as 10.1136/bmjqs-2014-003080 on 7 July 2014. D
ownloaded from
overall (Z=−3.70, p<0.001) compared with theunexposed group 1 week prior to the audit, but therewas no significant difference inside patient rooms(Z=−0.04, p=0.97). This pattern of findings wasidentical for the unexposed groups 2 and 3 weeksprior to the audits, with the exposed group having sig-nificantly higher rates in hallways and overall but nodifference inside rooms. The event rates at 1, 2, and3 weeks prior to the audits were not significantly dif-ferent from each other.The final unexposed group was made up of the
locations where the auditors were located but in thetime period 1–5 min prior to the auditors’ arrival.The median event rates per dispenser per hour in thisgroup were zero inside rooms, 1.50 in hallways and0.60 overall. The event rates in the exposed groupwere significantly higher after the auditors’ arrival inhallways (Z=−2.60, p=0.009) and overall (Z=−3.00,p=0.003), but there was no significant differenceinside patient rooms (Z=−1.76, p=0.08).
DISCUSSIONThis study demonstrated that the hand hygiene eventrate in soap and ABHR dispensers visible to auditorswas significantly higher than in dispensers not visible
to the auditors during the same time period and thesame dispensers at the same time in prior weeks. Thiseffect was seen only in hallways, where the auditorswere located, and not inside patient rooms. The handhygiene event rate increased significantly when audi-tors were present compared with 1–5 min prior to theauditors’ arrival, suggesting that the arrival of theauditor preceded the increase in hand hygiene. Theseresults are consistent with the existence of aHawthorne effect that is localised to areas where theauditor is visible to HCWs.The Hawthorne effect is widely assumed to exist in
hospital hand hygiene compliance monitoring, but theexisting studies have significant methodological weak-nesses. Most studies used direct observation to showthat compliance rates were lower during covert auditsthan during audits that were announced in advance orconducted by auditors known to HCWs.7–10 Thismethodology is subject to selection and observer bias,particularly if the observers were not blinded to thehypothesis as may have been the case in these studies.Two other studies retrospectively assessed whetherHCWs were aware of being observed, eliminating theneed for observer blinding. However, one made anunsubstantiated assumption that awareness of the
Figure 1 Unit floor plan and location of real-time location system components.
Original research
Srigley JA, et al. BMJ Qual Saf 2014;23:974–980. doi:10.1136/bmjqs-2014-003080 977
on 11 February 2019 by guest. P
rotected by copyright.http://qualitysafety.bm
j.com/
BM
J Qual S
af: first published as 10.1136/bmjqs-2014-003080 on 7 July 2014. D
ownloaded from

observer increases as the audit progresses,15 and theother used a survey to determine self-reported aware-ness of being observed.16 Another study avoided thebiases of direct observation by demonstrating thatsoap and paper towel consumption tended to behigher during audit periods,17 which provides sup-porting evidence but may not correlate with compli-ance rates.12
A pilot study using an electronic monitoring systemfound that hand hygiene compliance was 88.9%during audits, compared with an overall complianceof 31.5% for the days when the audits took place.18
However, it was limited by a small sample size andthe lack of controlling for potential confounders suchas time of day; hand hygiene compliance has beenshown to be higher during the day compared withnight.14 Our study adds strong confirmatory evidenceusing a novel methodology that addresses the poten-tial for confounding through the use of three unex-posed comparison groups. Furthermore, it suggeststhat the Hawthorne effect occurs only in hallways thatare within eyesight of the auditor, whereas previousstudies were not able to localise the effect.HCW hand hygiene compliance has long been a
primary focus of infection prevention and controlprogrammes, and more recently has captured theattention of governments and patient safety organisa-tions. Several jurisdictions around the world nowmandate public reporting of HCW hand hygiene com-pliance rates in hospitals as a quality improvement ini-tiative. However, the magnitude of the Hawthorneeffect seen in this study calls into question the accur-acy of directly observed hand hygiene rates and theutility of measuring and reporting them.Electronic monitoring systems have been promoted
as an alternative to direct observation and the poten-tial for bias appears to be lower, but they are not apanacea. A systematic review found limited and con-flicting evidence regarding the accuracy of electronicsystems.19 Furthermore, there may be substantial costsassociated with installation and maintenance of such asystem, as well as issues with the acceptability of thistype of monitoring to HCWs.12 In addition, directobservation has some benefits not found in electronicmonitoring systems, such as providing the opportunityfor education of HCWs and currently being the onlymethod that can assess technique and all indicatedmoments for hand hygiene.3 At present, each facilitymust weigh the relative costs and benefits to deter-mine if and how to measure hand hygiene compliancerates, with the magnitude of the Hawthorne effectbeing only one factor to consider.This study has several limitations, one being that it
was not feasible to determine hand hygiene compli-ance rates. All HCWs and patients would have had towear RTLS tags in order to calculate the number ofhand hygiene opportunities as the denominator, butonly enough staff tags were available forTa
ble1
Eventrates
inexposedandunexposedgroups
Med
ianrate
inroom
s(events/
dispen
ser/h)
IQRof
room
s(events/
dispen
ser/h)
Wilcoxon
sign
edrank
*
Med
ianrate
inha
lls(events/
dispen
ser/h)
IQRof
halls
(events/
dispen
ser/h)
Wilcoxon
sign
edrank
*
Med
ianoverall
rate
(events/
dispen
ser/h)
IQRoverall
(events/
dispen
ser/h)
Wilcoxon
sign
edrank
*
Exposed
00–0.48
–3.75
2.23–5.45
–1.43
0.79–2.41
–
Unexposed
location
00–0.61
Z=−0.13
(p=0.90)
1.48
0.46–2.79
Z=−3.39
(p=0.001)
0.67
0.29–1.58
Z=−2.65
(p=0.008)
Unexposed
1weekprior
00–0.50
Z=−0.04
(p=0.97)
1.07
0.37–2.45
Z=−4.53
(p<0.001)
0.58
0.27–1.01
Z=−3.70
(p<0.001)
Unexposed
2weeks
prior
00–0.51
Z=−0.30
(p=0.77)
1.5
0.65–2.30
Z=−4.13
(p<0.001)
0.63
0.29–0.94
Z=−4.04
(p<0.001)
Unexposed
3weeks
prior
00–0.78
Z=−0.63
(p=0.53)
1.25
0.38–2.22
Z=−4.45
(p<0.001)
0.65
0.32–1.17
Z=−3.70
(p<0.001)
Unexposed
priortoauditor
00–0
Z=−1.76
(p=0.08)
1.5
0–5.00
Z=−2.60
(p=0.009)
0.6
0–1.67
Z=−3.00
(p=0.003)
*Com
paredwith
exposedgroup.
IQR,
interquartilerange.
Original research
978 Srigley JA, et al. BMJ Qual Saf 2014;23:974–980. doi:10.1136/bmjqs-2014-003080
on 11 February 2019 by guest. P
rotected by copyright.http://qualitysafety.bm
j.com/
BM
J Qual S
af: first published as 10.1136/bmjqs-2014-003080 on 7 July 2014. D
ownloaded from

approximately a quarter of staff on the units. Instead,the RTLS measured soap and ABHR dispenses, but itis not possible to know who used the dispensers,whether the dispensed product was used for handhygiene or whether hand hygiene was performed atan indicated moment. The event rate in the exposedgroup increased by between 250% and 350% whencompared with unexposed times and locations, but itis not known whether the denominator also changedand thus whether there was a difference in compli-ance. However, in order for there to have been nochange in compliance, the number of hand hygieneopportunities would have had to increase by a similarmagnitude. It might be plausible to see a consistentincrease in opportunities if the auditors were movingto areas where more activity was taking place, but thelack of increased event rate in the unexposed groupprior to the auditors’ arrival shows that this is not thecase.A second limitation is the fact that the RTLS itself
may have resulted in a Hawthorne effect and inflatedhand hygiene event rates compared with baseline.However, the Hawthorne effect is believed to waneover time,20 and the RTLS had been operational forapproximately 4 months prior to the start of thisstudy.Finally, this study was conducted on solid organ
transplant units in an academic acute care hospital,and it is not known whether the findings would begeneralisable to other healthcare settings involving dif-ferent patient and HCW populations.In conclusion, we used an RTLS to demonstrate
that there is a significant Hawthorne effect in handhygiene compliance monitoring. Further research isneeded to clarify the magnitude and duration of theHawthorne effect in different settings, and to deter-mine characteristics of HCWs and auditors that maymodify the effect. Ongoing quality improvementefforts will be necessary to improve hand hygienecompliance and reduce HAIs given that true handhygiene compliance rates appear to be significantlylower than currently reported.
Acknowledgements We thank Geoff Anderson for hiscontribution to study design, Laura Rosella and MoniqueHerbert for their advice on statistical analysis, and Gerald Evansand Whitney Berta for their editorial comments.
Contributors JAS, CDF, GRB and MG: conception, design ofthe study and article revision; JAS and CDF: data collection andanalysis; JAS: writing the article.
Funding This work was supported by grants from CanadaHealth Infoway and the Health Technology Exchange, InfonautInc, and GOJO Industries.
Competing interests CDF reports personal fees from InfonautInc (the manufacturer of the RTLS used in this study) duringthe conduct of the study; personal fees from GOJO IndustriesInc (the manufacturer of the soap and ABHR used in this study)outside the submitted work; and he has a patent PCT/CA2009/001776 ‘Disease mapping and infection control system andmethod‘ pending. JAS received salary support from the AMMICanada/Astellas Post-Residency Fellowship.
Ethics approval University Health Network and University ofToronto Research Ethics Boards.
Provenance and peer review Not commissioned; externallypeer reviewed.
Open Access This is an Open Access article distributed inaccordance with the Creative Commons Attribution NonCommercial (CC BY-NC 4.0) license, which permits others todistribute, remix, adapt, build upon this work non-commercially,and license their derivative works on different terms, providedthe original work is properly cited and the use is non-commercial. See: http://creativecommons.org/licenses/by-nc/4.0/
REFERENCES1 World Health Organization. Report on the burden of endemic
health care-associated infection worldwide. Geneva,Switzerland: World Health Organization, 2011.
2 Erasmus V, Daha TJ, Brug H, et al. Systematic review of studieson compliance with hand hygiene guidelines in hospital care.Infect Control Hosp Epidemiol 2010;31:283–94.
3 World Health Organization. WHO guidelines on hand hygienein health care. Geneva, Switzerland: World HealthOrganization, 2009.
4 Haas JP, Larson EL. Measurement of compliance with handhygiene. J Hosp Infect 2007;66:6–14.
5 Muller MP, Detsky AS. Public reporting of hospital handhygiene compliance—helpful or harmful? J Am Med Assoc2010;304:1116–17.
6 Adair JG. The Hawthorne effect: a reconsideration of themethodological artifact. J Appl Psychol 1984;69:334–45.
7 Tibballs J. Teaching hospital medical staff to handwash. Med JAust 1996;164:395–8.
8 Eckmanns T, Bessert J, Behnke M, et al. Compliance withantiseptic hand rub use in intensive care units: the Hawthorneeffect. Infect Control Hosp Epidemiol 2006;27:931–4.
9 Maury E, Moussa N, Lakermi C, et al. Compliance of healthcare workers to hand hygiene: awareness of being observed isimportant. Intensive Care Med 2006;32:2088–9.
10 Kohli E, Ptak J, Smith R, et al. Variability in the Hawthorneeffect with regard to hand hygiene performance in high- andlow-performing inpatient care units. Infect Control HospEpidemiol 2009;30:222–5.
11 Pan SC, Tien KL, Hung IC, et al. Compliance of health careworkers with hand hygiene practices: independent advantagesof overt and covert observers. PLoS ONE 2013;8:e53746.
12 Boyce JM. Measuring healthcare worker hand hygiene activity:current practices and emerging technologies. Infect ControlHosp Epidemiol 2011;32:1016–28.
13 Public Health Ontario. Just clean your hands. http://www.publichealthontario.ca/en/BrowseByTopic/InfectiousDiseases/JustCleanYourHands/Pages/Just-Clean-Your-Hands.aspx#.UgosAZK2Oo0 (accessed March 2014).
14 Sahay S, Panja S, Ray S, et al. Diurnal variation in handhygiene compliance in a tertiary level multidisciplinaryintensive care unit. Am J Infect Control 2010;38:535–9.
15 Chen LF, Carriker C, Staheli R, et al. Observing and improvinghand hygiene compliance: implementation and refinement ofan electronic-assisted direct-observer hand hygiene auditprogram. Infect Control Hosp Epidemiol 2013;34:207–10.
16 Pittet D, Simon A, Hugonnet S, et al. Hand hygiene amongphysicians: performance, beliefs, and perceptions. Ann InternMed 2004;141:1–8.
17 Bittner MJ, Rich EC, Turner PD, et al. Limited impact ofsustained simple feedback based on soap and paper towelconsumption on the frequency of hand washing in an adult
Original research
Srigley JA, et al. BMJ Qual Saf 2014;23:974–980. doi:10.1136/bmjqs-2014-003080 979
on 11 February 2019 by guest. P
rotected by copyright.http://qualitysafety.bm
j.com/
BM
J Qual S
af: first published as 10.1136/bmjqs-2014-003080 on 7 July 2014. D
ownloaded from

intensive care unit. Infect Control Hosp Epidemiol2002;23:120–6.
18 Cheng VC, Tai JW, Ho SK, et al. Introduction of an electronicmonitoring system for monitoring compliance with Moments 1and 4 of the WHO “My 5 Moments for Hand Hygiene”methodology. BMC Infect Dis 2011;11:151.
19 Ward MA, Schweizer ML, Polgreen PM, et al. Automated andelectronically assisted hand hygiene monitoring systems: asystematic review. Am J Infect Control 2014;42:472–8.
20 Harbarth S, Pittet D, Grady L, et al. Interventional study toevaluate the impact of an alcohol-based hand gel in improvinghand hygiene compliance. Pediatr Infect Dis J 2002;21:489–95.
Original research
980 Srigley JA, et al. BMJ Qual Saf 2014;23:974–980. doi:10.1136/bmjqs-2014-003080
on 11 February 2019 by guest. P
rotected by copyright.http://qualitysafety.bm
j.com/
BM
J Qual S
af: first published as 10.1136/bmjqs-2014-003080 on 7 July 2014. D
ownloaded from