oriflame holding ag - reports.oriflame.com · • oriflame has implemented ifrs 15 revenue from...
TRANSCRIPT
Magnus Brännström, CEO
Gabriel Bennet, CFO
Nathalie Redmo, Sr. Manager IR
May 4, 09.30 CET
Oriflame Holding AGFIRST QUARTER 2018
INVESTOR PRESENTATION
• Oriflame has implemented IFRS 15 Revenue from Contracts with Customers from
1st January 2018. An early adoption of IFRS 16 Leases has been made to allow for
all changes being implemented at the same time.
• To facilitate the comparison with the 2017 figures, the company has prepared fully
adjusted 2018 figures, excluding the impact of IFRS 15, IFRS 16 and related
accounting alignments. The fully adjusted figures are comparable with the already
reported 2017 figures.
• Where not stated differently, the figures, graphs and comments in this presentation
are based on the fully adjusted 2018 figures, to facilitate the comparison with the
2017 figures.
IMPORTANT CLARIFYING INFORMATION IFRS
©Oriflame Cosmetics AG, 2018 2

©Oriflame Cosmetics AG, 2018 3
FIRST QUARTER
HIGHLIGHTS
©Oriflame Cosmetics AG, 2018 4
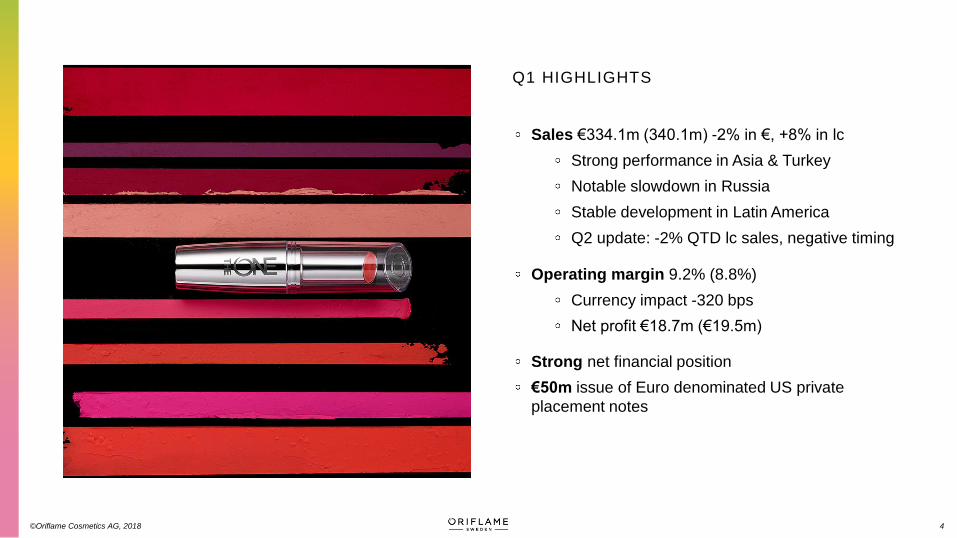
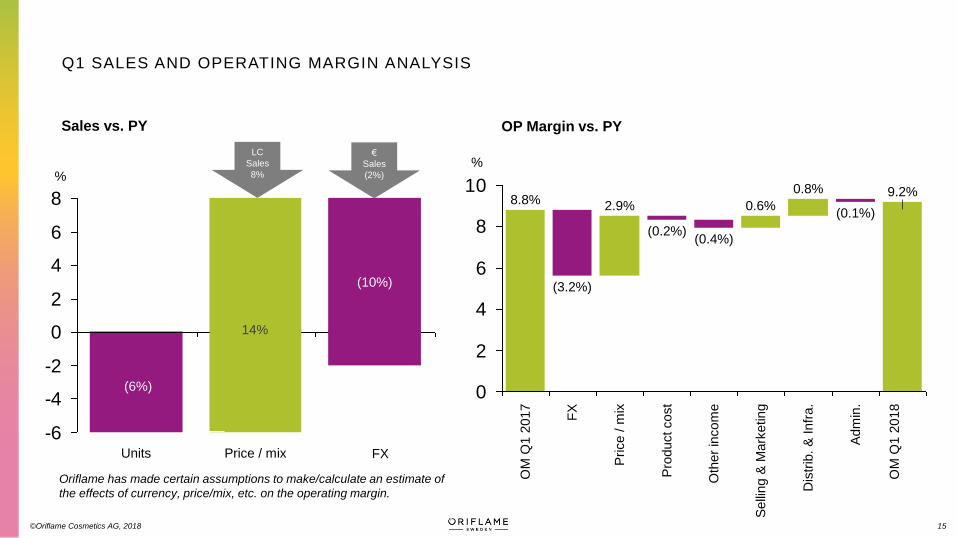
Sales €334.1m (340.1m) -2% in €, +8% in lc
Strong performance in Asia & Turkey
Notable slowdown in Russia
Stable development in Latin America
Q2 update: -2% QTD lc sales, negative timing
Operating margin 9.2% (8.8%)
Currency impact -320 bps
Net profit €18.7m (€19.5m)
Strong net financial position
€50m issue of Euro denominated US private
placement notes
Q1 HIGHLIGHTS
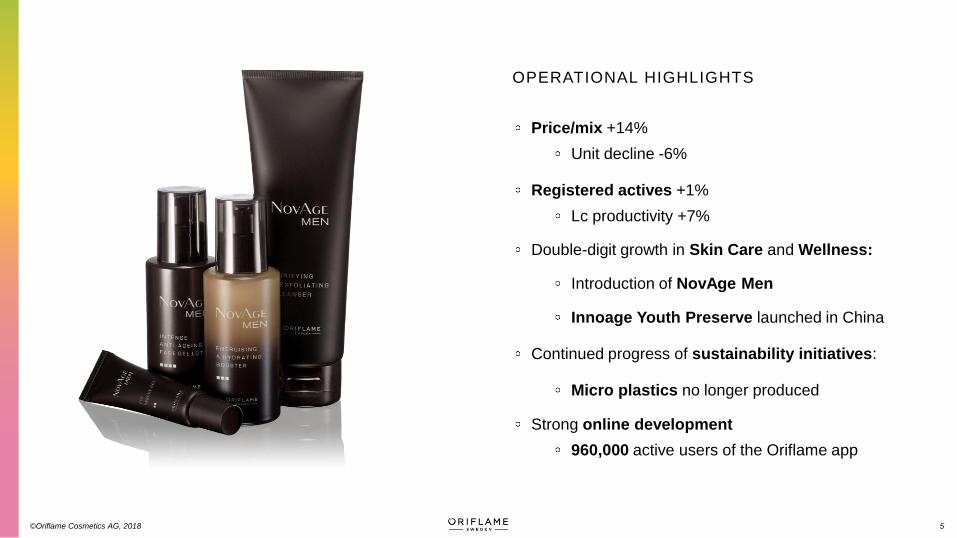
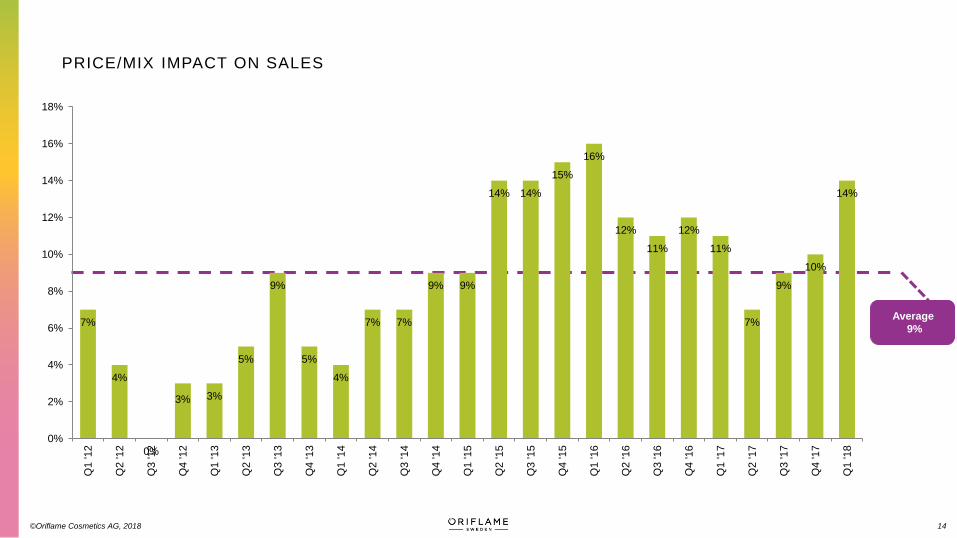
Price/mix +14%
Unit decline -6%
Registered actives +1%
Lc productivity +7%
Double-digit growth in Skin Care and Wellness:
Introduction of NovAge Men
Innoage Youth Preserve launched in China
Continued progress of sustainability initiatives:
Micro plastics no longer produced
Strong online development
960,000 active users of the Oriflame app
OPERATIONAL HIGHLIGHTS
©Oriflame Cosmetics AG, 2018 5
©Oriflame Cosmetics AG, 2018 6
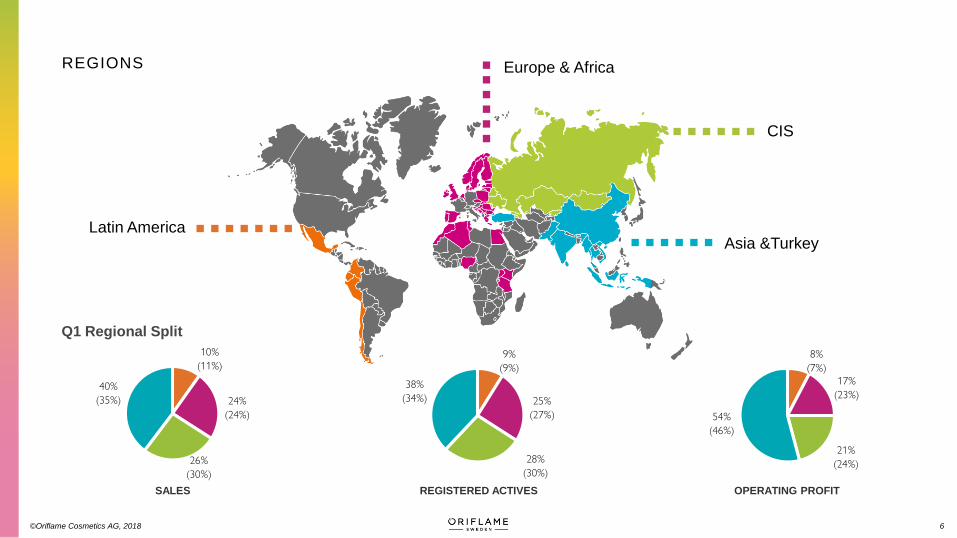
Asia &Turkey
Europe & Africa
Q1 Regional Split
CIS
SALES REGISTERED ACTIVES OPERATING PROFIT
REGIONS
Latin America
10%
(11%)
24%
(24%)
26%
(30%)
40%
(35%)
9%
(9%)
25%
(27%)
28%
(30%)
38%
(34%)
8%
(7%)
17%
(23%)
21%
(24%)
54%
(46%)

Sales force and productivity
Registered actives -1%
Lc productivity +1%
€ productivity -7%
Stable development in Mexico
Lower consumer confidence
Solid growth in Ecuador, weak in Colombia
Operating margin +280 bps
Price increases
Lower selling and marketing expenses
Negative currency movements
©Oriflame Cosmetics AG, 2018 7
LATIN AMERICAQ1’18* Q1’18 Q1’17 Change
LTM,
April’17 -
March’18
LTM,
April’16 -
March’17
Change YE’17
Sales, €m 34.0 32.5 35.3 (8%) 154.7 154.5 0% 157.5
Lc sales - - - 0% - - 4% -
Operating profit, €m
5.2 4.0 3.3 19% 21.5 22.4 (4%) 20.8
Operating margin
15.2% 12.3% 9.5% - 13.9% 14.5% - 13.2%
Registered actives ‘000
264 264 266 (1%) 264 266 (1%) 280
€m
*Figures following the adoption of IFRS 15 and IFRS 16
0%
5%
10%
15%
20%
25%
0
20
40
60
80
100
120
140
160
Q1 16 Q2 16 Q3 16 Q4 16 Q1 17 Q2 17 Q3 17 Q4 17 Q1 18
Net Sales LTM Op Margin % LTM
*Figures following the adoption of IFRS 15 and IFRS 16
0%
5%
10%
15%
20%
25%
100
150
200
250
300
350
Q1 16 Q2 16 Q3 16 Q4 16 Q1 17 Q2 17 Q3 17 Q4 17 Q1 18
Net Sales LTM Adj. Op Margin % LTM
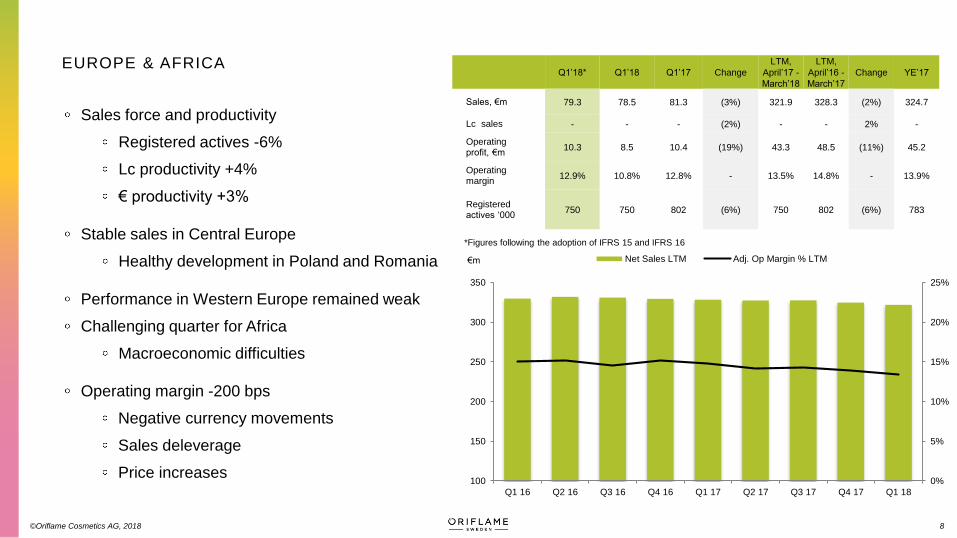
Sales force and productivity
Registered actives -6%
Lc productivity +4%
€ productivity +3%
Stable sales in Central Europe
Healthy development in Poland and Romania
Performance in Western Europe remained weak
Challenging quarter for Africa
Macroeconomic difficulties
Operating margin -200 bps
Negative currency movements
Sales deleverage
Price increases
©Oriflame Cosmetics AG, 2018 8
EUROPE & AFRICA
€m
Q1’18* Q1’18 Q1’17 Change
LTM,
April’17 -
March’18
LTM,
April’16 -
March’17
Change YE’17
Sales, €m 79.3 78.5 81.3 (3%) 321.9 328.3 (2%) 324.7
Lc sales - - - (2%) - - 2% -
Operating profit, €m
10.3 8.5 10.4 (19%) 43.3 48.5 (11%) 45.2
Operating margin
12.9% 10.8% 12.8% - 13.5% 14.8% - 13.9%
Registered actives ‘000
750 750 802 (6%) 750 802 (6%) 783
*Figures following the adoption of IFRS 15 and IFRS 16
0%
5%
10%
15%
20%
25%
0
100
200
300
400
500
Q1 16 Q2 16 Q3 16 Q4 16 Q1 17 Q2 17 Q3 17 Q4 17 Q1 18
Net Sales LTM Adj. Op Margin % LTM
Sales force and productivity
Registered actives -6%
Lc productivity +1%
€ productivity -10%
Positive timing of catalogues
Russia lc sales -14%
Weak catalogues, high prices in some categories
External price pressure
Measures are being taken
Continued improvements in Ukraine and Kazakhstan
Operating margin +130 bps
Lower distribution and infrastructure expense
Positive timing of selling and marketing expense
Negative exchange rates
CIS
©Oriflame Cosmetics AG, 2018 9
€m
Q1’18* Q1’18 Q1’17 Change
LTM,
April’17 -
March’18
LTM,
April’16 -
March’17
Change YE’17
Sales, €m 82.2 84.6 99.5 (15%) 341.9 338.6 1% 356.8
Lc sales - - - (5%) - - 2% -
Operating profit, €m
10.1 10.6 11.1 (5%) 44.9 35.8 25% 45.4
Operating margin
12.3% 12.5% 11.2% - 13.1% 10.6% - 12.7%
Registered actives ‘000
836 836 889 (6%) 836 889 (6%) 859
©Oriflame Cosmetics AG, 2018 10
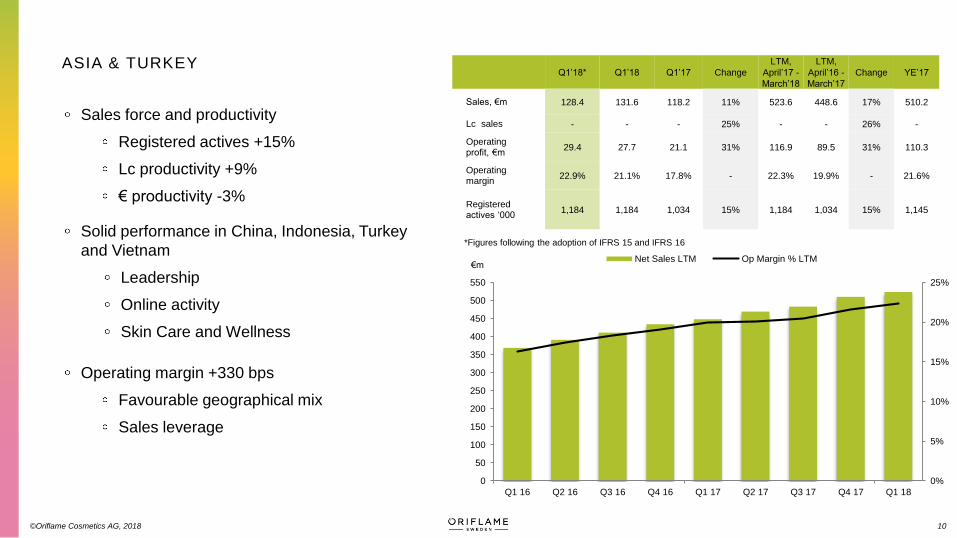
Sales force and productivity
Registered actives +15%
Lc productivity +9%
€ productivity -3%
Solid performance in China, Indonesia, Turkey
and Vietnam
Leadership
Online activity
Skin Care and Wellness
Operating margin +330 bps
Favourable geographical mix
Sales leverage
ASIA & TURKEY
€m
Q1’18* Q1’18 Q1’17 Change
LTM,
April’17 -
March’18
LTM,
April’16 -
March’17
Change YE’17
Sales, €m 128.4 131.6 118.2 11% 523.6 448.6 17% 510.2
Lc sales - - - 25% - - 26% -
Operating profit, €m
29.4 27.7 21.1 31% 116.9 89.5 31% 110.3
Operating margin
22.9% 21.1% 17.8% - 22.3% 19.9% - 21.6%
Registered actives ‘000
1,184 1,184 1,034 15% 1,184 1,034 15% 1,145
*Figures following the adoption of IFRS 15 and IFRS 16
0%
5%
10%
15%
20%
25%
0
50
100
150
200
250
300
350
400
450
500
550
Q1 16 Q2 16 Q3 16 Q4 16 Q1 17 Q2 17 Q3 17 Q4 17 Q1 18
Net Sales LTM Op Margin % LTM

©Oriflame Cosmetics AG, 2018 11
FINANCIALS

*Figures following the adoption of IFRS 15 and IFRS 16
0%
5%
10%
15%
20%
25%
0
200
400
600
800
1000
1200
1400
Q1 16 Q2 16 Q3 16 Q4 16 Q1 17 Q2 17 Q3 17 Q4 17 Q1 18
Net Sales LTM Op Margin % LTM
Sales mix
Unit sales -6%
Price/mix +14%
Gross margin 72.5% (71.6%)
Negative currency movements
Positive price/mix effect
Operating margin +40 bps
Negative currency impact 320 bps
Lower selling and marketing expenses
Lower distribution and infrastructure expenses
Net profit €18.7m (€19.5m)
Diluted EPS €0.32 (€0.34)
350 bps withholding tax on intra group dividends
©Oriflame Cosmetics AG, 2018 12
Q1 INCOME STATEMENT
€m
Q1’18* Q1’18 Q1’17 Change
LTM,
April’17 -
March’18
LTM,
April’16 -
March’17
Change YE’17
Sales, €m 330.8 334.1 340.1 (2%) 1,357.1 1,283.7 6% 1,363.1
Lc sales - - - 8% - - 11% -
Operating profit, €m
34.8 30.6 29.8 3% 159.9 127.8 25% 159.0
Operating margin
10.5% 9.2% 8.8% 11.8% 10.0% 11.7%
Registered actives ‘000
3,034 3,034 2,991 1% 3,034 2,991 1% 3,067
©Oriflame Cosmetics AG, 2018 13
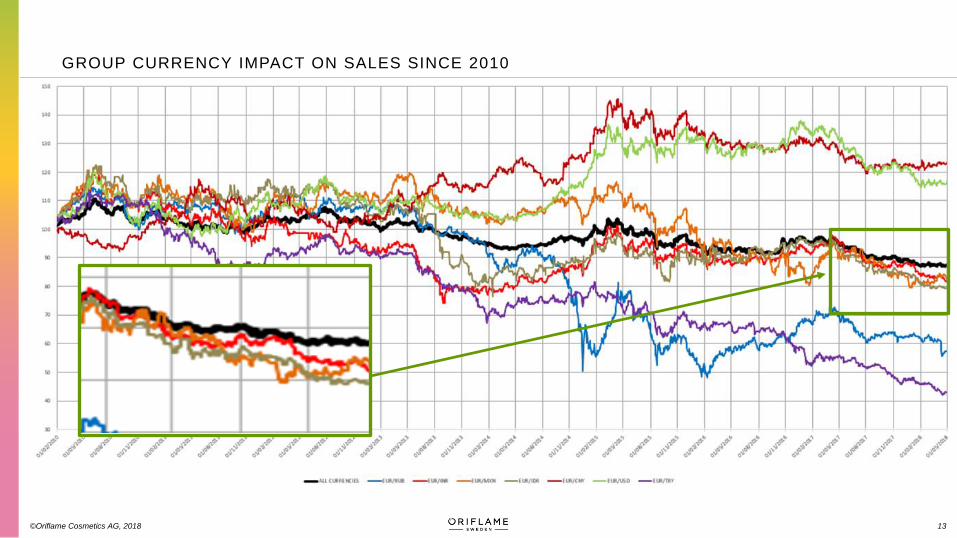
GROUP CURRENCY IMPACT ON SALES SINCE 2010
©Oriflame Cosmetics AG, 2018 14
Average
9%
PRICE/MIX IMPACT ON SALES
7%
4%
0%
3% 3%
5%
9%
5%
4%
7% 7%
9% 9%
14% 14%
15%
16%
12%
11%
12%
11%
7%
9%
10%
14%
0%
2%
4%
6%
8%
10%
12%
14%
16%
18%
Q1 '1
2
Q2 '1
2
Q3 '1
2
Q4 '1
2
Q1 '1
3
Q2 '1
3
Q3 '1
3
Q4 '1
3
Q1 '1
4
Q2 '1
4
Q3 '1
4
Q4 '1
4
Q1 '1
5
Q2 '1
5
Q3 '1
5
Q4 '1
5
Q1 '1
6
Q2 '1
6
Q3 '1
6
Q4 '1
6
Q1 '1
7
Q2 '1
7
Q3 '1
7
Q4 '1
7
Q1 '1
8
-6
-4
-2
0
2
4
6
8
OP Margin vs. PY
©Oriflame Cosmetics AG, 2018 15
(16%)
Oriflame has made certain assumptions to make/calculate an estimate of
the effects of currency, price/mix, etc. on the operating margin.
Sales vs. PY
Q1 SALES AND OPERATING MARGIN ANALYSIS
%%
Units Price / mix
(10%)
14%
€
Sales
(2%)
(6%) 0
2
4
6
8
10 9.2%0.6%
OM
Q1 2
018
(0.1%)
Dis
trib
. &
Infr
a.
Adm
in.
0.8%
Selli
ng &
Mark
eting
Oth
er
incom
e
(0.4%)
Pro
duct cost
OM
Q1 2
017
(3.2%)
Price / m
ix
2.9%8.8%
FX
(0.2%)
LC
Sales
8%
FX
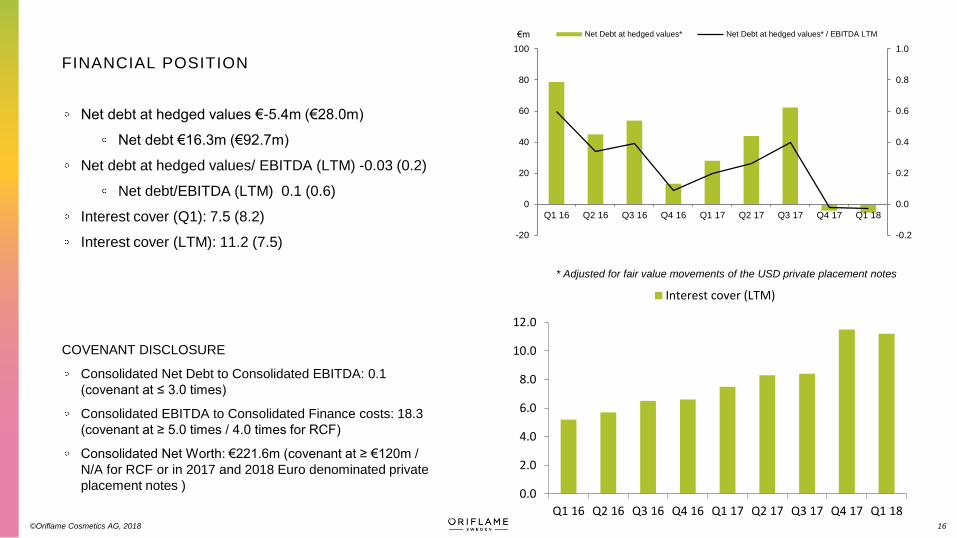
* Adjusted for fair value movements of the USD private placement notes
Net debt at hedged values €-5.4m (€28.0m)
Net debt €16.3m (€92.7m)
Net debt at hedged values/ EBITDA (LTM) -0.03 (0.2)
Net debt/EBITDA (LTM) 0.1 (0.6)
Interest cover (Q1): 7.5 (8.2)
Interest cover (LTM): 11.2 (7.5)
COVENANT DISCLOSURE
Consolidated Net Debt to Consolidated EBITDA: 0.1
(covenant at ≤ 3.0 times)
Consolidated EBITDA to Consolidated Finance costs: 18.3
(covenant at ≥ 5.0 times / 4.0 times for RCF)
Consolidated Net Worth: €221.6m (covenant at ≥ €120m /
N/A for RCF or in 2017 and 2018 Euro denominated private
placement notes )
©Oriflame Cosmetics AG, 2018 16
€m
FINANCIAL POSITION
-0.2
0.0
0.2
0.4
0.6
0.8
1.0
-20
0
20
40
60
80
100
Q1 16 Q2 16 Q3 16 Q4 16 Q1 17 Q2 17 Q3 17 Q4 17 Q1 18
Net Debt at hedged values* Net Debt at hedged values* / EBITDA LTM
0.0
2.0
4.0
6.0
8.0
10.0
12.0
Q1 16 Q2 16 Q3 16 Q4 16 Q1 17 Q2 17 Q3 17 Q4 17 Q1 18
Interest cover (LTM)

Q1 operating cash flow €24.9m (€-1.5m)
Net profit before tax €-0.1m
Non-cash items in net profit before tax €+7.2m
Impact from changes in working capital and
provisions €+26.3m
Inventories €+1.9m
Receivables, prepaid exp., asset derivatives €+15.4m
Payables, accrued exp., liability derivatives €+7.8m
Provisions €+1.2m
Interest, charges, taxes €-7.0m
©Oriflame Cosmetics AG, 2018 17
Q1’18* Q1’18 Q1’17 LTM’18 YE ’17
Net profit before income
tax, €m30.3 27.3 27.4 133.1 133.2
Op. profit before changes
in wc, €m41.2 41.4 34.3 185.0 177.9
Change in working cap.
and provisions, €m(3.1) 2.9 (23.4) 26.4 0.1
Operating CF, €m 24.9 24.9 (1.5) 149.1 122.7
CF Investing Activities,
€m(3.1) (3.1) (3.0) (15.9) (15.8)
*Figures calculated as per the new IFRS 15 and 16 standards
0
50
100
150
200
Q1 16 Q2 16 Q3 16 Q4 16 Q1 17 Q2 17 Q3 17 Q4 17 Q1 18
Total inventory€m
0
25
50
75
100
125
150
Q1 16 Q2 16 Q3 16 Q4 16 Q1 17 Q2 17 Q3 17 Q4 17 Q1 18
Operating cash flow LTM Capex LTM€m
CASH FLOW

©Oriflame Cosmetics AG, 2018 18
CONCLUSIONS AND GOING FORWARD
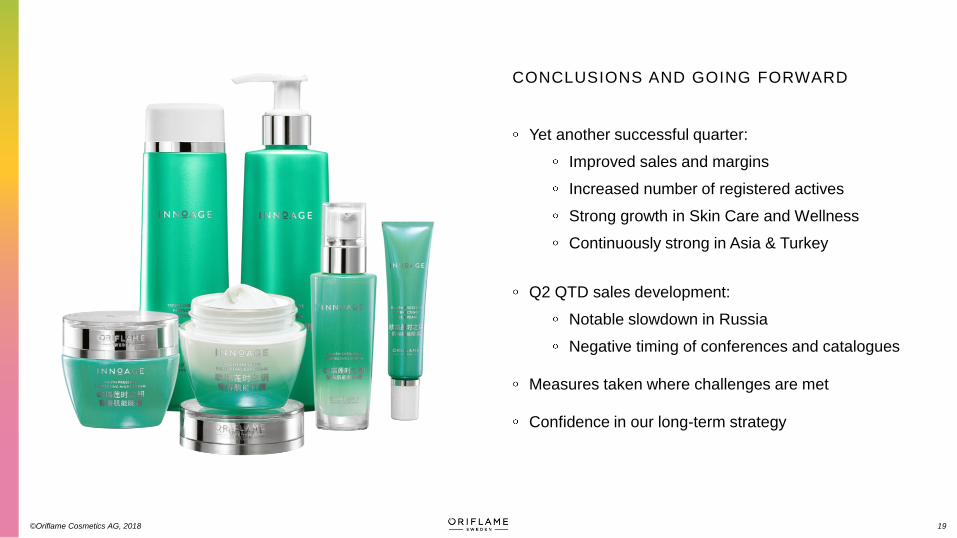
Yet another successful quarter:
Improved sales and margins
Increased number of registered actives
Strong growth in Skin Care and Wellness
Continuously strong in Asia & Turkey
Q2 QTD sales development:
Notable slowdown in Russia
Negative timing of conferences and catalogues
Measures taken where challenges are met
Confidence in our long-term strategy
©Oriflame Cosmetics AG, 2018 19
CONCLUSIONS AND GOING FORWARD

©Oriflame Cosmetics AG, 2018 21
CAUTIONARY STATEMENT
Some statements herein are forward-looking and the actual outcome could be materially different.
In addition to the factors explicitly commented upon, the actual outcome could be materially affected by other factors like,
for example, the effect of economic conditions, exchange-rate and interest-rate movements, political risks, impact of
competing products and their pricing, product development, commercialisation and supply disturbances.