organic contaminants, trace and major elements, … · organic contaminants, trace and major...
TRANSCRIPT
U.S. Department of the InteriorU.S. Geological Survey
Scientific Investigations Report 2012–5228
Organic Contaminants, Trace and Major Elements, and Nutrients in Water and Sediment Sampled in Responseto the Deepwater Horizon Oil Spill

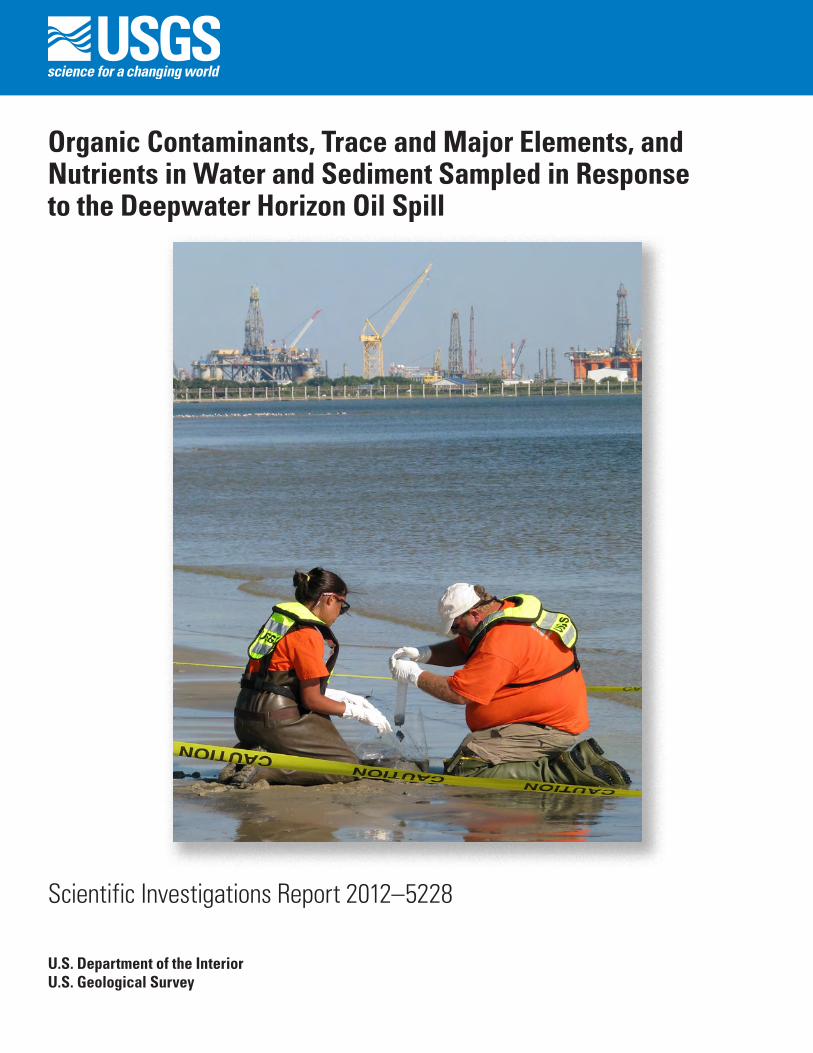
Cover: Photograph showing the U.S. Geological Survey collecting sediment samples at Pascagoula Beach, Pascagoula, Miss. Photo credit: Shane Stocks, U.S. Geological Survey Mississippi Water Science Center.
Organic Contaminants, Trace and Major Elements, and Nutrients in Water and Sediment Sampled in Response to the Deepwater Horizon Oil Spill
By Lisa H. Nowell, Amy S. Ludtke, David K. Mueller, and Jonathon C. Scott
Scientific Investigations Report 2012–5228
U.S. Department of the InteriorU.S. Geological Survey
U.S. Department of the InteriorKEN SALAZAR, Secretary
U.S. Geological SurveySuzette M. Kimball, Acting Director
U.S. Geological Survey, Reston, Virginia: 2013
For more information on the USGS—the Federal source for science about the Earth, its natural and living resources, natural hazards, and the environment, visit http://www.usgs.gov or call 1–888–ASK–USGS.
For an overview of USGS information products, including maps, imagery, and publications, visit http://www.usgs.gov/pubprod
To order this and other USGS information products, visit http://store.usgs.gov
Any use of trade, product, or firm names is for descriptive purposes only and does not imply endorsement by the U.S. Government.
Although this report is in the public domain, permission must be secured from the individual copyright owners to reproduce any copyrighted materials contained within this report.
Suggested citation:Nowell, L.H., Ludtke, A.S., Mueller, D.K., and Scott, J.C., 2013, Organic contaminants, trace and major elements, and nutrients in water and sediment sampled in response to the Deepwater Horizon oil spill: U.S. Geological Survey Scientific Investigations Report 2012–5228, 96 p, plus appendixes.
iii
Contents
Abstract ...........................................................................................................................................................1Introduction ....................................................................................................................................................2Methods ..........................................................................................................................................................2
Study Area and Site Selection ............................................................................................................2Sample Collection ................................................................................................................................3
Water Samples .............................................................................................................................6Sediment Samples .......................................................................................................................6
Chemical Analyses ..............................................................................................................................6Water ...........................................................................................................................................9Sediment........................................................................................................................................9
Quality-Control Samples ....................................................................................................................11Blanks .........................................................................................................................................11Field Replicates ..........................................................................................................................12Matrix Spikes ..............................................................................................................................13Laboratory Quality-Control Procedures .................................................................................13
Water- and Sediment-Quality Benchmarks ...................................................................................13Human-Health Benchmarks for Water ...................................................................................14Aquatic-Life Benchmarks for Water .......................................................................................14
Toxic-Unit Benchmarks for PAH-BTEX Mixtures in Water ........................................14Marine Benchmarks .........................................................................................................14
Sediment-Quality Benchmarks ................................................................................................17Equilibrium-Partitioning Sediment Benchmarks for PAH Mixtures .........................17Equilibrium-Partitioning Sediment Benchmarks for Individual Contaminants ......19Empirical Sediment Benchmarks ...................................................................................19
National Baseline Concentrations for Trace and Major Elements and Nutrients in Fine Sediment ...............................................................................................................25
Interpretation of Benchmark Exceedances .........................................................................25Data Compilation ................................................................................................................................25Data Analyses .....................................................................................................................................26
Results and Discussion ..............................................................................................................................28Quality-Control Analyses ...................................................................................................................28
Blank Samples ............................................................................................................................28Field Replicates ..........................................................................................................................31Matrix Spikes ..............................................................................................................................32
Data Censoring ....................................................................................................................................34Censoring on the Basis of Quality-Control Results ..............................................................38Determination of Common Censoring Thresholds ...............................................................39
Organic Contaminants in Water ......................................................................................................50Contaminant Occurrence .........................................................................................................50Comparison of Pre-Landfall to Post-Landfall Samples ........................................................56Comparison with Benchmarks for Human Health and Aquatic Life .................................58
iv
Contents
Results and Discussion—ContinuedOrganic Contaminants in Sediment ................................................................................................64
Contaminant Occurrence .........................................................................................................64Comparison of Pre-Landfall to Post-Landfall Samples ........................................................65Comparison with Benchmarks for Aquatic Life ....................................................................68
Trace and Major Elements and Nutrients in Water .....................................................................69Constituent Occurrence ...........................................................................................................69Comparison of Pre-Landfall to Post-Landfall Samples ........................................................70Comparison with Benchmarks for Human Health and Aquatic Life ..................................74
Trace and Major Elements and Nutrients in Sediment ................................................................78Constituent Occurrence ...........................................................................................................78Comparison of Pre-Landfall to Post-Landfall Samples ........................................................79Comparison with Sediment-Quality Benchmarks and National Baseline
Concentrations ............................................................................................................82Contaminant Concentrations at Sites with Macondo-1 Well Oil Fingerprint Evidence .........83Data Issues, Data Censoring, and Quality Control .......................................................................83
Summary and Conclusions .........................................................................................................................85Organics in Water ...............................................................................................................................85Organics in Sediment .........................................................................................................................85Trace and Major Elements and Nutrients in Water .....................................................................86Trace and Major Elements and Nutrients in Sediment ................................................................86Comparison of Pre-Landfall to Post-Landfall Samples ................................................................87
Acknowledgements .....................................................................................................................................87References Cited .........................................................................................................................................88Glossary .........................................................................................................................................................93Appendix 1. Methods, Reporting levels, and Laboratories Used for Chemical Analysis for
the Deepwater Horizon Oil Spill, Gulf of Mexico, 2010 .............................................................95Appendix 2. Data Distributions for Contaminants in Water and Sediment Sampled in
Response to the Deepwater Horizon Oil Spill, 2010 ..................................................................95Appendix 3. Benchmark Exceedances for Contaminants in Water and Sediment Sampled in
Response to the Deepwater Horizon Oil Spill, 2010 ..................................................................96
v
Figures 1. Map showing U.S. Geological Survey sites sampled in response to the
Deepwater Horizon oil spill, Gulf of Mexico, 2010 ………………………………… 3 2. Graph showing number of analytes for which percentiles were determined
by using four different methods, shown by contaminant class, sampling medium, and sampling period from the 2010 Deepwater Horizon oil spill in the Gulf of Mexico …………………………………………………………………………… 27
3. Graph showing the effect of censoring threshold on the percentages of quantified values that are retained and indeterminate values for an example contaminant from the Deepwater Horizon oil spill, Gulf of Mexico, 2010 ………… 41
4. Graphs showing examples of the data distribution of contaminant concentrations from the Deepwater Horizon oil spill, Gulf of Mexico, 2010 ……… 51
5. Graphs showing for selected analytes, difference between organic contaminant concentrations in samples collected during post-landfall and pre-landfall periods by the USGS at Deepwater Horizon oil spill sampling sites along the Gulf of Mexico coast, 2010 ……………………………………………………………… 59
6. Graphs showing for selected analytes, difference between trace and major element and nutrient concentrations in samples collected during post-landfall and pre-landfall periods by the USGS at Deepwater Horizon oil spill sampling sites along the Gulf of Mexico coast, 2010, from west to east …………………… 72
7. Graphs showing number of benchmark exceedances for trace elements in water in paired pre-landfall and post-landfall samples from the Deepwater Horizon oil spill, Gulf of Mexico, 2010 …………………………………………… 77
Tables 1. U.S. Geological Survey pre-landfall and post-landfall sampling sites in the
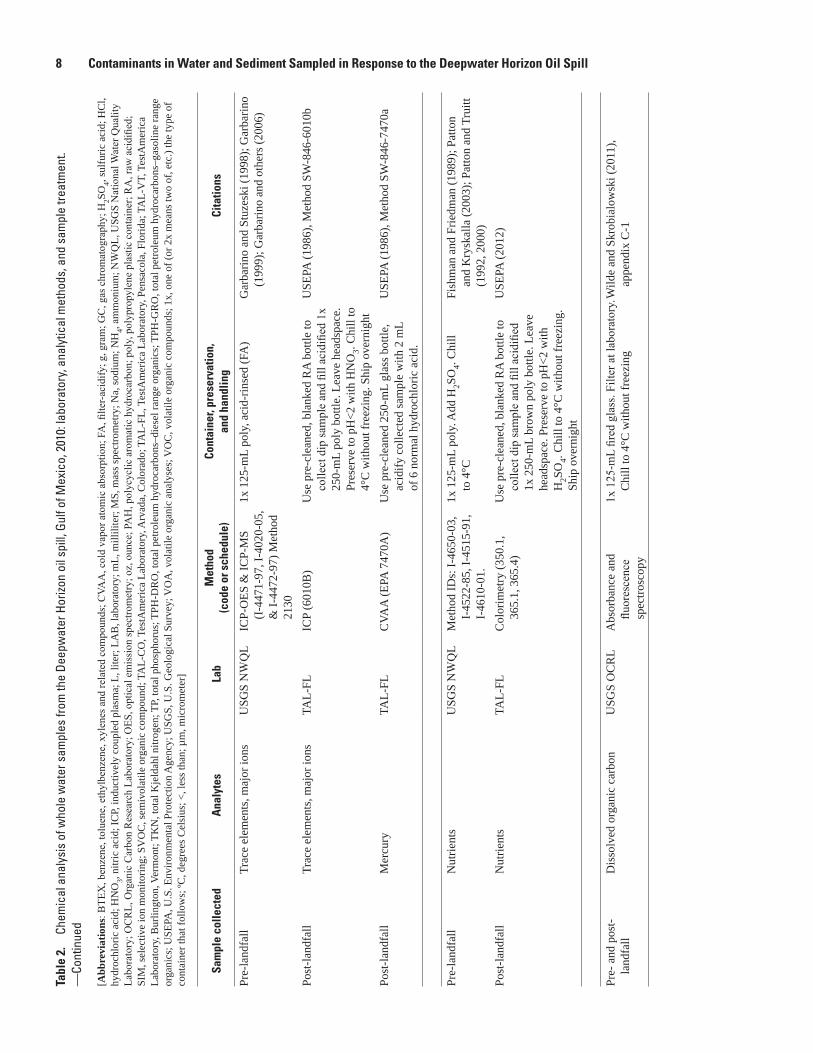
Gulf of Mexico, 2010 Deepwater Horizon oil spill ………………………………… 4 2. Chemical analysis of whole water samples from the Deepwater Horizon oil spill,
Gulf of Mexico, 2010: laboratory, analytical methods, and sample treatment …… 7 3. Chemical analysis of sediment samples from the Deepwater Horizon oil spill,
Gulf of Mexico, 2010: laboratory, analytical methods, and sample treatment …… 10 4. Number of blanks, matrix samples for laboratory spiking, and replicate sets from
the 2010 Deepwater Horizon oil spill, submitted to U.S. Geological Survey and TestAmerica laboratories ………………………………………………………… 11
5A. Benchmark values for organic contaminants: toxic-unit benchmarks for PAH and BTEX compounds in water …………………………………………………… 15
5B. Benchmark values for organic contaminants: supplemental aquatic-life benchmarks for organic contaminants in water ………………………………… 16
5C. Benchmark values for organic contaminants: human-health benchmarks (recreational contact) for organic contaminants in water ………………………… 17
5D. Benchmark values for organic contaminants: equilibrium-partitioning sediment benchmark toxic units for PAH and BTEX compounds in sediment ……………… 18
5E. Benchmark values for organic contaminants: supplemental aquatic-life benchmarks for organic contaminants in sediment ……………………………… 20
vi
Tables
6A. Benchmark values for trace and major elements: aquatic-life benchmarks for trace elements in water …………………………………………………………… 22
6B. Benchmark values for trace and major elements: human-health benchmarks (recreational contact) for trace elements in water ……………………………… 22
6C. Benchmark values for trace and major elements: aquatic-life benchmarks for trace elements in whole sediment ………………………………………………… 23
6D. Benchmark values for trace and major elements: national baseline concentrations for trace and major elements in the less than 63-micrometer sediment fraction ………………………………………………………………… 24
7. Analytes with quantified detections in field blanks collected during the pre-landfall sampling period from the Deepwater Horizon oil spill, Gulf of Mexico, 2010 ……………………………………………………………………… 29
8. Analytes with quantified detections in field and trip blanks collected during the post-landfall sampling period and analyzed at the TestAmerica Laboratory in Pensacola, Florida, from the 2010 Deepwater Horizon oil spill in the Gulf of Mexico …………………………………………………………………………… 30
9. Analytes with quantified detections in sediment-equipment rinsate blanks from the Deepwater Horizon oil spill, Gulf of Mexico, 2010 …………………………… 30
10. Mean relative standard deviation for water analytes with quantified detections in at least two samples in at least four sets of replicate water samples from the Deepwater Horizon oil spill, Gulf of Mexico, 2010 ………………………………… 31
11. Mean relative standard deviation for analytes with quantified detections in at least two samples in at least four sets of replicate sediment samples from the Deepwater Horizon oil spill, Gulf of Mexico, 2010 ………………………………… 32
12. Analytes with less than 70 percent or more than 115 percent recovery in water matrix spikes, or with less than 50 percent or more than 115 percent recovery in sediment matrix spikes from the Deepwater Horizon oil spill, Gulf of Mexico, 2010 ……………………………………………………………………………… 33
13. Constituents that were not detected in any environmental water samples analyzed from the Deepwater Horizon oil spill, Gulf of Mexico, 2010 …………… 34
14. Constituents that were not detected in any environmental sediment samples analyzed from the Deepwater Horizon oil spill, Gulf of Mexico, 2010 …………… 37
15. Constituents analyzed in water that were affected by censoring because of contamination detected in laboratory, field, and trip blanks from the Deepwater Horizon oil spill, Gulf of Mexico, 2010 …………………………………………… 40
16A. Optimal censoring thresholds and sample counts from the Deepwater Horizon oil spill, Gulf of Mexico, 2010: organic contaminants in water …………………… 42
16B. Optimal censoring thresholds and sample counts from the Deepwater Horizon oil spill, Gulf of Mexico, 2010: organic contaminants in whole sediment ………… 44
vii
Tables
16C. Optimal censoring thresholds and sample counts from the Deepwater Horizon oil spill, Gulf of Mexico, 2010: trace and major elements and nutrients in water … 46
16D. Optimal censoring thresholds and sample counts from the Deepwater Horizon oil spill, Gulf of Mexico, 2010: trace and major elements and nutrients in whole sediment ………………………………………………………………………… 48
16E. Optimal censoring thresholds and sample counts from the Deepwater Horizon oil spill, Gulf of Mexico, 2010: trace and major elements and nutrients in the less than 63-micrometer sediment fraction …………………………………………… 49
17. Summary statistics for organic contaminants in water from the Deepwater Horizon oil spill, Gulf of Mexico, 2010 …………………………………………… 50
18. Statistical comparisons of contaminant concentrations in pre-landfall samples to those in post-landfall samples from the Deepwater Horizon oil spill, Gulf of Mexico, 2010: organic contaminants in water …………………………………… 57
19. Summary of benchmark exceedances for organic contaminants in water and sediment from the Deepwater Horizon oil spill, Gulf of Mexico, 2010 …………… 63
20. Summary statistics for organic contaminants in sediment from the Deepwater Horizon oil spill, Gulf of Mexico, 2010 …………………………………………… 65
21. Statistical comparisons of contaminant concentrations in pre-landfall samples and post-landfall samples from the Deepwater Horizon oil spill, Gulf of Mexico, 2010: organic contaminants in sediment ………………………………………… 66
22. Summary statistics for trace and major elements and nutrients in water from the Deepwater Horizon oil spill, Gulf of Mexico, 2010 ………………………………… 69
23. Statistical comparisons of contaminant concentrations in pre-landfall samples to those in post-landfall samples from the Deepwater Horizon oil spill, Gulf of Mexico, 2010: trace and major elements and nutrients in water ………………… 71
24A. Summary of benchmark and baseline exceedances for trace and major elements from the Deepwater Horizon oil spill, Gulf of Mexico, 2010: benchmark exceedances in water. …………………………………………………………… 75
24B. Summary of benchmark and baseline exceedances for trace and major elements from the Deepwater Horizon oil spill, Gulf of Mexico, 2010: benchmark exceedances in whole sediment and national baseline exceedances in the less than 63-micrometer sediment fraction …………………………………………… 76
25. Summary statistics for trace and major elements and nutrients in whole sediment from the Deepwater Horizon oil spill, Gulf of Mexico, 2010 …………… 78
26. Summary statistics for trace and major elements and nutrients in the less than 63-micrometer ediment fraction from the Deepwater Horizon oil spill, Gulf of Mexico, 2010 …………………………………………………………………… 78
27. Statistical comparisons of contaminant concentrations in pre-landfall samples to those in post-landfall samples from the Deepwater Horizon oil spill, Gulf of Mexico, 2010: trace and major elements and nutrients in whole sediment and in the less than 63-micrometer sediment fraction ………………………………… 80

viii
Conversion Factors
SI to Inch/Pound
Multiply By To obtain
Length
centimeter (cm) 0.3937 inch (in.)millimeter (mm) 0.03937 inch (in.)meter (m) 3.281 foot (ft) kilometer (km) 0.6214 mile (mi)kilometer (km) 0.5400 mile, nautical (nmi) meter (m) 1.094 yard (yd)
Area
square meter (m2) 0.0002471 acre square kilometer (km2) 0.3861 square mile (mi2)
Volume
cubic meter (m3) 6.290 barrel (petroleum, 1 barrel = 42 gal)liter (L) 33.82 ounce, fluid (fl. oz)liter (L) 2.113 pint (pt)liter (L) 1.057 quart (qt)liter (L) 0.2642 gallon (gal)liter (L) 61.02 cubic inch (in3)
Mass
gram (g) 0.03527 ounce, avoirdupois (oz)kilogram (kg) 2.205 pound avoirdupois (lb)
Temperature in degrees Celsius (°C) may be converted to degrees Fahrenheit (°F) as follows:
°F=(1.8×°C)+32
Temperature in degrees Fahrenheit (°F) may be converted to degrees Celsius (°C) as follows:
°C=(°F-32)/1.8
Concentrations of chemical constituents in water are given either in milligrams per liter (mg/L), micrograms per liter (µg/L), or percent.
ix
Abbreviations and Acronyms
AET Apparent effect thresholdBTEX Benzene, toluene, ethylbenzene, xylene and related volatile (compounds)DOC dissolved organic carbonERL Effects Range‑LowERM Effects Range‑MedianESBTUi equilibrium‑partitioning sediment benchmark toxic‑unit concentrationEqP equilibrium‑partitioningGC/MS gas chromatography with mass spectrometryGOM Gulf of MexicoGPS Global Positioning SystemICP‑OES inductively‑coupled plasma–optical emission spectrometryICP‑MS inductively‑coupled plasma–mass spectrometryKoc equilibrium partition coefficientM‑1 Macondo‑1MC252 Mississippi Canyon 252MDL method detection limitsPAH polycyclic aromatic hydrocarbonsPEC probable effect concentrationPEL probable effect levelPPW paired Prentice‑WilcoxonQC quality controlRSD relative standard deviationSIM selective ion monitoring modeSVOC semivolatile organic compoundsTEC threshold effect concentrationTEL threshold effect levelTOC total organic carbonTU toxic unitVOC volatile organic compounds
Organizations
API American Petroleum InstituteBLM Bureau of Land ManagementBP British PetroleumNOAA National Oceanic and Atmospheric AdministrationNWQL USGS National Water Quality LaboratoryOCRL Organic Carbon Research LaboratorySCL USGS Sediment Chemistry LaboratoryUSEPA U.S. Environmental Protection AgencyUSGS U.S. Geological Survey
Units of measurement
mg/kg milligram per kilogramµg/g microgram per gramµg/kg microgram per kilogramµg/L microgram per literµm micrometer

x
This page intentionally left blank.

Organic Contaminants, Trace and Major Elements, and Nutrients in Water and Sediment Sampled in Response to the Deepwater Horizon Oil Spill
By Lisa H. Nowell, Amy S. Ludtke, David K. Mueller, and Jonathon C. Scott
AbstractBeach water and sediment samples were collected along
the Gulf of Mexico coast to assess differences in contaminant concentrations before and after landfall of Macondo-1 well oil released into the Gulf of Mexico from the sinking of the British Petroleum Corporation’s Deepwater Horizon drilling platform. Samples were collected at 70 coastal sites between May 7 and July 7, 2010, to document baseline, or “pre-landfall” conditions. A subset of 48 sites was resampled during October 4 to 14, 2010, after oil had made landfall on the Gulf of Mexico coast, called the “post-landfall” sampling period, to determine if actionable concentrations of oil were present along shorelines.
Few organic contaminants were detected in water; their detection frequencies generally were low and similar in pre-landfall and post-landfall samples. Only one organic contaminant—toluene—had significantly higher concentrations in post-landfall than pre-landfall water samples. No water samples exceeded any human-health benchmarks, and only one post-landfall water sample exceeded an aquatic-life benchmark—the toxic-unit benchmark for polycyclic aromatic hydrocarbons (PAH) mixtures. In sediment, concentrations of 3 parent PAHs and 17 alkylated PAH groups were significantly higher in post-landfall samples than pre-landfall samples. One pre-landfall sample from Texas exceeded the sediment toxic-unit benchmark for PAH mixtures; this site was not sampled during the post-landfall period. Empirical upper screening-value benchmarks for PAHs in sediment were exceeded at 37 percent of post-landfall samples and 22 percent of pre-landfall samples, but there was no significant difference in the proportion of samples exceeding benchmarks between paired pre-landfall and post-landfall samples. Seven sites had the largest concentration differences between post-landfall and pre-landfall samples for 15 alkylated PAHs. Five of these seven sites, located in Louisiana, Mississippi, and Alabama, had diagnostic geochemical evidence of Macondo-1 oil in post-landfall sediments and tarballs.
For trace and major elements in water, analytical reporting levels for several elements were high and variable. No human-health benchmarks were exceeded, although these were available for only two elements. Aquatic-life benchmarks for trace elements were exceeded in 47 percent of water samples overall. The elements responsible for the most exceedances in post-landfall samples were boron, copper, and manganese. Benchmark exceedances in water could be substantially underestimated because some samples had reporting levels higher than the applicable benchmarks (such as cobalt, copper, lead and zinc) and some elements (such as boron and vanadium) were analyzed in samples from only one sampling period. For trace elements in whole sediment, empirical upper screening-value benchmarks were exceeded in 57 percent of post-landfall samples and 40 percent of pre-landfall samples, but there was no significant difference in the proportion of samples exceeding benchmarks between paired pre-landfall and post-landfall samples. Benchmark exceedance frequencies could be conservatively high because they are based on measurements of total trace-element concentrations in sediment. In the less than 63-micrometer sediment fraction, one or more trace or major elements were anthropogenically enriched relative to national baseline values for U.S. streams for all sediment samples except one. Sixteen percent of sediment samples exceeded upper screening-value benchmarks for, and were enriched in, one or more of the following elements: barium, vanadium, aluminum, manganese, arsenic, chromium, and cobalt. These samples were evenly divided between the sampling periods.
Aquatic-life benchmarks were frequently exceeded along the Gulf of Mexico coast by trace elements in both water and sediment and by PAHs in sediment. For the most part, however, significant differences between pre-landfall and post-landfall samples were limited to concentrations of PAHs in sediment. At five sites along the coast, the higher post-landfall concentrations of PAHs were associated with diagnostic geochemical evidence of Deepwater Horizon Macondo-1 oil.

2 Contaminants in Water and Sediment Sampled in Response to the Deepwater Horizon Oil Spill
Introduction On April 20, 2010, the British Petroleum (BP)
Corporation’s Deepwater Horizon Mississippi Canyon 252 (MC252) drilling platform sank following an explosion, and oil and gas began to be released into the northern Gulf of Mexico (GOM) from the ruptured Macondo-1 (M-1) well approximately 5,000 feet below the sea surface. About 4.93 million barrels (205.8 million gallons) of oil were released into the northern GOM by the time the well was successfully capped on July 15, 2010 (Operational Science Advisory Team, 2010). To disperse the oil, 1.84 million gallons of chemical dispersants were applied to surface oil and at the well-head (Operational Science Advisory Team, 2010). In response to the threat of oil affecting sensitive habitat along the shores of the GOM, the U.S. Geological Survey (USGS) collected near-surface beach water and sediment at coastal sites from Texas to Florida, both before and after the oil made landfall on the GOM coast. “Pre-landfall” samples were collected from May 7 to July 7, 2010, and “post-landfall” samples were collected on August 23 and from October 4 to 14, 2010. The post-landfall study was requested by the U.S. Coast Guard (Wilde and Skrobialowski, 2011) and was used in conjunction with data from other sources, including the U.S. Environmental Protection Agency, National Oceanic and Atmospheric Administration, the GOM coast states, and BP, to assess the distribution of actionable—that is, amenable to removal actions—oil-related chemicals that remain in the water column, sediments, or both, and to inform decision makers on further oil-removal operations (Operational Science Advisory Team, 2010; Unified Area Command, 2010).
The purpose of this report is to characterize the water and sediment chemistry in pre-landfall and post-landfall samples and to ascertain whether there were significant changes between the two sampling periods. This report complements activities of other USGS scientists and USGS production and research laboratories who are determining surfactants in water samples; analyzing geochemical markers for the presence of M-1 oil, also called MC252 oil, in sediment and tarballs; evaluating bacterial populations capable of degrading oils; assessing the toxicity of sediment pore water to the sea urchin (Arbacia punctulata); and assessing benthic macroinvertebrate indicators of shoreline habitat conditions (Donna N. Myers, Chief, Office of Water Quality, U.S. Geological Survey, Reston, Va., written commun., September 9, 2011).
Specific objectives of this report are the following:• Summarize the occurrence of organic contaminants,
trace and major elements, and nutrients in water and sediment samples at sites along the GOM coast sampled by the USGS before and after oil made landfall.
• Compare contaminant concentrations in pre-landfall samples to post-landfall samples for water and sediment.
• Compare measured concentrations of contaminants to applicable existing benchmarks for protection of human health, aquatic life, and sediment quality.
This report presents one of multiple lines of evidence documenting conditions along the GOM coast before and after landfall of M-1 oil.
Methods This study had two sample collection periods:
pre-landfall and post-landfall. Pre-landfall samples were collected from May 7 to July 7, 2010, which was after the oil spill began, but before oil made landfall on the GOM coast. Post-landfall samples were collected on August 23 and from October 4 to 14, 2010, after oil made landfall at the sampled sites. Post-landfall sampling was carried out at a subset of the pre-landfall sampling sites, plus one oil-affected site that was not sampled during the pre-landfall period.
Although the sample-collection methods were mostly the same during pre-landfall and post-landfall periods, the priorities for chemical analyses changed in some ways between the pre-landfall and post-landfall periods as more information became available from the National Oceanic and Atmospheric Administration (NOAA) and the U.S. Environmental Protection Agency (USEPA) about methods and priorities for oil-related chemical contaminant testing (Operational Science Advisory Team, 2010, appendix F). As a result, the choice of some chemical analysis methods and laboratories was revised for the post-landfall period period. Differences in methods between the two sampling periods are described in the “Chemical Analyses” section.
Study Area and Site Selection
The initial response of the USGS to the Deepwater Horizon oil spill required rapid mobilization to collect water and sediment samples before landfall of the oil in order to establish a baseline chemical and biological profile. This baseline profile could then be used to understand any post-landfall effects on, or changes to, GOM coastal environments (Wilde and Skrobialowski, 2011). The USGS Water Science Centers in Texas, Louisiana, Mississippi, Alabama, and Florida coordinated efforts to sample water and sediments at 70 sites from beaches, barrier islands, and coastal wetlands that could be adversely affected by oil from the spill coming ashore (fig. 1). High priority was given to coastal wetlands, Department of Interior lands at risk for oil contamination, such as National Wildlife Refuges, Bureau of Land Management (BLM) lands, National Seashore areas, and State Parks (Rosenbauer and others, 2010; Donna Myers, Chief, Office of Water Quality, U.S. Geological Survey, Reston, Va., written commun., September 9, 2011). The
Methods 3
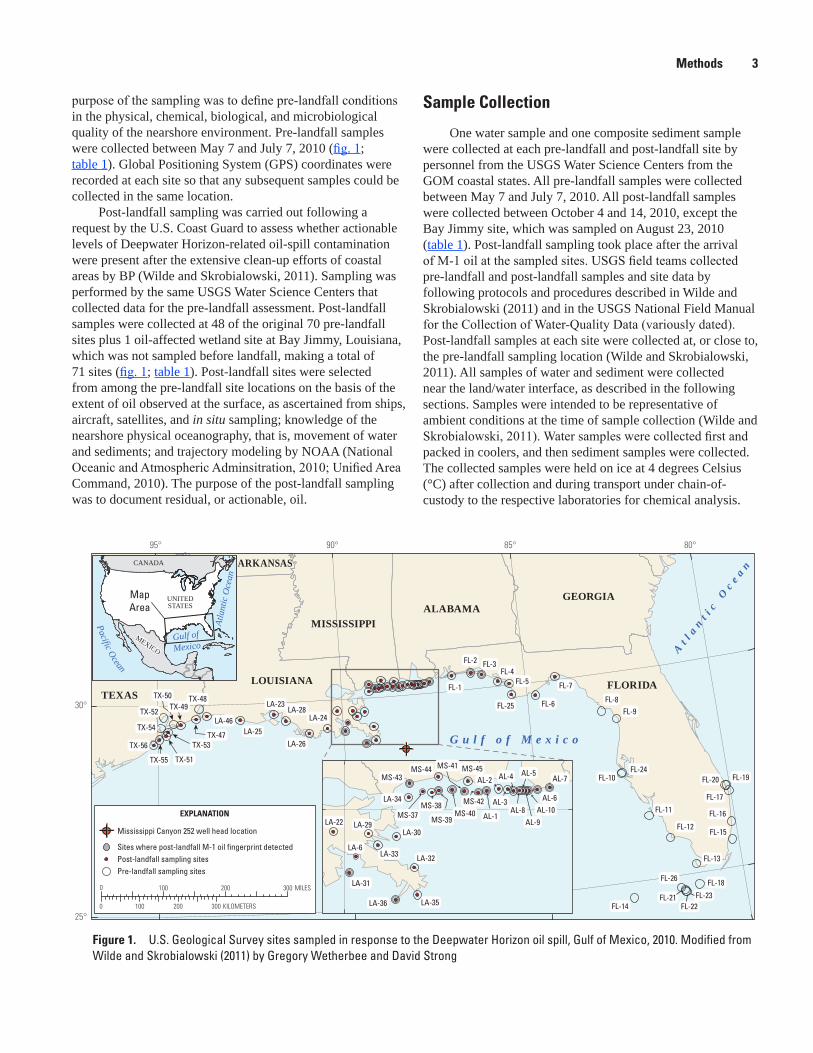
purpose of the sampling was to define pre-landfall conditions in the physical, chemical, biological, and microbiological quality of the nearshore environment. Pre-landfall samples were collected between May 7 and July 7, 2010 (fig. 1; table 1). Global Positioning System (GPS) coordinates were recorded at each site so that any subsequent samples could be collected in the same location.
Post-landfall sampling was carried out following a request by the U.S. Coast Guard to assess whether actionable levels of Deepwater Horizon-related oil-spill contamination were present after the extensive clean-up efforts of coastal areas by BP (Wilde and Skrobialowski, 2011). Sampling was performed by the same USGS Water Science Centers that collected data for the pre-landfall assessment. Post-landfall samples were collected at 48 of the original 70 pre-landfall sites plus 1 oil-affected wetland site at Bay Jimmy, Louisiana, which was not sampled before landfall, making a total of 71 sites (fig. 1; table 1). Post-landfall sites were selected from among the pre-landfall site locations on the basis of the extent of oil observed at the surface, as ascertained from ships, aircraft, satellites, and in situ sampling; knowledge of the nearshore physical oceanography, that is, movement of water and sediments; and trajectory modeling by NOAA (National Oceanic and Atmospheric Adminsitration, 2010; Unified Area Command, 2010). The purpose of the post-landfall sampling was to document residual, or actionable, oil.
Sample Collection
One water sample and one composite sediment sample were collected at each pre-landfall and post-landfall site by personnel from the USGS Water Science Centers from the GOM coastal states. All pre-landfall samples were collected between May 7 and July 7, 2010. All post-landfall samples were collected between October 4 and 14, 2010, except the Bay Jimmy site, which was sampled on August 23, 2010 (table 1). Post-landfall sampling took place after the arrival of M-1 oil at the sampled sites. USGS field teams collected pre-landfall and post-landfall samples and site data by following protocols and procedures described in Wilde and Skrobialowski (2011) and in the USGS National Field Manual for the Collection of Water-Quality Data (variously dated). Post-landfall samples at each site were collected at, or close to, the pre-landfall sampling location (Wilde and Skrobialowski, 2011). All samples of water and sediment were collected near the land/water interface, as described in the following sections. Samples were intended to be representative of ambient conditions at the time of sample collection (Wilde and Skrobialowski, 2011). Water samples were collected first and packed in coolers, and then sediment samples were collected. The collected samples were held on ice at 4 degrees Celsius (°C) after collection and during transport under chain-of-custody to the respective laboratories for chemical analysis.
sac12-0452_figure 01
G u l f o f M e x i c o
At l a n
t i c Oc e a n
GEORGIAALABAMA
MISSISSIPPI
LOUISIANATEXAS
FLORIDA
ARKANSAS
80°85°90°95°
30°
25°
EXPLANATION
Mississippi Canyon 252 well head location
Sites where post-landfall M-1 oil fingerprint detectedPost-landfall sampling sitesPre-landfall sampling sites
0
0 100 200 300 MILES
100 200 300 KILOMETERS
FL-18
LA-6
LA-34
LA-36 LA-35
LA-33 LA-32
LA-31
LA-30LA-29LA-22
MS-45MS-44MS-43
MS-42
MS-41
MS-40MS-39
MS-38MS-37
AL-10AL-9
AL-8
AL-7
AL-6
AL-5AL-4
AL-3
AL-2
AL-1
TX-56
TX-55
TX-54
TX-52
TX-51
TX-49TX-48
TX-47
LA-46LA-28
LA-26LA-25
LA-24
LA-23
FL-12
TX-50
TX-53
FL-9FL-8
FL-7
FL-6
FL-5FL-4
FL-3FL-2
FL-1
FL-26
FL-25
FL-24
FL-23FL-22
FL-21
FL-20 FL-19
FL-17
FL-16
FL-15
FL-14
FL-13
FL-11
FL-10
Pacific Ocean
UNITEDSTATES
MEXICO
CANADA
MapArea
Atla
ntic
Oce
an
Gulf ofMexico
Figure 1. U.S. Geological Survey sites sampled in response to the Deepwater Horizon oil spill, Gulf of Mexico, 2010. Modified from Wilde and Skrobialowski (2011) by Gregory Wetherbee and David Strong

4 Contaminants in Water and Sediment Sampled in Response to the Deepwater Horizon Oil Spill Ta
ble
1.
U.S.
Geo
logi
cal S
urve
y pr
e-la
ndfa
ll an
d po
st-la
ndfa
ll sa
mpl
ing
site
s in
the
Gulf
of M
exic
o, 2
010
Deep
wat
er H
orizo
n oi
l spi
ll.—
Cont
inue
d
[Sam
ple
date
s are
exp
ress
ed a
s MM
/DD
/YY.
Abb
revi
atio
ns: A
la, A
laba
ma;
BLM
, Bur
eau
of L
and
Man
agem
ent;
dd, d
ecim
al d
egre
es; F
la.,
Flor
ida;
La.
, Lou
isia
na; M
-1, M
acon
do-1
wel
l; M
iss.,
Mis
siss
ippi
; N
WIS
web
, onl
ine
Nat
iona
l Wat
er In
form
atio
n Sy
stem
(http
://nw
is.w
ater
data
.usg
s.gov
/usa
/nw
is/q
wda
ta);
NW
R, N
atio
nal W
ildlif
e R
efug
e; S
t., S
aint
; Tex
., Te
xas;
USG
S, U
.S. G
eolo
gica
l Sur
vey;
WSC
, Wat
er
Scie
nce
Cen
ter;
–, n
o po
st-la
ndfa
ll sa
mpl
e w
as c
olle
cted
]
Map
nu
mbe
rSt
atio
n id
entif
ier
Site
nam
eLa
titud
e
(dd)
Long
itude
(d
d)U
SGS
W
SC
Dat
es th
at s
ite w
as s
ampl
edM
-1 o
il in
pos
t-la
ndfa
ll1
Post
-lan
dfal
lPr
e-la
ndfa
ll2Se
dim
ent
Tarb
all
FL-1
3021
4408
6581
200
Gul
f Isl
and
Nat
iona
l Sea
shor
e ne
ar N
avar
re, F
la.
30.3
6239
–86.
9702
Fla.
10/0
4/10
05/1
1/10
Mix
No
FL-2
3022
5808
6263
400
Hen
ders
on B
each
Sta
te P
ark
near
Des
tin, F
la.
30.3
8294
–86.
4428
Fla.
10/0
5/10
05/1
1/10
No
Yes
FL-3
3019
2608
6091
800
Gra
yton
Bea
ch S
tate
Par
k ne
ar S
easi
de, F
la.
30.3
2406
–86.
1551
Fla.
10/0
5/10
05/1
2/10
Yes
–FL
-430
0729
0854
4090
0St
. And
rew
s Sta
te P
ark
near
Pan
ama
City
, Fla
.30
.124
72–8
5.73
6Fl
a.10
/11/
1005
/12/
10N
o–
FL-5
2946
4508
5243
000
St. J
osep
h Pe
nins
ula
Stat
e Pa
rk n
ear P
ort S
t. Jo
e, F
la.
29.7
7917
–85.
4085
Fla.
10/1
3/10
05/1
3/10
No
–FL
-629
4152
0844
6030
0St
. Geo
rge
Isla
nd S
tate
Par
k ne
ar E
Poi
nt, F
la.
29.6
9786
–84.
7678
Fla.
10/0
6/10
05/1
3/10
No
–FL
-730
0427
0841
0500
0St
. Mar
ks N
WR
nea
r St.
Mar
ks, F
la.
30.0
7419
–84.
1804
Fla.
10/0
7/10
05/1
8/10
No
–FL
-829
0740
0830
3120
0Pi
ney
Poin
t Bea
ch a
t Ced
ar K
ey, F
la.
29.1
2775
–83.
0534
Fla.
–05
/18/
10–
–FL
-928
5425
0824
1260
0Fo
rt Is
land
Gul
f Bea
ch n
ear C
hass
ahow
itzka
, Fla
.28
.907
19–8
2.69
08Fl
a.–
05/1
9/10
––
FL-1
027
3728
0824
4180
0Fo
rt D
eSot
o Pa
rk n
ear S
t. Pe
ters
burg
, Fla
.27
.624
44–8
2.73
83Fl
a.–
05/1
7/10
––
FL-1
126
3132
0821
1400
0C
aptiv
a Is
land
Bea
ch n
ear C
aptiv
a, F
la.
26.5
2564
–82.
1942
Fla.
–05
/20/
10–
–FL
-12
2556
0908
1440
700
Tige
r Tai
l Bea
ch a
t Mar
co Is
land
, Fla
.25
.936
14–8
1.73
46Fl
a.–
05/2
1/10
––
FL-1
325
1329
0811
0110
0N
orth
wes
t Cap
e Sa
ble
Bea
ch n
ear F
lam
ingo
, Fla
.25
.224
81–8
1.17
Fla.
–05
/22/
10–
–FL
-14
2437
3708
2522
500
Dry
Tor
tuga
s Nat
iona
l Par
k, F
la.
24.6
2714
–82.
8736
Fla.
–05
/20/
10–
–FL
-15
2540
0208
0092
000
Bill
Bag
gs C
ape
near
Key
Bis
cayn
e, F
la.
25.6
6742
–80.
1555
Fla.
–06
/01/
10–
–FL
-16
2604
5408
0063
400
Lloy
d B
each
at F
ort L
aude
rdal
e, F
la.
26.0
8169
–80.
1094
Fla.
–05
/26/
10–
–FL
-17
2649
2108
0021
700
Mac
Arth
ur B
each
at W
est P
alm
Bea
ch, F
la.
26.8
2258
–80.
0381
Fla.
–05
/27/
10–
–FL
-182
2443
4508
1000
600
Coc
o Pl
um B
each
nea
r Mar
atho
n, F
la.
24.7
2925
–81.
17Fl
a.–
05/2
4/10
––
FL-1
926
5722
0800
4540
0B
LM T
ract
1 ne
ar Ju
pite
r Inl
et, F
la.
26.9
5611
–80.
0817
Fla.
–06
/16/
10–
–FL
-20
2657
2208
0045
500
BLM
Tra
ct2
near
Jupi
ter I
nlet
, Fla
.26
.956
11–8
0.08
19Fl
a.–
06/1
6/10
––
FL-2
124
3902
0813
3270
0B
LM T
ract
1 ne
ar P
ark
Key
, Fla
.24
.650
56–8
1.55
75Fl
a.–
06/0
9/10
––
FL-2
224
3703
0813
2370
0B
LM T
ract
2 ne
ar S
ugar
loaf
Key
, Fla
.24
.617
5–8
1.54
36Fl
a.–
06/0
9/10
––
FL-2
324
3700
0813
2230
0B
LM T
ract
3 ne
ar S
ugar
loaf
Key
, Fla
.24
.616
67–8
1.53
97Fl
a.–
06/0
9/10
––
FL-2
427
3605
0824
5490
0B
LM T
ract
at E
gmon
t Key
, Fla
.27
.601
39–8
2.76
36Fl
a.–
06/1
4/10
––
FL-2
530
0223
0852
6080
0B
LM L
athr
op B
ayou
nea
r Pan
ama
City
, Fla
.30
.038
94–8
5.43
55Fl
a.10
/12/
1006
/10/
10N
o–
FL-2
624
4325
0813
5150
0M
arvi
n K
ey a
t Gre
at W
hite
Her
on N
WR
, Fla
.24
.709
81–8
1.64
46Fl
a.–
07/0
7/10
––
AL-
130
1338
0881
9350
0W
est D
auph
in Is
land
, Ala
.30
.227
43–8
8.32
64A
la.
10/1
3/10
05/0
8/10
Mix
Yes
AL-
230
1455
0881
1030
0D
auph
in Is
land
, AL-
230
.248
81–8
8.18
42A
la.
10/0
7/10
05/0
9/10
No
–A
L-3
3014
4808
8044
000
Dau
phin
Isla
nd, A
L-3
30.2
4687
–88.
0778
Ala
.10
/06/
1005
/09/
10N
o–
AL-
430
1329
0880
0300
0Fo
rt M
orga
n, A
L-4
30.2
2493
–88.
0083
Ala
.10
/12/
1005
/08/
10Ye
sYe
sA
L-5
3013
4908
7541
600
Fort
Mor
gan,
AL-
530
.230
48–8
7.90
44A
la.
10/1
3/10
05/0
8/10
Yes
Yes
AL-
630
1428
0874
3490
0G
ulf S
hore
s, A
la.
30.2
4131
–87.
7303
Ala
.10
/14/
1005
/08/
10M
ixYe
sA
L-7
3016
0808
7345
400
Ora
nge
Bea
ch, A
la.
30.2
6909
–87.
5816
Ala
.10
/14/
1005
/08/
10M
ixYe
sA
L-8
3013
5308
7561
600
BLM
-1, A
la.
30.2
3159
–87.
9378
Ala
.10
/13/
1005
/24/
10Ye
sYe
sA
L-9
3013
4308
7520
200
BLM
-2, A
la.
30.2
2881
–87.
8672
Ala
.10
/14/
1005
/24/
10Ye
sYe
sA
L-10
3013
4108
7495
200
Fort
Mor
gan
BLM
-3, A
la.
30.2
2826
–87.
8311
Ala
.10
/14/
1005
/24/
10M
ixYe
sLA
-629
2708
0895
2140
0B
ay Ji
mm
y at
Nor
thea
st B
arat
aria
Bay
, La.
29.4
5222
–89.
8706
La.
08/2
3/10
–Ye
s–
LA-2
229
4432
0900
8310
0Je
an L
afitte
Nat
iona
l Par
k, L
a.29
.742
22–9
0.14
19La
.10
/13/
1005
/14/
10N
o–
Tabl
e 1.
U.
S. G
eolo
gica
l Sur
vey
pre-
land
fall
and
post
-land
fall
sam
plin
g si
tes
in th
e Gu
lf of
Mex
ico,
201
0 De
epw
ater
Hor
izon
oil s
pill.

Methods 5Ta
ble
1.
U.S.
Geo
logi
cal S
urve
y pr
e-la
ndfa
ll an
d po
st-la
ndfa
ll sa
mpl
ing
site
s in
the
Gulf
of M
exic
o, 2
010
Deep
wat
er H
orizo
n oi
l spi
ll.—
Cont
inue
d
[Sam
ple
date
s are
exp
ress
ed a
s MM
/DD
/YY.
Abb
revi
atio
ns: A
la, A
laba
ma;
BLM
, Bur
eau
of L
and
Man
agem
ent;
dd, d
ecim
al d
egre
es; F
la.,
Flor
ida;
La.
, Lou
isia
na; M
-1, M
acon
do-1
wel
l; M
iss.,
Mis
siss
ippi
; N
WIS
web
, onl
ine
Nat
iona
l Wat
er In
form
atio
n Sy
stem
(http
://nw
is.w
ater
data
.usg
s.gov
/usa
/nw
is/q
wda
ta);
NW
R, N
atio
nal W
ildlif
e R
efug
e; S
t., S
aint
; Tex
., Te
xas;
USG
S, U
.S. G
eolo
gica
l Sur
vey;
WSC
, Wat
er
Scie
nce
Cen
ter;
–, n
o po
st-la
ndfa
ll sa
mpl
e w
as c
olle
cted
]
Map
nu
mbe
rSt
atio
n id
entif
ier
Site
nam
eLa
titud
e
(dd)
Long
itude
(d
d)U
SGS
W
SC
Dat
es th
at s
ite w
as s
ampl
edM
-1 o
il in
pos
t-la
ndfa
ll1
Post
-lan
dfal
lPr
e-la
ndfa
ll2Se
dim
ent
Tarb
all
LA-2
329
4406
0915
1130
0C
ypre
mor
t Poi
nt, L
a.29
.735
–91.
8536
La.
10/0
5/10
05/1
3/10
No
–LA
-24
2920
4609
0254
500
Lake
Fel
icity
, La.
29.3
4611
–90.
4292
La.
10/1
2/10
05/1
8/10
No
–LA
-25
2938
0809
2460
200
Roc
kefe
ller R
efug
e B
each
, La.
29.6
3556
–92.
7672
La.
10/0
7/10
05/1
3/10
No
–LA
-26
2915
0709
0551
800
Sist
er L
ake,
La.
29.2
5194
–90.
9217
La.
10/0
8/10
05/1
7/10
No
–LA
-28
2934
2409
1321
600
Poin
t Che
vreu
il, L
a.29
.573
33–9
1.53
78La
.10
/05/
1005
/13/
10N
o–
LA-2
929
4324
0894
3250
0C
rook
ed B
ayou
, La.
29.7
2333
–89.
7236
La.
10/1
3/10
05/1
8/10
No
–LA
-30
2941
0808
9234
500
Mis
siss
ippi
Riv
er G
ulf O
utle
t, La
.29
.685
56–8
9.39
58La
.10
/13/
1005
/07/
10N
o–
LA-3
129
1537
0895
7010
0G
rand
Isle
Bea
ch a
t Sta
te P
ark,
La.
29.2
6028
–89.
9503
La.
10/1
4/10
05/1
0/10
Yes3
Yes3
LA-3
229
1914
0891
0550
0M
issi
ssip
pi R
iver
at M
ain
Pass
, La.
29.3
2056
–89.
1819
La.
10/0
7/10
05/0
7/10
No
–LA
-33
2935
1808
9364
300
Bre
ton
Soun
d, L
a.29
.588
33–8
9.61
19La
.10
/13/
1005
/07/
10N
o–
LA-3
430
0907
0891
4450
0M
issi
ssip
pi S
ound
at G
rand
Pas
s, La
.30
.151
94–8
9.24
58La
.10
/11/
1005
/07/
10N
o–
LA-3
528
5951
0890
8560
0M
issi
ssip
pi R
iver
at S
outh
Pas
s, La
.28
.997
5–8
9.14
89La
.10
/07/
1005
/07/
10N
o–
LA-3
628
5615
0892
3560
0M
issi
ssip
pi R
iver
at S
outh
wes
t Pas
s, La
.28
.937
5–8
9.39
89La
.10
/14/
1005
/07/
10Ye
s–
LA-4
629
4456
0933
9480
1Ea
st S
abin
e, L
a.29
.748
89–9
3.66
33La
.10
/06/
1005
/10/
10N
o–
MS-
3730
1309
0890
4470
0So
uth
Cat
Isla
nd B
each
, Mis
s.30
.219
17–8
9.07
97M
iss.
10/1
4/10
05/0
7/10
Yes
Yes
MS-
3830
1227
0885
8200
0W
est S
hip
Isla
nd B
each
, Mis
s.30
.207
5–8
8.97
22M
iss.
10/1
4/10
05/0
7/10
No
–M
S-39
3013
5808
8533
300
East
Shi
p Is
land
Bea
ch, M
iss.
30.2
3278
–88.
8925
Mis
s.10
/11/
1005
/07/
10N
oYe
sM
S-40
3014
2508
8440
600
Wes
t Hor
n Is
land
Bea
ch, M
iss.
30.2
4028
–88.
735
Mis
s.10
/12/
1005
/08/
10Ye
sYe
sM
S-41
3013
2108
8353
300
East
Hor
n Is
land
Bea
ch, M
iss.
30.2
225
–88.
5925
Mis
s.10
/12/
1005
/08/
10N
oYe
sM
S-42
3012
0808
8253
600
Petit
Boi
s Isl
and
Bea
ch, M
iss.
30.2
0222
–88.
4267
Mis
s.10
/13/
1005
/08/
10Ye
sYe
sM
S-43
3018
5808
9141
000
Pass
Chr
istia
n B
each
, Mis
s.30
.316
11–8
9.23
61M
iss.
10/0
8/10
05/0
8/10
No
Yes
MS-
4430
2336
0885
3580
0B
iloxi
Bea
ch, M
iss.
30.3
9333
–88.
8994
Mis
s.10
/07/
1005
/08/
10N
oN
oM
S-45
3020
3408
8325
200
Pasc
agou
la B
each
, Mis
s.30
.342
78–8
8.54
78M
iss.
10/1
4/10
05/0
8/10
No
No
TX-4
729
4057
0935
7230
1Te
xas P
oint
, Tex
.29
.682
5–9
3.95
64Te
x.10
/06/
1005
/10/
10N
o–
TX-4
829
5542
0935
2170
1Sa
bine
Lak
e, T
ex.
29.9
2833
–93.
8714
Tex.
–05
/10/
10–
–TX
-49
2933
2409
4220
601
Hig
h Is
land
, Tex
.29
.556
67–9
4.36
83Te
x.10
/07/
1005
/10/
10N
o–
TX-5
029
3429
0943
3210
1Ea
st B
ay n
ear A
nahu
ac, T
ex.
29.5
7472
–94.
5558
Tex.
–05
/10/
10–
–TX
-51
2918
1509
4461
001
Gal
vest
on Is
land
, Tex
.29
.304
17–9
4.76
94Te
x.10
/13/
1005
/10/
10N
o3–
TX-5
229
4408
0945
0110
1Tr
inity
Bay
nea
r Bea
ch C
ity, T
ex.
29.7
3556
–94.
8364
Tex.
–05
/11/
10–
–TX
-53
2923
1809
4430
901
Bol
ivar
Pen
insu
la, T
ex.
29.3
8833
–94.
7192
Tex.
10/0
7/10
05/1
1/10
No
–TX
-54
2929
3709
4544
001
Gal
vest
on B
ay n
ear E
agle
Poi
nt, T
ex.
29.4
9361
–94.
9111
Tex.
–05
/11/
10–
–TX
-55
2912
5109
4571
401
Wes
t Bay
, Gal
vest
on Is
land
Sta
te P
ark,
Tex
.29
.214
17–9
4.95
39Te
x.10
/14/
1005
/11/
10N
o3–
TX-5
629
0512
0950
6310
1Sa
n Lu
is P
ass,
Tex.
29.0
8667
–95.
1086
Tex.
10/0
5/10
05/1
1/10
No
–
6 Contaminants in Water and Sediment Sampled in Response to the Deepwater Horizon Oil Spill
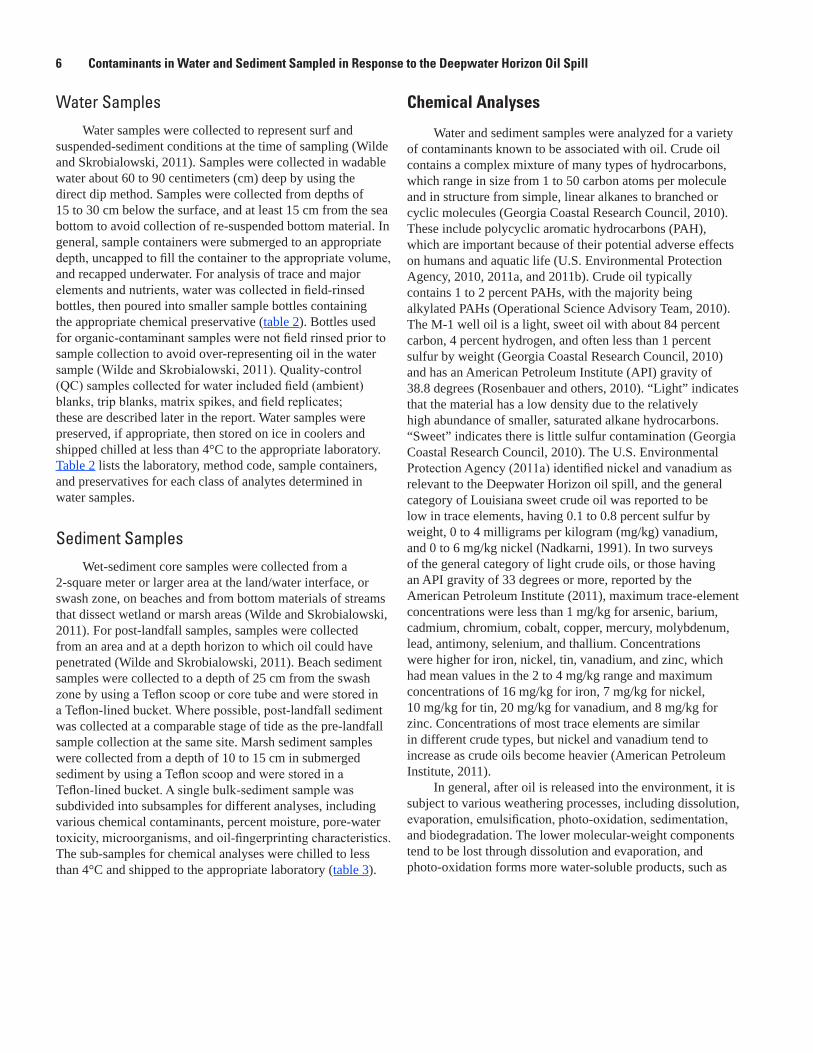
Water SamplesWater samples were collected to represent surf and
suspended-sediment conditions at the time of sampling (Wilde and Skrobialowski, 2011). Samples were collected in wadable water about 60 to 90 centimeters (cm) deep by using the direct dip method. Samples were collected from depths of 15 to 30 cm below the surface, and at least 15 cm from the sea bottom to avoid collection of re-suspended bottom material. In general, sample containers were submerged to an appropriate depth, uncapped to fill the container to the appropriate volume, and recapped underwater. For analysis of trace and major elements and nutrients, water was collected in field-rinsed bottles, then poured into smaller sample bottles containing the appropriate chemical preservative (table 2). Bottles used for organic-contaminant samples were not field rinsed prior to sample collection to avoid over-representing oil in the water sample (Wilde and Skrobialowski, 2011). Quality-control (QC) samples collected for water included field (ambient) blanks, trip blanks, matrix spikes, and field replicates; these are described later in the report. Water samples were preserved, if appropriate, then stored on ice in coolers and shipped chilled at less than 4°C to the appropriate laboratory. Table 2 lists the laboratory, method code, sample containers, and preservatives for each class of analytes determined in water samples.
Sediment SamplesWet-sediment core samples were collected from a
2-square meter or larger area at the land/water interface, or swash zone, on beaches and from bottom materials of streams that dissect wetland or marsh areas (Wilde and Skrobialowski, 2011). For post-landfall samples, samples were collected from an area and at a depth horizon to which oil could have penetrated (Wilde and Skrobialowski, 2011). Beach sediment samples were collected to a depth of 25 cm from the swash zone by using a Teflon scoop or core tube and were stored in a Teflon-lined bucket. Where possible, post-landfall sediment was collected at a comparable stage of tide as the pre-landfall sample collection at the same site. Marsh sediment samples were collected from a depth of 10 to 15 cm in submerged sediment by using a Teflon scoop and were stored in a Teflon-lined bucket. A single bulk-sediment sample was subdivided into subsamples for different analyses, including various chemical contaminants, percent moisture, pore-water toxicity, microorganisms, and oil-fingerprinting characteristics. The sub-samples for chemical analyses were chilled to less than 4°C and shipped to the appropriate laboratory (table 3).
Chemical Analyses
Water and sediment samples were analyzed for a variety of contaminants known to be associated with oil. Crude oil contains a complex mixture of many types of hydrocarbons, which range in size from 1 to 50 carbon atoms per molecule and in structure from simple, linear alkanes to branched or cyclic molecules (Georgia Coastal Research Council, 2010). These include polycyclic aromatic hydrocarbons (PAH), which are important because of their potential adverse effects on humans and aquatic life (U.S. Environmental Protection Agency, 2010, 2011a, and 2011b). Crude oil typically contains 1 to 2 percent PAHs, with the majority being alkylated PAHs (Operational Science Advisory Team, 2010). The M-1 well oil is a light, sweet oil with about 84 percent carbon, 4 percent hydrogen, and often less than 1 percent sulfur by weight (Georgia Coastal Research Council, 2010) and has an American Petroleum Institute (API) gravity of 38.8 degrees (Rosenbauer and others, 2010). “Light” indicates that the material has a low density due to the relatively high abundance of smaller, saturated alkane hydrocarbons. “Sweet” indicates there is little sulfur contamination (Georgia Coastal Research Council, 2010). The U.S. Environmental Protection Agency (2011a) identified nickel and vanadium as relevant to the Deepwater Horizon oil spill, and the general category of Louisiana sweet crude oil was reported to be low in trace elements, having 0.1 to 0.8 percent sulfur by weight, 0 to 4 milligrams per kilogram (mg/kg) vanadium, and 0 to 6 mg/kg nickel (Nadkarni, 1991). In two surveys of the general category of light crude oils, or those having an API gravity of 33 degrees or more, reported by the American Petroleum Institute (2011), maximum trace-element concentrations were less than 1 mg/kg for arsenic, barium, cadmium, chromium, cobalt, copper, mercury, molybdenum, lead, antimony, selenium, and thallium. Concentrations were higher for iron, nickel, tin, vanadium, and zinc, which had mean values in the 2 to 4 mg/kg range and maximum concentrations of 16 mg/kg for iron, 7 mg/kg for nickel, 10 mg/kg for tin, 20 mg/kg for vanadium, and 8 mg/kg for zinc. Concentrations of most trace elements are similar in different crude types, but nickel and vanadium tend to increase as crude oils become heavier (American Petroleum Institute, 2011).
In general, after oil is released into the environment, it is subject to various weathering processes, including dissolution, evaporation, emulsification, photo-oxidation, sedimentation, and biodegradation. The lower molecular-weight components tend to be lost through dissolution and evaporation, and photo-oxidation forms more water-soluble products, such as
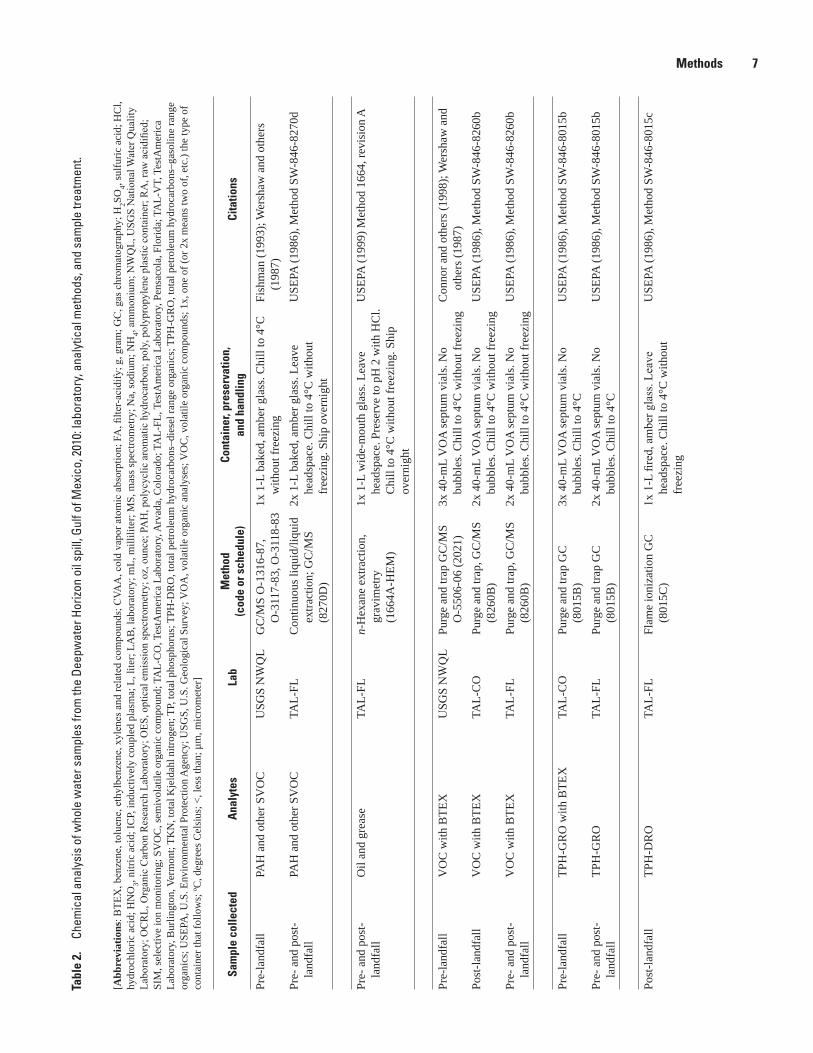
Methods 7Ta
ble
2.
Chem
ical
ana
lysi
s of
who
le w
ater
sam
ples
from
the
Deep
wat
er H
orizo
n oi
l spi
ll, G
ulf o
f Mex
ico,
201
0: la
bora
tory
, ana
lytic
al m
etho
ds, a
nd s
ampl
e tre
atm
ent.
—Co
ntin
ued
[Abb
revi
atio
ns: B
TEX
, ben
zene
, tol
uene
, eth
ylbe
nzen
e, x
ylen
es a
nd re
late
d co
mpo
unds
; CVA
A, c
old
vapo
r ato
mic
abs
orpt
ion;
FA
, filte
r-aci
dify
; g, g
ram
; GC
, gas
chr
omat
ogra
phy;
H2SO
4, sul
furic
aci
d; H
Cl,
hydr
ochl
oric
aci
d; H
NO
3, nitr
ic a
cid;
ICP,
indu
ctiv
ely
coup
led
plas
ma;
L, l
iter;
LAB
, lab
orat
ory;
mL,
mill
ilite
r; M
S, m
ass s
pect
rom
etry
; Na,
sodi
um; N
H4, a
mm
oniu
m; N
WQ
L, U
SGS
Nat
iona
l Wat
er Q
ualit
y La
bora
tory
; OC
RL,
Org
anic
Car
bon
Res
earc
h La
bora
tory
; OES
, opt
ical
em
issi
on sp
ectro
met
ry; o
z, o
unce
; PA
H, p
olyc
yclic
aro
mat
ic h
ydro
carb
on; p
oly,
pol
ypro
pyle
ne p
last
ic c
onta
iner
; RA
, raw
aci
difie
d;
SIM
, sel
ectiv
e io
n m
onito
ring;
SV
OC
, sem
ivol
atile
org
anic
com
poun
d; T
AL-
CO
, Tes
tAm
eric
a La
bora
tory
, Arv
ada,
Col
orad
o; T
AL-
FL, T
estA
mer
ica
Labo
rato
ry, P
ensa
cola
, Flo
rida;
TA
L-V
T, T
estA
mer
ica
Labo
rato
ry, B
urlin
gton
, Ver
mon
t; TK
N, t
otal
Kje
ldah
l nitr
ogen
; TP,
tota
l pho
spho
rus;
TPH
-DR
O, t
otal
pet
role
um h
ydro
carb
ons–
dies
el ra
nge
orga
nics
; TPH
-GR
O, t
otal
pet
role
um h
ydro
carb
ons–
gaso
line
rang
e or
gani
cs; U
SEPA
, U.S
. Env
ironm
enta
l Pro
tect
ion
Age
ncy;
USG
S, U
.S. G
eolo
gica
l Sur
vey;
VO
A, v
olat
ile o
rgan
ic a
naly
ses;
VO
C, v
olat
ile o
rgan
ic c
ompo
unds
; 1x,
one
of (
or 2
x m
eans
two
of, e
tc.)
the
type
of
cont
aine
r tha
t fol
low
s; ºC
, deg
rees
Cel
sius
; <, l
ess t
han;
µm
, mic
rom
eter
]
Sam
ple
colle
cted
Ana
lyte
sLa
bM
etho
d
(cod
e or
sch
edul
e)Co
ntai
ner,
pres
erva
tion,
an
d ha
ndlin
gCi
tatio
ns
Pre-
land
fall
PAH
and
oth
er S
VO
CU
SGS
NW
QL
GC
/MS
O-1
316-
87,
O-3
117-
83, O
-311
8-83
1x 1
-L b
aked
, am
ber g
lass
. Chi
ll to
4°C
w
ithou
t fre
ezin
gFi
shm
an (1
993)
; Wer
shaw
and
oth
ers
(198
7)Pr
e- a
nd p
ost-
land
fall
PAH
and
oth
er S
VO
CTA
L-FL
Con
tinuo
us li
quid
/liqu
id
extra
ctio
n; G
C/M
S (8
270D
)
2x 1
-L b
aked
, am
ber g
lass
. Lea
ve
head
spac
e. C
hill
to 4
°C w
ithou
t fr
eezi
ng. S
hip
over
nigh
t
USE
PA (1
986)
, Met
hod
SW-8
46-8
270d
Pre-
and
pos
t- la
ndfa
llO
il an
d gr
ease
TAL-
FLn-
Hex
ane
extra
ctio
n,
grav
imet
ry
(166
4A-H
EM)
1x 1
-L w
ide-
mou
th g
lass
. Lea
ve
head
spac
e. P
rese
rve
to p
H 2
with
HC
l. C
hill
to 4
°C w
ithou
t fre
ezin
g. S
hip
over
nigh
t
USE
PA (1
999)
Met
hod
1664
, rev
isio
n A
Pre-
land
fall
VO
C w
ith B
TEX
USG
S N
WQ
LPu
rge
and
trap
GC
/MS
O-5
506-
06 (2
021)
3x 4
0-m
L V
OA
sept
um v
ials
. No
bu
bble
s. C
hill
to 4
°C w
ithou
t fre
ezin
gC
onno
r and
oth
ers (
1998
); W
ersh
aw a
nd
othe
rs (1
987)
Post
-land
fall
VO
C w
ith B
TEX
TAL-
CO
Purg
e an
d tra
p, G
C/M
S (8
260B
)2x
40-
mL
VO
A se
ptum
via
ls. N
o
bubb
les.
Chi
ll to
4°C
with
out f
reez
ing
USE
PA (1
986)
, Met
hod
SW-8
46-8
260b
Pre-
and
pos
t- la
ndfa
llV
OC
with
BTE
XTA
L-FL
Purg
e an
d tra
p, G
C/M
S (8
260B
)2x
40-
mL
VO
A se
ptum
via
ls. N
o
bubb
les.
Chi
ll to
4°C
with
out f
reez
ing
USE
PA (1
986)
, Met
hod
SW-8
46-8
260b
Pre-
land
fall
TPH
-GR
O w
ith B
TEX
TAL-
CO
Purg
e an
d tra
p G
C
(801
5B)
3x 4
0-m
L V
OA
sept
um v
ials
. No
bu
bble
s. C
hill
to 4
°CU
SEPA
(198
6), M
etho
d SW
-846
-801
5b
Pre-
and
pos
t- la
ndfa
llTP
H-G
RO
TAL-
FLPu
rge
and
trap
GC
(8
015B
)2x
40-
mL
VO
A se
ptum
via
ls. N
o
bubb
les.
Chi
ll to
4°C
USE
PA (1
986)
, Met
hod
SW-8
46-8
015b
Post
-land
fall
TPH
-DR
OTA
L-FL
Flam
e io
niza
tion
GC
(8
015C
)1x
1-L
fire
d, a
mbe
r gla
ss. L
eave
he
adsp
ace.
Chi
ll to
4°C
with
out
free
zing
USE
PA (1
986)
, Met
hod
SW-8
46-8
015c
Tabl
e 2.
Ch
emic
al a
naly
sis
of w
hole
wat
er s
ampl
es fr
om th
e De
epw
ater
Hor
izon
oil s
pill,
Gul
f of M
exic
o, 2
010:
labo
rato
ry, a
naly
tical
met
hods
, and
sam
ple
treat
men
t.
8 Contaminants in Water and Sediment Sampled in Response to the Deepwater Horizon Oil Spill Ta
ble
2.
Chem
ical
ana
lysi
s of
who
le w
ater
sam
ples
from
the
Deep
wat
er H
orizo
n oi
l spi
ll, G
ulf o
f Mex
ico,
201
0: la
bora
tory
, ana
lytic
al m
etho
ds, a
nd s
ampl
e tre
atm
ent.
—Co
ntin
ued
[Abb
revi
atio
ns: B
TEX
, ben
zene
, tol
uene
, eth
ylbe
nzen
e, x
ylen
es a
nd re
late
d co
mpo
unds
; CVA
A, c
old
vapo
r ato
mic
abs
orpt
ion;
FA
, filte
r-aci
dify
; g, g
ram
; GC
, gas
chr
omat
ogra
phy;
H2SO
4, sul
furic
aci
d; H
Cl,
hydr
ochl
oric
aci
d; H
NO
3, nitr
ic a
cid;
ICP,
indu
ctiv
ely
coup
led
plas
ma;
L, l
iter;
LAB
, lab
orat
ory;
mL,
mill
ilite
r; M
S, m
ass s
pect
rom
etry
; Na,
sodi
um; N
H4, a
mm
oniu
m; N
WQ
L, U
SGS
Nat
iona
l Wat
er Q
ualit
y La
bora
tory
; OC
RL,
Org
anic
Car
bon
Res
earc
h La
bora
tory
; OES
, opt
ical
em
issi
on sp
ectro
met
ry; o
z, o
unce
; PA
H, p
olyc
yclic
aro
mat
ic h
ydro
carb
on; p
oly,
pol
ypro
pyle
ne p
last
ic c
onta
iner
; RA
, raw
aci
difie
d;
SIM
, sel
ectiv
e io
n m
onito
ring;
SV
OC
, sem
ivol
atile
org
anic
com
poun
d; T
AL-
CO
, Tes
tAm
eric
a La
bora
tory
, Arv
ada,
Col
orad
o; T
AL-
FL, T
estA
mer
ica
Labo
rato
ry, P
ensa
cola
, Flo
rida;
TA
L-V
T, T
estA
mer
ica
Labo
rato
ry, B
urlin
gton
, Ver
mon
t; TK
N, t
otal
Kje
ldah
l nitr
ogen
; TP,
tota
l pho
spho
rus;
TPH
-DR
O, t
otal
pet
role
um h
ydro
carb
ons–
dies
el ra
nge
orga
nics
; TPH
-GR
O, t
otal
pet
role
um h
ydro
carb
ons–
gaso
line
rang
e or
gani
cs; U
SEPA
, U.S
. Env
ironm
enta
l Pro
tect
ion
Age
ncy;
USG
S, U
.S. G
eolo
gica
l Sur
vey;
VO
A, v
olat
ile o
rgan
ic a
naly
ses;
VO
C, v
olat
ile o
rgan
ic c
ompo
unds
; 1x,
one
of (
or 2
x m
eans
two
of, e
tc.)
the
type
of
cont
aine
r tha
t fol
low
s; ºC
, deg
rees
Cel
sius
; <, l
ess t
han;
µm
, mic
rom
eter
]
Sam
ple
colle
cted
Ana
lyte
sLa
bM
etho
d
(cod
e or
sch
edul
e)Co
ntai
ner,
pres
erva
tion,
an
d ha
ndlin
gCi
tatio
ns
Pre-
land
fall
Trac
e el
emen
ts, m
ajor
ions
USG
S N
WQ
LIC
P-O
ES &
ICP-
MS
(I
-447
1-97
, I-4
020-
05,
& I-
4472
-97)
Met
hod
2130
1x 1
25-m
L po
ly, a
cid-
rinse
d (F
A)
Gar
barin
o an
d St
uzes
ki (1
998)
; Gar
barin
o (1
999)
; Gar
barin
o an
d ot
hers
(200
6)
Post
-land
fall
Trac
e el
emen
ts, m
ajor
ions
TAL-
FLIC
P (6
010B
)U
se p
re-c
lean
ed, b
lank
ed R
A b
ottle
to
colle
ct d
ip sa
mpl
e an
d fil
l aci
difie
d 1x
25
0-m
L po
ly b
ottle
. Lea
ve h
eads
pace
. Pr
eser
ve to
pH
<2 w
ith H
NO
3. C
hill
to
4°C
with
out f
reez
ing.
Shi
p ov
erni
ght
USE
PA (1
986)
, Met
hod
SW-8
46-6
010b
Post
-land
fall
Mer
cury
TAL-
FLC
VAA
(EPA
747
0A)
Use
pre
-cle
aned
250
-mL
glas
s bot
tle,
acid
ify c
olle
cted
sam
ple
with
2 m
L
of 6
nor
mal
hyd
roch
loric
aci
d.
USE
PA (1
986)
, Met
hod
SW-8
46-7
470a
Pre-
land
fall
Nut
rient
sU
SGS
NW
QL
Met
hod
IDs:
I-46
50-0
3,
I-45
22-8
5, I-
4515
-91,
I-
4610
-01.
1x 1
25-m
L po
ly. A
dd H
2SO
4. C
hill
to
4°C
Fish
man
and
Frie
dman
(198
9); P
atto
n an
d K
rysk
alla
(200
3); P
atto
n an
d Tr
uitt
(199
2, 2
000)
Po
st-la
ndfa
llN
utrie
nts
TAL-
FLC
olor
imet
ry (3
50.1
, 36
5.1,
365
.4)
Use
pre
-cle
aned
, bla
nked
RA
bot
tle to
co
llect
dip
sam
ple
and
fill a
cidi
fied
1x 2
50-m
L br
own
poly
bot
tle. L
eave
he
adsp
ace.
Pre
serv
e to
pH
<2 w
ith
H2S
O4.
Chi
ll to
4°C
with
out f
reez
ing.
Sh
ip o
vern
ight
USE
PA (2
012)
Pre-
and
pos
t- la
ndfa
llD
isso
lved
org
anic
car
bon
USG
S O
CR
LA
bsor
banc
e an
d flu
ores
cenc
e sp
ectro
scop
y
1x 1
25-m
L fir
ed g
lass
. Filt
er a
t lab
orat
ory.
C
hill
to 4
°C w
ithou
t fre
ezin
gW
ilde
and
Skro
bial
owsk
i (20
11),
ap
pend
ix C
-1

Methods 9
phenols, carboxylic acids, and ketones (Operational Science Advisory Team, 2011). Intermediate molecular-weight components can float and disperse in water, form emulsions, or sorb to sediment; the viscous, heavy components can form solid aggregates, or tarballs, that float or sink in water or sorb to sediment (American Petroleum Institute, 2003). Meanwhile, oil molecules are subject to microbial degradation at rates depending on the complexity of the oil molecules; degree of dispersion; environmental factors, such as temperature, oxygen, and nutrient concentrations; and the species and abundance of microbial organisms (Operational Science Advisory Team, 2011). The result is “weathered” crude oil that has a different composition from the oil originally released. A sample of weathered M-1 oil collected on April 27, 2010, was determined to contain aliphatic and cyclic hydrocarbons of, or greater than, C14—that is, with 14 or more carbon atoms. Benzene, toluene, ethylbenzene, xylene and related volatile (BTEX) compounds were not detected (State of Florida Oil Spill Academic Task Force, 2010). One goal of the nearshore sampling and chemical analysis was to characterize the weathering and shoreline degradation of the oil (Unified Area Command, 2010).
In the present study, contaminant classes determined in water and whole sediment included various organic compounds, trace and major elements, nutrients, and organic carbon. Trace and major elements, nutrients, and carbon also were analyzed in the fine sediment fraction, which is also called the silt-clay fraction, defined as less than 63-micrometer (µm) in size. As noted previously, there were changes in target analytes and analytical methods between the pre-landfall and post-landfall sampling periods. In September 2010, the Operational Science Advisory Team (2010, appendix F) recommended that future sample analyses in water and sediment include 43 PAH analytes, other organic compounds required for comparison to USEPA benchmarks for PAH mixtures, and metals. In the case of PAHs, this represented an expanded analyte list, and a change in the analytical method was made. For PAHs in sediment, pre-landfall samples were subsequently reanalyzed by using the updated analytical method. The analytical methods and laboratories that carried out the analyses are listed by analyte type in table 2 for water samples, and in table 3 for sediment samples, and are described briefly in the following sections. More detail is provided in the publications cited in tables 2 and 3. Analytical reporting levels are summarized in appendix 1.
WaterOrganic contaminants analyzed in water included volatile
organic compounds (VOC), PAHs and other semivolatile organic compounds (SVOC), dissolved organic carbon (DOC), gasoline-range organics having 6 to 10 carbon atoms, diesel-range organics having 10 to 28 carbon atoms,
and oil and grease (table 2). Most organic contaminants were determined by using gas chromatography with mass spectrometry (GC/MS). Most analyses were carried out at either the USGS National Water Quality Laboratory (NWQL) in Denver, Colorado, or the TestAmerica Laboratory in Pensacola, Florida (table 2), except for DOC, which was determined at the USGS Organic Carbon Research Laboratory (OCRL) in Boulder, Colorado.
Trace and major elements and nutrients were determined in water by various methods, including cold vapor atomic absorption spectrometry for mercury, and inductively coupled plasma-optical emission spectrometry (ICP-OES) or inductively coupled plasma-mass spectrometry (ICP-MS) for other trace elements (table 2). Analyses of water samples were carried out at either the USGS NWQL or the TestAmerica Laboratory in Florida (table 2). If water samples had high specific conductance (for example, greater than 2,000 microsiemens per centimeter) or high dissolved total solids, they were diluted prior to analysis by ICP-OES or ICP-MS methods for operational purposes and to approximate the matrices of the standards used to calibrate the instruments. High-salinity samples can cause an accumulation of solids in the sample-introduction system on ICP-OES and ICP-MS instruments, thereby compromising sensitivity (and therefore detection capability), accuracy, and precision (Tedmund M. Struzeski, Chemist, U.S. Geological Survey, Denver, Colo., written comm., Nov. 8, 2011).
References for the analytical methods that were used are cited in table 2, and individual analytes and their reporting levels in water are listed in appendix tables 1-1 and 1-3.
SedimentContaminants determined in whole, unsieved sediments
included PAHs, alkylated PAH groups, other SVOCs, oil and grease, trace and major elements, nutrients, and carbon (table 3). Oil and grease in sediment was analyzed by the TestAmerica Laboratory in Arvada, Colorado, for pre-landfall samples and the TestAmerica Laboratory in Florida for post-landfall samples (table 3). PAHs in sediment were analyzed by GC/MS at the USGS NWQL for pre-landfall samples and the TestAmerica Laboratory in Florida for post-landfall samples. In addition, both pre-landfall and post-landfall samples were analyzed for PAHs and alkylated PAH groups at the TestAmerica Laboratory in Burlington, Vermont, by using GC/MS in the selective ion monitoring mode (SIM). Because the GC/MS SIM mode resulted in lower method detection limits (MDL), analytical results from the GC/MS SIM method were given precedence over results obtained by using GC/MS when both were available. Pre-landfall sediment samples were frozen for approximately 8 months prior to reanalysis in February 2011 by GC/MS SIM.

10 Contaminants in Water and Sediment Sampled in Response to the Deepwater Horizon Oil Spill Ta
ble
3.
Chem
ical
ana
lysi
s of
sed
imen
t sam
ples
from
the
Deep
wat
er H
orizo
n oi
l spi
ll, G
ulf o
f Mex
ico,
201
0: la
bora
tory
, ana
lytic
al m
etho
ds, a
nd s
ampl
e tre
atm
ent.
[Abb
revi
atio
ns: A
AS,
ato
mic
abs
orpt
ion
spec
trom
etry
; Ag,
silv
er; C
d, c
adm
ium
; CVA
A, c
old
vapo
r ato
mic
abs
orpt
ion;
g, g
ram
; GC
, gas
chr
omat
ogra
phy;
HEM
, hex
ane
extra
ctab
le m
ater
ial;
Hg,
mer
cury
; IC
P, in
duct
ivel
y co
uple
d pl
asm
a; L
, lite
r; LA
B, l
abor
ator
y; M
S, m
ass s
pect
rom
etry
; NW
QL,
USG
S N
atio
nal W
ater
Qua
lity
Labo
rato
ry; O
ES, o
ptic
al e
mis
sion
spec
trom
etry
; oz.
, oun
ce; P
AH
, pol
ycyc
lic
arom
atic
hyd
roca
rbon
; Pb,
lead
; SC
L, S
edim
ent C
hem
istry
Lab
orat
ory,
Atla
nta,
Geo
rgia
; SIM
, sel
ectiv
e io
n m
onito
ring;
SV
OC
, sem
ivol
atile
org
anic
com
poun
d; T
AL-
CO
, Tes
tAm
eric
a La
bora
tory
, Den
ver,
CO
; TA
L-FL
, Tes
tAm
eric
a La
bora
tory
, Pen
saco
la, F
lorid
a; T
AL-
VT,
Tes
tAm
eric
a La
bora
tory
, Bur
lingt
on, V
erm
ont;
TC, t
otal
car
bon;
TIC
, tot
al in
orga
nic
carb
on; T
N, t
otal
nitr
ogen
; TO
C, t
otal
org
anic
car
bon;
TP,
to
tal p
hosp
horu
s; T
S, to
tal s
ulfu
r; U
SEPA
, U.S
. Env
ironm
enta
l Pro
tect
ion
Age
ncy;
USG
S, U
.S. G
eolo
gica
l Sur
vey;
1x,
one
of (
or 2
x m
eans
two
of, e
tc.)
the
type
of c
onta
iner
that
follo
ws;
ºC, d
egre
es C
elsi
us;
<, le
ss th
an; µ
m, m
icro
met
er]
Sam
ple
colle
cted
Ana
lysi
sLa
bM
etho
d
or s
ched
ule
Cont
aine
rCi
tatio
ns
Pre-
land
fall
PAH
and
oth
er S
VO
CN
WQ
LG
C/M
S O
-550
6-06
; sch
edul
es
5506
, 550
710
0 g.
in 1
x 1-
L w
ide-
mou
th g
lass
. C
hill
to 4
°CZa
ugg
and
othe
rs (2
006)
PAH
TAL-
VT
GC
/MS
SIM
/isot
ope
dilu
tion
(827
0C S
IM)
Rea
naly
sis o
f fro
zen
sam
ples
(abo
ve)
sent
to N
WQ
LU
SEPA
(198
6),
Met
hod
SW-8
46-8
270c
Post
-land
fall
PAH
and
oth
er S
VO
CTA
L-FL
GC
/MS
(827
0D)
1x 8
-oz.
wid
e-m
outh
gla
ss.
(Sam
ple
com
bine
d w
ith o
il &
gre
ase.
) Chi
ll to
4°C
USE
PA (1
986)
, M
etho
d SW
-846
-827
0d
PAH
TAL-
VT
GC
/MS
SIM
/isot
ope
dilu
tion
(827
0C S
IM)
1x 4
oz.
wid
e m
outh
gla
ss. C
hill
to 4
°CU
SEPA
(198
6),
Met
hod
SW-8
46-8
270c
Pre-
land
fall
Oil
& g
reas
eTA
L-C
O16
64A
-HEM
1x 8
-oz.
wid
e-m
outh
gla
ss.
(Sam
ple
com
bine
d w
ith S
VO
C.)
Chi
ll to
4°C
USE
PA (1
999)
Post
-land
fall
Oil
& g
reas
eTA
L-FL
1664
A-H
EM1x
8-o
z. w
ide-
mou
th g
lass
. (S
ampl
e co
mbi
ned
with
SV
OC
.) C
hill
to 4
°CU
SEPA
(199
9)
Pre-
and
pos
t-lan
dfal
lTr
ace
and
maj
or e
lem
ents
, TN
, TP
, TS,
TO
C, a
nd T
ICU
SGS
SCL
Stro
ng a
cid
dige
stio
n; fl
ame A
AS
(Ag,
Cd,
Pb)
, CVA
A (H
g), o
r IC
P-O
ES (o
ther
trac
e el
emen
ts);
com
bust
ion
(TC
, TN
, TO
C)
2x 1
8-oz
. Whi
rlPak
, who
le se
dim
ents
; 1x
18-
oz. W
hirlP
ak, <
63 µ
m
sedi
men
ts. K
eep
away
from
ligh
t. C
hill
to 4
°C w
ithou
t fre
ezin
g
Hor
owitz
and
Ste
phen
s (2
008)
; Wild
e an
d Sk
robi
alow
ski (
2011
), A
ppen
dix
C-5
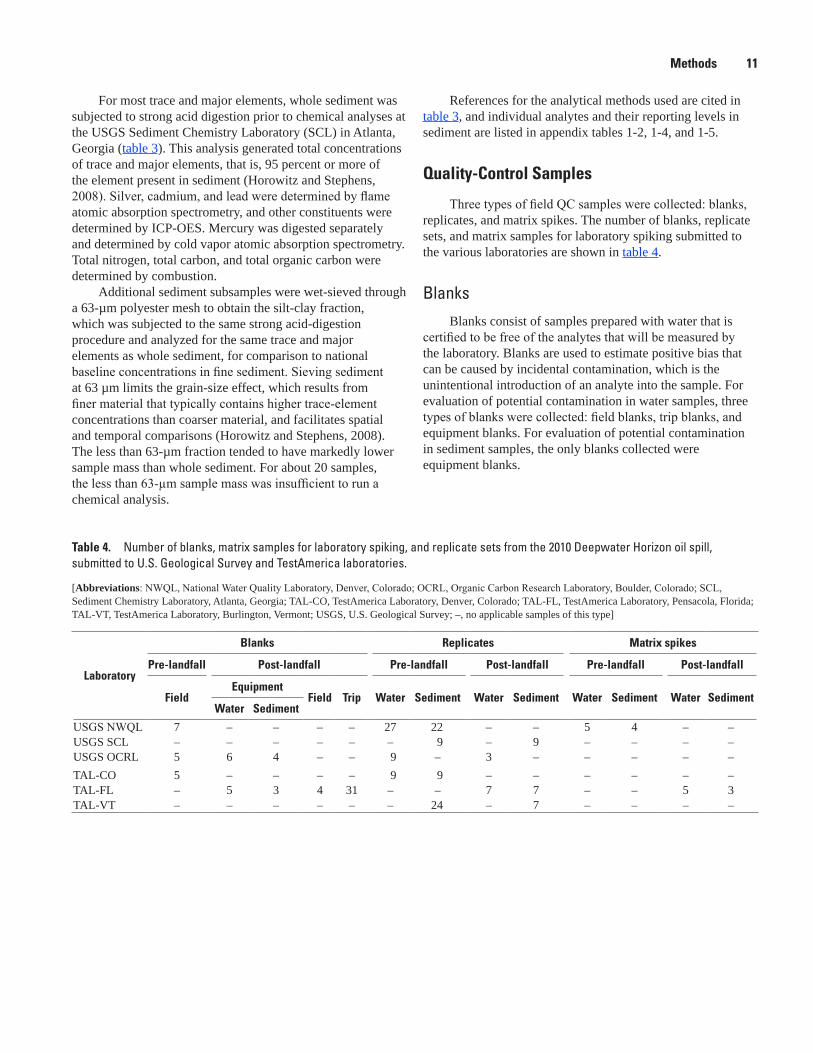
Methods 11
For most trace and major elements, whole sediment was subjected to strong acid digestion prior to chemical analyses at the USGS Sediment Chemistry Laboratory (SCL) in Atlanta, Georgia (table 3). This analysis generated total concentrations of trace and major elements, that is, 95 percent or more of the element present in sediment (Horowitz and Stephens, 2008). Silver, cadmium, and lead were determined by flame atomic absorption spectrometry, and other constituents were determined by ICP-OES. Mercury was digested separately and determined by cold vapor atomic absorption spectrometry. Total nitrogen, total carbon, and total organic carbon were determined by combustion.
Additional sediment subsamples were wet-sieved through a 63-µm polyester mesh to obtain the silt-clay fraction, which was subjected to the same strong acid-digestion procedure and analyzed for the same trace and major elements as whole sediment, for comparison to national baseline concentrations in fine sediment. Sieving sediment at 63 µm limits the grain-size effect, which results from finer material that typically contains higher trace-element concentrations than coarser material, and facilitates spatial and temporal comparisons (Horowitz and Stephens, 2008). The less than 63-µm fraction tended to have markedly lower sample mass than whole sediment. For about 20 samples, the less than 63-µm sample mass was insufficient to run a chemical analysis.
References for the analytical methods used are cited in table 3, and individual analytes and their reporting levels in sediment are listed in appendix tables 1-2, 1-4, and 1-5.
Quality-Control Samples
Three types of field QC samples were collected: blanks, replicates, and matrix spikes. The number of blanks, replicate sets, and matrix samples for laboratory spiking submitted to the various laboratories are shown in table 4.
BlanksBlanks consist of samples prepared with water that is
certified to be free of the analytes that will be measured by the laboratory. Blanks are used to estimate positive bias that can be caused by incidental contamination, which is the unintentional introduction of an analyte into the sample. For evaluation of potential contamination in water samples, three types of blanks were collected: field blanks, trip blanks, and equipment blanks. For evaluation of potential contamination in sediment samples, the only blanks collected were equipment blanks.
Table 4. Number of blanks, matrix samples for laboratory spiking, and replicate sets from the 2010 Deepwater Horizon oil spill, submitted to U.S. Geological Survey and TestAmerica laboratories.
[Abbreviations: NWQL, National Water Quality Laboratory, Denver, Colorado; OCRL, Organic Carbon Research Laboratory, Boulder, Colorado; SCL, Sediment Chemistry Laboratory, Atlanta, Georgia; TAL-CO, TestAmerica Laboratory, Denver, Colorado; TAL-FL, TestAmerica Laboratory, Pensacola, Florida; TAL-VT, TestAmerica Laboratory, Burlington, Vermont; USGS, U.S. Geological Survey; –, no applicable samples of this type]
Laboratory
Blanks Replicates Matrix spikes
Pre-landfall Post-landfall Pre-landfall Post-landfall Pre-landfall Post-landfall
FieldEquipment
Field Trip Water Sediment Water Sediment Water Sediment Water SedimentWater Sediment
USGS NWQL 7 – – – – 27 22 – – 5 4 – –USGS SCL – – – – – – 9 – 9 – – – –USGS OCRL 5 6 4 – – 9 – 3 – – – – –TAL-CO 5 – – – – 9 9 – – – – – –TAL-FL – 5 3 4 31 – – 7 7 – – 5 3TAL-VT – – – – – – 24 – 7 – – – –

12 Contaminants in Water and Sediment Sampled in Response to the Deepwater Horizon Oil Spill
Field blanks were prepared by pouring blank water directly into sample bottles under ambient conditions at field sites. These are “field” blanks because they were prepared in the field by the same procedure used to collect environmental samples. In general, they did not contact any sampling equipment other than the sample bottles. In Wilde and Skrobialowski (2011), they are called “ambient” blanks because they were exposed to the atmosphere. Blanks and environmental samples for DOC and total nitrogen collected during the pre-landfall period were pumped from a collection bottle through a filter into a sample bottle. Field blanks enable the assessment of potential contamination of environmental water samples during sample preparation. Sources of contamination are not necessarily the same for pre-landfall and post-landfall samples, however, because (1) conditions could vary from one sampling period to the next and (2) pre-landfall samples and post-landfall samples were not analyzed at the same time and, in some cases, were analyzed by different laboratories (tables 2 and 4). Thus, pre-landfall field blanks should be compared only to pre-landfall water samples, and post-landfall field blanks compared only to post-landfall water samples.
Trip blanks were prepared at the TestAmerica Laboratory in Florida during the post-landfall period. These blanks were shipped to USGS offices, transported to field sites during sampling trips, and returned to the laboratory with environmental samples. Trip blanks generally are prepared only for VOCs and are used to evaluate whether environmental samples were contaminated during sample transport and analysis. Absence of detectable contaminants in a trip blank indicates there is no evidence that environmental samples were contaminated during transport and processing, but does not necessarily rule out contamination from other sources, such as ambient conditions at the site.
Equipment blanks were prepared in USGS offices by pumping blank water through water-sampling equipment, or by pouring blank water over sediment-sampling equipment, and collecting the rinsate in sample bottles. Blanks prepared by using water-sampling equipment are useful in this study only for comparison to environmental samples that were pumped through a filter—that is, pre-landfall samples analyzed for organic carbon and total nitrogen. Even for these analytes, the field blanks provide a more useful comparison than equipment blanks because they more completely represent potential sources of contamination. For sediment, equipment rinsate blanks were intended to indicate the potential for incidental contamination of environmental sediment samples from collection equipment and containers. Blank-water rinsate can be assumed to pick up contaminants that are removed easily from the sampling equipment, but it
might not represent certain processes, such as abrasion, that can occur during sediment-sample collection. Also, laboratory analysis of the blanks is done by using methods for water, rather than methods for sediment, and the potential sources of contamination during sample processing and laboratory analysis are not exactly the same for water as for sediment.
Data from blank samples can be used to estimate the potential for contamination in environmental samples in excess of concentrations that actually occur in the sampled matrix, which in this study is water or sediment. If a representative blank can be associated with each environmental sample, analytical results for the blanks can be used to qualify results for the environmental samples (U.S. Environmental Protection Agency, 1989, pages 16–17 in chapter 5). If the blank contains detectable levels of an analyte, concentrations of that analyte in the associated environmental samples should be censored unless they exceed five times the amount in the blank or, if the analyte is considered a common laboratory contaminant (such as acetone), ten times the amount in the blank.
Field ReplicatesField replicates are two or more environmental samples
that are collected and prepared such that they are considered to be essentially identical in composition. Replicates are used to estimate variability of the analytical result. In this study, replicate water samples were collected sequentially by filling one set of sample bottles, followed immediately by filling a second, third, and, in some cases, a fourth set of bottles. Replicate sediment samples were collected by compositing a large amount of material in a single container. This material was homogenized, and replicate subsamples were scooped into separate sample containers.
Statistical evaluation of replicate variability is based on the standard deviation of measured values in the primary environmental sample and the replicate sample, or samples. For many analytes, variability is correlated with the mean concentration of that analyte in the replicates (Martin, 2002; Mueller and Titus, 2005). Within a range of low concentrations, standard deviation of replicates generally is uniform, but at higher concentrations, standard deviation tends to increase in proportion to concentration. Within this higher range, the relative standard deviation (RSD), defined as the standard deviation of replicate results divided by the mean concentration, is generally uniform. Therefore, over the low-concentration range, variability is estimated as the average standard deviation of replicates; over the high-concentration range, variability is estimated as the average RSD.
Methods 13
Typically, replicate variability is similar to the analytic error of laboratory methods, having RSDs ranging from a few percent to around 10 percent. If variability is substantially higher than this range, it could interfere with certain types of data interpretation. For example, high variability adds uncertainty when comparing data to a standard or benchmark. Also, it can reduce the likelihood of finding statistically significant differences in comparisons among groups of data over time or space. Variability is less likely to affect the central tendency (for example, the mean and median) of data distributions, but can increase the spread and range.
Matrix SpikesMatrix spikes are samples fortified, or “spiked,” with
known concentrations of analytes that will be measured by the laboratory. Spikes are used to estimate positive or negative bias in the analytical result caused by matrix effects—that is, chemical, physical, or biological characteristics of the sample material (water or sediment itself) that can interfere with chemical analysis of the sample. Matrix spike samples were collected in the same manner as field replicates; subsequently, these samples were spiked in the laboratory to introduce a known amount of the analytes of interest.
Method performance is determined by spike recovery, which is the measured amount of analyte expressed as a percentage of the known spiked amount. Recovery is calculated from analyte concentrations in the spiked sample compared to a replicate environmental sample that was not spiked. Recovery can be poorly estimated if the analyte concentration in the background environmental sample is similar to, or greater than, the expected concentration of the spiked addition.
Generally, recovery is within a few percent of 100 for analytes that are not affected by method or sample-matrix interferences, though the acceptable range can extend to within 10 to 20 percent for some analytes. Poor recovery is more typically low, rather than high. For constituents with chronically poor recovery, some aspects of data interpretation require qualification; for example, the detection frequency and the likelihood of exceeding a standard or benchmark can be underestimated.
Spikes are used most often for organic compounds because the analytical methods involve extraction and analysis steps that can be affected by other chemicals in the sample. For example, naturally occurring organic matter can be co-extracted with anthropogenic organic compounds in a sample and interfere with GC analysis.
Laboratory Quality-Control ProceduresLaboratory QC procedures include analysis of reagent
blanks (also called method blanks), spikes, standard reference materials, and surrogate compounds. Each laboratory has its own QC procedures and analyses in order to assess the quality of the data and meet performance standards. It is beyond the scope of this report to describe the laboratory QC sampling, except in one regard—where contamination was detected in reagent blanks, this information was considered in data analysis for this report. Laboratory reagent blanks are processed and analyzed along with each set of environmental samples and are used to monitor for incidental contamination introduced during sample processing and analysis at the laboratory.
Water- and Sediment-Quality Benchmarks
Concentrations of trace and major elements and organic contaminants were compared to various benchmarks to assess the potential for adverse effects on human health or aquatic life. Benchmark comparisons were made for all available samples, including field replicate samples and samples from sites sampled in only one study period, to maximize the information gained from the dataset regarding benchmark exceedance at the sampled sites.
Contaminant concentrations in water were compared to benchmarks for protection of human health and aquatic life, whereas concentrations in whole sediment were compared to sediment-quality benchmarks for protection of benthic organisms. The benchmarks used were those recommended by the U.S. Environmental Protection Agency (2010, 2011a, and 2011b) on its web site, “EPA Response to BP Spill in the Gulf of Mexico, Coastal Water Sampling” (U.S. Environmental Protection Agency, 2011c), supplemented by screening-level benchmarks from the NOAA Office of Response and Restoration (Buchman, 2008). In addition, trace- and major-element and nutrient concentrations in the less than 63-µm sediment fraction were compared to national baseline concentrations in bed sediments of U.S. rivers from Horowitz and Stephens (2008).
Benchmark values are listed for organic contaminants in table 5 and for trace and major elements in table 6. Table 6D lists baseline concentrations for trace and major elements and nutrients in the less than 63-µm sediment fraction.
14 Contaminants in Water and Sediment Sampled in Response to the Deepwater Horizon Oil Spill
Human-Health Benchmarks for WaterHuman-health benchmarks are based on potential cancer
and non-cancer risks associated with recreational exposure to oil-contaminated water. They were developed by U.S. Environmental Protection Agency (2010) in coordination with the U.S. Department of Health and Human Services. These benchmarks consider both skin contact and incidental ingestion of water by a child swimmer, assuming 90 hours of exposure. Human-health benchmark values are available for five VOCs, six PAHs, and two trace elements—nickel and vanadium—in water (tables 5C and 6B).
Aquatic-Life Benchmarks for WaterFor water samples, potential toxicity to aquatic life
was assessed by comparison to two types of benchmarks: (1) a toxic-unit (TU) approach for mixtures of PAHs and BTEX compounds (table 5A) and (2) marine benchmarks for individual contaminants (tables 5B and 6A).
Toxic-Unit Benchmarks for PAH-BTEX Mixtures in WaterBecause PAHs and BTEX compounds share a common
mechanism of action, toxicity is expected to be additive. A toxic-unit approach is used, therefore, in which the concentration of each component (i) of the mixture is divided by a potency factor to determine its toxic-unit concentration (TUi). The TUi values for all components in the mixture are summed and the sum (∑TUi) is compared to a hazard index of 1 (U.S. Environmental Protection Agency, 2011a). Separate TU computations are made for acute and chronic toxicity by using acute and chronic potency factors, respectively (table 5A). Because alkylated PAHs (for example, C1- and C2-alkylated naphthalenes) tend to have comparable or greater toxicity to aquatic life than parent PAHs (for example, naphthalene itself), it is important to include alkylated PAHs in TU calculations. Because alkylated PAHs were not measured in water in this study, concentrations of alkylated PAHs were estimated from parent PAHs by using appropriate alkylation multipliers, as recommended by USEPA (Mount, 2010). USEPA developed these multipliers by using the analysis of a tarball that was collected at Dauphin Island during the current oil spill and checked them against oil composition data from other sources, including the Exxon Valdez oil. Because the present study did not analyze 2 of the 18 parent PAHs that should be included in the ∑TUi value for water—benzo(e)pyrene and perylene—these two compounds were omitted from ∑TUi calculations, which therefore could be biased low.
An acute or chronic ∑TUi value greater than 1 indicates that the sample has the potential to cause an acute or chronic effect, respectively, on aquatic organisms such as fish, crabs,
and clams. The PAHs and BTEX contaminants included in the ∑TUi calculations for water are provided in table 5A, along with their acute and chronic potency factors and alkylation multipliers.
Marine BenchmarksMarine benchmarks for acute or chronic exposure to
individual contaminants are available from various sources for many organic contaminants (table 5B) and trace elements (table 6A). These values were obtained from Buchman (2008), who compiled acute and chronic marine benchmarks from multiple sources. Most values were from the USEPA, such as ambient water-quality criteria and Tier II Species-Acute Values, which were supplemented by benchmarks from Canada, British Columbia, and New Zealand. As such, individual benchmarks were not necessarily derived the same way, and exceedance of one benchmark can mean something slightly different from exceedance of another, as shown in these examples:
• The USEPA chronic water-quality criterion is the highest concentration of a pollutant that aquatic organisms can be exposed to for an extended period without deleterious effects. The acute water-quality criterion is the highest concentration that aquatic organisms can be exposed to for a short period (1-hour average) without deleterious effects. Both are intended to protect 95 percent of a diverse group of genera and should not be exceeded more than once every 3 years.
• Canadian aquatic-life guidelines are based on toxicity data for the most sensitive species of plants and animals found in Canadian waters; they are intended to protect all forms of aquatic life during all stages of the aquatic life cycles and should not be exceeded at any time (Canadian Council of Ministers of the Environment, 1999).
• The British Columbia guidelines set safe conditions or levels that have province-wide application and are designed to protect marine aquatic life (British Columbia Ministry of Environment, 2010). They are intended to protect all forms of aquatic life and all stages of their life cycle during indefinite exposure (Meays, 2010). If a single guideline is recommended, it represents a long-term no-effect level and should not be exceeded at any time. For some substances, both maximum (acute) and average (chronic) guidelines are recommended; acute guidelines apply in the initial dilution zone, and chronic guidelines apply everywhere else (Meays, 2010). In addition, British Columbia has working guidelines for additional contaminants

Methods 15
that were obtained from various North American jurisdictions, but have not yet been fully assessed by the Ministry of Environment; they represent the best guidance the Ministry can provide about safe levels of these substances in the environment (Nagpal and others, 2006).
• Trigger values from New Zealand are derived by fitting an appropriate statistical distribution to the no-observed-effect-concentration data available for a given contaminant, and estimating a concentration that protects 95 percent of species in the environment (Australian and New Zealand Environment and Conservation Council, 2000).
Organic contaminant
CASRNAcute divisor1
(µg/L)Chronic divisor1
(µg/L)Multiplier2 Analyzed
in this study
Benzene 71-43-2 27,000 5,300 1 YesCyclohexane 110-82-7 1,900 374 1 YesEthylbenzene 100-41-4 4,020 790 1 YesIsopropylbenzene (cumene) 98-82-8 2,140 420 1 YesTotal xylene (o, m and/or p) 108-38-3 3,560 700 1 YesMethylcyclohexane 108-87-2 463 91.0 1 YesToluene 108-88-3 8,140 1,600 1 YesNaphthalene 91-20-3 803 193 120 YesAcenaphthylene 208-96-8 1,280 307 1 YesAcenaphthene 83-32-9 232 55.8 1 YesFluorene 86-73-7 164 39.3 14 YesPhenanthrene 85-01-8 79.7 19.1 6.8 YesAnthracene 120-12-7 86.1 20.7 1 YesFluoranthene 206-44-0 29.6 7.11 1 YesPyrene 129-00-0 42.0 10.1 2.1 YesBenz[a]anthracene 56-55-3 9.28 2.23 1 YesChrysene 218-01-9 8.49 2.04 5 YesPerylene 198-55-0 3.75 0.901 1 NoBenzo[b]fluoranthene 205-99-2 2.82 0.677 1 YesBenzo[k]fluoranthene 207-08-9 2.67 0.642 1 YesBenzo[e]pyrene 192-97-2 3.75 0.901 1 NoBenzo[a]pyrene 50-32-8 3.98 0.957 1 YesIndeno[1,2,3-cd]pyrene 193-39-5 1.14 0.275 1 YesDibenz[a,h]- anthracene 53-70-3 1.17 0.282 1 YesBenzo[g,h,i]perylene 191-24-2 1.83 0.439 1 Yes
1The Toxic Unit (∑TUi) benchmark is computed by dividing the concentration of each individual compound by its potency divisor (acute or chronic), then adding the ratios for all compounds in the sample to calculate the combined toxicity. A ∑TUi benchmark value >1 indicates an exceedance.
2Because alkylated PAHs were not analyzed in water, their concentrations were estimated by applying a multiplier to the parent PAH concentration.
Table 5A. Benchmark values for organic contaminants: toxic-unit benchmarks (∑TUi) for PAH and BTEX compounds in water.
[Abbreviations: BP, British Petroleum; BTEX, benzene, toluene, ethylbenzene, xylenes and related compounds; CASRN, Chemical Abstracts Service Registry Number; PAH, polycyclic aromatic hydrocarbons; TU, toxic unit; µg/L, microgram per liter; >, greater than]
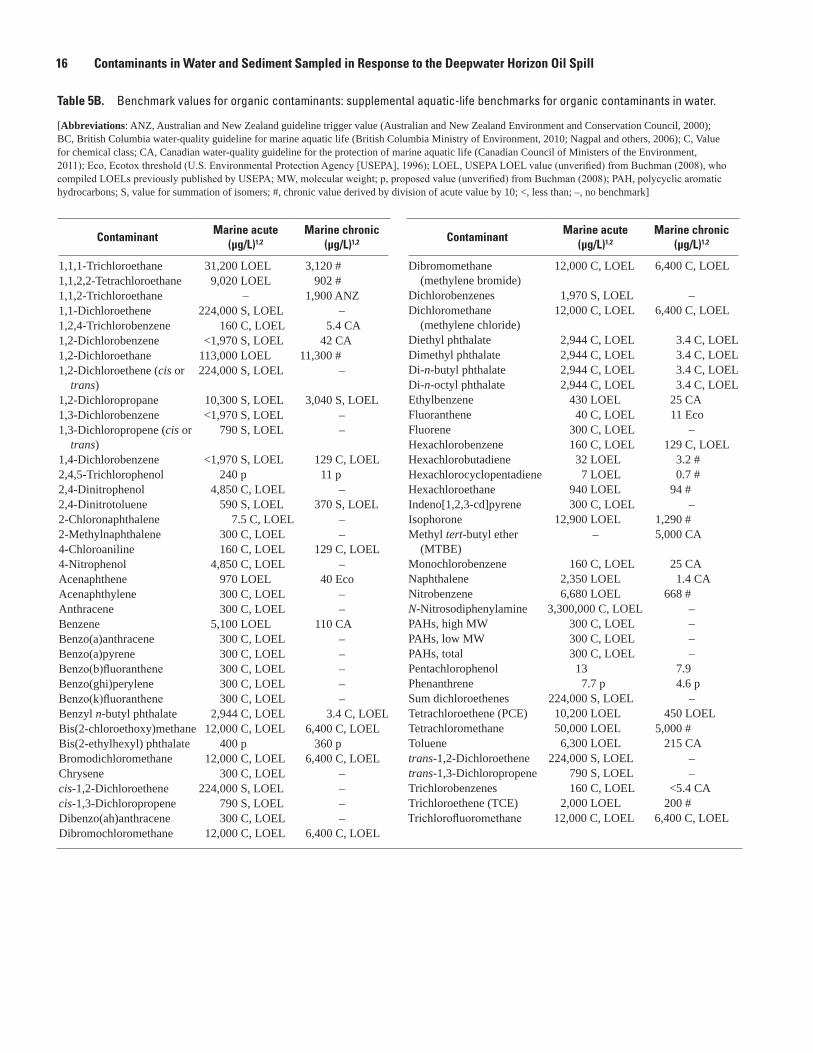
16 Contaminants in Water and Sediment Sampled in Response to the Deepwater Horizon Oil Spill
Table 5B. Benchmark values for organic contaminants: supplemental aquatic-life benchmarks for organic contaminants in water.
[Abbreviations: ANZ, Australian and New Zealand guideline trigger value (Australian and New Zealand Environment and Conservation Council, 2000); BC, British Columbia water-quality guideline for marine aquatic life (British Columbia Ministry of Environment, 2010; Nagpal and others, 2006); C, Value for chemical class; CA, Canadian water-quality guideline for the protection of marine aquatic life (Canadian Council of Ministers of the Environment, 2011); Eco, Ecotox threshold (U.S. Environmental Protection Agency [USEPA], 1996); LOEL, USEPA LOEL value (unverified) from Buchman (2008), who compiled LOELs previously published by USEPA; MW, molecular weight; p, proposed value (unverified) from Buchman (2008); PAH, polycyclic aromatic hydrocarbons; S, value for summation of isomers; #, chronic value derived by division of acute value by 10; <, less than; –, no benchmark]
ContaminantMarine acute
(µg/L)1,2
Marine chronic (µg/L)1,2
1,1,1-Trichloroethane 31,200 LOEL 3,120 #1,1,2,2-Tetrachloroethane 9,020 LOEL 902 #1,1,2-Trichloroethane – 1,900 ANZ1,1-Dichloroethene 224,000 S, LOEL –1,2,4-Trichlorobenzene 160 C, LOEL 5.4 CA1,2-Dichlorobenzene <1,970 S, LOEL 42 CA1,2-Dichloroethane 113,000 LOEL 11,300 #1,2-Dichloroethene (cis or
trans)224,000 S, LOEL –
1,2-Dichloropropane 10,300 S, LOEL 3,040 S, LOEL1,3-Dichlorobenzene <1,970 S, LOEL –1,3-Dichloropropene (cis or
trans)790 S, LOEL –
1,4-Dichlorobenzene <1,970 S, LOEL 129 C, LOEL2,4,5-Trichlorophenol 240 p 11 p2,4-Dinitrophenol 4,850 C, LOEL –2,4-Dinitrotoluene 590 S, LOEL 370 S, LOEL2-Chloronaphthalene 7.5 C, LOEL –2-Methylnaphthalene 300 C, LOEL –4-Chloroaniline 160 C, LOEL 129 C, LOEL4-Nitrophenol 4,850 C, LOEL –Acenaphthene 970 LOEL 40 EcoAcenaphthylene 300 C, LOEL –Anthracene 300 C, LOEL –Benzene 5,100 LOEL 110 CABenzo(a)anthracene 300 C, LOEL –Benzo(a)pyrene 300 C, LOEL –Benzo(b)fluoranthene 300 C, LOEL –Benzo(ghi)perylene 300 C, LOEL –Benzo(k)fluoranthene 300 C, LOEL –Benzyl n-butyl phthalate 2,944 C, LOEL 3.4 C, LOELBis(2-chloroethoxy)methane 12,000 C, LOEL 6,400 C, LOELBis(2-ethylhexyl) phthalate 400 p 360 pBromodichloromethane 12,000 C, LOEL 6,400 C, LOELChrysene 300 C, LOEL –cis-1,2-Dichloroethene 224,000 S, LOEL –cis-1,3-Dichloropropene 790 S, LOEL –Dibenzo(ah)anthracene 300 C, LOEL –Dibromochloromethane 12,000 C, LOEL 6,400 C, LOEL
ContaminantMarine acute
(µg/L)1,2
Marine chronic (µg/L)1,2
Dibromomethane (methylene bromide)
12,000 C, LOEL 6,400 C, LOEL
Dichlorobenzenes 1,970 S, LOEL –Dichloromethane
(methylene chloride)12,000 C, LOEL 6,400 C, LOEL
Diethyl phthalate 2,944 C, LOEL 3.4 C, LOELDimethyl phthalate 2,944 C, LOEL 3.4 C, LOELDi-n-butyl phthalate 2,944 C, LOEL 3.4 C, LOELDi-n-octyl phthalate 2,944 C, LOEL 3.4 C, LOELEthylbenzene 430 LOEL 25 CAFluoranthene 40 C, LOEL 11 EcoFluorene 300 C, LOEL –Hexachlorobenzene 160 C, LOEL 129 C, LOELHexachlorobutadiene 32 LOEL 3.2 #Hexachlorocyclopentadiene 7 LOEL 0.7 #Hexachloroethane 940 LOEL 94 #Indeno[1,2,3-cd]pyrene 300 C, LOEL –Isophorone 12,900 LOEL 1,290 #Methyl tert-butyl ether
(MTBE)– 5,000 CA
Monochlorobenzene 160 C, LOEL 25 CANaphthalene 2,350 LOEL 1.4 CANitrobenzene 6,680 LOEL 668 #N-Nitrosodiphenylamine 3,300,000 C, LOEL –PAHs, high MW 300 C, LOEL –PAHs, low MW 300 C, LOEL –PAHs, total 300 C, LOEL –Pentachlorophenol 13 7.9Phenanthrene 7.7 p 4.6 pSum dichloroethenes 224,000 S, LOEL –Tetrachloroethene (PCE) 10,200 LOEL 450 LOELTetrachloromethane 50,000 LOEL 5,000 #Toluene 6,300 LOEL 215 CAtrans-1,2-Dichloroethene 224,000 S, LOEL –trans-1,3-Dichloropropene 790 S, LOEL –Trichlorobenzenes 160 C, LOEL <5.4 CATrichloroethene (TCE) 2,000 LOEL 200 #Trichlorofluoromethane 12,000 C, LOEL 6,400 C, LOEL
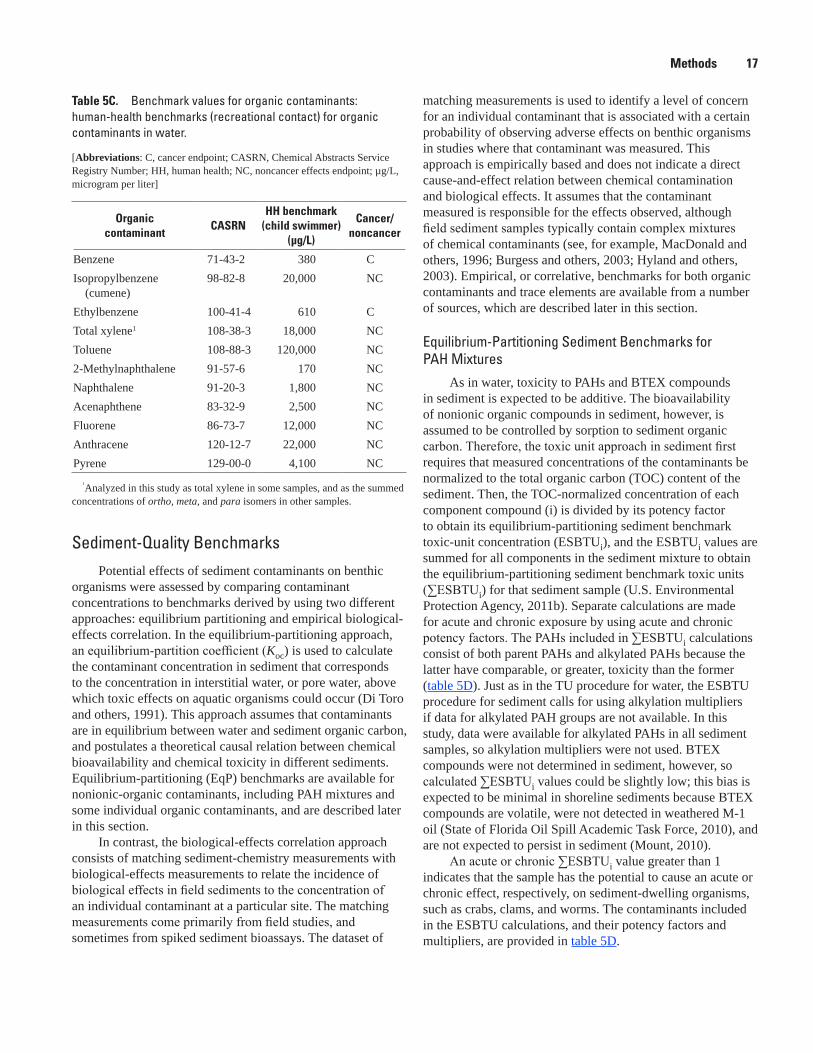
Methods 17
Sediment-Quality BenchmarksPotential effects of sediment contaminants on benthic
organisms were assessed by comparing contaminant concentrations to benchmarks derived by using two different approaches: equilibrium partitioning and empirical biological-effects correlation. In the equilibrium-partitioning approach, an equilibrium-partition coefficient (Koc) is used to calculate the contaminant concentration in sediment that corresponds to the concentration in interstitial water, or pore water, above which toxic effects on aquatic organisms could occur (Di Toro and others, 1991). This approach assumes that contaminants are in equilibrium between water and sediment organic carbon, and postulates a theoretical causal relation between chemical bioavailability and chemical toxicity in different sediments. Equilibrium-partitioning (EqP) benchmarks are available for nonionic-organic contaminants, including PAH mixtures and some individual organic contaminants, and are described later in this section.
In contrast, the biological-effects correlation approach consists of matching sediment-chemistry measurements with biological-effects measurements to relate the incidence of biological effects in field sediments to the concentration of an individual contaminant at a particular site. The matching measurements come primarily from field studies, and sometimes from spiked sediment bioassays. The dataset of
matching measurements is used to identify a level of concern for an individual contaminant that is associated with a certain probability of observing adverse effects on benthic organisms in studies where that contaminant was measured. This approach is empirically based and does not indicate a direct cause-and-effect relation between chemical contamination and biological effects. It assumes that the contaminant measured is responsible for the effects observed, although field sediment samples typically contain complex mixtures of chemical contaminants (see, for example, MacDonald and others, 1996; Burgess and others, 2003; Hyland and others, 2003). Empirical, or correlative, benchmarks for both organic contaminants and trace elements are available from a number of sources, which are described later in this section.
Equilibrium-Partitioning Sediment Benchmarks for PAH Mixtures
As in water, toxicity to PAHs and BTEX compounds in sediment is expected to be additive. The bioavailability of nonionic organic compounds in sediment, however, is assumed to be controlled by sorption to sediment organic carbon. Therefore, the toxic unit approach in sediment first requires that measured concentrations of the contaminants be normalized to the total organic carbon (TOC) content of the sediment. Then, the TOC-normalized concentration of each component compound (i) is divided by its potency factor to obtain its equilibrium-partitioning sediment benchmark toxic-unit concentration (ESBTUi), and the ESBTUi values are summed for all components in the sediment mixture to obtain the equilibrium-partitioning sediment benchmark toxic units (∑ESBTUi) for that sediment sample (U.S. Environmental Protection Agency, 2011b). Separate calculations are made for acute and chronic exposure by using acute and chronic potency factors. The PAHs included in ∑ESBTUi calculations consist of both parent PAHs and alkylated PAHs because the latter have comparable, or greater, toxicity than the former (table 5D). Just as in the TU procedure for water, the ESBTU procedure for sediment calls for using alkylation multipliers if data for alkylated PAH groups are not available. In this study, data were available for alkylated PAHs in all sediment samples, so alkylation multipliers were not used. BTEX compounds were not determined in sediment, however, so calculated ∑ESBTUi values could be slightly low; this bias is expected to be minimal in shoreline sediments because BTEX compounds are volatile, were not detected in weathered M-1 oil (State of Florida Oil Spill Academic Task Force, 2010), and are not expected to persist in sediment (Mount, 2010).
An acute or chronic ∑ESBTUi value greater than 1 indicates that the sample has the potential to cause an acute or chronic effect, respectively, on sediment-dwelling organisms, such as crabs, clams, and worms. The contaminants included in the ESBTU calculations, and their potency factors and multipliers, are provided in table 5D.
Table 5C. Benchmark values for organic contaminants: human-health benchmarks (recreational contact) for organic contaminants in water.
[Abbreviations: C, cancer endpoint; CASRN, Chemical Abstracts Service Registry Number; HH, human health; NC, noncancer effects endpoint; µg/L, microgram per liter]
Organic contaminant
CASRNHH benchmark
(child swimmer)(µg/L)
Cancer/ noncancer
Benzene 71-43-2 380 CIsopropylbenzene
(cumene)98-82-8 20,000 NC
Ethylbenzene 100-41-4 610 CTotal xylene1 108-38-3 18,000 NCToluene 108-88-3 120,000 NC2-Methylnaphthalene 91-57-6 170 NCNaphthalene 91-20-3 1,800 NCAcenaphthene 83-32-9 2,500 NCFluorene 86-73-7 12,000 NCAnthracene 120-12-7 22,000 NCPyrene 129-00-0 4,100 NC
1Analyzed in this study as total xylene in some samples, and as the summed concentrations of ortho, meta, and para isomers in other samples.
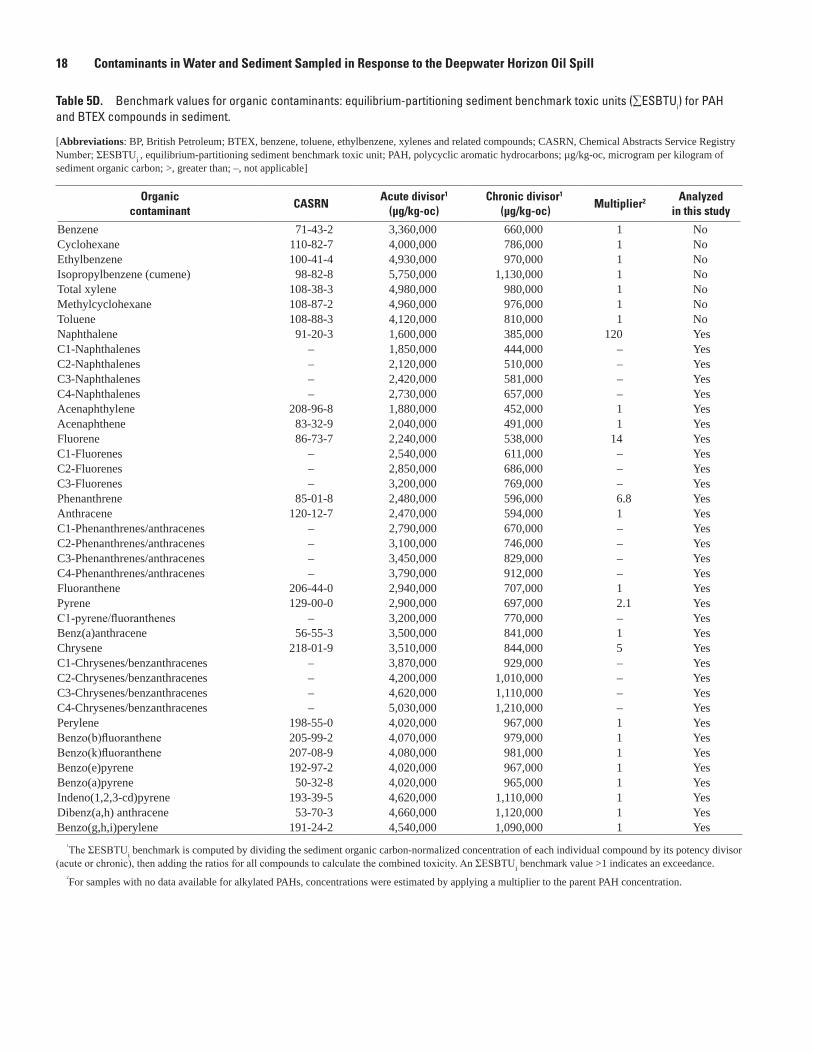
18 Contaminants in Water and Sediment Sampled in Response to the Deepwater Horizon Oil Spill
Table 5D. Benchmark values for organic contaminants: equilibrium-partitioning sediment benchmark toxic units (∑ESBTUi) for PAH and BTEX compounds in sediment.
[Abbreviations: BP, British Petroleum; BTEX, benzene, toluene, ethylbenzene, xylenes and related compounds; CASRN, Chemical Abstracts Service Registry Number; ΣESBTUi , equilibrium-partitioning sediment benchmark toxic unit; PAH, polycyclic aromatic hydrocarbons; µg/kg-oc, microgram per kilogram of sediment organic carbon; >, greater than; –, not applicable]
Organic contaminant
CASRNAcute divisor1
(µg/kg-oc)Chronic divisor1
(µg/kg-oc)Multiplier2 Analyzed
in this study
Benzene 71-43-2 3,360,000 660,000 1 NoCyclohexane 110-82-7 4,000,000 786,000 1 NoEthylbenzene 100-41-4 4,930,000 970,000 1 NoIsopropylbenzene (cumene) 98-82-8 5,750,000 1,130,000 1 NoTotal xylene 108-38-3 4,980,000 980,000 1 NoMethylcyclohexane 108-87-2 4,960,000 976,000 1 NoToluene 108-88-3 4,120,000 810,000 1 NoNaphthalene 91-20-3 1,600,000 385,000 120 YesC1-Naphthalenes – 1,850,000 444,000 – YesC2-Naphthalenes – 2,120,000 510,000 – YesC3-Naphthalenes – 2,420,000 581,000 – YesC4-Naphthalenes – 2,730,000 657,000 – YesAcenaphthylene 208-96-8 1,880,000 452,000 1 YesAcenaphthene 83-32-9 2,040,000 491,000 1 YesFluorene 86-73-7 2,240,000 538,000 14 YesC1-Fluorenes – 2,540,000 611,000 – YesC2-Fluorenes – 2,850,000 686,000 – YesC3-Fluorenes – 3,200,000 769,000 – YesPhenanthrene 85-01-8 2,480,000 596,000 6.8 YesAnthracene 120-12-7 2,470,000 594,000 1 YesC1-Phenanthrenes/anthracenes – 2,790,000 670,000 – YesC2-Phenanthrenes/anthracenes – 3,100,000 746,000 – YesC3-Phenanthrenes/anthracenes – 3,450,000 829,000 – YesC4-Phenanthrenes/anthracenes – 3,790,000 912,000 – YesFluoranthene 206-44-0 2,940,000 707,000 1 YesPyrene 129-00-0 2,900,000 697,000 2.1 YesC1-pyrene/fluoranthenes – 3,200,000 770,000 – YesBenz(a)anthracene 56-55-3 3,500,000 841,000 1 YesChrysene 218-01-9 3,510,000 844,000 5 YesC1-Chrysenes/benzanthracenes – 3,870,000 929,000 – YesC2-Chrysenes/benzanthracenes – 4,200,000 1,010,000 – YesC3-Chrysenes/benzanthracenes – 4,620,000 1,110,000 – YesC4-Chrysenes/benzanthracenes – 5,030,000 1,210,000 – YesPerylene 198-55-0 4,020,000 967,000 1 YesBenzo(b)fluoranthene 205-99-2 4,070,000 979,000 1 YesBenzo(k)fluoranthene 207-08-9 4,080,000 981,000 1 YesBenzo(e)pyrene 192-97-2 4,020,000 967,000 1 YesBenzo(a)pyrene 50-32-8 4,020,000 965,000 1 YesIndeno(1,2,3-cd)pyrene 193-39-5 4,620,000 1,110,000 1 YesDibenz(a,h) anthracene 53-70-3 4,660,000 1,120,000 1 YesBenzo(g,h,i)perylene 191-24-2 4,540,000 1,090,000 1 Yes
1The ΣESBTUi benchmark is computed by dividing the sediment organic carbon-normalized concentration of each individual compound by its potency divisor (acute or chronic), then adding the ratios for all compounds to calculate the combined toxicity. An ΣESBTUi benchmark value >1 indicates an exceedance.
2For samples with no data available for alkylated PAHs, concentrations were estimated by applying a multiplier to the parent PAH concentration.

Methods 19
Equilibrium-Partitioning Sediment Benchmarks for Individual Contaminants
As with the ESBTU approach described previously for PAH-BTEX mixtures, these EqP benchmarks are based on equilibrium-partitioning theory, but they apply to individual contaminants rather than contaminant mixtures. The acute and chronic EqP benchmarks are in units of microgram per gram (µg/g) of sediment TOC, so that measured contaminant concentrations in dry weights must be normalized to sediment TOC prior to comparison with these benchmarks (table 5E). Acute and chronic EqP benchmarks are based on acute or chronic toxicity to aquatic life, respectively, and represent the concentration of chemicals in sediment that are predictive of biological effects, protective of the presence of benthic organisms, and applicable to the range of natural sediments from lakes, streams, estuaries, and near-coastal marine waters (U.S. Environmental Protection Agency, 2008). Exceedance of an individual EqP benchmark indicates that effects can occur if the contaminant in question is bioavailable as predicted by EqP theory; in general, the degree of effect that is expected increases with increasing exceedance of the benchmark (U.S. Environmental Protection Agency, 2008). Individual EqP benchmark values are listed in table 5E.
Empirical Sediment BenchmarksSeveral types of empirical benchmarks have been
developed on the basis of correlations between measured chemical concentrations and observed toxicity in field sediments. As such, they define concentrations in sediments that are associated with certain types and levels of toxicity. These benchmarks typically come in pairs: lower screening values define concentrations below which adverse effects are not expected and upper screening values define concentrations above which adverse effects are likely or frequent. Four such pairs of sediment benchmarks are listed; benchmark types and values are shown in tables 5E and 6C. In this study, two supplementary benchmarks—Washington State’s apparent effect threshold (AET; tables 5E and 6C) and the USEPA’s EqP benchmark (table 5E)—are grouped with upper screening values because they indicate concentrations above which toxicity is likely.
• Apparent Effect Threshold. These values are based on matching sediment chemistry and toxicity data from Puget Sound. The AET is the concentration of an individual contaminant above which a particular adverse biological effect is always expected (Barrick and others, 1988). Different types of AETs represent different indicators of toxicity, including amphipod mortality, benthic abundance, Microtox, and oyster larval development. For a given contaminant, the AET value shown in table 5E or 6C represents the lowest available AET value, as determined by Buchman (2008). Because of its definition, the AET was considered an upper screening value in this study.
• Effects-Range Low and Effects-Range Median. These were derived from matching sediment chemistry and toxicity data. The effects range-low (ERL) corresponds to the lower 10th percentile of the matched data for a given contaminant and represents the contaminant concentration below which effects are rarely observed. The effects range-median (ERM) corresponds to the 50th percentile of the matched data and represents the contaminant concentration above which adverse effects frequently occur (Long and Morgan, 1991).
• Threshold Effect Level and Probable Effect Level. The Canadian threshold effect level (TEL) defines a concentration below which adverse effects are rarely anticipated and above which adverse effects are occasionally anticipated, whereas the probable effect level (PEL) defines a concentration above which adverse effects are frequently anticipated. Both the Canadian TEL and PEL are empirically based and were derived by compiling data from multiple types of studies in the literature, including equilibrium partitioning studies, guidelines from other jurisdictions, spiked-sediment toxicity tests, and field studies from throughout North America (Canadian Council of Ministers of the Environment, 1995 and 2001). The TEL and PEL values for a given contaminant were selected so that fewer than 25 percent of adverse effects occur below the TEL and more than 50 percent of adverse effects occur above the PEL (Canadian Council of Ministers of the Environment, 2001).
• Threshold Effect Concentration and Probable Effect Concentration. The consensus-based threshold effect concentration (TEC) from MacDonald and others (2000) defines the concentration below which adverse effects on sediment-dwelling organisms are not expected to occur. The consensus-based probable effect concentration (PEC) defines the concentration of sediment-associated contaminants above which adverse effects on sediment-dwelling organisms are likely to be observed. These guidelines were developed by compiling multiple sediment-quality guidelines for a given contaminant, including both causally and empirically based guidelines, identifying those that meet certain selection criteria, and selecting the geometric mean as the consensus-based guideline.
• T20 and T50. These were derived from logistic regression models that predict the probability of toxicity to marine amphipods by using a large database of matching sediment chemistry and toxicity data representing coastal North America (Field and others, 2002). The T20 and T50 for an individual contaminant consist of concentrations of that contaminant that are associated with a 20 percent or 50 percent probability, respectively, of observing toxicity.
20 Contaminants in Water and Sediment Sampled in Response to the Deepwater Horizon Oil Spill Ta
ble
5E.
Benc
hmar
k va
lues
for o
rgan
ic c
onta
min
ants
: sup
plem
enta
l aqu
atic
-life
ben
chm
arks
for o
rgan
ic c
onta
min
ants
in s
edim
ent. —
Cont
inue
d
[Abb
revi
atio
ns: A
ET, a
ppar
ent e
ffect
s thr
esho
ld; B
, biv
alve
; E, e
chin
oder
m la
rvae
; EqP
, equ
ilibr
ium
par
titio
ning
sedi
men
t ben
chm
ark;
ER
L, e
ffect
s ran
ge–l
ow; E
RM
, effe
cts r
ange
–med
ian;
I, in
faun
al
com
mun
ity in
dex;
L, l
arva
e; M
, mic
roto
x as
say;
N, n
eant
hes b
ioas
say;
NO
AA
, Nat
iona
l Oce
anic
and
Atm
osph
eric
Adm
inis
tratio
n; O
, oys
ter l
arva
e; P
EC, p
roba
ble
effe
ct c
once
ntra
tion;
PEL
, pro
babl
e ef
fect
le
vel;
SV, s
cree
ning
val
ue; T
20, c
hem
ical
con
cent
ratio
n co
rres
pond
ing
to 2
0 pe
rcen
t pro
babi
lity
of to
xici
ty to
mar
ine
amph
ipod
s; T
50, c
hem
ical
con
cent
ratio
n co
rres
pond
ing
to 5
0 pe
rcen
t pro
babi
lity
of
toxi
city
to m
arin
e am
phip
ods;
TEC
, thr
esho
ld e
ffect
con
cent
ratio
n; T
EL, t
hres
hold
effe
cts l
evel
; USE
PA, U
.S. E
nviro
nmen
tal P
rote
ctio
n A
genc
y; W
A D
OE,
Was
hing
ton
Dep
artm
ent o
f Eco
logy
; wt,
wei
ght;
µg/g
-oc,
mic
rogr
am p
er g
ram
of s
edim
ent o
rgan
ic c
arbo
n; µ
g/kg
, mic
rogr
am p
er k
ilogr
am; –
, no
benc
hmar
k av
aila
ble]
Ben
chm
ark
Type
:Lo
wer
SV1
Upp
er S
V1Lo
wer
SV1
Upp
er S
V1Lo
wer
SV1
Upp
er S
V1Lo
wer
SV1
Upp
er S
V1U
pper
SV1
EqP1
EqP1
Ben
chm
ark
sour
ce:
NO
AA
2N
OA
A2
Cana
da/
Flor
ida3
Cana
da/
Flor
ida3
Mac
Don
ald4
Mac
Don
ald4
Fiel
d5Fi
eld5
WA
DO
E6U
SEPA
7U
SEPA
7
Uni
ts:
µg/k
g
dry
wt
µg/k
g
dry
wt
µg/k
g
dry
wt
µg/k
g
dry
wt
µg/k
g
dry
wt
µg/k
g
dry
wt
µg/k
g
dry
wt
µg/k
g
dry
wt
µg/k
g
dry
wt
µg/g
-oc
µg/g
-oc
Cont
amin
ant/b
ench
mar
k na
me:
ERL,
m
arin
eER
M,
mar
ine
TEL,
m
arin
ePE
L,
mar
ine
TEC
PEC
T20
T50
AET
EqP-
ac
ute
EqP-
ch
roni
c1,
2,4-
Tric
hlor
oben
zene
––
––
––
––
>4.8
E6,
100
920
1-M
ethy
lnap
htha
lene
––
––
––
2194
––
–1-
Met
hylp
hena
nthr
ene
––
––
––
1811
2–
––
2,4,
5-Tr
ichl
orop
heno
l–
––
––
––
–3
I–
–2,
4,6-
Tric
hlor
ophe
nol
––
––
––
––
6 I
––
2,4-
Dic
hlor
ophe
nol
––
––
––
––
0.20
83–
–2,
4-D
imet
hylp
heno
l–
––
––
––
–18
N–
–2-
Chl
orop
heno
l–
––
––
––
–0.
333
––
2-M
ethy
lnap
htha
lene
7067
020
.220
1–
–21
128
64 E
––
4-B
rom
ophe
nyl p
heny
l eth
er–
––
––
––
––
2,30
013
0A
cena
phth
ene
1650
06.
7188
.9–
–19
116
130
E–
–A
cena
phth
ylen
e44
640
5.87
128
––
1414
071
E–
–A
nthr
acen
e85
.31,
100
46.9
245
57.2
845
3429
028
0 E
––
Ben
z(a)
anth
race
ne26
11,
600
74.8
693
108
1,05
061
466
960
E–
–B
enzo
(a)p
yren
e43
01,
600
88.8
763
150
1,45
069
520
1,10
0 E
––
Ben
zo(b
)fluo
rant
hene
––
––
––
130
1,10
71,
800
EI–
–B
enzo
(ghi
)per
ylen
e–
––
––
–67
497
670
M–
–B
enzo
(k)fl
uora
nthe
ne–
––
––
–70
537
1,80
0 EI
––
Ben
zyl n
-but
yl p
htha
late
––
––
––
––
63 M
15,0
001,
100
Bip
heny
l–
––
––
–17
73–
850
110
Bis
(2-e
thyl
hexy
l) ph
thal
ate
––
8 182
8 2,6
47–
––
–1,
300
I–
–C
hrys
ene
384
2,80
010
884
616
61,
290
8265
095
0 E
––
Dib
enzo
(ah)
anth
race
ne63
.426
06.
2213
533
.0–
1911
323
0 O
M–
–D
iben
zofu
ran
––
––
––
––
110
E3,
700
200
Die
thyl
pht
hala
te–
––
––
––
–6
BL
1,10
063
Dim
ethy
l pht
hala
te–
––
––
––
–6
B–
–D
i-n-b
utyl
pht
hala
te–
––
––
––
–58
BL
8,00
01,
100
Di-n
-oct
yl p
htha
late
––
––
––
––
61 B
L–
–Fl
uora
nthe
ne60
05,
100
113
1,49
442
32,
230
119
1,03
41,
300
E–
–Fl
uore
ne19
540
21.2
144
77.4
536
1911
412
0 E
––
Tabl
e 5E
. Be
nchm
ark
valu
es fo
r org
anic
con
tam
inan
ts: s
uppl
emen
tal a
quat
ic-li
fe b
ench
mar
ks fo
r org
anic
con
tam
inan
ts in
sed
imen
t.
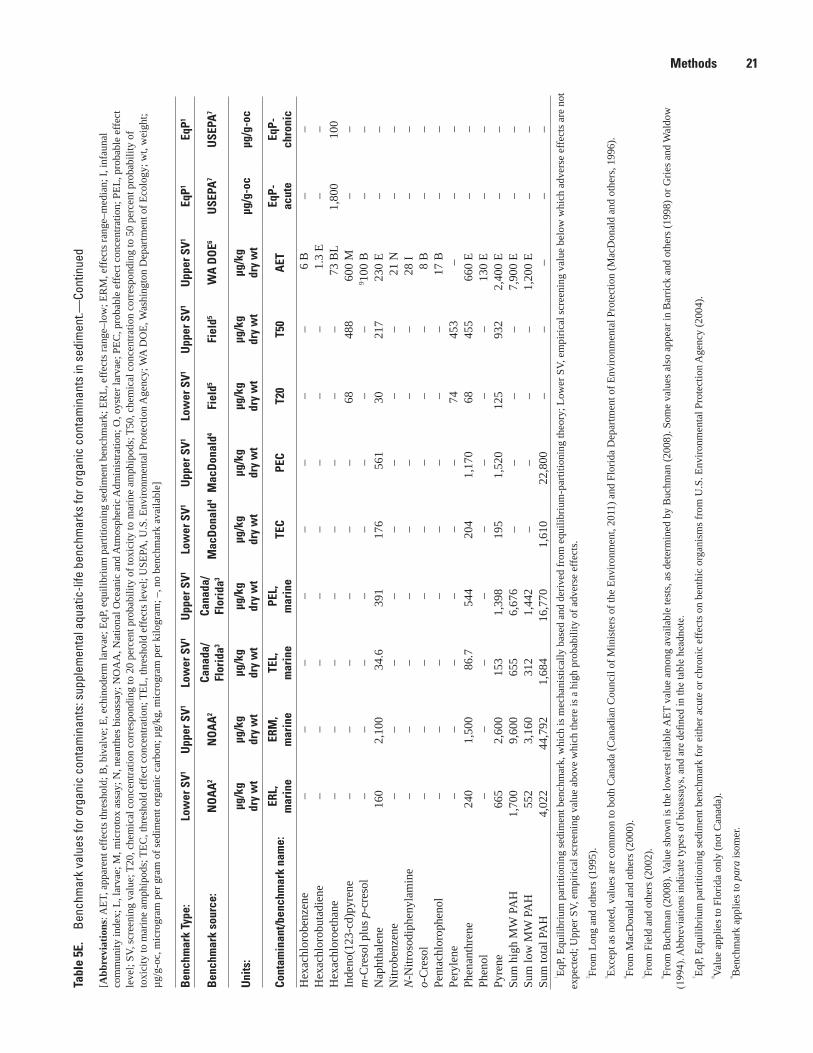
Methods 21Ta
ble
5E.
Benc
hmar
k va
lues
for o
rgan
ic c
onta
min
ants
: sup
plem
enta
l aqu
atic
-life
ben
chm
arks
for o
rgan
ic c
onta
min
ants
in s
edim
ent. —
Cont
inue
d
[Abb
revi
atio
ns: A
ET, a
ppar
ent e
ffect
s thr
esho
ld; B
, biv
alve
; E, e
chin
oder
m la
rvae
; EqP
, equ
ilibr
ium
par
titio
ning
sedi
men
t ben
chm
ark;
ER
L, e
ffect
s ran
ge–l
ow; E
RM
, effe
cts r
ange
–med
ian;
I, in
faun
al
com
mun
ity in
dex;
L, l
arva
e; M
, mic
roto
x as
say;
N, n
eant
hes b
ioas
say;
NO
AA
, Nat
iona
l Oce
anic
and
Atm
osph
eric
Adm
inis
tratio
n; O
, oys
ter l
arva
e; P
EC, p
roba
ble
effe
ct c
once
ntra
tion;
PEL
, pro
babl
e ef
fect
le
vel;
SV, s
cree
ning
val
ue; T
20, c
hem
ical
con
cent
ratio
n co
rres
pond
ing
to 2
0 pe
rcen
t pro
babi
lity
of to
xici
ty to
mar
ine
amph
ipod
s; T
50, c
hem
ical
con
cent
ratio
n co
rres
pond
ing
to 5
0 pe
rcen
t pro
babi
lity
of
toxi
city
to m
arin
e am
phip
ods;
TEC
, thr
esho
ld e
ffect
con
cent
ratio
n; T
EL, t
hres
hold
effe
cts l
evel
; USE
PA, U
.S. E
nviro
nmen
tal P
rote
ctio
n A
genc
y; W
A D
OE,
Was
hing
ton
Dep
artm
ent o
f Eco
logy
; wt,
wei
ght;
µg/g
-oc,
mic
rogr
am p
er g
ram
of s
edim
ent o
rgan
ic c
arbo
n; µ
g/kg
, mic
rogr
am p
er k
ilogr
am; –
, no
benc
hmar
k av
aila
ble]
Ben
chm
ark
Type
:Lo
wer
SV1
Upp
er S
V1Lo
wer
SV1
Upp
er S
V1Lo
wer
SV1
Upp
er S
V1Lo
wer
SV1
Upp
er S
V1U
pper
SV1
EqP1
EqP1
Ben
chm
ark
sour
ce:
NO
AA
2N
OA
A2
Cana
da/
Flor
ida3
Cana
da/
Flor
ida3
Mac
Don
ald4
Mac
Don
ald4
Fiel
d5Fi
eld5
WA
DO
E6U
SEPA
7U
SEPA
7
Uni
ts:
µg/k
g
dry
wt
µg/k
g
dry
wt
µg/k
g
dry
wt
µg/k
g
dry
wt
µg/k
g
dry
wt
µg/k
g
dry
wt
µg/k
g
dry
wt
µg/k
g
dry
wt
µg/k
g
dry
wt
µg/g
-oc
µg/g
-oc
Cont
amin
ant/b
ench
mar
k na
me:
ERL,
m
arin
eER
M,
mar
ine
TEL,
m
arin
ePE
L,
mar
ine
TEC
PEC
T20
T50
AET
EqP-
ac
ute
EqP-
ch
roni
cH
exac
hlor
oben
zene
––
––
––
––
6 B
––
Hex
achl
orob
utad
iene
––
––
––
––
1.3
E–
–H
exac
hlor
oeth
ane
––
––
––
––
73 B
L1,
800
100
Inde
no(1
23-c
d)py
rene
––
––
––
6848
860
0 M
––
m-C
reso
l plu
s p-c
reso
l–
––
––
––
–9 1
00 B
––
Nap
htha
lene
160
2,10
034
.639
117
656
130
217
230
E–
–N
itrob
enze
ne–
––
––
––
–21
N–
–N
-Nitr
osod
iphe
nyla
min
e–
––
––
––
–28
I–
–o-
Cre
sol
––
––
––
––
8 B
––
Pent
achl
orop
heno
l–
––
––
––
–17
B–
–Pe
ryle
ne–
––
––
–74
453
––
–Ph
enan
thre
ne24
01,
500
86.7
544
204
1,17
068
455
660
E–
–Ph
enol
––
––
––
––
130
E–
–Py
rene
665
2,60
015
31,
398
195
1,52
012
593
22,
400
E–
–Su
m h
igh
MW
PA
H1,
700
9,60
065
56,
676
––
––
7,90
0 E
––
Sum
low
MW
PA
H55
23,
160
312
1,44
2–
––
–1,
200
E–
–Su
m to
tal P
AH
4,02
244
,792
1,68
416
,770
1,61
022
,800
––
––
–1 Eq
P, E
quili
briu
m p
artit
ioni
ng se
dim
ent b
ench
mar
k, w
hich
is m
echa
nist
ical
ly b
ased
and
der
ived
from
equ
ilibr
ium
-par
titio
ning
theo
ry; L
ower
SV,
em
piric
al sc
reen
ing
valu
e be
low
whi
ch a
dver
se e
ffect
s are
not
ex
pect
ed; U
pper
SV,
em
piric
al sc
reen
ing
valu
e ab
ove
whi
ch th
ere
is a
hig
h pr
obab
ility
of a
dver
se e
ffect
s.2 Fr
om L
ong
and
othe
rs (1
995)
. 3 Ex
cept
as n
oted
, val
ues a
re c
omm
on to
bot
h C
anad
a (C
anad
ian
Cou
ncil
of M
inis
ters
of t
he E
nviro
nmen
t, 20
11) a
nd F
lorid
a D
epar
tmen
t of E
nviro
nmen
tal P
rote
ctio
n (M
acD
onal
d an
d ot
hers
, 199
6).
4 From
Mac
Don
ald
and
othe
rs (2
000)
.5 Fr
om F
ield
and
oth
ers (
2002
).6 Fr
om B
uchm
an (2
008)
. Val
ue sh
own
is th
e lo
wes
t rel
iabl
e AET
val
ue a
mon
g av
aila
ble
test
s, as
det
erm
ined
by
Buc
hman
(200
8). S
ome
valu
es a
lso
appe
ar in
Bar
rick
and
othe
rs (1
998)
or G
ries a
nd W
aldo
w
(199
4). A
bbre
viat
ions
indi
cate
type
s of b
ioas
says
, and
are
defi
ned
in th
e ta
ble
head
note
.7 Eq
P, E
quili
briu
m p
artit
ioni
ng se
dim
ent b
ench
mar
k fo
r eith
er a
cute
or c
hron
ic e
ffect
s on
bent
hic
orga
nism
s fro
m U
.S. E
nviro
nmen
tal P
rote
ctio
n A
genc
y (2
004)
.8 Va
lue
appl
ies t
o Fl
orid
a on
ly (n
ot C
anad
a).
9 Ben
chm
ark
appl
ies t
o pa
ra is
omer
.
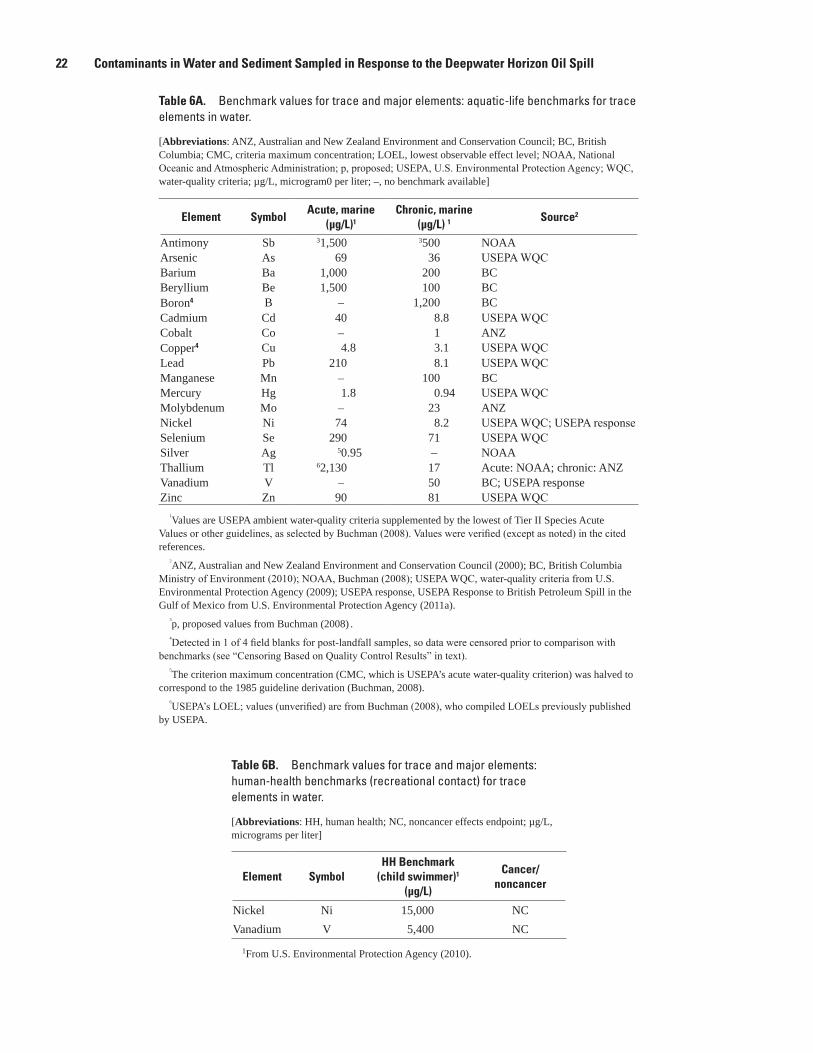
22 Contaminants in Water and Sediment Sampled in Response to the Deepwater Horizon Oil Spill
Table 6A. Benchmark values for trace and major elements: aquatic-life benchmarks for trace elements in water.
[Abbreviations: ANZ, Australian and New Zealand Environment and Conservation Council; BC, British Columbia; CMC, criteria maximum concentration; LOEL, lowest observable effect level; NOAA, National Oceanic and Atmospheric Administration; p, proposed; USEPA, U.S. Environmental Protection Agency; WQC, water-quality criteria; µg/L, microgram0 per liter; –, no benchmark available]
Element SymbolAcute, marine
(µg/L)1
Chronic, marine (µg/L) 1 Source2
Antimony Sb 31,500 3500 NOAAArsenic As 69 36 USEPA WQCBarium Ba 1,000 200 BCBeryllium Be 1,500 100 BCBoron4 B – 1,200 BCCadmium Cd 40 8.8 USEPA WQCCobalt Co – 1 ANZCopper4 Cu 4.8 3.1 USEPA WQCLead Pb 210 8.1 USEPA WQCManganese Mn – 100 BCMercury Hg 1.8 0.94 USEPA WQCMolybdenum Mo – 23 ANZNickel Ni 74 8.2 USEPA WQC; USEPA responseSelenium Se 290 71 USEPA WQCSilver Ag 50.95 – NOAAThallium Tl 62,130 17 Acute: NOAA; chronic: ANZVanadium V – 50 BC; USEPA responseZinc Zn 90 81 USEPA WQC
1Values are USEPA ambient water-quality criteria supplemented by the lowest of Tier II Species Acute Values or other guidelines, as selected by Buchman (2008). Values were verified (except as noted) in the cited references.
2ANZ, Australian and New Zealand Environment and Conservation Council (2000); BC, British Columbia Ministry of Environment (2010); NOAA, Buchman (2008); USEPA WQC, water-quality criteria from U.S. Environmental Protection Agency (2009); USEPA response, USEPA Response to British Petroleum Spill in the Gulf of Mexico from U.S. Environmental Protection Agency (2011a).
3p, proposed values from Buchman (2008) .4Detected in 1 of 4 field blanks for post-landfall samples, so data were censored prior to comparison with
benchmarks (see “Censoring Based on Quality Control Results” in text).5The criterion maximum concentration (CMC, which is USEPA’s acute water-quality criterion) was halved to
correspond to the 1985 guideline derivation (Buchman, 2008).6USEPA’s LOEL; values (unverified) are from Buchman (2008), who compiled LOELs previously published
by USEPA.
Table 6B. Benchmark values for trace and major elements: human-health benchmarks (recreational contact) for trace elements in water.
[Abbreviations: HH, human health; NC, noncancer effects endpoint; µg/L, micrograms per liter]
Element SymbolHH Benchmark
(child swimmer)1
(µg/L)
Cancer/ noncancer
Nickel Ni 15,000 NCVanadium V 5,400 NC
1From U.S. Environmental Protection Agency (2010).
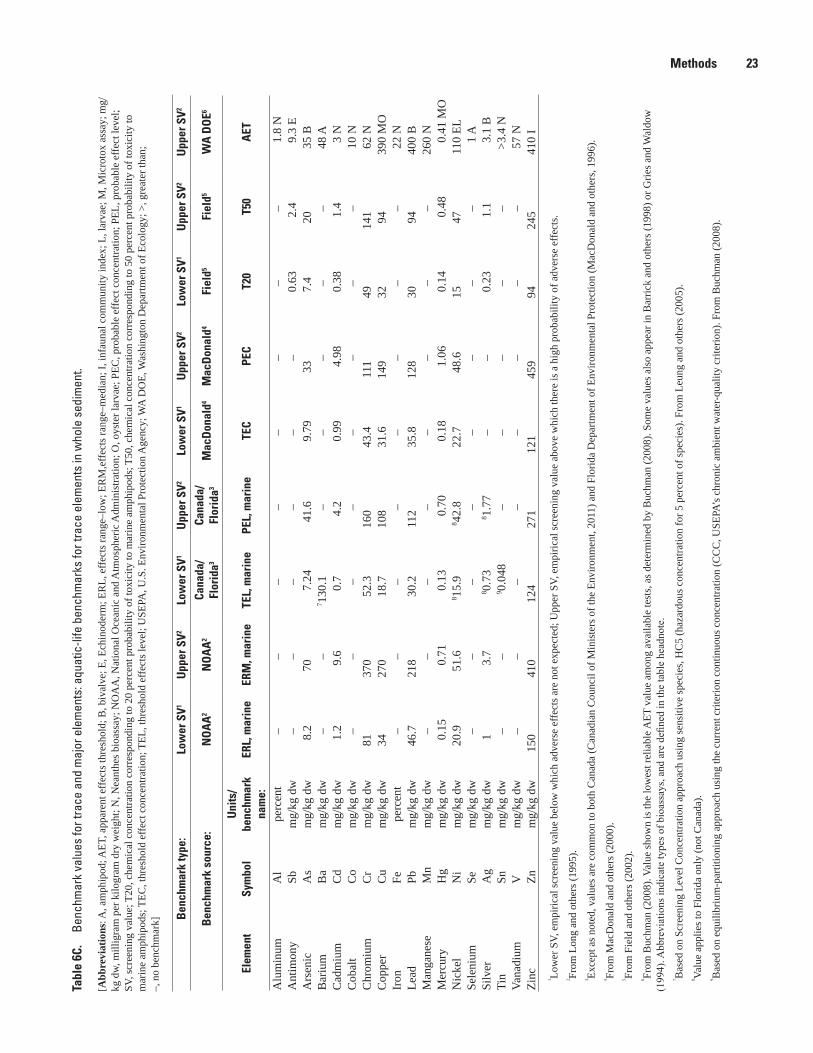
Methods 23Ta
ble
6C.
Benc
hmar
k va
lues
for t
race
and
maj
or e
lem
ents
: aqu
atic
-life
ben
chm
arks
for t
race
ele
men
ts in
who
le s
edim
ent.
[Abb
revi
atio
ns: A
, am
phip
od; A
ET, a
ppar
ent e
ffect
s thr
esho
ld; B
, biv
alve
; E, E
chin
oder
m; E
RL,
effe
cts r
ange
–low
; ER
M,e
ffect
s ran
ge–m
edia
n; I,
infa
unal
com
mun
ity in
dex;
L, l
arva
e; M
, Mic
roto
x as
say;
mg/
kg d
w, m
illig
ram
per
kilo
gram
dry
wei
ght;
N, N
eant
hes b
ioas
say;
NO
AA
, Nat
iona
l Oce
anic
and
Atm
osph
eric
Adm
inis
tratio
n; O
, oys
ter l
arva
e; P
EC, p
roba
ble
effe
ct c
once
ntra
tion;
PEL
, pro
babl
e ef
fect
leve
l; SV
, scr
eeni
ng v
alue
; T20
, che
mic
al c
once
ntra
tion
corr
espo
ndin
g to
20
perc
ent p
roba
bilit
y of
toxi
city
to m
arin
e am
phip
ods;
T50
, che
mic
al c
once
ntra
tion
corr
espo
ndin
g to
50
perc
ent p
roba
bilit
y of
toxi
city
to
mar
ine
amph
ipod
s; T
EC, t
hres
hold
effe
ct c
once
ntra
tion;
TEL
, thr
esho
ld e
ffect
s lev
el; U
SEPA
, U.S
. Env
ironm
enta
l Pro
tect
ion
Age
ncy;
WA
DO
E, W
ashi
ngto
n D
epar
tmen
t of E
colo
gy; >
, gre
ater
than
; –,
no
benc
hmar
k] Ben
chm
ark
type
:Lo
wer
SV1
Upp
er S
V2Lo
wer
SV1
Upp
er S
V2Lo
wer
SV1
Upp
er S
V2Lo
wer
SV1
Upp
er S
V2U
pper
SV2
Ben
chm
ark
sour
ce:
NO
AA
2N
OA
A2
Cana
da/
Flor
ida3
Cana
da/
Flor
ida3
Mac
Don
ald4
Mac
Don
ald4
Fiel
d5Fi
eld5
WA
DO
E6
Elem
ent
Sym
bol
Uni
ts/
benc
hmar
k na
me:
ERL,
mar
ine
ERM
, mar
ine
TEL,
mar
ine
PEL,
mar
ine
TEC
PEC
T20
T50
AET
Alu
min
umA
lpe
rcen
t–
––
––
––
–1.
8 N
Ant
imon
ySb
mg/
kg d
w–
––
––
–0.
632.
49.
3 E
Ars
enic
As
mg/
kg d
w8.
270
7.24
41.6
9.79
337.
420
35 B
Bar
ium
Ba
mg/
kg d
w–
–7 1
30.1
––
––
–48
AC
adm
ium
Cd
mg/
kg d
w1.
29.
60.
74.
20.
994.
980.
381.
43
NC
obal
tC
om
g/kg
dw
––
––
––
––
10 N
Chr
omiu
mC
rm
g/kg
dw
8137
052
.316
043
.411
149
141
62 N
Cop
per
Cu
mg/
kg d
w34
270
18.7
108
31.6
149
3294
390
MO
Iron
Fepe
rcen
t–
––
––
––
–22
NLe
adPb
mg/
kg d
w46
.721
830
.211
235
.812
830
9440
0 B
Man
gane
seM
nm
g/kg
dw
––
––
––
––
260
NM
ercu
ryH
gm
g/kg
dw
0.15
0.71
0.13
0.70
0.18
1.06
0.14
0.48
0.41
MO
Nic
kel
Ni
mg/
kg d
w20
.951
.68 1
5.9
8 42.
822
.748
.615
4711
0 EL
Sele
nium
Sem
g/kg
dw
––
––
––
––
1 A
Silv
erA
gm
g/kg
dw
13.
78 0
.73
8 1.7
7–
–0.
231.
13.
1 B
Tin
Snm
g/kg
dw
––
9 0.0
48–
––
––
>3.4
NVa
nadi
umV
mg/
kg d
w–
––
––
––
–57
NZi
ncZn
mg/
kg d
w15
041
012
427
112
145
994
245
410
I1 Lo
wer
SV,
em
piric
al sc
reen
ing
valu
e be
low
whi
ch a
dver
se e
ffect
s are
not
exp
ecte
d; U
pper
SV,
em
piric
al sc
reen
ing
valu
e ab
ove
whi
ch th
ere
is a
hig
h pr
obab
ility
of a
dver
se e
ffect
s.2 Fr
om L
ong
and
othe
rs (1
995)
. 3 Ex
cept
as n
oted
, val
ues a
re c
omm
on to
bot
h C
anad
a (C
anad
ian
Cou
ncil
of M
inis
ters
of t
he E
nviro
nmen
t, 20
11) a
nd F
lorid
a D
epar
tmen
t of E
nviro
nmen
tal P
rote
ctio
n (M
acD
onal
d an
d ot
hers
, 199
6).
4 From
Mac
Don
ald
and
othe
rs (2
000)
. 5 Fr
om F
ield
and
oth
ers (
2002
).6 Fr
om B
uchm
an (2
008)
. Val
ue sh
own
is th
e lo
wes
t rel
iabl
e AET
val
ue a
mon
g av
aila
ble
test
s, as
det
erm
ined
by
Buc
hman
(200
8). S
ome
valu
es a
lso
appe
ar in
Bar
rick
and
othe
rs (1
998)
or G
ries a
nd W
aldo
w
(199
4). A
bbre
viat
ions
indi
cate
type
s of b
ioas
says
, and
are
defi
ned
in th
e ta
ble
head
note
.7 B
ased
on
Scre
enin
g Le
vel C
once
ntra
tion
appr
oach
usi
ng se
nsiti
ve sp
ecie
s, H
C5
(haz
ardo
us c
once
ntra
tion
for 5
per
cent
of s
peci
es).
From
Leu
ng a
nd o
ther
s (20
05).
8 Valu
e ap
plie
s to
Flor
ida
only
(not
Can
ada)
.9 B
ased
on
equi
libriu
m-p
artit
ioni
ng a
ppro
ach
usin
g th
e cu
rren
t crit
erio
n co
ntin
uous
con
cent
ratio
n (C
CC
, USE
PA’s
chr
onic
am
bien
t wat
er-q
ualit
y cr
iterio
n). F
rom
Buc
hman
(200
8).
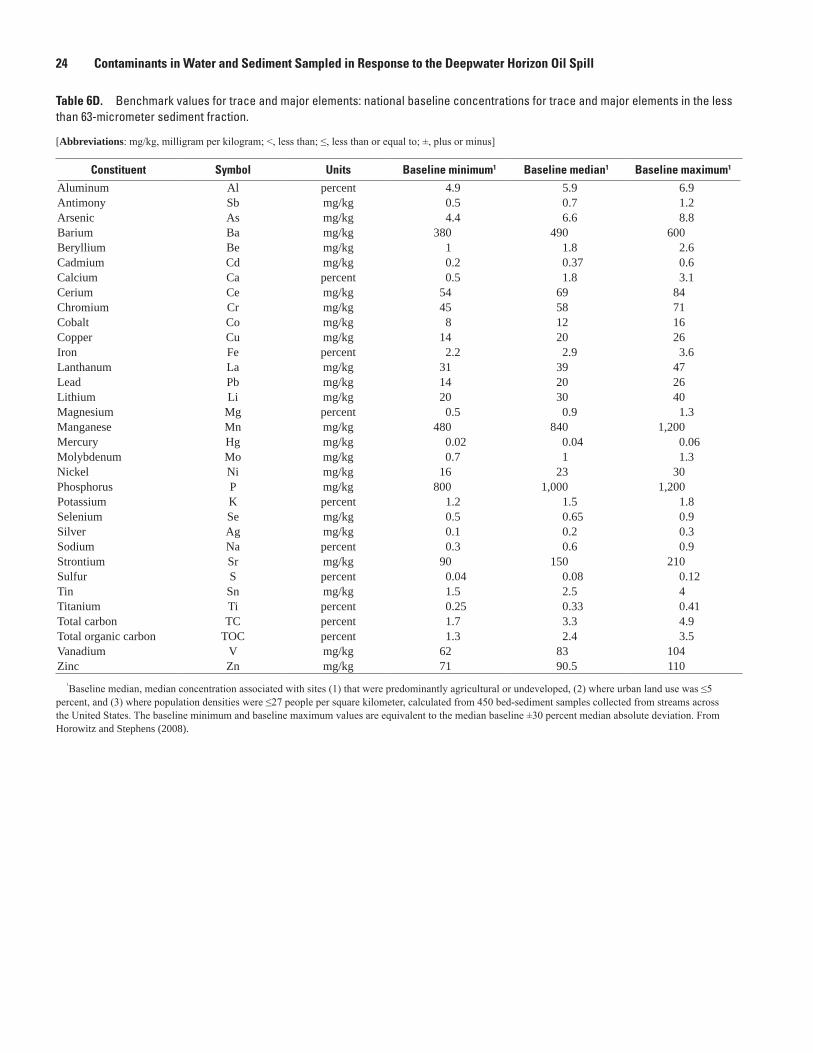
24 Contaminants in Water and Sediment Sampled in Response to the Deepwater Horizon Oil Spill
Table 6D. Benchmark values for trace and major elements: national baseline concentrations for trace and major elements in the less than 63-micrometer sediment fraction.
[Abbreviations: mg/kg, milligram per kilogram; <, less than; ≤, less than or equal to; ±, plus or minus]
Constituent Symbol Units Baseline minimum1 Baseline median1 Baseline maximum1
Aluminum Al percent 4.9 5.9 6.9Antimony Sb mg/kg 0.5 0.7 1.2Arsenic As mg/kg 4.4 6.6 8.8Barium Ba mg/kg 380 490 600Beryllium Be mg/kg 1 1.8 2.6Cadmium Cd mg/kg 0.2 0.37 0.6Calcium Ca percent 0.5 1.8 3.1Cerium Ce mg/kg 54 69 84Chromium Cr mg/kg 45 58 71Cobalt Co mg/kg 8 12 16Copper Cu mg/kg 14 20 26Iron Fe percent 2.2 2.9 3.6Lanthanum La mg/kg 31 39 47Lead Pb mg/kg 14 20 26Lithium Li mg/kg 20 30 40Magnesium Mg percent 0.5 0.9 1.3Manganese Mn mg/kg 480 840 1,200Mercury Hg mg/kg 0.02 0.04 0.06Molybdenum Mo mg/kg 0.7 1 1.3Nickel Ni mg/kg 16 23 30Phosphorus P mg/kg 800 1,000 1,200Potassium K percent 1.2 1.5 1.8Selenium Se mg/kg 0.5 0.65 0.9Silver Ag mg/kg 0.1 0.2 0.3Sodium Na percent 0.3 0.6 0.9Strontium Sr mg/kg 90 150 210Sulfur S percent 0.04 0.08 0.12Tin Sn mg/kg 1.5 2.5 4Titanium Ti percent 0.25 0.33 0.41Total carbon TC percent 1.7 3.3 4.9Total organic carbon TOC percent 1.3 2.4 3.5Vanadium V mg/kg 62 83 104Zinc Zn mg/kg 71 90.5 110
1Baseline median, median concentration associated with sites (1) that were predominantly agricultural or undeveloped, (2) where urban land use was ≤5 percent, and (3) where population densities were ≤27 people per square kilometer, calculated from 450 bed-sediment samples collected from streams across the United States. The baseline minimum and baseline maximum values are equivalent to the median baseline ±30 percent median absolute deviation. From Horowitz and Stephens (2008).

Methods 25
National Baseline Concentrations for Trace and Major Elements and Nutrients in Fine Sediment
Trace and major elements and nutrients in the less than 63-µm sediment fraction were compared to national baseline concentrations from Horowitz and Stephens (2008). Although not technically benchmarks, these baseline concentrations can be used to indicate anthropogenic enrichment. Horowitz and Stephens (2008) determined national baseline concentrations for trace and major elements, and some nutrients, in stream sediments collected from agricultural or undeveloped areas or areas with population density less than or equal to 27 people per square kilometer and urban land use less than or equal to 5 percent. These authors found that enrichment of some elements above baseline was associated with urban land use and population density. These elements, in generally decreasing likelihood of enrichment, are lead, mercury, silver, zinc, cadmium, copper, antimony, sulfur, nickel, tin, chromium, arsenic, cobalt, iron, and phosphorus. Horowitz and Stephens (2008) computed the minimum, median, and maximum baseline concentrations for each element, where the range between the minimum and maximum baseline concentrations represents the range of natural geochemical variance. In Horowitz and Stephens (2008), sediment was wet-sieved through a less than 63-µm mesh and subjected to total digestion prior to analysis; thus, these authors determined total concentrations, that is 95 percent or more of the constituent present, in the less than 63-µm sediment fraction. The processing and analytical methods used by these authors are comparable to those used in the present study.
In the present study, the measured concentration of each element was divided by its maximum baseline concentration to obtain a maximum baseline quotient. The maximum baseline concentration is the upper end of the range in baseline values for a given element as determined by Horowitz and Stephens (2008) and listed in table 6D. “Enrichment” above baseline is defined as having the maximum baseline quotient greater than 1, with the following exception. For samples in which the less than 63-µm fraction makes up less than 1 percent of the total sediment, analytical errors are elevated, and there often is insufficient material to run duplicate analyses to determine the degree of precision. In this case, the precision could be as poor as a 100 percent difference, especially at concentrations near the detection level (Arthur J. Horowitz, Research Chemist, USGS, Atlanta, Georgia, written comm., Feb. 3, 2011). For individual samples with less than 1 percent of total sediment in the less than 63-µm fraction, therefore, maximum baseline quotients needed to be elevated above 2 in order to indicate enrichment. By itself, enrichment, as indicated by maximum baseline exceedance, does not necessarily indicate a potential for adverse effects.
Interpretation of Benchmark Exceedances For organic contaminants, exceedance of either an EqP
benchmark or an upper screening value was considered to be an indication of potential toxicity to benthic organisms. Trace elements were considered to be of most concern if they met the following exceedance criteria for both potential toxicity and anthropogenic enrichment: (1) they exceeded one or more upper screening values in whole sediment samples and (2) they were enriched relative to national baseline concentrations in less than 63-µm sediment samples. Because sediment samples were analyzed for total trace-element concentrations, exceedance rates for upper screening values could be overestimated but are not likely to be underestimated; therefore, these rates, and resulting inferences about potential toxicity, can be considered conservatively high.
In addition, for both organic contaminants and trace elements, sediment samples were classified into one of three effect ranges using terminology from Canadian Council of Ministers of the Environment (2001): (1) minimal-effect range, within which adverse biological effects rarely occur (that is, all constituents were below their lower screening values); (2) possible-effect range, within which adverse biological effects occasionally occur (one or more constituents exceeded a lower screening value, but no elements exceeded an upper screening value); or (3) probable-effect range, within which adverse biological effects frequently occur (one or more constituents exceeded an upper screening value).
Data Compilation
Each distinct sampling event is recorded in the USGS database with a unique combination of agency code for the site, station-identification number, sample-collection start date, sample-collection end date, and sample medium. The agency code associated with the samples described in this report is “USGS,” and the station-identification numbers are presented in table 1. In the database, sediment samples are assigned sampling-medium designations of either bottom material or soil.
The results for environmental samples from water and sediment can be retrieved from the USGS by supplying the station-identification numbers to one of the following web sites:
• NWISWeb (http://nwis.waterdata.usgs.gov/usa/nwis/qwdata) or
• Water-Quality Data Portal (http://qwwebservices.usgs.gov/portal.html)
26 Contaminants in Water and Sediment Sampled in Response to the Deepwater Horizon Oil Spill
The Data Portal provides data in a manner consistent with similar data provided by the STORET database, except that a few of the observational metadata available from NWISWeb are omitted. Samples collected prior to July 15, 2010, are categorized as “pre-landfall,” and subsequent samples are categorized as “post-landfall.”
Sometimes, one or more constituents in a particular sample were reanalyzed to verify the results or to employ an analytical method with improved sensitivity to low concentrations. When verification reruns were performed, the earliest analytical result is presented in the database, and additional results from a subsequent analysis are preserved in the “result-laboratory” comments field. When a more sensitive method was employed, however, the results from the more sensitive method are presented in the database, and results from the less sensitive method are preserved in the “result-laboratory” comments.
Data Analyses
Data for all analyses described in this report were obtained on March 28, 2011 (March 24 DWH GOM Data Release), and used as received from the participating laboratories without further rounding. Benchmark comparisons were made for all samples, including environmental and field-replicate samples. For most sites, if multiple samples were collected during either the pre-landfall or post-landfall sampling period, one was designated as the primary, or environmental sample, and any others were considered to be replicates for that sampling period. If no primary sample was designated, however, or if the primary sample was missing data for either trace elements or organic analytes, then the replicate sample with the earliest date and time, or with data for the fullest suite of analytes, typically was designated as a primary sample. This “primary-sample” dataset was used for statistical summaries of contaminant occurrence, so that each site was represented only once for each sampling period and analytical method.
A subset of the primary-sample dataset, consisting of paired pre- and post-landfall samples, was used for statistical comparison of pre-landfall to post-landfall sample concentrations at these sites. This “paired-sample” dataset was generated by dropping data for all sites that were sampled during only one sampling period, either pre-landfall or post-landfall. The resulting paired-sample dataset contained exactly two samples per site—one collected during each of the pre-landfall and post-landfall periods.
Detection frequencies and percentile concentrations were determined by using procedures in the statistical software package, SAS 9.2 TS Level 2M3 (SAS Institute Inc., 2009a and 2009b). Summary statistics are presented separately for each chemical class (organic contaminants, or trace and major elements and nutrients) in each sampling medium (water, whole sediment, or less than 63-µm sediment fraction). The detection frequency for a given analyte varies with the sensitivity of the analytical method; for example,
of two methods for a given analyte, the method with the lower reporting level is likely to result in a higher detection frequency. Therefore, to facilitate comparison of detection frequencies between sampling periods and for different contaminants, detection frequencies were calculated at multiple detection thresholds appropriate for the chemical class and sampling medium. These detection thresholds are discussed in detail in the section on “Data Censoring.” Briefly, for each analyte, one “optimal” detection threshold was determined to facilitate comparison between pre-landfall and post-landfall samples. In addition, detection frequencies for all analytes within the same contaminant class and sampling medium were computed at each of four common detection thresholds to allow comparison of detection frequencies among analytes. In the context of this study, data censoring refers to the process of distinguishing detections, or quantified values, from nondetections, or censored values; censored datasets are datasets with some portion of the results composed of nondetections.
Percentiles of concentrations were determined in the primary-sample dataset by using one of four methods, depending on the amount of censored data, or nondetections, for a given analyte (fig. 2). For analytes detected in 100 percent of samples, or having no censored data, the SAS UNIVARIATE procedure was used to compute concentration percentiles. For analytes with some, but less than 50-percent, censored data, percentiles were estimated by using the nonparametric Kaplan-Meier method (Helsel, 2005) in the SAS LIFETEST procedure. For analytes with 50- to 80-percent censored data, percentiles were estimated by using a SAS freeware macro, Censored Data Regression on Order Statistics (Helsel, 2005). For analytes with more than 80-percent censored data, all data for that analyte were censored at a common detection threshold, and only the 95th percentile concentration was calculated.
Statistical comparisons of contaminant concentrations in pre-landfall to post-landfall samples were made by using the paired Prentice-Wilcoxon (PPW) test. This test was implemented by using the USGS S-PLUS library version 4.0 (Lorenz and others, 2011) for the statistical software package Spotfire S+ (TIBCO Software, Inc., 2008). The PPW test is appropriate for comparing two groups with matched pairs of data and can be applied to censored datasets. This test evaluates whether there is a difference in the distributions of the two sample groups. To do so, first the data are stacked into one column, a score is computed for each observation (both censored and uncensored data) on the basis of the Kaplan-Meier estimate of the survival function, and then the scores are divided back into the two groups of matched pairs. The PPW test computes the differences between the paired scores and determines whether the sum of these differences is significantly different from zero by using a normal approximation for the test statistic (Helsel, 2005). In this study, the PPW test was performed on the paired-sample dataset, which represents the 48 sites that were sampled during both the pre-landfall and post-landfall periods, as described previously.

Methods 27
Additional PPW tests were used to compare concentrations in pre-landfall and post-landfall samples collected at a subset of 19 paired-sample sites that were identified by Rosenbauer and others (2010) as having geochemical evidence, or a fingerprint, of M-1 well oil in post-landfall samples of sediment, tarballs, or both. At this subset of sites, which is called the “fingerprint-sample” dataset, there is direct evidence from Rosenbauer and others (2010) of residual M-1 well oil at the sites during the post-landfall period.
Benchmark exceedance frequencies were computed by using the Spotfire S+ program. All field samples, including primary and replicate samples, were compared to benchmarks to maximize the information on benchmark exceedance. However, direct comparison between exceedance frequencies for the pre-landfall and post-landfall sampling periods must be qualified because data from the two sampling periods do not represent exactly the same sites. Specifically, 22 pre-landfall sites and 1 post-landfall site were not sampled during the other
sampling period (table 1); also, 20 of the 71 total sites were sampled more than once during one or both sampling periods.
For each combination of contaminant class and sampling medium, Fisher’s exact test was used to determine whether the proportion of samples exceeding applicable benchmarks was significantly different (p <0.05) between the pre-landfall and post-landfall sampling periods. This test was performed on the 48 sites in the paired-sample dataset, so that the same sites are represented only once in both sampling periods. In addition, the paired-sample sign test was used to compare selected benchmark exceedance results, such as ∑TUi and ∑ESBTUi values, and benchmark exceedances for individual trace elements, between pre-landfall and post-landfall samples in the paired-sample dataset. A nonparametric test with few assumptions, this tests whether the pre-landfall values were generally larger or smaller than the post-landfall values (p <0.05; Helsel and Hirsch, 2002).
175
150
125
100
75
50
25
0
NU
MB
ER O
F A
NA
LYTE
S IN
CLA
SS
PRE ORGANICS WTR
POST ORGANICS WTR
PRE ORGANICS SED
POST ORGANICS SED
PRE TMN WTR
POST TMN WTR
PRE TMN SED
POST TMN SED
sac12-0452_Figure 02
157
118
70
98
33 31
68 68
EXPLANATION
CENSOR CATEGORY
HIGH (>80% censored)
Regression on orderedstatistics using censoreddata (50–80% censored)
None (100% censored)
Nonparametric percentiles (0% censored)
None (< 5 samples)
Kaplan Meier estimation (0–50% censored)
PRE is Pre-landfall; POST is Post-landfall; SED is sediment; TMN is trace and major elements and nutrients;WTR is water; > is greater than; < is less than; % is percent of data censored
Figure 2. Number of analytes for which percentiles were determined by using four different methods, shown by contaminant class, sampling medium, and sampling period from the 2010 Deepwater Horizon oil spill in the Gulf of Mexico.
28 Contaminants in Water and Sediment Sampled in Response to the Deepwater Horizon Oil Spill
For comparison of measured contaminant concentrations to various benchmarks for human health and aquatic life, some data manipulations were necessary because of the nature of the dataset. Specifically, the following apply:
• In this study, trace-element concentrations are reported as total concentrations in water. Because most benchmarks for trace elements are expressed in terms of dissolved concentration in the water column, estimates of these benchmarks as total trace-element concentrations were calculated by using saltwater conversion factors from U.S. Environmental Protection Agency (2011d) prior to comparison with measured concentrations (Buchman, 2008).
• As previously described, water samples were not analyzed for the alkylated PAH groups required for calculation of USEPA benchmarks for mixtures of PAH and BTEX compounds (∑TUi). Concentrations of each alkylated PAH group were estimated from the corresponding parent PAH concentrations by using multipliers, as specified in the USEPA procedures for benchmark calculation (Mount, 2010).
• For sediment samples, BTEX compounds were not determined, so calculated ∑ESBTUi values could be slightly low; however, this bias is expected to be minimal because BTEX compounds are volatile, were not detected in weathered M-1 oil (State of Florida Oil Spill Academic Task Force, 2010), and are not expected to persist in sediment (Mount, 2010).
Results and Discussion The results are presented first for QC analyses because
these findings affect interpretation of field sample data. Following the QC data discussion, results are presented separately for each combination of contaminant class and sampling medium. In each case, contaminant occurrence is assessed, statistical comparisons are made between concentrations in pre-landfall and post-landfall samples, and measured concentrations are compared to applicable water- or sediment-quality benchmarks.
Quality-Control Analyses
Analytical results for the various QC samples follow. These results were considered in computing occurrence statistics and making benchmark comparisons, as discussed later in this section.
Blank SamplesResults were available for 166 analytes in at least
4 pre-landfall field blanks. Most of these results were from the USGS NWQL. In addition, results were available from TestAmerica Laboratory in Colorado for six analytes, four of which overlap with analytes determined by the USGS NWQL, and results were available from the USGS OCRL for dissolved organic carbon. Of the 885 total results, 861 (97 percent) were reported as censored values (nondetections). There were 24 quantified results, or detections, reported in blanks, affecting a total of 21 analytes (table 7). Five of the quantified values were less than the highest reporting level for that analyte. These were quantified by using corroborating evidence of analyte presence in the mass spectrogram, even though the concentration was below the typical reporting level for the method.
During the post-landfall sampling period, four field blanks were collected and shipped to the TestAmerica Laboratory in Florida for analysis. Of the 584 total reported results for 146 analytes, 564 (97 percent) were nondetections. There were 20 quantified detections reported for 12 analytes (table 8), of which only 3 are organic contaminants. Ammonia plus organic nitrogen and phosphorus were quantified in each of the four blanks. Trip blanks also were analyzed by the TestAmerica Laboratory during post-landfall sampling. These have limited utility for comparison to environmental samples; however, quantified detections reported for three analytes (table 8) could indicate potential for contamination during laboratory processing and analysis. None of these three analytes were detected in field blanks analyzed at this laboratory. The benzene result was from a blank associated with an environmental sample collected in Louisiana on October 12; the other results were from a blank associated with a sample collected in Florida on October 13.
There was little consistency in blank contamination between sampling periods. Only four analytes—calcium, magnesium, naphthalene, and sodium—were detected in blanks from both the pre-landfall and post-landfall periods. Six analytes detected in the pre-landfall blanks—1,4-dichlorobenzene, 4-chloro-3-methylphenol, arsenic, dichloromethane, ethyl methyl ketone, and silver—were quantified at concentrations less than the reporting level for post-landfall blanks. Similarly, copper was detected in two post-landfall blanks, but at concentrations less than the highest reporting level for pre-landfall blanks. Because of these discrepancies, it was not possible to evaluate differences in incidental contamination between sampling periods. In subsequent data analyses, potential contamination in environmental samples was determined separately for each period by using field blanks collected during that period.
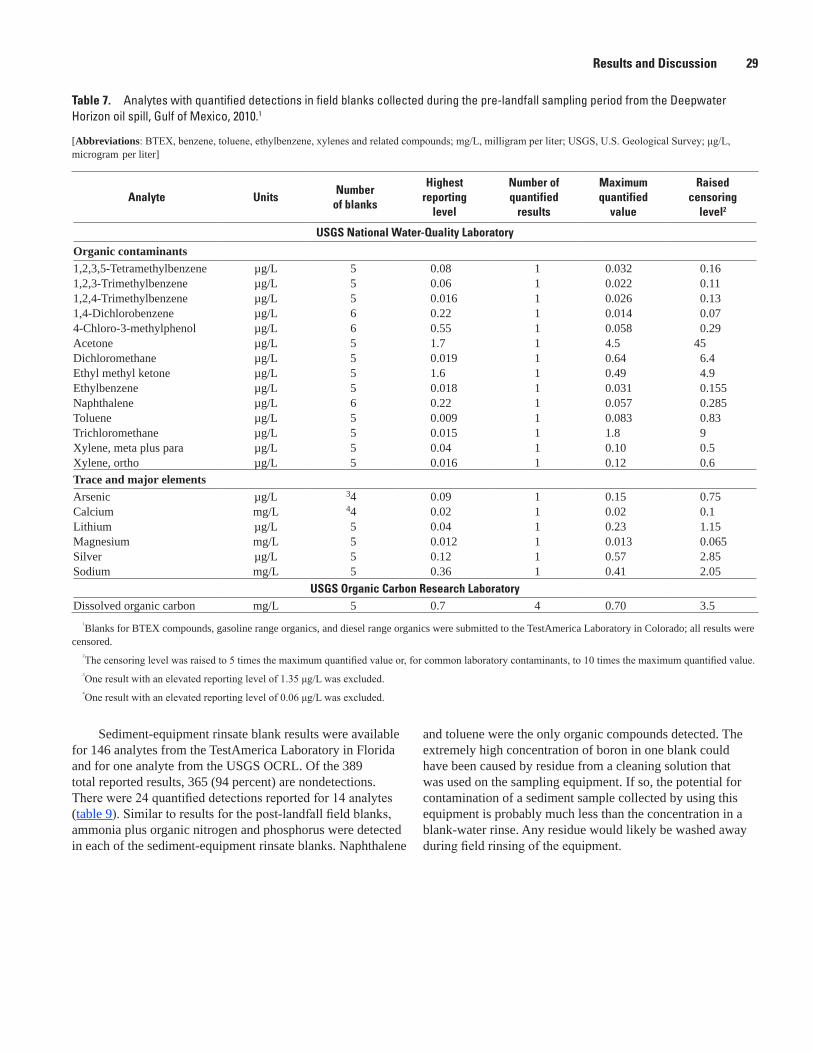
Results and Discussion 29
Table 7. Analytes with quantified detections in field blanks collected during the pre-landfall sampling period from the Deepwater Horizon oil spill, Gulf of Mexico, 2010.1
[Abbreviations: BTEX, benzene, toluene, ethylbenzene, xylenes and related compounds; mg/L, milligram per liter; USGS, U.S. Geological Survey; μg/L, microgram per liter]
Analyte UnitsNumber
of blanks
Highest reporting
level
Number of quantified
results
Maximum quantified
value
Raised censoring
level2
USGS National Water-Quality Laboratory
Organic contaminants1,2,3,5-Tetramethylbenzene µg/L 5 0.08 1 0.032 0.161,2,3-Trimethylbenzene µg/L 5 0.06 1 0.022 0.111,2,4-Trimethylbenzene µg/L 5 0.016 1 0.026 0.131,4-Dichlorobenzene µg/L 6 0.22 1 0.014 0.074-Chloro-3-methylphenol µg/L 6 0.55 1 0.058 0.29Acetone µg/L 5 1.7 1 4.5 45Dichloromethane µg/L 5 0.019 1 0.64 6.4Ethyl methyl ketone µg/L 5 1.6 1 0.49 4.9Ethylbenzene µg/L 5 0.018 1 0.031 0.155Naphthalene µg/L 6 0.22 1 0.057 0.285Toluene µg/L 5 0.009 1 0.083 0.83Trichloromethane µg/L 5 0.015 1 1.8 9Xylene, meta plus para µg/L 5 0.04 1 0.10 0.5Xylene, ortho µg/L 5 0.016 1 0.12 0.6Trace and major elementsArsenic µg/L 34 0.09 1 0.15 0.75Calcium mg/L 44 0.02 1 0.02 0.1Lithium µg/L 5 0.04 1 0.23 1.15Magnesium mg/L 5 0.012 1 0.013 0.065Silver µg/L 5 0.12 1 0.57 2.85Sodium mg/L 5 0.36 1 0.41 2.05
USGS Organic Carbon Research LaboratoryDissolved organic carbon mg/L 5 0.7 4 0.70 3.5
1Blanks for BTEX compounds, gasoline range organics, and diesel range organics were submitted to the TestAmerica Laboratory in Colorado; all results were censored.
2The censoring level was raised to 5 times the maximum quantified value or, for common laboratory contaminants, to 10 times the maximum quantified value.3One result with an elevated reporting level of 1.35 μg/L was excluded.4One result with an elevated reporting level of 0.06 μg/L was excluded.
Sediment-equipment rinsate blank results were available for 146 analytes from the TestAmerica Laboratory in Florida and for one analyte from the USGS OCRL. Of the 389 total reported results, 365 (94 percent) are nondetections. There were 24 quantified detections reported for 14 analytes (table 9). Similar to results for the post-landfall field blanks, ammonia plus organic nitrogen and phosphorus were detected in each of the sediment-equipment rinsate blanks. Naphthalene
and toluene were the only organic compounds detected. The extremely high concentration of boron in one blank could have been caused by residue from a cleaning solution that was used on the sampling equipment. If so, the potential for contamination of a sediment sample collected by using this equipment is probably much less than the concentration in a blank-water rinse. Any residue would likely be washed away during field rinsing of the equipment.
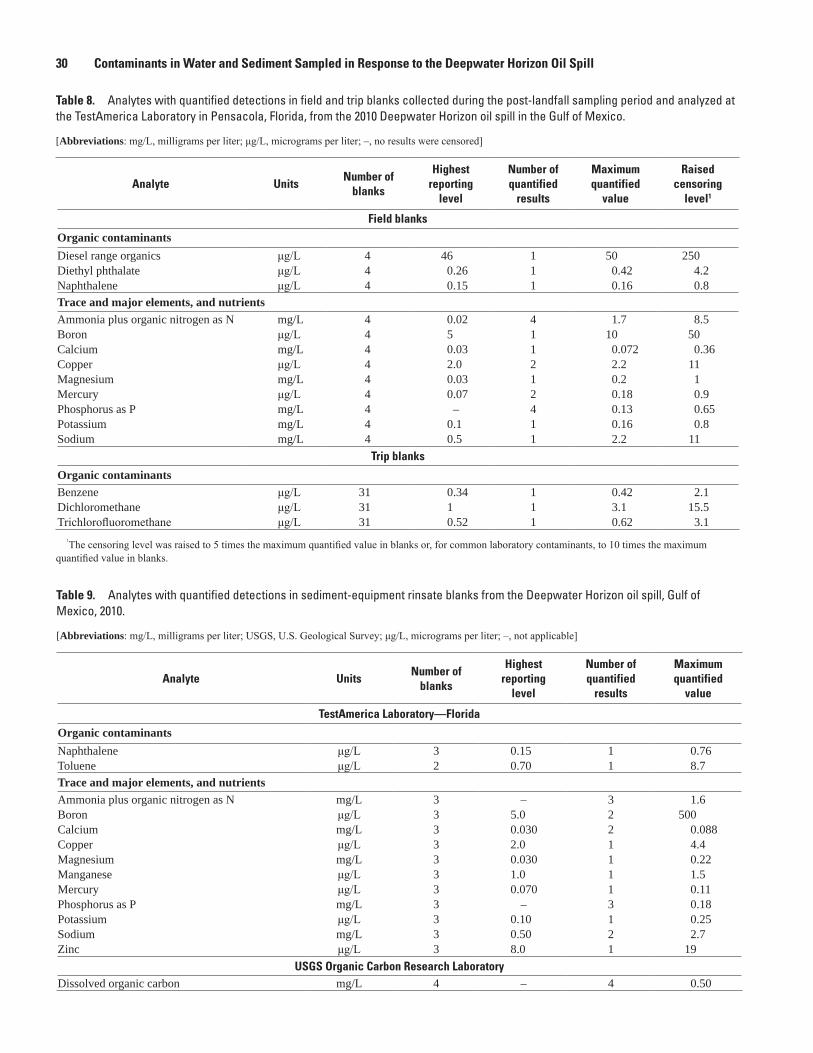
30 Contaminants in Water and Sediment Sampled in Response to the Deepwater Horizon Oil Spill
Table 8. Analytes with quantified detections in field and trip blanks collected during the post-landfall sampling period and analyzed at the TestAmerica Laboratory in Pensacola, Florida, from the 2010 Deepwater Horizon oil spill in the Gulf of Mexico.
[Abbreviations: mg/L, milligrams per liter; μg/L, micrograms per liter; –, no results were censored]
Analyte UnitsNumber of
blanks
Highest reporting
level
Number of quantified
results
Maximum quantified
value
Raised censoring
level1
Field blanks
Organic contaminantsDiesel range organics μg/L 4 46 1 50 250Diethyl phthalate μg/L 4 0.26 1 0.42 4.2Naphthalene μg/L 4 0.15 1 0.16 0.8Trace and major elements, and nutrientsAmmonia plus organic nitrogen as N mg/L 4 0.02 4 1.7 8.5Boron μg/L 4 5 1 10 50Calcium mg/L 4 0.03 1 0.072 0.36Copper μg/L 4 2.0 2 2.2 11Magnesium mg/L 4 0.03 1 0.2 1Mercury μg/L 4 0.07 2 0.18 0.9Phosphorus as P mg/L 4 – 4 0.13 0.65Potassium mg/L 4 0.1 1 0.16 0.8Sodium mg/L 4 0.5 1 2.2 11
Trip blanks
Organic contaminantsBenzene μg/L 31 0.34 1 0.42 2.1Dichloromethane μg/L 31 1 1 3.1 15.5Trichlorofluoromethane μg/L 31 0.52 1 0.62 3.1
1The censoring level was raised to 5 times the maximum quantified value in blanks or, for common laboratory contaminants, to 10 times the maximum quantified value in blanks.
Table 9. Analytes with quantified detections in sediment-equipment rinsate blanks from the Deepwater Horizon oil spill, Gulf of Mexico, 2010.
[Abbreviations: mg/L, milligrams per liter; USGS, U.S. Geological Survey; μg/L, micrograms per liter; –, not applicable]
Analyte UnitsNumber of
blanks
Highest reporting
level
Number of quantified
results
Maximum quantified
value
TestAmerica Laboratory—Florida
Organic contaminantsNaphthalene μg/L 3 0.15 1 0.76Toluene μg/L 2 0.70 1 8.7Trace and major elements, and nutrientsAmmonia plus organic nitrogen as N mg/L 3 – 3 1.6Boron μg/L 3 5.0 2 500Calcium mg/L 3 0.030 2 0.088Copper μg/L 3 2.0 1 4.4Magnesium mg/L 3 0.030 1 0.22Manganese μg/L 3 1.0 1 1.5Mercury μg/L 3 0.070 1 0.11Phosphorus as P mg/L 3 – 3 0.18Potassium μg/L 3 0.10 1 0.25Sodium mg/L 3 0.50 2 2.7Zinc μg/L 3 8.0 1 19
USGS Organic Carbon Research LaboratoryDissolved organic carbon mg/L 4 – 4 0.50
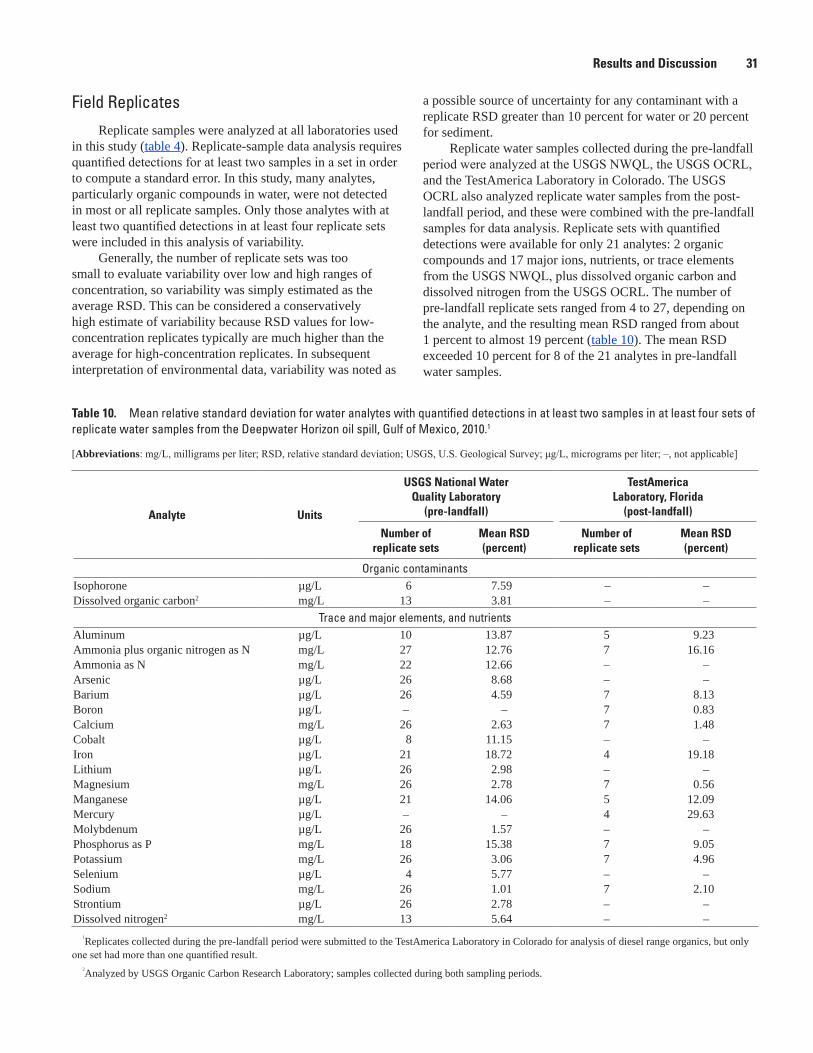
Results and Discussion 31
Field ReplicatesReplicate samples were analyzed at all laboratories used
in this study (table 4). Replicate-sample data analysis requires quantified detections for at least two samples in a set in order to compute a standard error. In this study, many analytes, particularly organic compounds in water, were not detected in most or all replicate samples. Only those analytes with at least two quantified detections in at least four replicate sets were included in this analysis of variability.
Generally, the number of replicate sets was too small to evaluate variability over low and high ranges of concentration, so variability was simply estimated as the average RSD. This can be considered a conservatively high estimate of variability because RSD values for low-concentration replicates typically are much higher than the average for high-concentration replicates. In subsequent interpretation of environmental data, variability was noted as
a possible source of uncertainty for any contaminant with a replicate RSD greater than 10 percent for water or 20 percent for sediment.
Replicate water samples collected during the pre-landfall period were analyzed at the USGS NWQL, the USGS OCRL, and the TestAmerica Laboratory in Colorado. The USGS OCRL also analyzed replicate water samples from the post-landfall period, and these were combined with the pre-landfall samples for data analysis. Replicate sets with quantified detections were available for only 21 analytes: 2 organic compounds and 17 major ions, nutrients, or trace elements from the USGS NWQL, plus dissolved organic carbon and dissolved nitrogen from the USGS OCRL. The number of pre-landfall replicate sets ranged from 4 to 27, depending on the analyte, and the resulting mean RSD ranged from about 1 percent to almost 19 percent (table 10). The mean RSD exceeded 10 percent for 8 of the 21 analytes in pre-landfall water samples.
Table 10. Mean relative standard deviation for water analytes with quantified detections in at least two samples in at least four sets of replicate water samples from the Deepwater Horizon oil spill, Gulf of Mexico, 2010.1
[Abbreviations: mg/L, milligrams per liter; RSD, relative standard deviation; USGS, U.S. Geological Survey; μg/L, micrograms per liter; –, not applicable]
Analyte Units
USGS National Water Quality Laboratory
(pre-landfall)
TestAmerica Laboratory, Florida
(post-landfall)
Number of replicate sets
Mean RSD (percent)
Number of replicate sets
Mean RSD (percent)
Organic contaminantsIsophorone µg/L 6 7.59 – –Dissolved organic carbon2 mg/L 13 3.81 – –
Trace and major elements, and nutrientsAluminum µg/L 10 13.87 5 9.23Ammonia plus organic nitrogen as N mg/L 27 12.76 7 16.16Ammonia as N mg/L 22 12.66 – –Arsenic µg/L 26 8.68 – –Barium µg/L 26 4.59 7 8.13Boron µg/L – – 7 0.83Calcium mg/L 26 2.63 7 1.48Cobalt µg/L 8 11.15 – –Iron µg/L 21 18.72 4 19.18Lithium µg/L 26 2.98 – –Magnesium mg/L 26 2.78 7 0.56Manganese µg/L 21 14.06 5 12.09Mercury µg/L – – 4 29.63Molybdenum µg/L 26 1.57 – –Phosphorus as P mg/L 18 15.38 7 9.05Potassium mg/L 26 3.06 7 4.96Selenium µg/L 4 5.77 – –Sodium mg/L 26 1.01 7 2.10Strontium µg/L 26 2.78 – –Dissolved nitrogen2 mg/L 13 5.64 – –
1Replicates collected during the pre-landfall period were submitted to the TestAmerica Laboratory in Colorado for analysis of diesel range organics, but only one set had more than one quantified result.
2Analyzed by USGS Organic Carbon Research Laboratory; samples collected during both sampling periods.
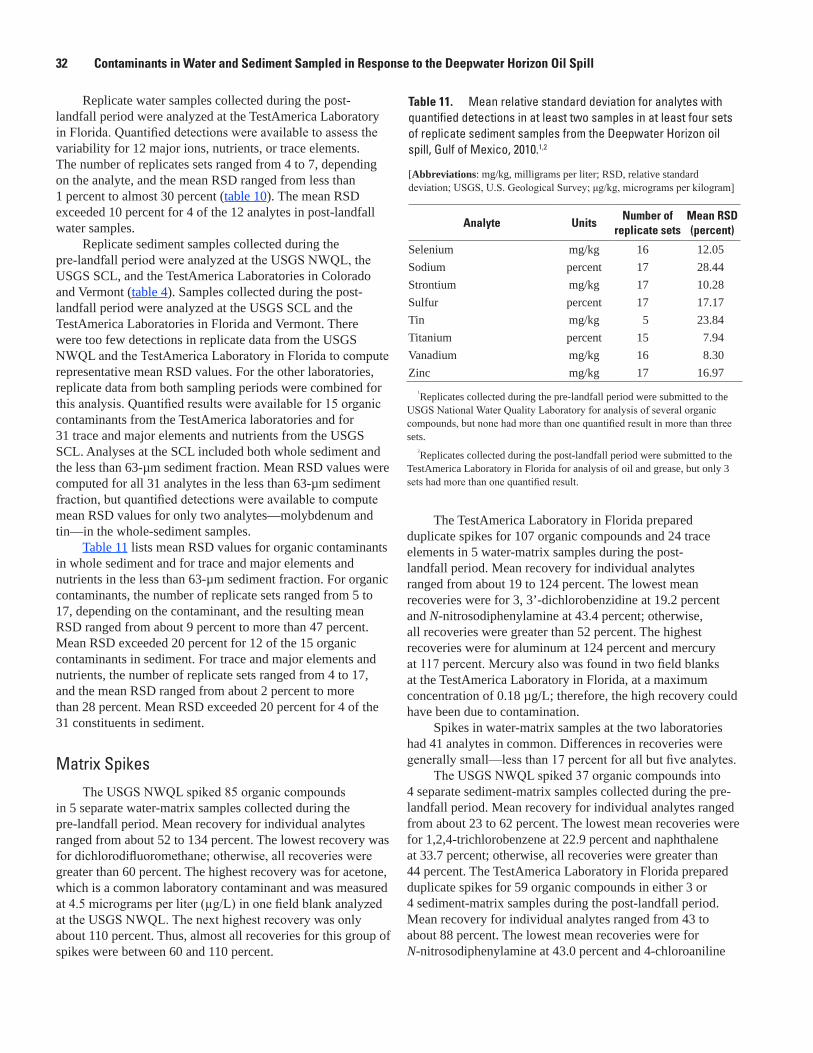
32 Contaminants in Water and Sediment Sampled in Response to the Deepwater Horizon Oil Spill
Replicate water samples collected during the post-landfall period were analyzed at the TestAmerica Laboratory in Florida. Quantified detections were available to assess the variability for 12 major ions, nutrients, or trace elements. The number of replicates sets ranged from 4 to 7, depending on the analyte, and the mean RSD ranged from less than 1 percent to almost 30 percent (table 10). The mean RSD exceeded 10 percent for 4 of the 12 analytes in post-landfall water samples.
Replicate sediment samples collected during the pre-landfall period were analyzed at the USGS NWQL, the USGS SCL, and the TestAmerica Laboratories in Colorado and Vermont (table 4). Samples collected during the post-landfall period were analyzed at the USGS SCL and the TestAmerica Laboratories in Florida and Vermont. There were too few detections in replicate data from the USGS NWQL and the TestAmerica Laboratory in Florida to compute representative mean RSD values. For the other laboratories, replicate data from both sampling periods were combined for this analysis. Quantified results were available for 15 organic contaminants from the TestAmerica laboratories and for 31 trace and major elements and nutrients from the USGS SCL. Analyses at the SCL included both whole sediment and the less than 63-µm sediment fraction. Mean RSD values were computed for all 31 analytes in the less than 63-µm sediment fraction, but quantified detections were available to compute mean RSD values for only two analytes—molybdenum and tin—in the whole-sediment samples.
Table 11 lists mean RSD values for organic contaminants in whole sediment and for trace and major elements and nutrients in the less than 63-µm sediment fraction. For organic contaminants, the number of replicate sets ranged from 5 to 17, depending on the contaminant, and the resulting mean RSD ranged from about 9 percent to more than 47 percent. Mean RSD exceeded 20 percent for 12 of the 15 organic contaminants in sediment. For trace and major elements and nutrients, the number of replicate sets ranged from 4 to 17, and the mean RSD ranged from about 2 percent to more than 28 percent. Mean RSD exceeded 20 percent for 4 of the 31 constituents in sediment.
Matrix SpikesThe USGS NWQL spiked 85 organic compounds
in 5 separate water-matrix samples collected during the pre-landfall period. Mean recovery for individual analytes ranged from about 52 to 134 percent. The lowest recovery was for dichlorodifluoromethane; otherwise, all recoveries were greater than 60 percent. The highest recovery was for acetone, which is a common laboratory contaminant and was measured at 4.5 micrograms per liter (µg/L) in one field blank analyzed at the USGS NWQL. The next highest recovery was only about 110 percent. Thus, almost all recoveries for this group of spikes were between 60 and 110 percent.
The TestAmerica Laboratory in Florida prepared duplicate spikes for 107 organic compounds and 24 trace elements in 5 water-matrix samples during the post-landfall period. Mean recovery for individual analytes ranged from about 19 to 124 percent. The lowest mean recoveries were for 3, 3’-dichlorobenzidine at 19.2 percent and N-nitrosodiphenylamine at 43.4 percent; otherwise, all recoveries were greater than 52 percent. The highest recoveries were for aluminum at 124 percent and mercury at 117 percent. Mercury also was found in two field blanks at the TestAmerica Laboratory in Florida, at a maximum concentration of 0.18 µg/L; therefore, the high recovery could have been due to contamination.
Spikes in water-matrix samples at the two laboratories had 41 analytes in common. Differences in recoveries were generally small—less than 17 percent for all but five analytes.
The USGS NWQL spiked 37 organic compounds into 4 separate sediment-matrix samples collected during the pre-landfall period. Mean recovery for individual analytes ranged from about 23 to 62 percent. The lowest mean recoveries were for 1,2,4-trichlorobenzene at 22.9 percent and naphthalene at 33.7 percent; otherwise, all recoveries were greater than 44 percent. The TestAmerica Laboratory in Florida prepared duplicate spikes for 59 organic compounds in either 3 or 4 sediment-matrix samples during the post-landfall period. Mean recovery for individual analytes ranged from 43 to about 88 percent. The lowest mean recoveries were for N-nitrosodiphenylamine at 43.0 percent and 4-chloroaniline
Table 11. Mean relative standard deviation for analytes with quantified detections in at least two samples in at least four sets of replicate sediment samples from the Deepwater Horizon oil spill, Gulf of Mexico, 2010.1,2
[Abbreviations: mg/kg, milligrams per liter; RSD, relative standard deviation; USGS, U.S. Geological Survey; μg/kg, micrograms per kilogram]
Analyte UnitsNumber of
replicate setsMean RSD (percent)
Selenium mg/kg 16 12.05Sodium percent 17 28.44Strontium mg/kg 17 10.28Sulfur percent 17 17.17Tin mg/kg 5 23.84Titanium percent 15 7.94Vanadium mg/kg 16 8.30Zinc mg/kg 17 16.97
1Replicates collected during the pre-landfall period were submitted to the USGS National Water Quality Laboratory for analysis of several organic compounds, but none had more than one quantified result in more than three sets.
2Replicates collected during the post-landfall period were submitted to the TestAmerica Laboratory in Florida for analysis of oil and grease, but only 3 sets had more than one quantified result.

Results and Discussion 33
at 56.2 percent; otherwise, all recoveries were greater than 61 percent. Spikes at the 2 laboratories had 18 analytes in common; mean recoveries in spikes from the TestAmerica Laboratory in Florida were consistently higher by about 13 to 35 percent.
Analytes with low spike recovery could also have a low bias in environmental-sample results. In the present study, recovery is considered to be within acceptable limits if it is between 70 and 115 percent for organic analytes in water samples and between 50 and 115 percent for organic analytes in sediment samples. Table 12 provides a list of analytes with less than 70 percent or more than 115 percent recovery
in water spikes, or with less than 50 percent or more than 115 percent recovery in sediment spikes. Concentrations reported for these analytes in environmental samples could be substantially lower than their true concentrations. Analytes with overly high spike recovery could have a high bias in environmental-sample results, possibly due to laboratory contamination. This condition primarily affects acetone in water samples analyzed at the USGS NWQL and aluminum and mercury in water samples analyzed by the TestAmerica Laboratory in Florida. Concentrations were not recovery-corrected, but analytes with exceptionally low or high recovery are footnoted in tables within this report.
Table 12. Analytes with less than 70 percent or more than 115 percent recovery in water matrix spikes, or with less than 50 percent or more than 115 percent recovery in sediment matrix spikes from the Deepwater Horizon oil spill, Gulf of Mexico, 2010.1
[Abbreviations: mg/L, milligram per liter; P, phosphorus; USGS, U.S. Geological Survey; μg/L, microgram per liter; μg/kg, microgram per kilogram; –, no spiked samples or mean recovery greater than 70 percent]
Analyte Units
USGS National Water Quality Laboratory (pre-landfall)
TestAmerica Laboratory, Florida (post-landfall)
Number of spikes
Mean recovery (percent)
Number of spike sets
Mean recovery (percent)
Water1,1,2-Trichloro-1,2,2-trifluoroethane μg/L 5 67.9 3 93.02,4-Dimethylphenol μg/L – – 5 59.33,3'-Dichlorobenzidine μg/L – – 5 19.24-Isopropyltoluene μg/L 5 69.3 – –4-Nitroaniline μg/L – – 5 61.34-Nitrophenol μg/L – – 5 68.9Acetone μg/L 5 134 – –Aluminum μg/L – – 3 124Benzo[a]pyrene μg/L – – 5 67.3Carbon disulfide μg/L 5 63.4 3 88.2Dichlorodifluoromethane μg/L 5 52.3 3 97.0Hexachlorobutadiene μg/L 5 60.7 5 74.8Hexachlorocyclopentadiene μg/L – – 5 53.3Hexachloroethane μg/L 5 76.7 5 66.2Mercury μg/L 3 117n-Butylbenzene μg/L 5 65.6 – –N-Nitrosodiphenylamine μg/L – – 5 43.4n-Propylbenzene μg/L 5 67.9 – –Styrene μg/L 5 61.2 3 88.8Phosphorus as P mg/L – – 3 52.5
Sediment1,2,4-Trichlorobenzene μg/kg 4 22.9 – –1,6-Dimethylnaphthalene μg/kg 4 47.9 – –2,6-Dimethylnaphthalene μg/kg 4 47.4 – –2-Ethylnaphthalene μg/kg 4 46.3 – –Acenaphthylene μg/kg 4 47.0 3 75.7Naphthalene μg/kg 4 33.7 3 69.0N-Nitrosodiphenylamine μg/kg – – 3 43.0Pentachloronitrobenzene μg/kg 4 44.6 – –
1Environmental samples also were analyzed at the USGS Sediment Chemistry Laboratory and the TestAmerica Laboratories in Colorado and Vermont, but no matrix-spike results were reported.
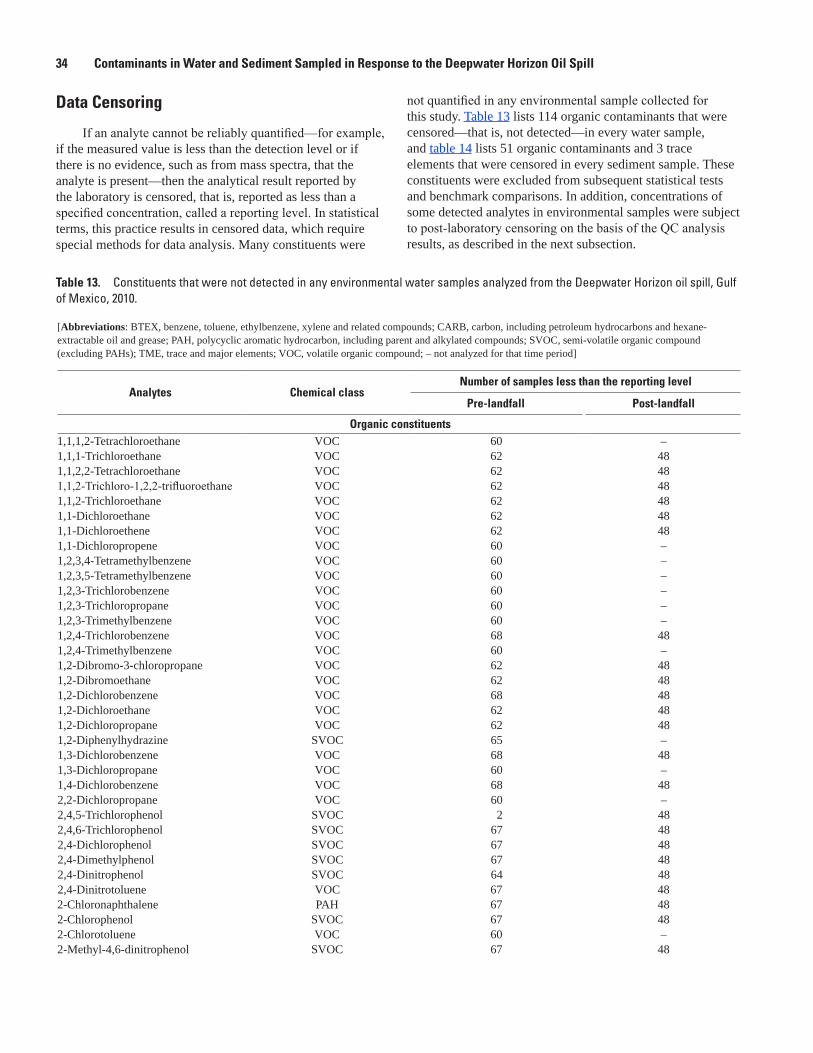
34 Contaminants in Water and Sediment Sampled in Response to the Deepwater Horizon Oil Spill
Data Censoring
If an analyte cannot be reliably quantified—for example, if the measured value is less than the detection level or if there is no evidence, such as from mass spectra, that the analyte is present—then the analytical result reported by the laboratory is censored, that is, reported as less than a specified concentration, called a reporting level. In statistical terms, this practice results in censored data, which require special methods for data analysis. Many constituents were
not quantified in any environmental sample collected for this study. Table 13 lists 114 organic contaminants that were censored—that is, not detected—in every water sample, and table 14 lists 51 organic contaminants and 3 trace elements that were censored in every sediment sample. These constituents were excluded from subsequent statistical tests and benchmark comparisons. In addition, concentrations of some detected analytes in environmental samples were subject to post-laboratory censoring on the basis of the QC analysis results, as described in the next subsection.
Table 13. Constituents that were not detected in any environmental water samples analyzed from the Deepwater Horizon oil spill, Gulf of Mexico, 2010.—Continued
[Abbreviations: BTEX, benzene, toluene, ethylbenzene, xylene and related compounds; CARB, carbon, including petroleum hydrocarbons and hexane-extractable oil and grease; PAH, polycyclic aromatic hydrocarbon, including parent and alkylated compounds; SVOC, semi-volatile organic compound (excluding PAHs); TME, trace and major elements; VOC, volatile organic compound; – not analyzed for that time period]
Analytes Chemical classNumber of samples less than the reporting level
Pre-landfall Post-landfall
Organic constituents1,1,1,2-Tetrachloroethane VOC 60 –1,1,1-Trichloroethane VOC 62 481,1,2,2-Tetrachloroethane VOC 62 481,1,2-Trichloro-1,2,2-trifluoroethane VOC 62 481,1,2-Trichloroethane VOC 62 481,1-Dichloroethane VOC 62 481,1-Dichloroethene VOC 62 481,1-Dichloropropene VOC 60 –1,2,3,4-Tetramethylbenzene VOC 60 –1,2,3,5-Tetramethylbenzene VOC 60 –1,2,3-Trichlorobenzene VOC 60 –1,2,3-Trichloropropane VOC 60 –1,2,3-Trimethylbenzene VOC 60 –1,2,4-Trichlorobenzene VOC 68 481,2,4-Trimethylbenzene VOC 60 –1,2-Dibromo-3-chloropropane VOC 62 481,2-Dibromoethane VOC 62 481,2-Dichlorobenzene VOC 68 481,2-Dichloroethane VOC 62 481,2-Dichloropropane VOC 62 481,2-Diphenylhydrazine SVOC 65 –1,3-Dichlorobenzene VOC 68 481,3-Dichloropropane VOC 60 –1,4-Dichlorobenzene VOC 68 482,2-Dichloropropane VOC 60 –2,4,5-Trichlorophenol SVOC 2 482,4,6-Trichlorophenol SVOC 67 482,4-Dichlorophenol SVOC 67 482,4-Dimethylphenol SVOC 67 482,4-Dinitrophenol SVOC 64 482,4-Dinitrotoluene VOC 67 482-Chloronaphthalene PAH 67 482-Chlorophenol SVOC 67 482-Chlorotoluene VOC 60 –2-Methyl-4,6-dinitrophenol SVOC 67 48
Table 13. Constituents that were not detected in any environmental water samples analyzed from the Deepwater Horizon oil spill, Gulf of Mexico, 2010.
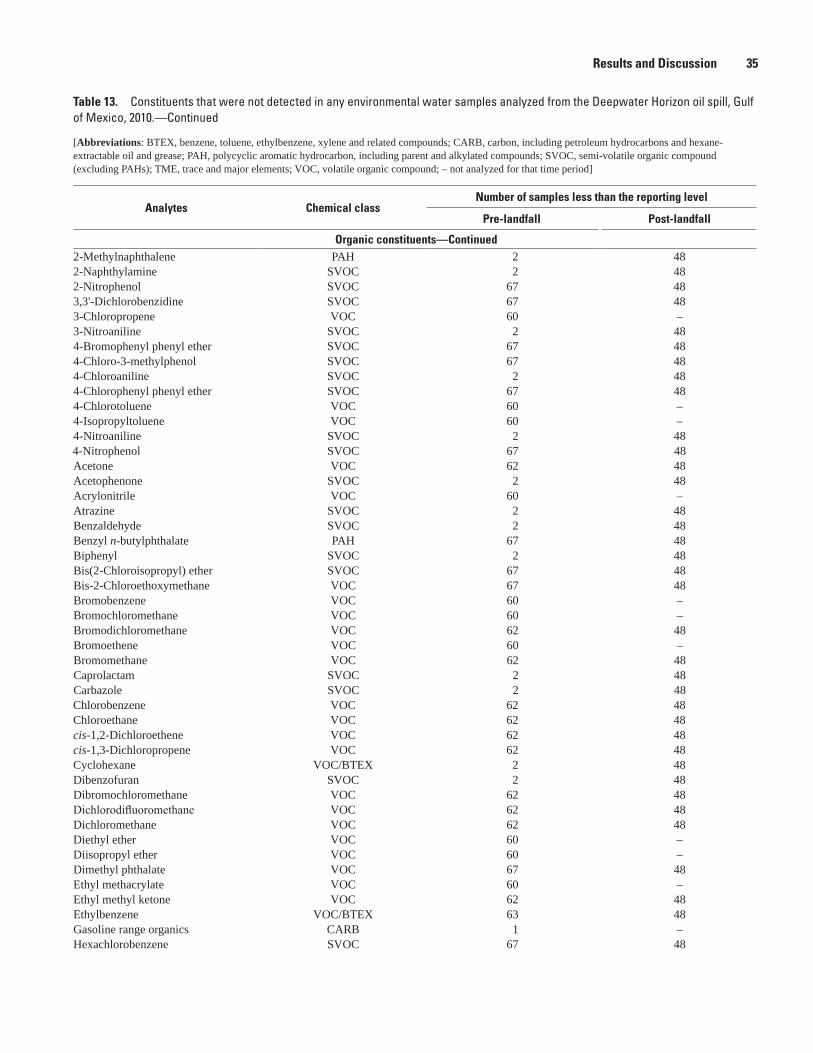
Results and Discussion 35
Table 13. Constituents that were not detected in any environmental water samples analyzed from the Deepwater Horizon oil spill, Gulf of Mexico, 2010.—Continued
[Abbreviations: BTEX, benzene, toluene, ethylbenzene, xylene and related compounds; CARB, carbon, including petroleum hydrocarbons and hexane-extractable oil and grease; PAH, polycyclic aromatic hydrocarbon, including parent and alkylated compounds; SVOC, semi-volatile organic compound (excluding PAHs); TME, trace and major elements; VOC, volatile organic compound; – not analyzed for that time period]
Analytes Chemical classNumber of samples less than the reporting level
Pre-landfall Post-landfall
Organic constituents—Continued2-Methylnaphthalene PAH 2 482-Naphthylamine SVOC 2 482-Nitrophenol SVOC 67 483,3'-Dichlorobenzidine SVOC 67 483-Chloropropene VOC 60 –3-Nitroaniline SVOC 2 484-Bromophenyl phenyl ether SVOC 67 484-Chloro-3-methylphenol SVOC 67 484-Chloroaniline SVOC 2 484-Chlorophenyl phenyl ether SVOC 67 484-Chlorotoluene VOC 60 –4-Isopropyltoluene VOC 60 –4-Nitroaniline SVOC 2 484-Nitrophenol SVOC 67 48Acetone VOC 62 48Acetophenone SVOC 2 48Acrylonitrile VOC 60 –Atrazine SVOC 2 48Benzaldehyde SVOC 2 48Benzyl n-butylphthalate PAH 67 48Biphenyl SVOC 2 48Bis(2-Chloroisopropyl) ether SVOC 67 48Bis-2-Chloroethoxymethane VOC 67 48Bromobenzene VOC 60 –Bromochloromethane VOC 60 –Bromodichloromethane VOC 62 48Bromoethene VOC 60 –Bromomethane VOC 62 48Caprolactam SVOC 2 48Carbazole SVOC 2 48Chlorobenzene VOC 62 48Chloroethane VOC 62 48cis-1,2-Dichloroethene VOC 62 48cis-1,3-Dichloropropene VOC 62 48Cyclohexane VOC/BTEX 2 48Dibenzofuran SVOC 2 48Dibromochloromethane VOC 62 48Dichlorodifluoromethane VOC 62 48Dichloromethane VOC 62 48Diethyl ether VOC 60 –Diisopropyl ether VOC 60 –Dimethyl phthalate VOC 67 48Ethyl methacrylate VOC 60 –Ethyl methyl ketone VOC 62 48Ethylbenzene VOC/BTEX 63 48Gasoline range organics CARB 1 –Hexachlorobenzene SVOC 67 48
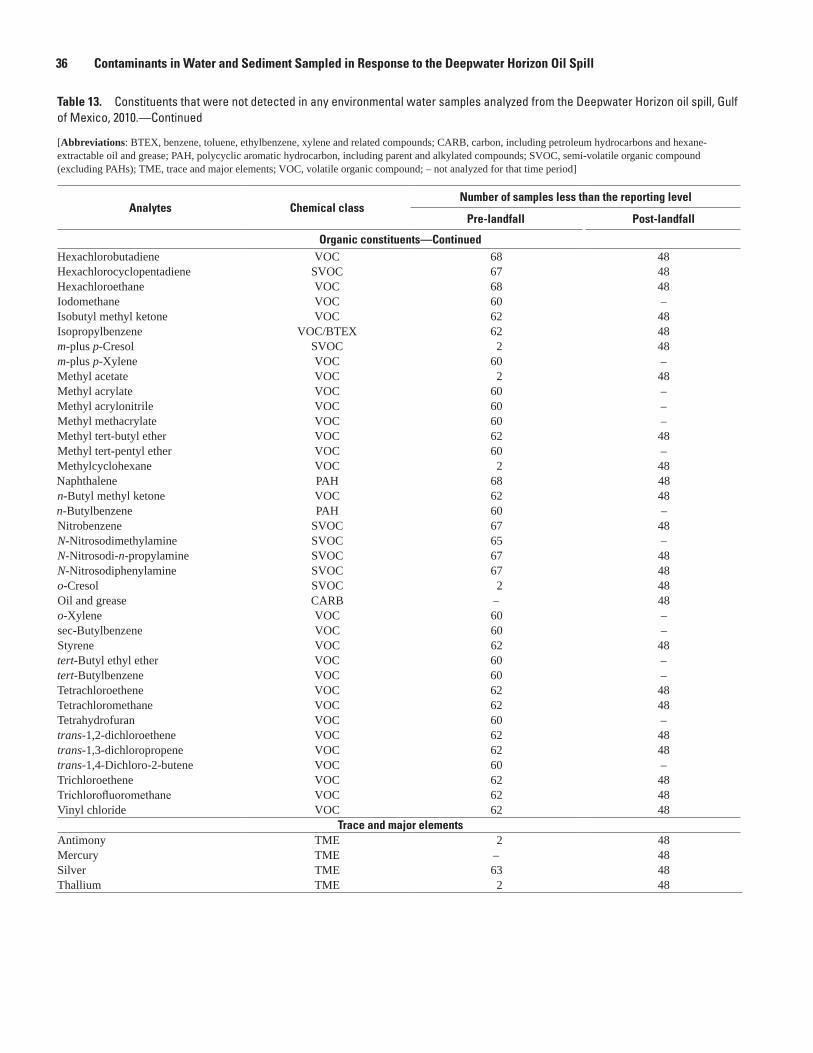
36 Contaminants in Water and Sediment Sampled in Response to the Deepwater Horizon Oil Spill
Table 13. Constituents that were not detected in any environmental water samples analyzed from the Deepwater Horizon oil spill, Gulf of Mexico, 2010.—Continued
[Abbreviations: BTEX, benzene, toluene, ethylbenzene, xylene and related compounds; CARB, carbon, including petroleum hydrocarbons and hexane-extractable oil and grease; PAH, polycyclic aromatic hydrocarbon, including parent and alkylated compounds; SVOC, semi-volatile organic compound (excluding PAHs); TME, trace and major elements; VOC, volatile organic compound; – not analyzed for that time period]
Analytes Chemical classNumber of samples less than the reporting level
Pre-landfall Post-landfall
Organic constituents—ContinuedHexachlorobutadiene VOC 68 48Hexachlorocyclopentadiene SVOC 67 48Hexachloroethane VOC 68 48Iodomethane VOC 60 –Isobutyl methyl ketone VOC 62 48Isopropylbenzene VOC/BTEX 62 48m-plus p-Cresol SVOC 2 48m-plus p-Xylene VOC 60 –Methyl acetate VOC 2 48Methyl acrylate VOC 60 –Methyl acrylonitrile VOC 60 –Methyl methacrylate VOC 60 –Methyl tert-butyl ether VOC 62 48Methyl tert-pentyl ether VOC 60 –Methylcyclohexane VOC 2 48Naphthalene PAH 68 48n-Butyl methyl ketone VOC 62 48n-Butylbenzene PAH 60 –Nitrobenzene SVOC 67 48N-Nitrosodimethylamine SVOC 65 –N-Nitrosodi-n-propylamine SVOC 67 48N-Nitrosodiphenylamine SVOC 67 48o-Cresol SVOC 2 48Oil and grease CARB – 48o-Xylene VOC 60 –sec-Butylbenzene VOC 60 –Styrene VOC 62 48tert-Butyl ethyl ether VOC 60 –tert-Butylbenzene VOC 60 –Tetrachloroethene VOC 62 48Tetrachloromethane VOC 62 48Tetrahydrofuran VOC 60 –trans-1,2-dichloroethene VOC 62 48trans-1,3-dichloropropene VOC 62 48trans-1,4-Dichloro-2-butene VOC 60 –Trichloroethene VOC 62 48Trichlorofluoromethane VOC 62 48Vinyl chloride VOC 62 48
Trace and major elementsAntimony TME 2 48Mercury TME – 48Silver TME 63 48Thallium TME 2 48

Results and Discussion 37
Table 14. Constituents that were not detected in any environmental sediment samples analyzed from the Deepwater Horizon oil spill, Gulf of Mexico, 2010.—Continued
[Sediment samples are whole sediment unless specified otherwise. Abbreviations: CARB, carbon, including petroleum hydrocarbons and hexane-extractable oil and grease; PAH, polycyclic aromatic hydrocarbon; SVOC, semi-volatile organic compound (excluding PAHs); TME, trace and major elements; VOC, volatile organic compound; <, less than; – not analyzed for that time period]
Analytes Chemical classNumber of samples less than the reporting level
Pre-landfall Post-landfall
Organic constituents1,2,4-Trichlorobenzene SVOC 68 –1-Methylfluorene PAH 69 –2,4,5-Trichlorophenol SVOC – 482,4,6-Trichlorophenol SVOC – 482,4-Dichlorophenol SVOC – 482,4-Dimethylphenol SVOC – 482,4-Dinitrophenol SVOC – 482,4-Dinitrotoluene SVOC – 482,6-Dinitrotoluene SVOC – 482-Chloronaphthalene PAH – 482-Chlorophenol SVOC – 482-Methyl-4,6-dinitrophenol SVOC – 482-Methylanthracene PAH 69 –2-Naphthylamine PAH – 482-Nitrophenol SVOC – 483,3'-Dichlorobenzidine SVOC – 483-Nitroaniline SVOC – 484-Bromophenyl phenyl ether SVOC – 484-Chloro-3-methylphenol SVOC – 484-Chloroaniline SVOC – 484-Chlorophenyl phenyl ether SVOC – 484-Nitroaniline SVOC – 484-Nitrophenol SVOC – 48Acetophenone SVOC – 48Atrazine SVOC – 48Benzaldehyde SVOC – 48Benzyl n-butylphthalate SVOC – 48Bis(2-Chloro-1-methylethyl) ether SVOC – 48Bis(2-Chloroethoxy)methane SVOC – 48Bis(2-Chloroethyl) ether SVOC – 48Caprolactam SVOC – 48Dibenzofuran SVOC – 48Diesel range organics (C10-C36) CARB 2 –Diethylphthalate SVOC 69 48Dimethylphthalate SVOC – 48Di-n-butyl phthalate SVOC – 48Di-n-octyl phthalate SVOC – 48Hexachlorobenzene SVOC 69 48Hexachlorobutadiene VOC – 48Hexachlorocyclopentadiene SVOC – 48Hexachloroethane SVOC – 48Isophorone SVOC – 48m-plus p-Cresol SVOC – 48Nitrobenzene SVOC – 48
Table 14. Constituents that were not detected in any environmental sediment samples analyzed from the Deepwater Horizon oil spill, Gulf of Mexico, 2010.

38 Contaminants in Water and Sediment Sampled in Response to the Deepwater Horizon Oil Spill
Censoring on the Basis of Quality-Control ResultsFor analytes detected in laboratory, field, or trip blanks,
concentrations in environmental samples were censored at raised censoring levels on the basis of guidance from the U.S. Environmental Protection Agency (1989, pages 16–17 in chapter 5). Field and trip blanks were available for water samples only, and laboratory reagent blanks were available for both water and sediment. For analytes detected in these blanks, a raised censoring level equal to five times the maximum concentration detected in the blanks was applied to results in any associated environmental samples. This raised censoring level ensures that a reported detection has a high probability of reflecting the actual concentration in the environmental sample, rather than the effect of incidental contamination from sampling and analysis procedures. Quantified results less than this raised censoring level were changed to censored values and reported as less than the quantified value. For example, naphthalene was detected in a post-landfall field blank, so was censored at a raised censoring level of 0.8. A quantified result of 0.5 would be censored to less than 0.5, indicating that the environmental contaminant concentration in that sample is no more than 0.5, but it could be less. For a few common laboratory contaminants—acetone, dichloromethane, diethyl phthalate, methyl ethyl ketone, and toluene—the censoring level was raised to 10 times the maximum concentration detected in the blank.
Four organic contaminants in sediment, four trace or major elements in water, and two nutrients in water had one or more detections in laboratory reagent blanks. Concentrations in all environmental samples, however, were more than five times the reagent blank concentration, except for the two nutrients in water—ammonia plus organic
nitrogen and phosphorus. Because a reagent blank sample is associated with a particular set of environmental samples, censoring for reagent-blank contamination was applied only to those environmental samples that had contamination in the associated reagent blank. Therefore, results for ammonia plus organic nitrogen were censored in 8 of the 48 post-landfall water samples, and phosphorus was censored in 26 of the 48 post-landfall water samples and in 15 of the 68 pre-landfall water samples.
In this study, it was not possible to associate a particular field blank with each environmental sample, so an alternative procedure had to be used to estimate potential contamination. One option was to determine the statistical distribution of concentrations in a set of representative blanks and assume this same distribution applied to potential contamination in the environmental samples (Mueller and Titus, 2005; Apodaca and others, 2006). This procedure requires more than 20 blanks to estimate the 90th percentile of this distribution with reasonable confidence. Using the six blanks available for this study, only the lower 60th to 70th percentile of this distribution can be estimated; therefore, this approach could underestimate the extent of contamination in environmental samples. In the present study, the most conservative approach was used, which assumes that contamination identified in any field or trip blank could occur in all environmental samples collected during the same sampling period. Although this approach can overestimate the extent of incidental contamination, no other procedure would ensure that this extent would not be underestimated. Therefore, detection of an analyte in any field or trip blank resulted in the censoring of concentrations of that analyte in all environmental samples collected during the same sampling period.
Table 14. Constituents that were not detected in any environmental sediment samples analyzed from the Deepwater Horizon oil spill, Gulf of Mexico, 2010.—Continued
[Sediment samples are whole sediment unless specified otherwise. Abbreviations: CARB, carbon, including petroleum hydrocarbons and hexane-extractable oil and grease; PAH, polycyclic aromatic hydrocarbon; SVOC, semi-volatile organic compound (excluding PAHs); TME, trace and major elements; VOC, volatile organic compound; <, less than; – not analyzed for that time period]
Analytes Chemical classNumber of samples less than the reporting level
Pre-landfall Post-landfall
Organic constituents—ContinuedN-Nitrosodi-n-propylamine SVOC – 48N-Nitrosodiphenylamine SVOC – 48o-Cresol SVOC – 48Pentachloroanisole SVOC 69 –Pentachloronitrobenzene SVOC 69 –Pentachlorophenol SVOC – 48Phenanthridine SVOC 69 –Phenol SVOC – 48
Trace and major elementsThallium, in <63-micrometer sediment TME 63 37Thallium TME 70 49Uranium TME 70 49
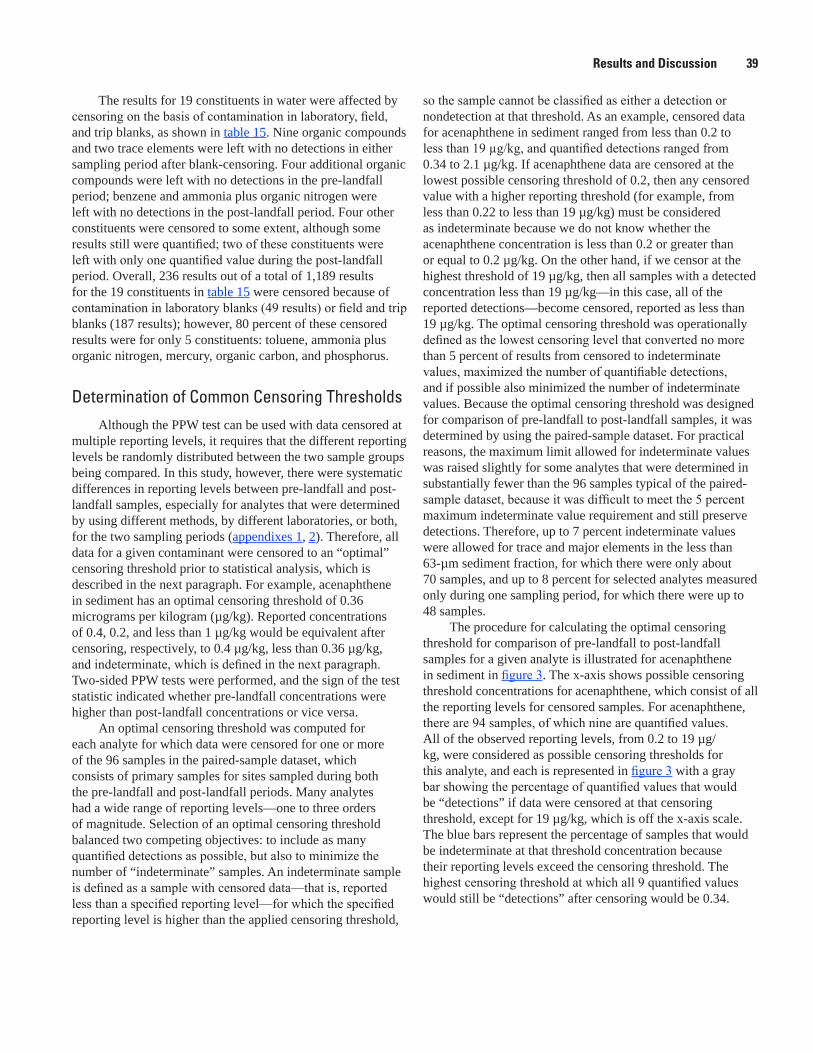
Results and Discussion 39
The results for 19 constituents in water were affected by censoring on the basis of contamination in laboratory, field, and trip blanks, as shown in table 15. Nine organic compounds and two trace elements were left with no detections in either sampling period after blank-censoring. Four additional organic compounds were left with no detections in the pre-landfall period; benzene and ammonia plus organic nitrogen were left with no detections in the post-landfall period. Four other constituents were censored to some extent, although some results still were quantified; two of these constituents were left with only one quantified value during the post-landfall period. Overall, 236 results out of a total of 1,189 results for the 19 constituents in table 15 were censored because of contamination in laboratory blanks (49 results) or field and trip blanks (187 results); however, 80 percent of these censored results were for only 5 constituents: toluene, ammonia plus organic nitrogen, mercury, organic carbon, and phosphorus.
Determination of Common Censoring ThresholdsAlthough the PPW test can be used with data censored at
multiple reporting levels, it requires that the different reporting levels be randomly distributed between the two sample groups being compared. In this study, however, there were systematic differences in reporting levels between pre-landfall and post-landfall samples, especially for analytes that were determined by using different methods, by different laboratories, or both, for the two sampling periods (appendixes 1, 2). Therefore, all data for a given contaminant were censored to an “optimal” censoring threshold prior to statistical analysis, which is described in the next paragraph. For example, acenaphthene in sediment has an optimal censoring threshold of 0.36 micrograms per kilogram (µg/kg). Reported concentrations of 0.4, 0.2, and less than 1 µg/kg would be equivalent after censoring, respectively, to 0.4 µg/kg, less than 0.36 µg/kg, and indeterminate, which is defined in the next paragraph. Two-sided PPW tests were performed, and the sign of the test statistic indicated whether pre-landfall concentrations were higher than post-landfall concentrations or vice versa.
An optimal censoring threshold was computed for each analyte for which data were censored for one or more of the 96 samples in the paired-sample dataset, which consists of primary samples for sites sampled during both the pre-landfall and post-landfall periods. Many analytes had a wide range of reporting levels—one to three orders of magnitude. Selection of an optimal censoring threshold balanced two competing objectives: to include as many quantified detections as possible, but also to minimize the number of “indeterminate” samples. An indeterminate sample is defined as a sample with censored data—that is, reported less than a specified reporting level—for which the specified reporting level is higher than the applied censoring threshold,
so the sample cannot be classified as either a detection or nondetection at that threshold. As an example, censored data for acenaphthene in sediment ranged from less than 0.2 to less than 19 µg/kg, and quantified detections ranged from 0.34 to 2.1 µg/kg. If acenaphthene data are censored at the lowest possible censoring threshold of 0.2, then any censored value with a higher reporting threshold (for example, from less than 0.22 to less than 19 µg/kg) must be considered as indeterminate because we do not know whether the acenaphthene concentration is less than 0.2 or greater than or equal to 0.2 µg/kg. On the other hand, if we censor at the highest threshold of 19 µg/kg, then all samples with a detected concentration less than 19 µg/kg—in this case, all of the reported detections—become censored, reported as less than 19 µg/kg. The optimal censoring threshold was operationally defined as the lowest censoring level that converted no more than 5 percent of results from censored to indeterminate values, maximized the number of quantifiable detections, and if possible also minimized the number of indeterminate values. Because the optimal censoring threshold was designed for comparison of pre-landfall to post-landfall samples, it was determined by using the paired-sample dataset. For practical reasons, the maximum limit allowed for indeterminate values was raised slightly for some analytes that were determined in substantially fewer than the 96 samples typical of the paired-sample dataset, because it was difficult to meet the 5 percent maximum indeterminate value requirement and still preserve detections. Therefore, up to 7 percent indeterminate values were allowed for trace and major elements in the less than 63-µm sediment fraction, for which there were only about 70 samples, and up to 8 percent for selected analytes measured only during one sampling period, for which there were up to 48 samples.
The procedure for calculating the optimal censoring threshold for comparison of pre-landfall to post-landfall samples for a given analyte is illustrated for acenaphthene in sediment in figure 3. The x-axis shows possible censoring threshold concentrations for acenaphthene, which consist of all the reporting levels for censored samples. For acenaphthene, there are 94 samples, of which nine are quantified values. All of the observed reporting levels, from 0.2 to 19 µg/kg, were considered as possible censoring thresholds for this analyte, and each is represented in figure 3 with a gray bar showing the percentage of quantified values that would be “detections” if data were censored at that censoring threshold, except for 19 µg/kg, which is off the x-axis scale. The blue bars represent the percentage of samples that would be indeterminate at that threshold concentration because their reporting levels exceed the censoring threshold. The highest censoring threshold at which all 9 quantified values would still be “detections” after censoring would be 0.34.

40 Contaminants in Water and Sediment Sampled in Response to the Deepwater Horizon Oil Spill Ta
ble
15.
Cons
titue
nts
anal
yzed
in w
ater
that
wer
e af
fect
ed b
y ce
nsor
ing
beca
use
of c
onta
min
atio
n de
tect
ed in
labo
rato
ry, f
ield
, and
trip
bla
nks
from
the
Deep
wat
er H
orizo
n oi
l sp
ill, G
ulf o
f Mex
ico,
201
0.
[Abb
revi
atio
ns: B
TEX
, ben
zene
, tol
uene
, eth
ylbe
nzen
e, x
ylen
e an
d re
late
d co
mpo
unds
; CA
RB
, car
bon,
incl
udin
g pe
trole
um h
ydro
carb
ons a
nd h
exan
e-ex
tract
able
oil
and
grea
se; N
UTR
, nut
rient
; PA
H,
poly
cycl
ic a
rom
atic
hyd
roca
rbon
; pos
t, po
st-la
ndfa
ll; p
re, p
re-la
ndfa
ll; T
ME,
trac
e an
d m
ajor
ele
men
ts; V
OC
, vol
atile
org
anic
com
poun
d; –
, not
fully
cen
sore
d]
Ana
lyte
Chem
ical
cl
ass
Sam
plin
g
peri
odSa
mpl
es
Resu
lts a
fter l
abor
ator
y-bl
ank
cens
orin
gRe
sults
afte
r fie
ld a
nd tr
ip-b
lank
cen
sori
ng
Qua
ntifi
ed
resu
lts
Det
ectio
n
freq
uenc
y (p
erce
nt)
Sam
ples
ce
nsor
ed d
ue
to b
lank
s
Qua
ntifi
ed
resu
lts
Det
ectio
n
freq
uenc
y (p
erce
nt)
100
perc
ent
cens
ored
1
Org
anic
con
tam
inan
ts1,
2,3,
5-Te
tram
ethy
l-ben
zene
VO
CPr
e60
12
10
0Ye
s2
1,2,
3-Tr
imet
hyl-b
enze
neV
OC
Pre
602
32
00
Yes2
1,2,
4-Tr
imet
hyl-b
enze
neV
OC
Pre
603
53
00
Yes2
Ace
tone
VO
CPr
e62
58
50
0Ye
s3
Ben
zene
VO
C/B
TEX
Post
483
63
00
Post
onl
yD
ichl
orom
etha
neV
OC
Pre
623
53
00
Yes
Dic
hlor
omet
hane
VO
CPo
st48
48
40
0Ye
sD
isso
lved
org
anic
car
bon
CA
RB
Pre
6262
100
4121
34–
Die
sel r
ange
org
anic
sC
AR
BPo
st48
613
51
2–
Ethy
lben
zene
VO
C/B
TEX
Pre
633
53
00
Yes3
Nap
htha
lene
PAH
Post
481
21
00
Yes3
Tolu
ene
VO
C/B
TEX
Pre
6315
2415
00
Pre
only
Tric
hlor
omet
hane
VO
CPr
e62
35
30
0Pr
e on
lyX
ylen
e, m
eta
plus
par
aV
OC
/BTE
XPr
e60
47
40
0Ye
s2
Xyl
ene,
ort
hoV
OC
/BTE
XPr
e60
35
30
0Ye
s2
Tra
ce a
nd m
ajor
ele
men
ts, a
nd n
utri
ents
in w
ater
Am
mon
ia p
lus o
rgan
ic
nitro
gen
as N
NU
TRPo
st48
4 40
8340
00
Post
onl
y
Cop
per
TME
Post
4822
463
1940
–M
ercu
ryTM
EPo
st48
2348
230
0Ye
s2
Phos
phor
us a
s PN
UTR
Post
484 2
246
211
2–
Phos
phor
us a
s PN
UTR
Pre
684 5
378
053
78–
Silv
erTM
EPr
e63
46
40
0Ye
s3
1 List
s ana
lyte
s tha
t are
100
per
cent
cen
sore
d (n
o de
tect
ions
rem
aini
ng) a
fter b
lank
-cen
sorin
g. P
ost o
nly,
det
ecte
d in
pre
-land
fall
sam
ples
; pre
onl
y, d
etec
ted
in p
ost-l
andf
all s
ampl
es.
2 Dat
a av
aila
ble
only
for o
ne sa
mpl
ing
perio
d.3 N
ot d
etec
ted
(with
out b
lank
-cen
sorin
g) in
the
othe
r sam
plin
g pe
riod.
4 Bec
ause
of l
abor
ator
y-bl
ank
cont
amin
atio
n, re
sults
wer
e ce
nsor
ed fo
r am
mon
ia p
lus o
rgan
ic n
itrog
en in
8 o
f 48
post
-land
fall
sam
ples
, pho
spho
rus i
n 26
of 4
8 po
st-la
ndfa
ll sa
mpl
es, a
nd p
hosp
horu
s in
15 o
f 68
pre
-land
fall
sam
ples
.
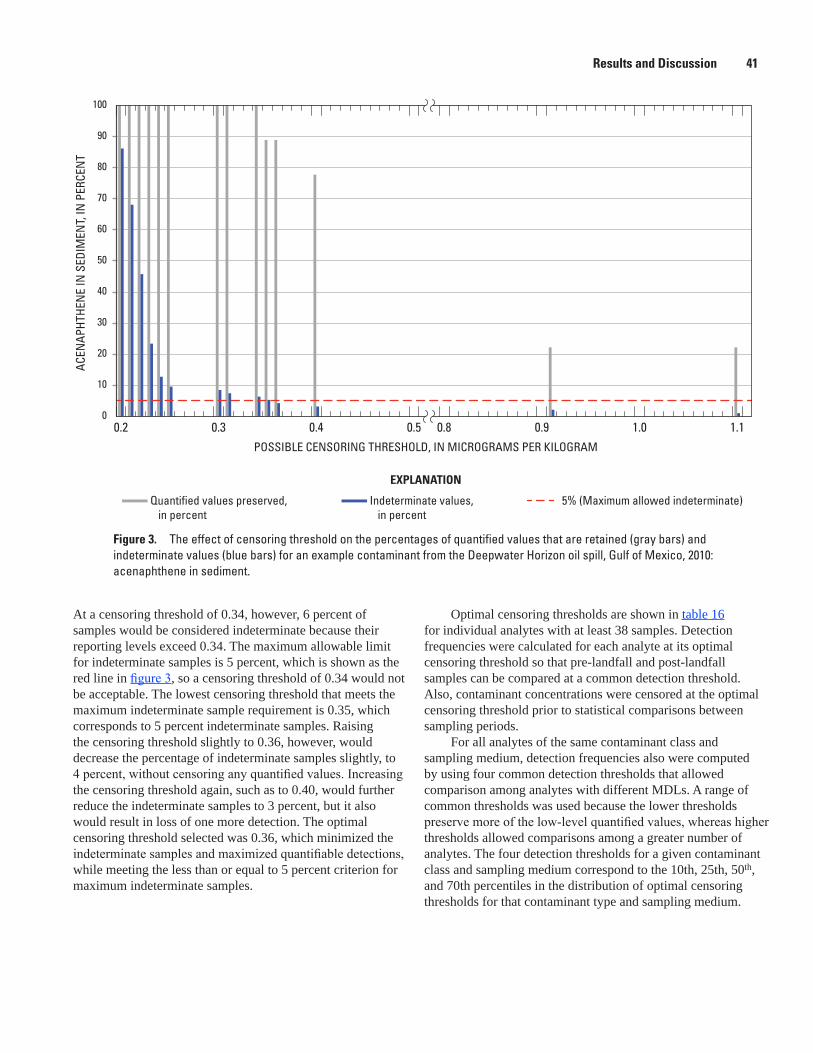
Results and Discussion 41
0
10
20
30
40
50
60
70
80
90
100
0.2 0.3 0.4 0.5 0.8 0.9 1.0 1.1 POSSIBLE CENSORING THRESHOLD, IN MICROGRAMS PER KILOGRAM
EXPLANATION
ACEN
APHT
HEN
E IN
SED
IMEN
T, IN
PER
CEN
T
Quantified values preserved, in percent
Indeterminate values, in percent
5% (Maximum allowed indeterminate)
sac12-0452_Figure 03
Figure 3. The effect of censoring threshold on the percentages of quantified values that are retained (gray bars) and indeterminate values (blue bars) for an example contaminant from the Deepwater Horizon oil spill, Gulf of Mexico, 2010: acenaphthene in sediment.
At a censoring threshold of 0.34, however, 6 percent of samples would be considered indeterminate because their reporting levels exceed 0.34. The maximum allowable limit for indeterminate samples is 5 percent, which is shown as the red line in figure 3, so a censoring threshold of 0.34 would not be acceptable. The lowest censoring threshold that meets the maximum indeterminate sample requirement is 0.35, which corresponds to 5 percent indeterminate samples. Raising the censoring threshold slightly to 0.36, however, would decrease the percentage of indeterminate samples slightly, to 4 percent, without censoring any quantified values. Increasing the censoring threshold again, such as to 0.40, would further reduce the indeterminate samples to 3 percent, but it also would result in loss of one more detection. The optimal censoring threshold selected was 0.36, which minimized the indeterminate samples and maximized quantifiable detections, while meeting the less than or equal to 5 percent criterion for maximum indeterminate samples.
Optimal censoring thresholds are shown in table 16 for individual analytes with at least 38 samples. Detection frequencies were calculated for each analyte at its optimal censoring threshold so that pre-landfall and post-landfall samples can be compared at a common detection threshold. Also, contaminant concentrations were censored at the optimal censoring threshold prior to statistical comparisons between sampling periods.
For all analytes of the same contaminant class and sampling medium, detection frequencies also were computed by using four common detection thresholds that allowed comparison among analytes with different MDLs. A range of common thresholds was used because the lower thresholds preserve more of the low-level quantified values, whereas higher thresholds allowed comparisons among a greater number of analytes. The four detection thresholds for a given contaminant class and sampling medium correspond to the 10th, 25th, 50th, and 70th percentiles in the distribution of optimal censoring thresholds for that contaminant type and sampling medium.
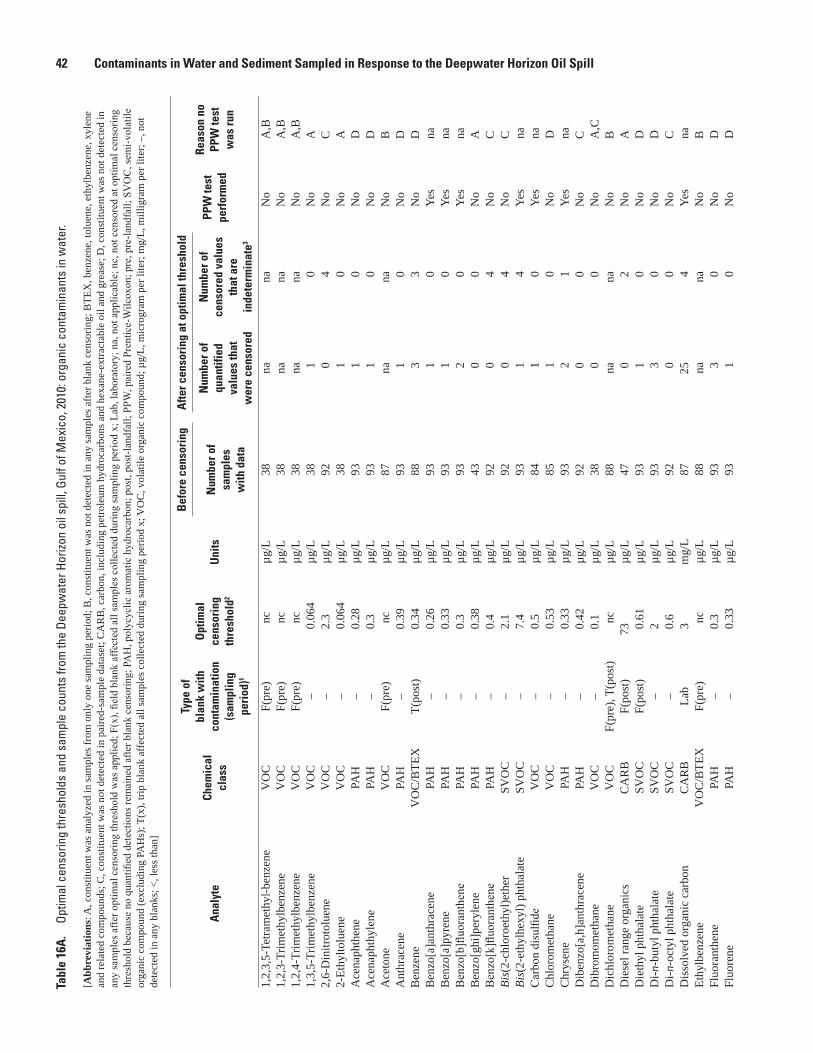
42 Contaminants in Water and Sediment Sampled in Response to the Deepwater Horizon Oil Spill Ta
ble
16A
. Op
timal
cen
sorin
g th
resh
olds
and
sam
ple
coun
ts fr
om th
e De
epw
ater
Hor
izon
oil s
pill,
Gul
f of M
exic
o, 2
010:
org
anic
con
tam
inan
ts in
wat
er.—
Cont
inue
d
[Abb
revi
atio
ns: A
, con
stitu
ent w
as a
naly
zed
in sa
mpl
es fr
om o
nly
one
sam
plin
g pe
riod;
B, c
onst
ituen
t was
not
det
ecte
d in
any
sam
ples
afte
r bla
nk c
enso
ring;
BTE
X, b
enze
ne, t
olue
ne, e
thyl
benz
ene,
xyl
ene
and
rela
ted
com
poun
ds; C
, con
stitu
ent w
as n
ot d
etec
ted
in p
aire
d-sa
mpl
e da
tase
t; C
AR
B, c
arbo
n, in
clud
ing
petro
leum
hyd
roca
rbon
s and
hex
ane-
extra
ctab
le o
il an
d gr
ease
; D, c
onst
ituen
t was
not
det
ecte
d in
an
y sa
mpl
es a
fter o
ptim
al c
enso
ring
thre
shol
d w
as a
pplie
d; F
(x),
field
bla
nk a
ffect
ed a
ll sa
mpl
es c
olle
cted
dur
ing
sam
plin
g pe
riod
x; L
ab, l
abor
ator
y; n
a, n
ot a
pplic
able
; nc,
not
cen
sore
d at
opt
imal
cen
sorin
g th
resh
old
beca
use
no q
uant
ified
det
ectio
ns re
mai
ned
afte
r bla
nk c
enso
ring;
PA
H, p
olyc
yclic
aro
mat
ic h
ydro
carb
on; p
ost,
post
-land
fall;
PPW
, pai
red
Pren
tice-
Wilc
oxon
; pre
, pre
-land
fall;
SV
OC
, sem
i-vol
atile
or
gani
c co
mpo
und
(exc
ludi
ng P
AH
s); T
(x),
trip
blan
k af
fect
ed a
ll sa
mpl
es c
olle
cted
dur
ing
sam
plin
g pe
riod
x; V
OC
, vol
atile
org
anic
com
poun
d; µ
g/L,
mic
rogr
am p
er li
ter;
mg/
L, m
illig
ram
per
lite
r; –,
not
de
tect
ed in
any
bla
nks;
<, l
ess t
han]
Ana
lyte
Chem
ical
cl
ass
Type
of
blan
k w
ith
cont
amin
atio
n
(sam
plin
g pe
riod
)1
Opt
imal
ce
nsor
ing
th
resh
old2
Uni
ts
Bef
ore
cens
orin
gA
fter c
enso
ring
at o
ptim
al th
resh
old
PPW
test
pe
rfor
med
Reas
on n
o
PPW
test
w
as ru
n
Num
ber o
f sa
mpl
es
with
dat
a
Num
ber o
f qu
antif
ied
va
lues
that
w
ere
cens
ored
Num
ber o
f ce
nsor
ed v
alue
s th
at a
re
inde
term
inat
e3
1,2,
3,5-
Tetra
met
hyl-b
enze
neV
OC
F(pr
e)nc
µg/L
38na
naN
oA
,B1,
2,3-
Trim
ethy
lben
zene
VO
CF(
pre)
ncµg
/L38
nana
No
A,B
1,2,
4-Tr
imet
hylb
enze
neV
OC
F(pr
e)nc
µg/L
38na
naN
oA
,B1,
3,5-
Trim
ethy
lben
zene
VO
C–
0.06
4µg
/L38
10
No
A2,
6-D
initr
otol
uene
VO
C–
2.3
µg/L
920
4N
oC
2-Et
hylto
luen
eV
OC
–0.
064
µg/L
381
0N
oA
Ace
naph
then
ePA
H–
0.28
µg/L
931
0N
oD
Ace
naph
thyl
ene
PAH
–0.
3µg
/L93
10
No
DA
ceto
neV
OC
F(pr
e)nc
µg/L
87na
naN
oB
Ant
hrac
ene
PAH
–0.
39µg
/L93
10
No
DB
enze
neV
OC
/BTE
XT(
post
)0.
34µg
/L88
33
No
DB
enzo
[a]a
nthr
acen
ePA
H–
0.26
µg/L
931
0Ye
sna
Ben
zo[a
]pyr
ene
PAH
–0.
33µg
/L93
10
Yes
naB
enzo
[b]fl
uora
nthe
nePA
H–
0.3
µg/L
932
0Ye
sna
Ben
zo[g
hi]p
eryl
ene
PAH
–0.
38µg
/L43
00
No
AB
enzo
[k]fl
uora
nthe
nePA
H–
0.4
µg/L
920
4N
oC
Bis(
2-ch
loro
ethy
l)eth
erSV
OC
–2.
1µg
/L92
04
No
CBi
s(2-
ethy
lhex
yl) p
htha
late
SVO
C–
7.4
µg/L
931
4Ye
sna
Car
bon
disu
lfide
VO
C–
0.5
µg/L
841
0Ye
sna
Chl
orom
etha
neV
OC
–0.
53µg
/L85
10
No
DC
hrys
ene
PAH
–0.
33µg
/L93
21
Yes
naD
iben
zo[a
,h]a
nthr
acen
ePA
H–
0.42
µg/L
920
0N
oC
Dib
rom
omet
hane
VO
C–
0.1
µg/L
380
0N
oA
,CD
ichl
orom
etha
neV
OC
F(pr
e), T
(pos
t)nc
µg/L
88na
naN
oB
Die
sel r
ange
org
anic
sC
AR
BF(
post
)73
µg/L
470
2N
oA
Die
thyl
pht
hala
teSV
OC
F(po
st)
0.61
µg/L
931
0N
oD
Di-n
-but
yl p
htha
late
SVO
C–
2µg
/L93
30
No
DD
i-n-o
ctyl
pht
hala
teSV
OC
–0.
6µg
/L92
00
No
CD
isso
lved
org
anic
car
bon
CA
RB
Lab
3m
g/L
8725
4Ye
sna
Ethy
lben
zene
VO
C/B
TEX
F(pr
e)nc
µg/L
88na
naN
oB
Fluo
rant
hene
PAH
–0.
3µg
/L93
30
No
DFl
uore
nePA
H–
0.33
µg/L
931
0N
oD
Tabl
e 16
A.
Optim
al c
enso
ring
thre
shol
ds a
nd s
ampl
e co
unts
from
the
Deep
wat
er H
orizo
n oi
l spi
ll, G
ulf o
f Mex
ico,
201
0: o
rgan
ic c
onta
min
ants
in w
ater
.
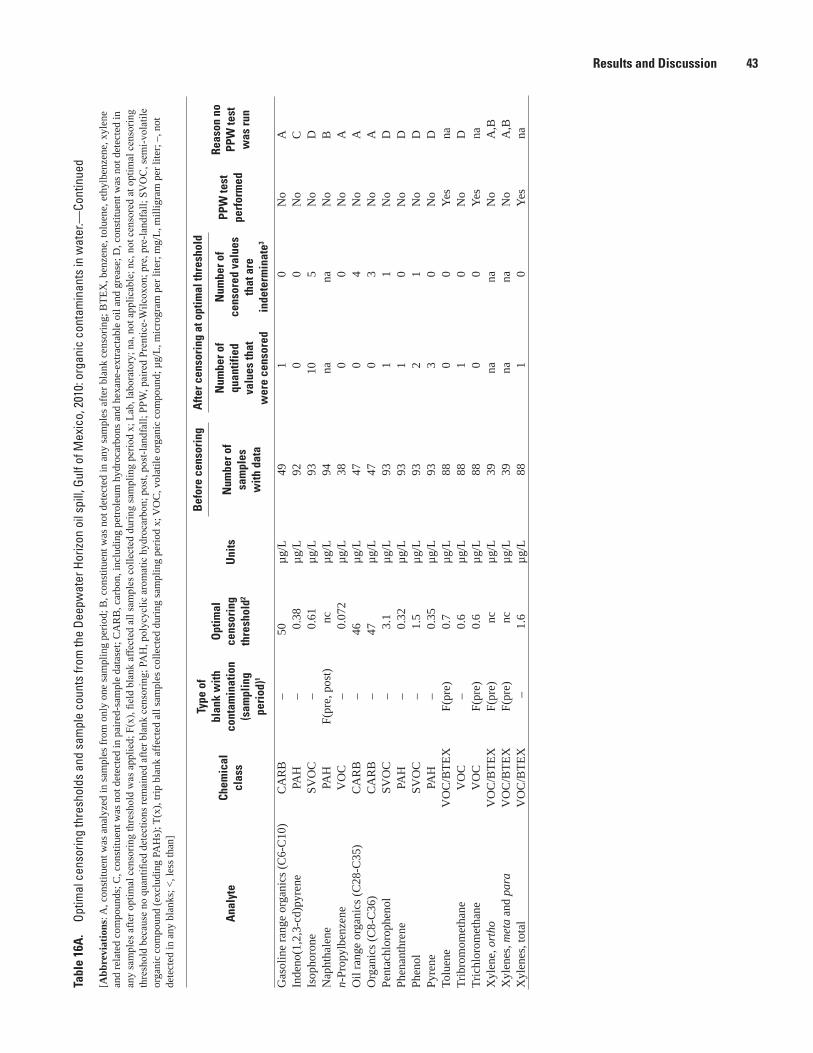
Results and Discussion 43Ta
ble
16A
. Op
timal
cen
sorin
g th
resh
olds
and
sam
ple
coun
ts fr
om th
e De
epw
ater
Hor
izon
oil s
pill,
Gul
f of M
exic
o, 2
010:
org
anic
con
tam
inan
ts in
wat
er.—
Cont
inue
d
[Abb
revi
atio
ns: A
, con
stitu
ent w
as a
naly
zed
in sa
mpl
es fr
om o
nly
one
sam
plin
g pe
riod;
B, c
onst
ituen
t was
not
det
ecte
d in
any
sam
ples
afte
r bla
nk c
enso
ring;
BTE
X, b
enze
ne, t
olue
ne, e
thyl
benz
ene,
xyl
ene
and
rela
ted
com
poun
ds; C
, con
stitu
ent w
as n
ot d
etec
ted
in p
aire
d-sa
mpl
e da
tase
t; C
AR
B, c
arbo
n, in
clud
ing
petro
leum
hyd
roca
rbon
s and
hex
ane-
extra
ctab
le o
il an
d gr
ease
; D, c
onst
ituen
t was
not
det
ecte
d in
an
y sa
mpl
es a
fter o
ptim
al c
enso
ring
thre
shol
d w
as a
pplie
d; F
(x),
field
bla
nk a
ffect
ed a
ll sa
mpl
es c
olle
cted
dur
ing
sam
plin
g pe
riod
x; L
ab, l
abor
ator
y; n
a, n
ot a
pplic
able
; nc,
not
cen
sore
d at
opt
imal
cen
sorin
g th
resh
old
beca
use
no q
uant
ified
det
ectio
ns re
mai
ned
afte
r bla
nk c
enso
ring;
PA
H, p
olyc
yclic
aro
mat
ic h
ydro
carb
on; p
ost,
post
-land
fall;
PPW
, pai
red
Pren
tice-
Wilc
oxon
; pre
, pre
-land
fall;
SV
OC
, sem
i-vol
atile
or
gani
c co
mpo
und
(exc
ludi
ng P
AH
s); T
(x),
trip
blan
k af
fect
ed a
ll sa
mpl
es c
olle
cted
dur
ing
sam
plin
g pe
riod
x; V
OC
, vol
atile
org
anic
com
poun
d; µ
g/L,
mic
rogr
am p
er li
ter;
mg/
L, m
illig
ram
per
lite
r; –,
not
de
tect
ed in
any
bla
nks;
<, l
ess t
han]
Ana
lyte
Chem
ical
cl
ass
Type
of
blan
k w
ith
cont
amin
atio
n
(sam
plin
g pe
riod
)1
Opt
imal
ce
nsor
ing
th
resh
old2
Uni
ts
Bef
ore
cens
orin
gA
fter c
enso
ring
at o
ptim
al th
resh
old
PPW
test
pe
rfor
med
Reas
on n
o
PPW
test
w
as ru
n
Num
ber o
f sa
mpl
es
with
dat
a
Num
ber o
f qu
antif
ied
va
lues
that
w
ere
cens
ored
Num
ber o
f ce
nsor
ed v
alue
s th
at a
re
inde
term
inat
e3
Gas
olin
e ra
nge
orga
nics
(C6-
C10
)C
AR
B–
50µg
/L49
10
No
AIn
deno
(1,2
,3-c
d)py
rene
PAH
–0.
38µg
/L92
00
No
CIs
opho
rone
SVO
C–
0.61
µg/L
9310
5N
oD
Nap
htha
lene
PAH
F(pr
e, p
ost)
ncµg
/L94
nana
No
Bn-
Prop
ylbe
nzen
eV
OC
–0.
072
µg/L
380
0N
oA
Oil
rang
e or
gani
cs (C
28-C
35)
CA
RB
–46
µg/L
470
4N
oA
Org
anic
s (C
8-C
36)
CA
RB
–47
µg/L
470
3N
oA
Pent
achl
orop
heno
lSV
OC
–3.
1µg
/L93
11
No
DPh
enan
thre
nePA
H–
0.32
µg/L
931
0N
oD
Phen
olSV
OC
–1.
5µg
/L93
21
No
DPy
rene
PAH
–0.
35µg
/L93
30
No
DTo
luen
eV
OC
/BTE
XF(
pre)
0.7
µg/L
880
0Ye
sna
Trib
rom
omet
hane
VO
C–
0.6
µg/L
881
0N
oD
Tric
hlor
omet
hane
VO
CF(
pre)
0.6
µg/L
880
0Ye
sna
Xyl
ene,
ort
hoV
OC
/BTE
XF(
pre)
ncµg
/L39
nana
No
A,B
Xyl
enes
, met
a an
d pa
raV
OC
/BTE
XF(
pre)
ncµg
/L39
nana
No
A,B
Xyl
enes
, tot
alV
OC
/BTE
X –
1.6
µg/L
881
0Ye
sna
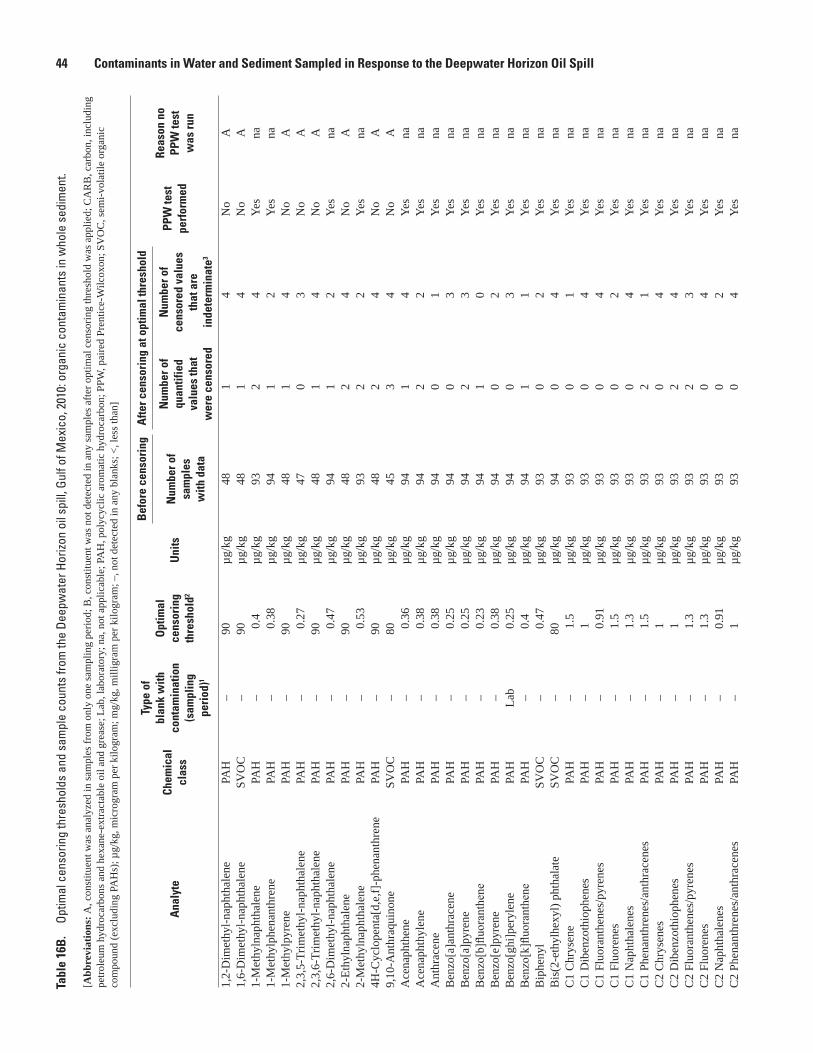
44 Contaminants in Water and Sediment Sampled in Response to the Deepwater Horizon Oil Spill Ta
ble
16B
. Op
timal
cen
sorin
g th
resh
olds
and
sam
ple
coun
ts fr
om th
e De
epw
ater
Hor
izon
oil s
pill,
Gul
f of M
exic
o, 2
010:
org
anic
con
tam
inan
ts in
who
le s
edim
ent.—
Cont
inue
d
[Abb
revi
atio
ns: A
, con
stitu
ent w
as a
naly
zed
in sa
mpl
es fr
om o
nly
one
sam
plin
g pe
riod;
B, c
onst
ituen
t was
not
det
ecte
d in
any
sam
ples
afte
r opt
imal
cen
sorin
g th
resh
old
was
app
lied;
CA
RB
, car
bon,
incl
udin
g pe
trole
um h
ydro
carb
ons a
nd h
exan
e-ex
tract
able
oil
and
grea
se; L
ab, l
abor
ator
y; n
a, n
ot a
pplic
able
; PA
H, p
olyc
yclic
aro
mat
ic h
ydro
carb
on; P
PW, p
aire
d Pr
entic
e-W
ilcox
on; S
VO
C, s
emi-v
olat
ile o
rgan
ic
com
poun
d (e
xclu
ding
PA
Hs)
; µg/
kg, m
icro
gram
per
kilo
gram
; mg/
kg, m
illig
ram
per
kilo
gram
; –, n
ot d
etec
ted
in a
ny b
lank
s; <
, les
s tha
n]
Ana
lyte
Chem
ical
cl
ass
Type
of
blan
k w
ith
cont
amin
atio
n (s
ampl
ing
peri
od)1
Opt
imal
ce
nsor
ing
thre
shol
d2
Uni
ts
Bef
ore
cens
orin
gA
fter c
enso
ring
at o
ptim
al th
resh
old
PPW
test
pe
rfor
med
Reas
on n
o
PPW
test
w
as ru
n
Num
ber o
f sa
mpl
es
with
dat
a
Num
ber o
f qu
antif
ied
va
lues
that
w
ere
cens
ored
Num
ber o
f ce
nsor
ed v
alue
s
that
are
in
dete
rmin
ate3
1,2-
Dim
ethy
l-nap
htha
lene
PAH
–90
µg/k
g48
14
No
A1,
6-D
imet
hyl-n
apht
hale
neSV
OC
–90
µg/k
g48
14
No
A1-
Met
hyln
apht
hale
nePA
H–
0.4
µg/k
g93
24
Yes
na1-
Met
hylp
hena
nthr
ene
PAH
–0.
38µg
/kg
941
2Ye
sna
1-M
ethy
lpyr
ene
PAH
–90
µg/k
g48
14
No
A2,
3,5-
Trim
ethy
l-nap
htha
lene
PAH
–0.
27µg
/kg
470
3N
oA
2,3,
6-Tr
imet
hyl-n
apht
hale
nePA
H–
90µg
/kg
481
4N
oA
2,6-
Dim
ethy
l-nap
htha
lene
PAH
–0.
47µg
/kg
941
2Ye
sna
2-Et
hyln
apht
hale
nePA
H–
90µg
/kg
482
4N
oA
2-M
ethy
lnap
htha
lene
PAH
–0.
53µg
/kg
932
2Ye
sna
4H-C
yclo
pent
a[d,
e,f]
-phe
nant
hren
ePA
H–
90µg
/kg
482
4N
oA
9,10
-Ant
hraq
uino
neSV
OC
–80
µg/k
g45
34
No
AA
cena
phth
ene
PAH
–0.
36µg
/kg
941
4Ye
sna
Ace
naph
thyl
ene
PAH
–0.
38µg
/kg
942
2Ye
sna
Ant
hrac
ene
PAH
–0.
38µg
/kg
940
1Ye
sna
Ben
zo[a
]ant
hrac
ene
PAH
–0.
25µg
/kg
940
3Ye
sna
Ben
zo[a
]pyr
ene
PAH
–0.
25µg
/kg
942
3Ye
sna
Ben
zo[b
]fluo
rant
hene
PAH
–0.
23µg
/kg
941
0Ye
sna
Ben
zo[e
]pyr
ene
PAH
–0.
38µg
/kg
940
2Ye
sna
Ben
zo[g
hi]p
eryl
ene
PAH
Lab
0.25
µg/k
g94
03
Yes
naB
enzo
[k]fl
uora
nthe
nePA
H–
0.4
µg/k
g94
11
Yes
naB
iphe
nyl
SVO
C–
0.47
µg/k
g93
02
Yes
naB
is(2
-eth
ylhe
xyl)
phth
alat
eSV
OC
–80
µg/k
g94
04
Yes
naC
1 C
hrys
ene
PAH
–1.
5µg
/kg
930
1Ye
sna
C1
Dib
enzo
thio
phen
esPA
H–
1µg
/kg
930
4Ye
sna
C1
Fluo
rant
hene
s/py
rene
sPA
H–
0.91
µg/k
g93
04
Yes
naC
1 Fl
uore
nes
PAH
–1.
5µg
/kg
930
2Ye
sna
C1
Nap
htha
lene
sPA
H–
1.3
µg/k
g93
04
Yes
naC
1 Ph
enan
thre
nes/
anth
race
nes
PAH
–1.
5µg
/kg
932
1Ye
sna
C2
Chr
ysen
esPA
H–
1µg
/kg
930
4Ye
sna
C2
Dib
enzo
thio
phen
esPA
H–
1µg
/kg
932
4Ye
sna
C2
Fluo
rant
hene
s/py
rene
sPA
H–
1.3
µg/k
g93
23
Yes
naC
2 Fl
uore
nes
PAH
–1.
3µg
/kg
930
4Ye
sna
C2
Nap
htha
lene
sPA
H–
0.91
µg/k
g93
02
Yes
naC
2 Ph
enan
thre
nes/
anth
race
nes
PAH
–1
µg/k
g93
04
Yes
na
Tabl
e 16
B.
Optim
al c
enso
ring
thre
shol
ds a
nd s
ampl
e co
unts
from
the
Deep
wat
er H
orizo
n oi
l spi
ll, G
ulf o
f Mex
ico,
201
0: o
rgan
ic c
onta
min
ants
in w
hole
sed
imen
t.

Results and Discussion 45Ta
ble
16B
. Op
timal
cen
sorin
g th
resh
olds
and
sam
ple
coun
ts fr
om th
e De
epw
ater
Hor
izon
oil s
pill,
Gul
f of M
exic
o, 2
010:
org
anic
con
tam
inan
ts in
who
le s
edim
ent.—
Cont
inue
d
[Abb
revi
atio
ns: A
, con
stitu
ent w
as a
naly
zed
in sa
mpl
es fr
om o
nly
one
sam
plin
g pe
riod;
B, c
onst
ituen
t was
not
det
ecte
d in
any
sam
ples
afte
r opt
imal
cen
sorin
g th
resh
old
was
app
lied;
CA
RB
, car
bon,
incl
udin
g pe
trole
um h
ydro
carb
ons a
nd h
exan
e-ex
tract
able
oil
and
grea
se; L
ab, l
abor
ator
y; n
a, n
ot a
pplic
able
; PA
H, p
olyc
yclic
aro
mat
ic h
ydro
carb
on; P
PW, p
aire
d Pr
entic
e-W
ilcox
on; S
VO
C, s
emi-v
olat
ile o
rgan
ic
com
poun
d (e
xclu
ding
PA
Hs)
; µg/
kg, m
icro
gram
per
kilo
gram
; mg/
kg, m
illig
ram
per
kilo
gram
; –, n
ot d
etec
ted
in a
ny b
lank
s; <
, les
s tha
n]
Ana
lyte
Chem
ical
cl
ass
Type
of
blan
k w
ith
cont
amin
atio
n (s
ampl
ing
peri
od)1
Opt
imal
ce
nsor
ing
thre
shol
d2
Uni
ts
Bef
ore
cens
orin
gA
fter c
enso
ring
at o
ptim
al th
resh
old
PPW
test
pe
rfor
med
Reas
on n
o
PPW
test
w
as ru
n
Num
ber o
f sa
mpl
es
with
dat
a
Num
ber o
f qu
antif
ied
va
lues
that
w
ere
cens
ored
Num
ber o
f ce
nsor
ed v
alue
s
that
are
in
dete
rmin
ate3
C3
Chr
ysen
esPA
H–
1µg
/kg
930
4Ye
sna
C3
Dib
enzo
thio
phen
esPA
H–
1µg
/kg
931
4Ye
sna
C3
Fluo
rant
hene
s/py
rene
sPA
H–
1.5
µg/k
g93
01
Yes
naC
3 Fl
uore
nes
PAH
–1.
8µg
/kg
930
1Ye
sna
C3
Nap
htha
lene
sPA
H–
0.91
µg/k
g93
02
Yes
naC
3 Ph
enan
thre
nes/
qnth
race
nes
PAH
–1
µg/k
g93
14
Yes
naC
4 C
hrys
enes
PAH
–1.
3µg
/kg
932
4Ye
sna
C4
Dib
enzo
thio
phen
esPA
H–
1.8
µg/k
g93
31
Yes
naC
4 N
apht
hale
nes
PAH
–1.
2µg
/kg
930
4Ye
sna
C4
Phen
anth
rene
s/an
thra
cene
sPA
H–
1.3
µg/k
g93
03
Yes
naC
arba
zole
SVO
C–
80µg
/kg
914
5N
oB
Chr
ysen
ePA
H–
0.23
µg/k
g94
10
Yes
naD
iben
zo[a
h]an
thra
cene
PAH
–0.
38µg
/kg
941
3Ye
sna
Dib
enzo
thio
phen
eSV
OC
–0.
38µg
/kg
941
2Ye
sna
Fluo
rant
hene
PAH
–0.
26µg
/kg
940
0Ye
sna
Fluo
rene
PAH
–0.
44µg
/kg
941
3Ye
sna
Inde
no[1
23cd
]pyr
ene
PAH
Lab
0.23
µg/k
g94
01
Yes
naN
apht
hale
nePA
H–
0.29
µg/k
g94
65
Yes
naO
il an
d gr
ease
CA
RB
Lab
110
mg/
kg94
162
Yes
naPe
ryle
nePA
HLa
b0.
22µg
/kg
940
5Ye
sna
Petro
leum
hyd
roca
rbon
sC
AR
B–
340
mg/
kg46
14
No
naPh
enan
thre
nePA
H–
0.23
µg/k
g94
22
Yes
naPy
rene
PAH
–0.
24µg
/kg
940
1Ye
sna
Tota
l org
anic
car
bon
CA
RB
–0.
1pe
rcen
t93
00
Yes
naTo
tal o
rgan
ic c
arbo
nC
AR
B–
1100
mg/
kg46
04
No
A1 In
affe
cted
sam
ples
, rep
orte
d co
ncen
tratio
ns w
ere
cens
ored
at fi
ve ti
mes
the
max
imum
con
cent
ratio
n de
tect
ed in
the
corr
espo
ndin
g la
bora
tory
bla
nk.
2 Low
est c
enso
ring
leve
l tha
t max
imiz
es th
e nu
mbe
r of q
uant
ifiab
le d
etec
tions
, min
imiz
es th
e nu
mbe
r of i
ndet
erm
inat
e sa
mpl
es, a
nd fo
r whi
ch th
e pe
rcen
t ind
eter
min
ate
sam
ples
is n
o m
ore
than
5 to
8
perc
ent,
depe
ndin
g on
sam
ple
size
.3 In
dete
rmin
ate
sam
ples
are
cen
sore
d da
ta fo
r whi
ch th
e re
porti
ng le
vel (
for e
xam
ple,
<1)
is h
ighe
r tha
n th
e ap
plie
d ce
nsor
ing
thre
shol
d (f
or e
xam
ple,
0.2
), so
it c
anno
t be
clas
sifie
d as
eith
er a
det
ectio
n or
no
ndet
ectio
n at
that
thre
shol
d (f
or e
xam
ple,
it is
unk
now
n w
heth
er th
e co
ntam
inan
t is p
rese
nt a
t lev
els a
bove
0.2
).

46 Contaminants in Water and Sediment Sampled in Response to the Deepwater Horizon Oil Spill Ta
ble
16C.
Op
timal
cen
sorin
g th
resh
olds
and
sam
ple
coun
ts fr
om th
e De
epw
ater
Hor
izon
oil s
pill,
Gul
f of M
exic
o, 2
010:
trac
e an
d m
ajor
ele
men
ts a
nd n
utrie
nts
in w
ater
. —
Cont
inue
d
[Abb
revi
atio
ns: A
, con
stitu
ent w
as n
ot d
etec
ted
in a
ny sa
mpl
es a
fter o
ptim
al c
enso
ring
thre
shol
d w
as a
pplie
d; B
, con
stitu
ent w
as a
naly
zed
in sa
mpl
es fr
om o
nly
one
sam
plin
g pe
riod;
C, c
onst
ituen
t was
no
t det
ecte
d in
any
sam
ples
afte
r bla
nk c
enso
ring;
F(x
), fie
ld b
lank
affe
cted
all
sam
ples
col
lect
ed d
urin
g sa
mpl
ing
perio
d x;
Lab
, lab
orat
ory;
na,
not
app
licab
le; n
c, d
ata
not c
enso
red;
NU
TR; n
utrie
nt; p
ost,
post
-land
fall;
PPW
, pai
red
Pren
tice-
Wilc
oxon
; pre
, pre
-land
fall;
TM
E, tr
ace
and
maj
or e
lem
ent;
µg/L
, mic
rogr
am p
er li
ter;
mg/
L, m
illig
ram
per
lite
r; na
, not
app
licab
le; n
c, n
ot c
enso
red;
–, n
ot d
etec
ted
in a
ny
blan
ks; <
, les
s tha
n]
Ana
lyte
Sym
bol o
r ab
brev
iatio
nCh
emic
al
clas
s
Type
of
bl
ank
with
co
ntam
inat
ion
(s
ampl
ing
peri
od)1
Opt
imal
ce
nsor
ing
thre
shol
d2
Uni
ts
Bef
ore
cens
orin
gA
fter c
enso
ring
at o
ptim
al th
resh
old
PPW
test
pe
rfor
med
Reas
on n
o PP
W te
st
was
run
Num
ber o
f sa
mpl
es
with
dat
a
Num
ber o
f qu
antif
ied
valu
es
that
wer
e
cens
ored
Num
ber o
f ce
nsor
ed
valu
es th
at a
re
inde
term
inat
e3
Alu
min
umA
lTM
E –
400
µg/L
8812
3Ye
sna
Am
mon
ia a
s NN
(am
mon
ia)
NU
TR–
0.04
mg/
L91
140
Yes
naA
mm
onia
as N
H4
N (a
mm
oniu
m)
NU
TR–
0.05
15m
g/L
9114
0Ye
sna
Am
mon
ia p
lus o
rgan
ic n
itrog
enN
(Kje
ldah
l)N
UTR
Lab,
F(p
ost)
2.4
mg/
L93
465
No
AA
rsen
icA
sTM
EF(
pre)
40µg
/L80
390
No
AB
ariu
mB
aTM
E–
nc4
µg/L
80na
naYe
sna
Ber
ylliu
mB
eTM
E–
10µg
/L80
40
No
AB
oron
BTM
ELa
b, F
(pos
t)nc
4µg
/L42
nana
No
BC
adm
ium
Cd
TME
–10
µg/L
803
0N
oA
Cal
cium
Ca
TME
Lab,
F(
pre,
pos
t)nc
4m
g/L
86na
naYe
sna
Chr
omiu
mC
rTM
E–
20µg
/L80
200
Yes
naC
obal
tC
oTM
E–
30µg
/L80
260
No
AC
oppe
rC
uTM
EF(
post
)38
µg/L
8017
0N
oA
Dis
solv
ed n
itrog
enN
(tot
al)
NU
TR–
nc4
mg/
L86
nana
Yes
naIr
onFe
TME
–50
0µg
/L80
170
Yes
naLe
adPb
TME
–20
µg/L
8020
0Ye
sna
Lith
ium
LiTM
EF(
pre)
nc4
µg/L
39na
naN
oB
Mag
nesi
umM
gTM
ELa
b,
F(pr
e, p
ost)
nc4
mg/
L86
nana
Yes
na
Man
gane
seM
nTM
E–
10µg
/L80
55
Yes
naM
ercu
ryH
gTM
EF(
post
)nc
5µg
/L40
nana
No
B,C
Mol
ybde
num
Mo
TME
–20
µg/L
8052
0Ye
sna
Nic
kel
Ni
TME
–75
µg/L
8022
0N
oA
Org
anic
nitr
ogen
N (o
rgan
ic)
NU
TR–
2.4
mg/
L91
334
Yes
naPh
osph
orus
as P
PN
UTR
Lab,
F(p
ost)
0.18
mg/
L94
294
Yes
na
Tabl
e 16
C.
Optim
al c
enso
ring
thre
shol
ds a
nd s
ampl
e co
unts
from
the
Deep
wat
er H
orizo
n oi
l spi
ll, G
ulf o
f Mex
ico,
201
0: tr
ace
and
maj
or e
lem
ents
and
nut
rient
s in
wat
er.
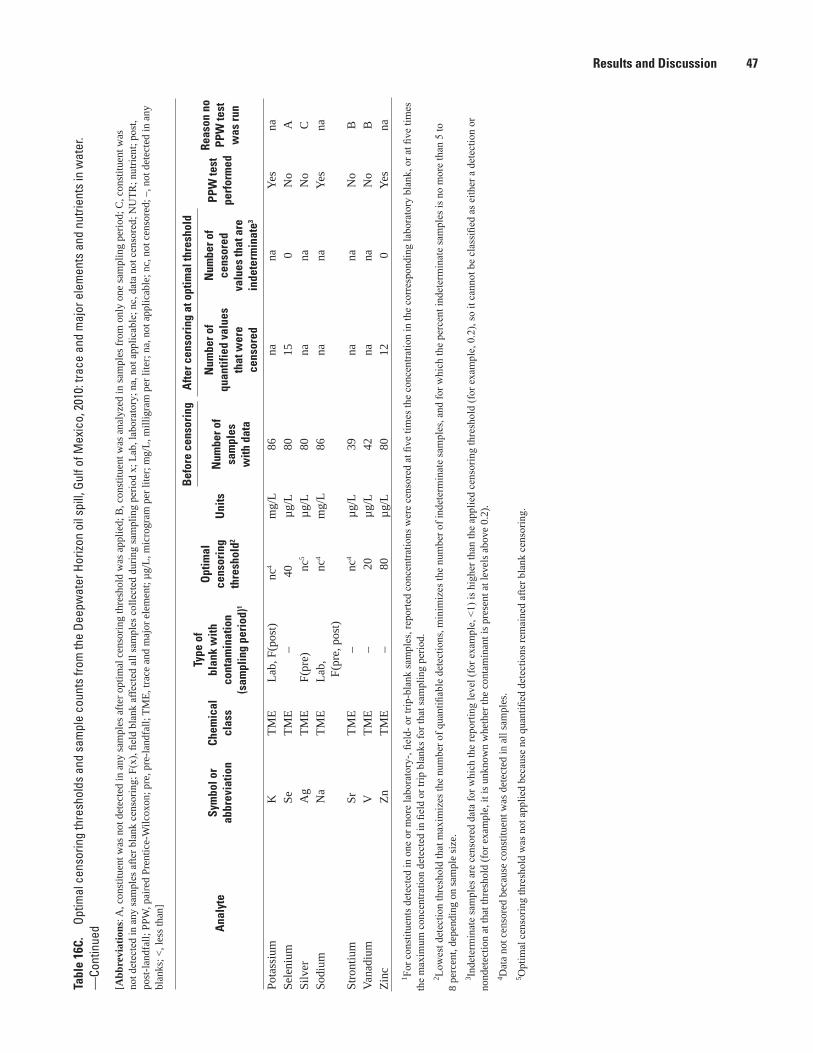
Results and Discussion 47Ta
ble
16C.
Op
timal
cen
sorin
g th
resh
olds
and
sam
ple
coun
ts fr
om th
e De
epw
ater
Hor
izon
oil s
pill,
Gul
f of M
exic
o, 2
010:
trac
e an
d m
ajor
ele
men
ts a
nd n
utrie
nts
in w
ater
. —
Cont
inue
d
[Abb
revi
atio
ns: A
, con
stitu
ent w
as n
ot d
etec
ted
in a
ny sa
mpl
es a
fter o
ptim
al c
enso
ring
thre
shol
d w
as a
pplie
d; B
, con
stitu
ent w
as a
naly
zed
in sa
mpl
es fr
om o
nly
one
sam
plin
g pe
riod;
C, c
onst
ituen
t was
no
t det
ecte
d in
any
sam
ples
afte
r bla
nk c
enso
ring;
F(x
), fie
ld b
lank
affe
cted
all
sam
ples
col
lect
ed d
urin
g sa
mpl
ing
perio
d x;
Lab
, lab
orat
ory;
na,
not
app
licab
le; n
c, d
ata
not c
enso
red;
NU
TR; n
utrie
nt; p
ost,
post
-land
fall;
PPW
, pai
red
Pren
tice-
Wilc
oxon
; pre
, pre
-land
fall;
TM
E, tr
ace
and
maj
or e
lem
ent;
µg/L
, mic
rogr
am p
er li
ter;
mg/
L, m
illig
ram
per
lite
r; na
, not
app
licab
le; n
c, n
ot c
enso
red;
–, n
ot d
etec
ted
in a
ny
blan
ks; <
, les
s tha
n]
Ana
lyte
Sym
bol o
r ab
brev
iatio
nCh
emic
al
clas
s
Type
of
bl
ank
with
co
ntam
inat
ion
(s
ampl
ing
peri
od)1
Opt
imal
ce
nsor
ing
thre
shol
d2
Uni
ts
Bef
ore
cens
orin
gA
fter c
enso
ring
at o
ptim
al th
resh
old
PPW
test
pe
rfor
med
Reas
on n
o PP
W te
st
was
run
Num
ber o
f sa
mpl
es
with
dat
a
Num
ber o
f qu
antif
ied
valu
es
that
wer
e
cens
ored
Num
ber o
f ce
nsor
ed
valu
es th
at a
re
inde
term
inat
e3
Pota
ssiu
mK
TME
Lab,
F(p
ost)
nc4
mg/
L86
nana
Yes
naSe
leni
umSe
TME
–40
µg/L
8015
0N
oA
Silv
erA
gTM
EF(
pre)
nc5
µg/L
80na
naN
oC
Sodi
umN
aTM
ELa
b,
F(pr
e, p
ost)
nc4
mg/
L86
nana
Yes
na
Stro
ntiu
mSr
TME
–nc
4µg
/L39
nana
No
BVa
nadi
umV
TME
–20
µg/L
42na
naN
oB
Zinc
ZnTM
E–
80µg
/L80
120
Yes
na1 Fo
r con
stitu
ents
det
ecte
d in
one
or m
ore
labo
rato
ry-,
field
- or t
rip-b
lank
sam
ples
, rep
orte
d co
ncen
tratio
ns w
ere
cens
ored
at fi
ve ti
mes
the
conc
entra
tion
in th
e co
rres
pond
ing
labo
rato
ry b
lank
, or a
t five
tim
es
the
max
imum
con
cent
ratio
n de
tect
ed in
fiel
d or
trip
bla
nks f
or th
at sa
mpl
ing
perio
d.
2 Low
est d
etec
tion
thre
shol
d th
at m
axim
izes
the
num
ber o
f qua
ntifi
able
det
ectio
ns, m
inim
izes
the
num
ber o
f ind
eter
min
ate
sam
ples
, and
for w
hich
the
perc
ent i
ndet
erm
inat
e sa
mpl
es is
no
mor
e th
an 5
to
8 pe
rcen
t, de
pend
ing
on sa
mpl
e si
ze.
3 Inde
term
inat
e sa
mpl
es a
re c
enso
red
data
for w
hich
the
repo
rting
leve
l (fo
r exa
mpl
e, <
1) is
hig
her t
han
the
appl
ied
cens
orin
g th
resh
old
(for
exa
mpl
e, 0
.2),
so it
can
not b
e cl
assi
fied
as e
ither
a d
etec
tion
or
nond
etec
tion
at th
at th
resh
old
(for
exa
mpl
e, it
is u
nkno
wn
whe
ther
the
cont
amin
ant i
s pre
sent
at l
evel
s abo
ve 0
.2).
4 Dat
a no
t cen
sore
d be
caus
e co
nstit
uent
was
det
ecte
d in
all
sam
ples
.5 O
ptim
al c
enso
ring
thre
shol
d w
as n
ot a
pplie
d be
caus
e no
qua
ntifi
ed d
etec
tions
rem
aine
d af
ter b
lank
cen
sorin
g.
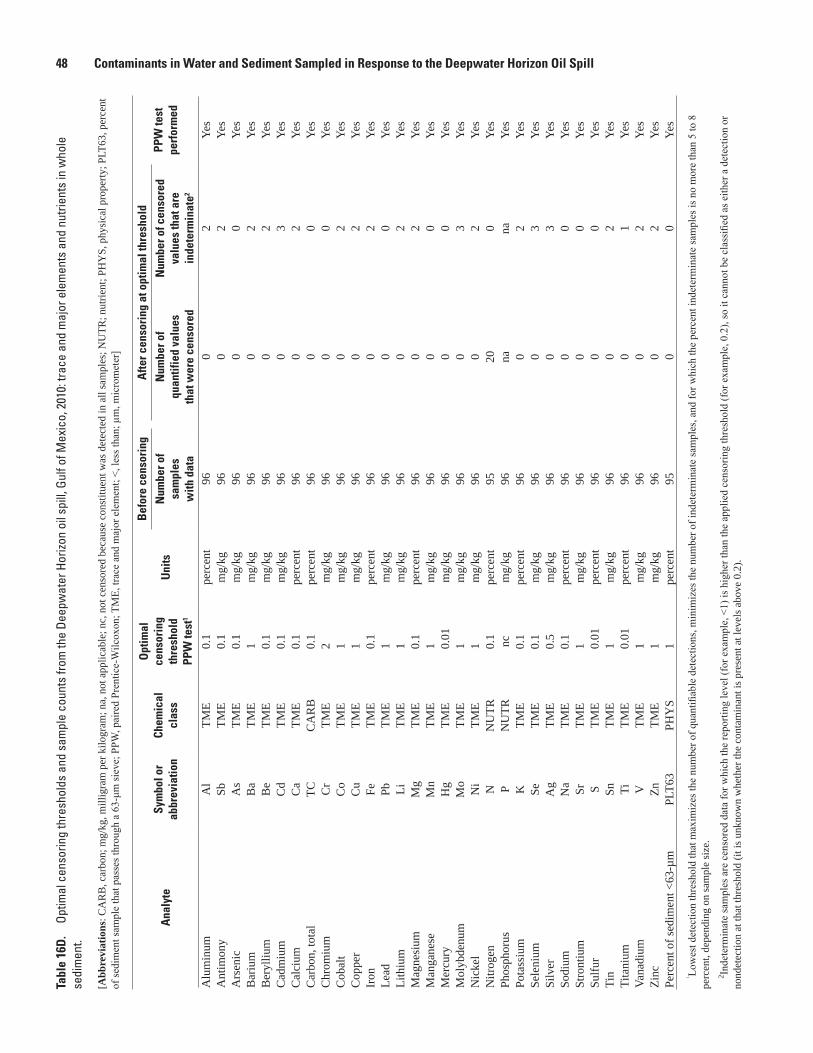
48 Contaminants in Water and Sediment Sampled in Response to the Deepwater Horizon Oil Spill Ta
ble
16D
. Op
timal
cen
sorin
g th
resh
olds
and
sam
ple
coun
ts fr
om th
e De
epw
ater
Hor
izon
oil s
pill,
Gul
f of M
exic
o, 2
010:
trac
e an
d m
ajor
ele
men
ts a
nd n
utrie
nts
in w
hole
se
dim
ent.
[Abb
revi
atio
ns: C
AR
B, c
arbo
n; m
g/kg
, mill
igra
m p
er k
ilogr
am; n
a, n
ot a
pplic
able
; nc,
not
cen
sore
d be
caus
e co
nstit
uent
was
det
ecte
d in
all
sam
ples
; NU
TR; n
utrie
nt; P
HY
S, p
hysi
cal p
rope
rty; P
LT63
, per
cent
of
sedi
men
t sam
ple
that
pas
ses t
hrou
gh a
63-
μm si
eve;
PPW
, pai
red
Pren
tice-
Wilc
oxon
; TM
E, tr
ace
and
maj
or e
lem
ent;
<, le
ss th
an; µ
m, m
icro
met
er]
Ana
lyte
Sym
bol o
r ab
brev
iatio
nCh
emic
al
clas
s
Opt
imal
ce
nsor
ing
th
resh
old
PPW
test
1
Uni
ts
Bef
ore
cens
orin
gA
fter c
enso
ring
at o
ptim
al th
resh
old
PPW
test
pe
rfor
med
Num
ber o
f sa
mpl
es
with
dat
a
Num
ber o
f qu
antif
ied
valu
es
that
wer
e ce
nsor
ed
Num
ber o
f cen
sore
d va
lues
that
are
in
dete
rmin
ate2
Alu
min
umA
lTM
E0.
1pe
rcen
t96
02
Yes
Ant
imon
ySb
TME
0.1
mg/
kg96
02
Yes
Ars
enic
As
TME
0.1
mg/
kg96
00
Yes
Bar
ium
Ba
TME
1m
g/kg
960
2Ye
sB
eryl
lium
Be
TME
0.1
mg/
kg96
02
Yes
Cad
miu
mC
dTM
E0.
1m
g/kg
960
3Ye
sC
alci
umC
aTM
E0.
1pe
rcen
t96
02
Yes
Car
bon,
tota
lTC
CA
RB
0.1
perc
ent
960
0Ye
sC
hrom
ium
Cr
TME
2m
g/kg
960
0Ye
sC
obal
tC
oTM
E1
mg/
kg96
02
Yes
Cop
per
Cu
TME
1m
g/kg
960
2Ye
sIr
onFe
TME
0.1
perc
ent
960
2Ye
sLe
adPb
TME
1m
g/kg
960
0Ye
sLi
thiu
mLi
TME
1m
g/kg
960
2Ye
sM
agne
sium
Mg
TME
0.1
perc
ent
960
2Ye
sM
anga
nese
Mn
TME
1m
g/kg
960
0Ye
sM
ercu
ryH
gTM
E0.
01m
g/kg
960
0Ye
sM
olyb
denu
mM
oTM
E1
mg/
kg96
03
Yes
Nic
kel
Ni
TME
1m
g/kg
960
2Ye
sN
itrog
enN
NU
TR0.
1pe
rcen
t95
200
Yes
Phos
phor
usP
NU
TRnc
mg/
kg96
nana
Yes
Pota
ssiu
mK
TME
0.1
perc
ent
960
2Ye
sSe
leni
umSe
TME
0.1
mg/
kg96
03
Yes
Silv
erA
gTM
E0.
5m
g/kg
960
3Ye
sSo
dium
Na
TME
0.1
perc
ent
960
0Ye
sSt
ront
ium
SrTM
E1
mg/
kg96
00
Yes
Sulfu
rS
TME
0.01
perc
ent
960
0Ye
sTi
nSn
TME
1m
g/kg
960
2Ye
sTi
tani
umTi
TME
0.01
perc
ent
960
1Ye
sVa
nadi
umV
TME
1m
g/kg
960
2Ye
sZi
ncZn
TME
1m
g/kg
960
2Ye
sPe
rcen
t of s
edim
ent <
63-µ
mPL
T63
PHY
S1
perc
ent
950
0Ye
s1 Lo
wes
t det
ectio
n th
resh
old
that
max
imiz
es th
e nu
mbe
r of q
uant
ifiab
le d
etec
tions
, min
imiz
es th
e nu
mbe
r of i
ndet
erm
inat
e sa
mpl
es, a
nd fo
r whi
ch th
e pe
rcen
t ind
eter
min
ate
sam
ples
is n
o m
ore
than
5 to
8
perc
ent,
depe
ndin
g on
sam
ple
size
.2 In
dete
rmin
ate
sam
ples
are
cen
sore
d da
ta fo
r whi
ch th
e re
porti
ng le
vel (
for e
xam
ple,
<1)
is h
ighe
r tha
n th
e ap
plie
d ce
nsor
ing
thre
shol
d (f
or e
xam
ple,
0.2
), so
it c
anno
t be
clas
sifie
d as
eith
er a
det
ectio
n or
no
ndet
ectio
n at
that
thre
shol
d (it
is u
nkno
wn
whe
ther
the
cont
amin
ant i
s pre
sent
at l
evel
s abo
ve 0
.2).
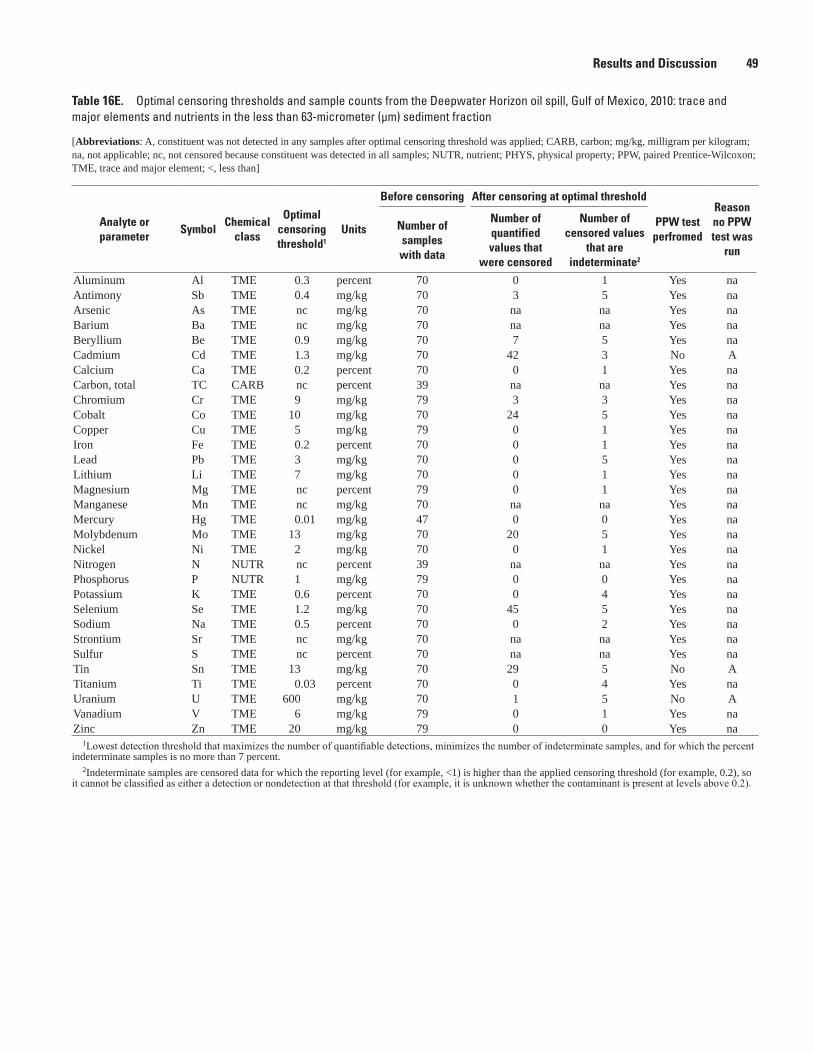
Results and Discussion 49
Table 16E. Optimal censoring thresholds and sample counts from the Deepwater Horizon oil spill, Gulf of Mexico, 2010: trace and major elements and nutrients in the less than 63-micrometer (µm) sediment fraction
[Abbreviations: A, constituent was not detected in any samples after optimal censoring threshold was applied; CARB, carbon; mg/kg, milligram per kilogram; na, not applicable; nc, not censored because constituent was detected in all samples; NUTR, nutrient; PHYS, physical property; PPW, paired Prentice-Wilcoxon; TME, trace and major element; <, less than]
Analyte or parameter
SymbolChemical
class
Optimal censoring threshold1
Units
Before censoring After censoring at optimal threshold
PPW test perfromed
Reason no PPW test was
run
Number of samples
with data
Number of quantified values that
were censored
Number of censored values
that are indeterminate2
Aluminum Al TME 0.3 percent 70 0 1 Yes naAntimony Sb TME 0.4 mg/kg 70 3 5 Yes naArsenic As TME nc mg/kg 70 na na Yes naBarium Ba TME nc mg/kg 70 na na Yes naBeryllium Be TME 0.9 mg/kg 70 7 5 Yes naCadmium Cd TME 1.3 mg/kg 70 42 3 No ACalcium Ca TME 0.2 percent 70 0 1 Yes naCarbon, total TC CARB nc percent 39 na na Yes naChromium Cr TME 9 mg/kg 79 3 3 Yes naCobalt Co TME 10 mg/kg 70 24 5 Yes naCopper Cu TME 5 mg/kg 79 0 1 Yes naIron Fe TME 0.2 percent 70 0 1 Yes naLead Pb TME 3 mg/kg 70 0 5 Yes naLithium Li TME 7 mg/kg 70 0 1 Yes naMagnesium Mg TME nc percent 79 0 1 Yes naManganese Mn TME nc mg/kg 70 na na Yes naMercury Hg TME 0.01 mg/kg 47 0 0 Yes naMolybdenum Mo TME 13 mg/kg 70 20 5 Yes naNickel Ni TME 2 mg/kg 70 0 1 Yes naNitrogen N NUTR nc percent 39 na na Yes naPhosphorus P NUTR 1 mg/kg 79 0 0 Yes naPotassium K TME 0.6 percent 70 0 4 Yes naSelenium Se TME 1.2 mg/kg 70 45 5 Yes naSodium Na TME 0.5 percent 70 0 2 Yes naStrontium Sr TME nc mg/kg 70 na na Yes naSulfur S TME nc percent 70 na na Yes naTin Sn TME 13 mg/kg 70 29 5 No ATitanium Ti TME 0.03 percent 70 0 4 Yes naUranium U TME 600 mg/kg 70 1 5 No AVanadium V TME 6 mg/kg 79 0 1 Yes naZinc Zn TME 20 mg/kg 79 0 0 Yes na
1Lowest detection threshold that maximizes the number of quantifiable detections, minimizes the number of indeterminate samples, and for which the percent indeterminate samples is no more than 7 percent.
2Indeterminate samples are censored data for which the reporting level (for example, <1) is higher than the applied censoring threshold (for example, 0.2), so it cannot be classified as either a detection or nondetection at that threshold (for example, it is unknown whether the contaminant is present at levels above 0.2).
50 Contaminants in Water and Sediment Sampled in Response to the Deepwater Horizon Oil Spill
Organic Contaminants in Water
For organic contaminants in water, samples were analyzed by different laboratories; pre-landfall samples were analyzed by the USGS NWQL, and post-landfall samples by the TestAmerica Laboratories in either Colorado or Florida. This complicates the comparison of contaminant occurrence between sampling periods, as described in the following section.
Contaminant OccurrenceFew organic contaminants were detected in water
samples (table 17). For each contaminant, table 17 provides an optimal censoring threshold, as described previously, to use in comparing detection frequencies between pre-landfall and post-landfall samples, as well as a series of four common detection thresholds to use in comparing detection frequencies among analytes. A common detection threshold must be applied when comparing detection frequencies for analytes with different or variable reporting levels, as is discussed later in this report.
Of the 41 contaminants analyzed only in pre-landfall samples, where the number of samples (n) is 60 to 65 sites depending on the analyte, 5 contaminants were detected in one or more samples: 1,3,5-trimethylbenzene, 2-ethyltoluene, n-propylbenzene, dibromomethane, and benzo[g,h,i]perylene. Of the 24 contaminants analyzed only in post-landfall samples, where n is 48 sites, 5 contaminants were detected in one or more samples: a mixture of C8 to C36 organics, oil range organics (C28 to C35), gasoline-range organics (C6 to C10), diesel-range organics, and total xylene. Of 94 organic contaminants analyzed in both pre-landfall samples and post-landfall samples, one or more detections were observed for 28 analytes in pre-landfall samples and for 9 analytes in post-landfall samples, with 7 of these analytes, including dissolved organic carbon, detected in samples from both sampling periods. Two analytes—toluene and trichloromethane—were detected in one or more post-landfall samples but no pre-landfall samples. Although more analytes were detected in pre-landfall than post-landfall samples, two factors need to be considered: (1) more sites distributed over a wider geographic area were sampled during the pre-landfall period, typically 60 to 68, than during the post-landfall period, which typically had 47 to 48 sites; and (2) reporting levels were lower for many analytes in pre-landfall than in post-landfall samples, which were analyzed by different laboratories. Thus, the detection frequencies are not directly comparable without adjustment for these factors.
This is illustrated in figure 4, which shows the cumulative frequency distributions of concentrations determined for two example contaminants in water, isophorone and benzene. (Appendix 2 provides a complete set of cumulative frequency plots for all individual contaminants determined in water and sediment.) For isophorone in water (fig. 4A), the detections observed in many pre-landfall samples were well below the reporting level for isophorone in post-landfall samples. Although it is possible that isophorone was present in post-landfall samples at concentrations comparable to those in pre-landfall samples, the analytical method used for post-landfall samples was not sensitive enough to detect these values. Similar results were observed for several PAHs in water (appendix 2-1). The benzene example (fig. 4B) illustrates the effect of blank censoring. In this case, comparison of pre-landfall to post-landfall occurrence is limited because the censoring level for all post-landfall samples was raised to 2.1 µg/L as a result of benzene detection in a blank from the post-landfall period. Because the raw benzene concentrations detected in post-landfall samples were less than the censoring threshold, there is uncertainty as to whether these concentrations were the result of incidental contamination; therefore, all post-landfall samples were reported as less than 2.1 µg/L. Concentrations of 0.02 to 0.05 µg/L that were detected in pre-landfall samples were much lower than the less than 2.1 µg/L censored results for post-landfall samples, so pre-landfall and post-landfall sample concentrations cannot be compared quantitatively for this analyte.
When detection frequencies above the optimal censoring threshold, which varies by analyte, as shown in table 17, were computed for organic contaminants in water, dissolved organic carbon was detected in about 40 percent of samples from both pre-landfall and post-landfall sampling periods, and 14 additional analytes were detected in one or more samples. Of these 14 analytes, 12 were detected in only one sample each. The remaining two detected analytes were toluene and the mixture of C8 to C36 organics. Toluene was detected above an optimal censoring threshold of 0.7 µg/L in 13 percent of post-landfall samples and no pre-landfall samples; the C8 to C36 organics were detected above an optimal censoring threshold of 47 µg/L in 7 percent detection of post-landfall samples but were not analyzed in pre-landfall samples. Toluene is the only analyte of the 94 determined in water during both sampling periods to show much difference between the two sampling periods in detection frequencies above the optimal censoring threshold (table 17). A more rigorous, statistical comparison between contaminant concentrations in pre-landfall and post-landfall samples follows.
Table 17. Summary statistics for organic contaminants in water from the Deepwater Horizon oil spill, Gulf of Mexico, 2010.
This table is available as a Microsoft© Excel spreadsheet. It can be accessed and downloaded at URL http://pubs.usgs.gov/sir/2012/5228.
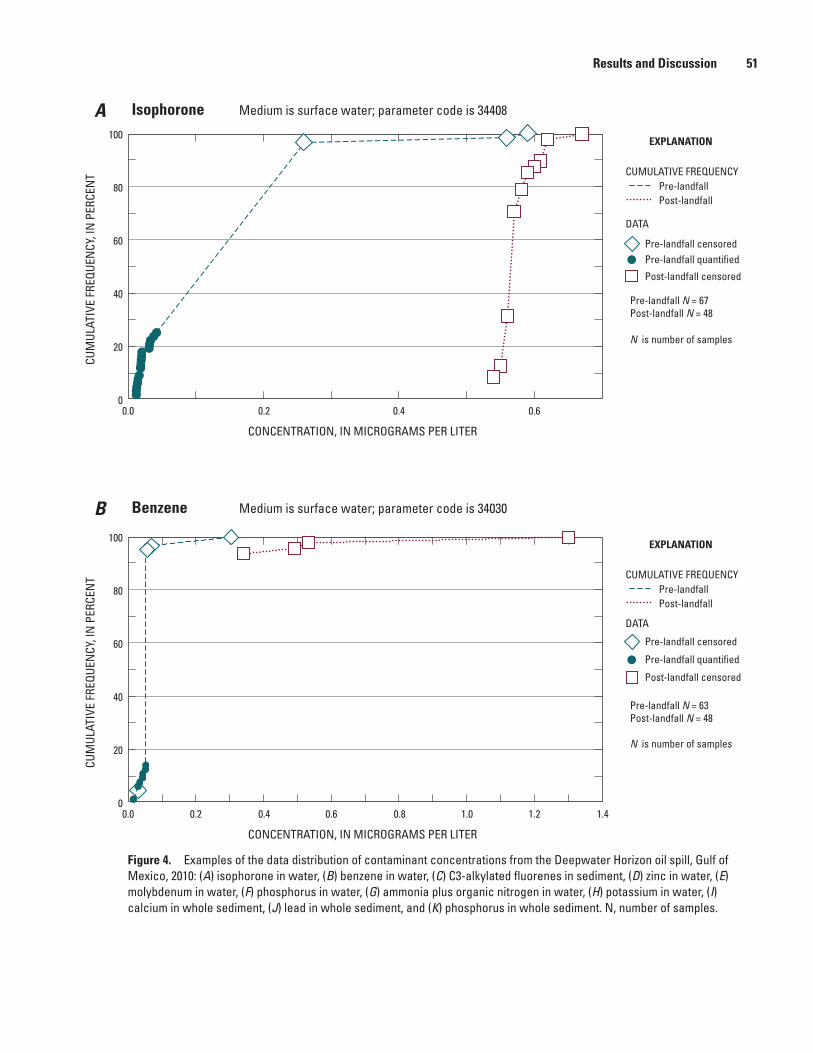
Results and Discussion 51
sac12-0452_Figure 04ab
CUM
ULAT
IVE
FREQ
UEN
CY, I
N P
ERCE
NT
100
80
60
40
20
00.0 0.2 0.4 0.6
CONCENTRATION, IN MICROGRAMS PER LITER
Pre-landfall N = 67Post-landfall N = 48
N is number of samples
N is number of samples
Pre-landfall N = 63Post-landfall N = 48
Pre-landfall Post-landfall
Pre-landfall censoredPre-landfall quantified
Post-landfall censored
CUMULATIVE FREQUENCY
EXPLANATION
DATA
CUM
ULAT
IVE
FREQ
UEN
CY, I
N P
ERCE
NT
100
80
60
40
20
00.0 0.2 0.4 1.2 1.40.6 0.8 1.0
CONCENTRATION, IN MICROGRAMS PER LITER
Pre-landfall Post-landfall
Pre-landfall censored
Pre-landfall quantified
Post-landfall censored
CUMULATIVE FREQUENCY
EXPLANATION
DATA
A Isophorone Medium is surface water; parameter code is 34408
B Benzene Medium is surface water; parameter code is 34030
Figure 4. Examples of the data distribution of contaminant concentrations from the Deepwater Horizon oil spill, Gulf of Mexico, 2010: (A) isophorone in water, (B) benzene in water, (C) C3-alkylated fluorenes in sediment, (D) zinc in water, (E) molybdenum in water, (F) phosphorus in water, (G) ammonia plus organic nitrogen in water, (H) potassium in water, (I) calcium in whole sediment, (J) lead in whole sediment, and (K) phosphorus in whole sediment. N, number of samples.

52 Contaminants in Water and Sediment Sampled in Response to the Deepwater Horizon Oil Spill
sac12-0452_Figure 04cd
CUM
ULAT
IVE
FREQ
UEN
CY, I
N P
ERCE
NT
100
80
60
40
20
00 2 4 6 8 10
CONCENTRATION, IN MICROGRAMS PER KILOGRAM
Pre-landfall N = 69Post-landfall N = 48
Pre-landfall N = 63Post-landfall N = 48
Pre-landfall Post-landfall
Pre-landfall censoredPre-landfall quantified
Post-landfall quantified
Post-landfall quantified
Post-landfall censored
CUMULATIVE FREQUENCY
EXPLANATION
DATA
CUM
ULAT
IVE
FREQ
UEN
CY, I
N P
ERCE
NT
100
80
60
40
20
00 20 40 60 80 100
CONCENTRATION, IN MICROGRAMS PER LITER
Pre-landfall Post-landfall
Pre-landfall censoredPre-landfall quantified Post-landfall censored
CUMULATIVE FREQUENCY
EXPLANATION
DATA
C Medium is sediment; parameter code is 68091C3-alkylated fluorenes
D Medium is surface water; parameter code is 01092Zinc
N is number of samples
N is number of samples
Figure 4.—Continued
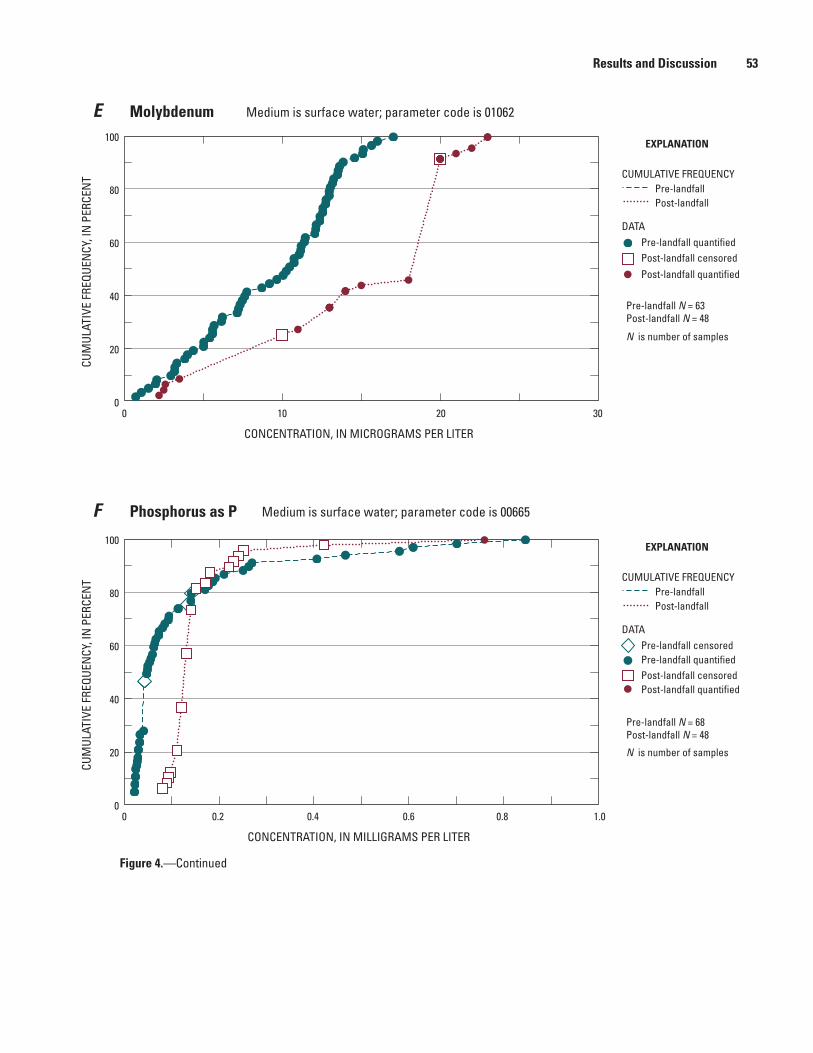
Results and Discussion 53
sac12-0452_Figure 04ef
CUM
ULAT
IVE
FREQ
UEN
CY, I
N P
ERCE
NT
100
80
60
40
20
00 302010
CONCENTRATION, IN MICROGRAMS PER LITER
Pre-landfall N = 63Post-landfall N = 48
Pre-landfall N = 68Post-landfall N = 48
Pre-landfall Post-landfall
Pre-landfall quantified
Post-landfall quantified
Post-landfall quantified
Post-landfall censored
CUMULATIVE FREQUENCY
EXPLANATION
DATA
CUM
ULAT
IVE
FREQ
UEN
CY, I
N P
ERCE
NT
100
80
60
40
20
00 0.2 0.4 0.6 0.8 1.0
CONCENTRATION, IN MILLIGRAMS PER LITER
Pre-landfall Post-landfall
Pre-landfall censoredPre-landfall quantified Post-landfall censored
CUMULATIVE FREQUENCY
EXPLANATION
DATA
E Medium is surface water; parameter code is 01062Molybdenum
F Medium is surface water; parameter code is 00665Phosphorus as P
N is number of samples
N is number of samples
Figure 4.—Continued

54 Contaminants in Water and Sediment Sampled in Response to the Deepwater Horizon Oil Spill
sac12-0452_Figure 04gh
CUM
ULAT
IVE
FREQ
UEN
CY, I
N P
ERCE
NT
100
80
60
40
20
00 4321
CONCENTRATION, IN MILLIGRAMS PER LITER AS NITROGEN
Pre-landfall N = 67Post-landfall N = 48
Pre-landfall N = 61Post-landfall N = 48
Pre-landfall Post-landfall
Pre-landfall quantified
Post-landfall quantified
Post-landfall censored
CUMULATIVE FREQUENCY
EXPLANATION
DATA
CUM
ULAT
IVE
FREQ
UEN
CY, I
N P
ERCE
NT
100
80
60
40
20
00 200 400 600 800
CONCENTRATION, IN MILLIGRAMS PER LITER
Pre-landfall Post-landfall
Pre-landfall quantified
CUMULATIVE FREQUENCY
EXPLANATION
DATA
G Medium is surface water; parameter code is 00625Ammonia plus organic nitrogen as N
H Medium is surface water; parameter code is 00937Potassium
N is number of samples
N is number of samples
Figure 4.—Continued

Results and Discussion 55
sac12-0452_Figure 04ij
CUM
ULAT
IVE
FREQ
UEN
CY, I
N P
ERCE
NT
100
80
60
40
20
00 40302010
CONCENTRATION, IN PERCENT BY WEIGHT
Pre-landfall N = 70Post-landfall N = 49
Pre-landfall N = 70Post-landfall N = 49
Pre-landfall Post-landfall
Pre-landfall quantified
Post-landfall quantified
Post-landfall quantified
Post-landfall censored
CUMULATIVE FREQUENCY
EXPLANATION
DATA
CUM
ULAT
IVE
FREQ
UEN
CY, I
N P
ERCE
NT
100
80
60
40
20
00 10 20 30 40 50 60
CONCENTRATION, IN MILLIGRAMS PER KILOGRAM
Pre-landfall Post-landfall
Pre-landfall censoredPre-landfall quantified
Post-landfall censored
CUMULATIVE FREQUENCY
EXPLANATION
DATA
Pre-landfall censored
I Medium is sediment; parameter code is 01476Calcium
J Medium is sediment; parameter code is 01382Lead
N is number of samples
N is number of samples
Figure 4.—Continued
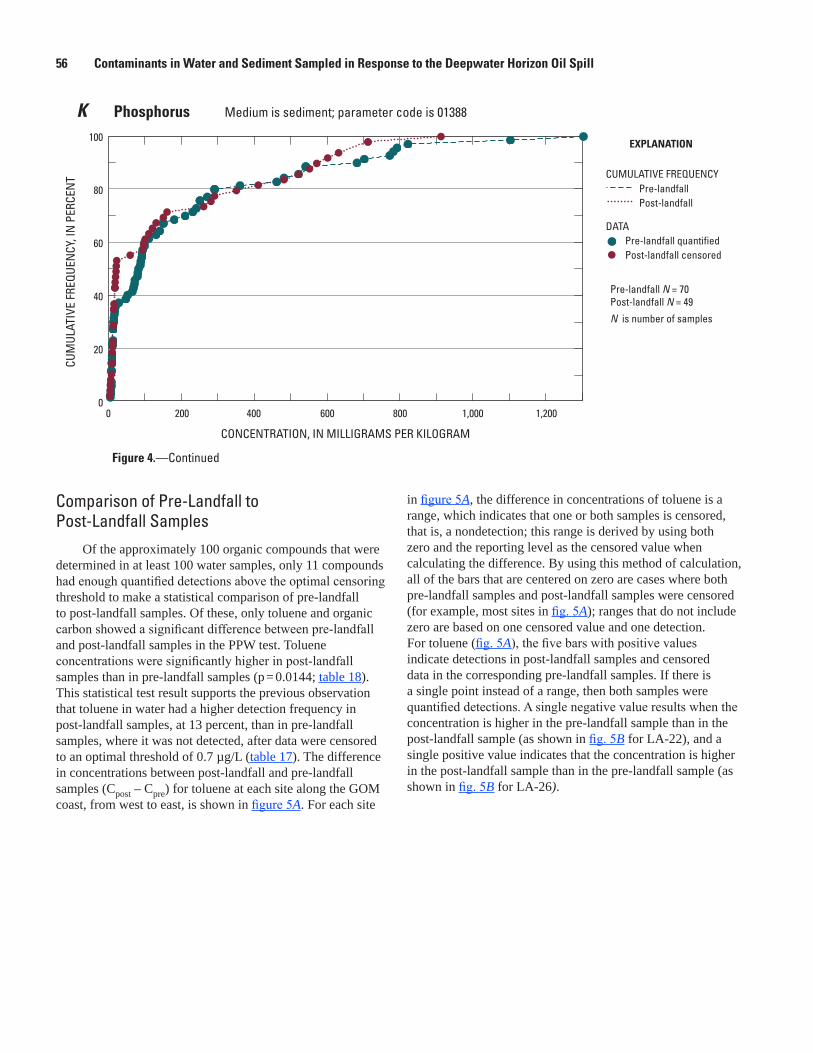
56 Contaminants in Water and Sediment Sampled in Response to the Deepwater Horizon Oil Spill
Comparison of Pre-Landfall to Post-Landfall Samples
Of the approximately 100 organic compounds that were determined in at least 100 water samples, only 11 compounds had enough quantified detections above the optimal censoring threshold to make a statistical comparison of pre-landfall to post-landfall samples. Of these, only toluene and organic carbon showed a significant difference between pre-landfall and post-landfall samples in the PPW test. Toluene concentrations were significantly higher in post-landfall samples than in pre-landfall samples (p = 0.0144; table 18). This statistical test result supports the previous observation that toluene in water had a higher detection frequency in post-landfall samples, at 13 percent, than in pre-landfall samples, where it was not detected, after data were censored to an optimal threshold of 0.7 µg/L (table 17). The difference in concentrations between post-landfall and pre-landfall samples (Cpost – Cpre) for toluene at each site along the GOM coast, from west to east, is shown in figure 5A. For each site
in figure 5A, the difference in concentrations of toluene is a range, which indicates that one or both samples is censored, that is, a nondetection; this range is derived by using both zero and the reporting level as the censored value when calculating the difference. By using this method of calculation, all of the bars that are centered on zero are cases where both pre-landfall samples and post-landfall samples were censored (for example, most sites in fig. 5A); ranges that do not include zero are based on one censored value and one detection. For toluene (fig. 5A), the five bars with positive values indicate detections in post-landfall samples and censored data in the corresponding pre-landfall samples. If there is a single point instead of a range, then both samples were quantified detections. A single negative value results when the concentration is higher in the pre-landfall sample than in the post-landfall sample (as shown in fig. 5B for LA-22), and a single positive value indicates that the concentration is higher in the post-landfall sample than in the pre-landfall sample (as shown in fig. 5B for LA-26).
sac12-0452_Figure 04K
CUM
ULAT
IVE
FREQ
UEN
CY, I
N P
ERCE
NT
100
80
60
40
20
00 800 1,000 1,200600400200
CONCENTRATION, IN MILLIGRAMS PER KILOGRAM
Pre-landfall N = 70Post-landfall N = 49
Pre-landfall Post-landfall
Pre-landfall quantified Post-landfall censored
CUMULATIVE FREQUENCY
EXPLANATION
DATA
K Medium is sediment; parameter code is 01388Phosphorus
N is number of samples
Figure 4.—Continued
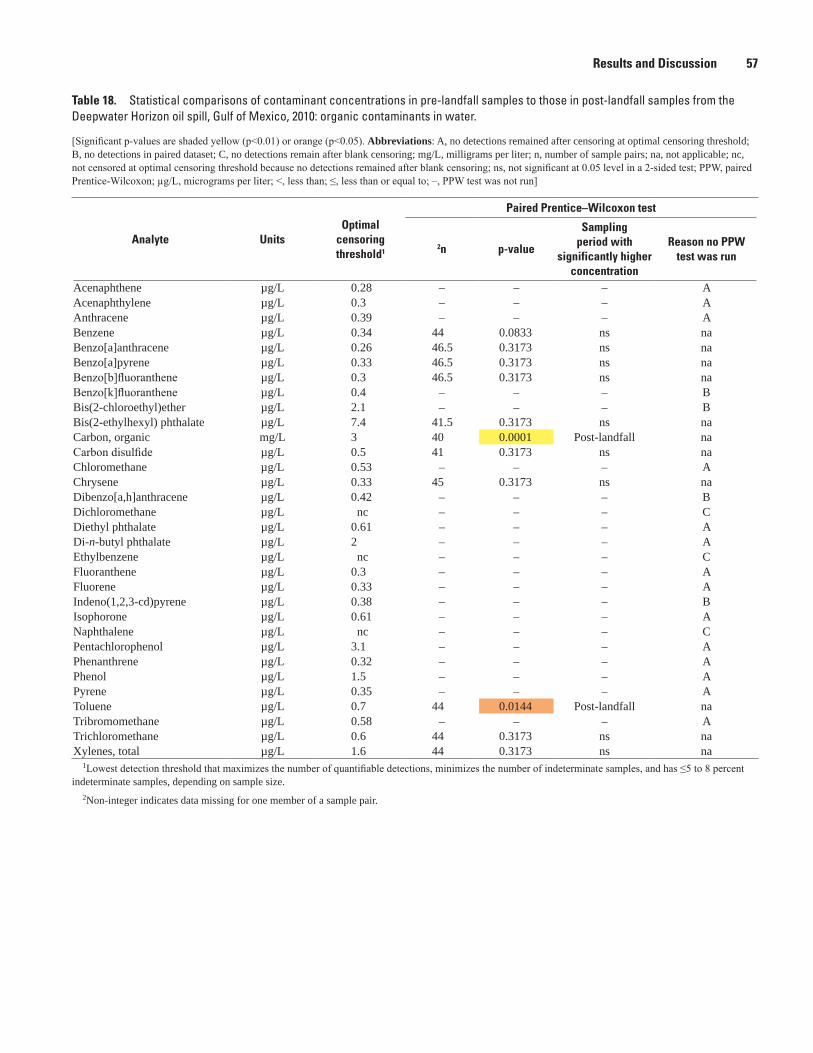
Results and Discussion 57
Table 18. Statistical comparisons of contaminant concentrations in pre-landfall samples to those in post-landfall samples from the Deepwater Horizon oil spill, Gulf of Mexico, 2010: organic contaminants in water.
[Significant p-values are shaded yellow (p<0.01) or orange (p<0.05). Abbreviations: A, no detections remained after censoring at optimal censoring threshold; B, no detections in paired dataset; C, no detections remain after blank censoring; mg/L, milligrams per liter; n, number of sample pairs; na, not applicable; nc, not censored at optimal censoring threshold because no detections remained after blank censoring; ns, not significant at 0.05 level in a 2-sided test; PPW, paired Prentice-Wilcoxon; µg/L, micrograms per liter; <, less than; ≤, less than or equal to; –, PPW test was not run]
Analyte UnitsOptimal
censoring threshold1
Paired Prentice–Wilcoxon test
2n p-value
Sampling period with
significantly higher concentration
Reason no PPW test was run
Acenaphthene µg/L 0.28 – – – AAcenaphthylene µg/L 0.3 – – – AAnthracene µg/L 0.39 – – – ABenzene µg/L 0.34 44 0.0833 ns naBenzo[a]anthracene µg/L 0.26 46.5 0.3173 ns naBenzo[a]pyrene µg/L 0.33 46.5 0.3173 ns na Benzo[b]fluoranthene µg/L 0.3 46.5 0.3173 ns na Benzo[k]fluoranthene µg/L 0.4 – – – BBis(2-chloroethyl)ether µg/L 2.1 – – – BBis(2-ethylhexyl) phthalate µg/L 7.4 41.5 0.3173 ns naCarbon, organic mg/L 3 40 0.0001 Post-landfall naCarbon disulfide µg/L 0.5 41 0.3173 ns naChloromethane µg/L 0.53 – – – AChrysene µg/L 0.33 45 0.3173 ns naDibenzo[a,h]anthracene µg/L 0.42 – – – BDichloromethane µg/L nc – – – CDiethyl phthalate µg/L 0.61 – – – ADi-n-butyl phthalate µg/L 2 – – – AEthylbenzene µg/L nc – – – CFluoranthene µg/L 0.3 – – – AFluorene µg/L 0.33 – – – AIndeno(1,2,3-cd)pyrene µg/L 0.38 – – – BIsophorone µg/L 0.61 – – – ANaphthalene µg/L nc – – – CPentachlorophenol µg/L 3.1 – – – APhenanthrene µg/L 0.32 – – – APhenol µg/L 1.5 – – – APyrene µg/L 0.35 – – – AToluene µg/L 0.7 44 0.0144 Post-landfall naTribromomethane µg/L 0.58 – – – ATrichloromethane µg/L 0.6 44 0.3173 ns naXylenes, total µg/L 1.6 44 0.3173 ns na
1Lowest detection threshold that maximizes the number of quantifiable detections, minimizes the number of indeterminate samples, and has ≤5 to 8 percent indeterminate samples, depending on sample size.
2Non-integer indicates data missing for one member of a sample pair.
58 Contaminants in Water and Sediment Sampled in Response to the Deepwater Horizon Oil Spill
Toluene was not detected at greater than 0.7 µg/L in pre-landfall samples but was detected in six post-landfall samples, only five of which were in the paired data set and therefore appear in figure 5A. The significant PPW test result was influenced by the toluene detections in post-landfall samples from five sites: MS-37, FL-3, FL-4, FL-25, and FL-5 (fig. 5A). Additional BTEX compounds—benzene and xylenes—were detected in samples from two of these sites: MS-37 and FL-25.
The detection of BTEX compounds in post-landfall beach-water samples does not necessarily indicate the presence of M-1 oil. Weathered M-1 oil, which was collected on April 27, 2010, contained no detectable BTEX compounds; of the aliphatic and cyclic hydrocarbons detected, the lowest molecular-weight compound detected was the alkane n-C14 (State of Florida Oil Spill Academic Task Force, 2010), and BTEX compounds were not detected in surface-oil samples approaching the near shore environment (Atlas and Haven, 2011). BTEX compounds are volatile and tend to be rapidly removed from seawater by evaporation, and to a lesser extent by sorption to particles and sediment, biodegradation, and photolysis (Neff, 2002). Other sources of BTEX compounds to the GOM include produced water (Neff, 2002; Neff and others, 2011), deposition of airborne hydrocarbons from combustion sources, and natural oil and gas seeps (Continental Shelf Associates, 1997). Nevertheless, high concentrations of BTEX compounds, including up to 30 µg/L toluene, were reported in a plume trending southwest from the M-1 well at about 1,100 m depth in June 2010 (Reddy and others, 2012); it was concluded that although the ultimate fate of these compounds in the deep-water plume was unknown, the apportionments of hydrocarbon transfers to the water column and atmosphere appeared to be very different for a deep-water spill compared to a sea-surface oil spill. In the present study, water samples were collected at wadable depths near the shore, and toluene was detected in post-landfall water samples from six sites. Three of the six sites with toluene detections, MS-37, AL-7, and FL-3, were reported to have the M-1 oil fingerprint in corresponding post-landfall samples of sediment, tarballs, or both (Rosenbauer and others, 2010)—thus providing direct evidence of M-1 oil landfall at those sites at the time of post-landfall sampling—but the other three sites with toluene detections, FL-4, FL-25, and FL-5, did not show evidence of M-1 oil. No evidence of M-1 oil was found in 69 pre-landfall sediment samples analyzed by Rosenbauer and others (2011), although a tarball from one site, FL-18, was similar to M-1 oil, as discussed later in the report.
Comparison with Benchmarks for Human Health and Aquatic Life
Benchmark comparisons were made for all field samples, including primary environmental samples and field replicates. Benchmark exceedances for organics in water by individual sample are listed in appendix table 3-1, and the results are summarized in table 19. For those organic compounds with benchmarks, 253 water samples were analyzed: 196 pre-landfall samples from 70 sites and 57 post-landfall samples from 49 sites. Not every organic compound was analyzed in every sample, as indicated in appendix table 3-1. Of the 253 water samples, 138 samples were analyzed for PAHs and BTEX compounds, 86 samples for BTEX compounds only, and 29 samples for PAHs only.
Human-health benchmarks are available for 11 organic contaminants analyzed in water (table 5C). None of these benchmarks were exceeded by any water samples in this study.
Aquatic-life benchmarks used in the present study include the USEPA’s toxic-unit benchmarks for mixtures of PAH and BTEX compounds (table 5A), as well as supplementary aquatic-life benchmarks for 72 individual organic contaminants (table 5B). One water sample exceeded the USEPA’s chronic toxic-unit benchmark for PAH and BTEX compound mixtures (table 19, appendix 3-1). As noted previously, this benchmark assumes additive toxicity for compounds with the same mechanism of action, and a ∑TUi value greater than 1 indicates that chronic toxicity to aquatic life is likely. The single water sample exceeding this benchmark was the post-landfall sample from the Mississippi River at South Pass, Louisiana (site LA-35), for which the chronic ∑TUi value was 2.4. This is substantially higher than the corresponding chronic ∑TUi value of less than 10–4 for the pre-landfall sample collected at this site. Neither the post-landfall nor the pre-landfall sediment from site LA-35 contained the M-1 oil fingerprint (Rosenbauer and others, 2010 and 2011).
Of the 72 individual organic contaminants analyzed in this study that have aquatic-life benchmarks (table 5B), not all were analyzed in every water sample (see appendix table 3-1). However, none of the aquatic-life benchmarks for any individual organic contaminants were exceeded by any water samples in this study.
Of individual organic contaminants with benchmarks, recovery in matrix spikes was less than 70 percent for six contaminants—4-nitrophenol, benzo[a]pyrene, hexachlorobutadiene, hexachlorocyclopentadiene, hexachloroethane, and N-nitrosodiphenylamine—indicating that the measured concentration could be biased low.

Results and Discussion 59
sac1
2-04
52_F
igur
e 5a
b
CPOST MINUS CPRE,IN MICROGRAMS PER KILOGRAM
MAP
NUM
BER
(WES
T TO
EAS
T)
TX-56
TX-55
TX-51
TX-53
TX-49
TX-47
LA-46
LA-25
LA-23
LA-28
LA-26
LA-24
LA-31
LA-36
LA-35
LA-32
LA-33
LA-29
LA-22
LA-30
LA-34
MS-43
MS-37
MS-38
MS-39
MS-44
MS-40
MS-41
MS-45
MS-42
AL-1
AL-2
AL-3
AL-4
AL-8
AL-5
AL-9
AL-10
AL-6
AL-7
FL-1
FL-2
FL-3
FL-4
FL-25
FL-5
FL-6
FL-7
–40
–200204060
CPOST MINUS CPRE,IN MICROGRAMS PER LITER
MAP
NUM
BER
(WES
T TO
EAS
T)
TX-56
TX-55
TX-51
TX-53
TX-49
TX-47
LA-46
LA-25
LA-23
LA-28
LA-26
LA-24
LA-31
LA-36
LA-35
LA-32
LA-33
LA-29
LA-22
LA-30
LA-34
MS-43
MS-37
MS-38
MS-39
MS-44
MS-40
MS-41
MS-45
MS-42
AL-1
AL-2
AL-3
AL-4
AL-8
AL-5
AL-9
AL-10
AL-6
AL-7
FL-1
FL-2
FL-3
FL-4
FL-25
FL-5
FL-6
FL-7
-1 0 1 2 3 4 5
Min
imum
Max
imum
Gray
bar
indi
cate
sm
issi
ng d
ata
or n
o sa
mpl
e
Min
imum
Max
imum
Gray
bar
indi
cate
sm
issi
ng d
ata
or n
o sa
mpl
e
ATo
luen
e in
wat
erC P
OST
min
us C
PRE
> 0
(p =
0.0
14)
BCh
ryse
ne in
sed
imen
tC P
OST
min
us C
PRE
> 0
(p =
0.0
033)
Not
e: >
is g
reat
er th
an
Figu
re 5
. Fo
r sel
ecte
d an
alyt
es, d
iffer
ence
bet
wee
n or
gani
c co
ntam
inan
t con
cent
ratio
ns in
sam
ples
col
lect
ed d
urin
g po
st-la
ndfa
ll an
d pr
e-la
ndfa
ll pe
riods
(Cpo
st
min
us C
pre)
by
the
USGS
at D
eepw
ater
Hor
izon
oil s
pill
sam
plin
g si
tes
alon
g th
e Gu
lf of
Mex
ico
coas
t, 20
10, f
rom
wes
t to
east
, for
(A) t
olue
ne in
wat
er, (
B) c
hrys
ene
in s
edim
ent,
(C) C
1-al
kyla
ted
chry
sene
s in
sed
imen
t, (D
) C2-
alky
late
d flu
oren
es in
sed
imen
t, (E
) C3-
alky
late
d di
benz
othi
ophe
nes
in s
edim
ent,
(F) C
4-al
kyla
ted
phen
anth
rene
s/an
thra
cene
s in
sed
imen
t, (G
) nap
htha
lene
in s
edim
ent,
and
(H) o
il an
d gr
ease
in s
edim
ent.

60 Contaminants in Water and Sediment Sampled in Response to the Deepwater Horizon Oil Spill
sac1
2-04
52_F
igur
e 5c
d
CPOST MINUS CPRE,IN MICROGRAMS PER KILOGRAM
MAP
NUM
BER
(WES
T TO
EAS
T)
TX-56
TX-55
TX-51
TX-53
TX-49
TX-47
LA-46
LA-25
LA-23
LA-28
LA-26
LA-24
LA-31
LA-36
LA-35
LA-32
LA-33
LA-29
LA-22
LA-30
LA-34
MS-43
MS-37
MS-38
MS-39
MS-44
MS-40
MS-41
MS-45
MS-42
AL-1
AL-2
AL-3
AL-4
AL-8
AL-5
AL-9
AL-10
AL-6
AL-7
FL-1
FL-2
FL-3
FL-4
FL-25
FL-5
FL-6
FL-7
–4
–3
–2
–1 0 1 2 3 4
CPOST MINUS CPRE,IN MICROGRAMS PER KILOGRAM
MAP
NUM
BER
(WES
T TO
EAS
T)
TX-56
TX-55
TX-51
TX-53
TX-49
TX-47
LA-46
LA-25
LA-23
LA-28
LA-26
LA-24
LA-31
LA-36
LA-35
LA-32
LA-33
LA-29
LA-22
LA-30
LA-34
MS-43
MS-37
MS-38
MS-39
MS-44
MS-40
MS-41
MS-45
MS-42
AL-1
AL-2
AL-3
AL-4
AL-8
AL-5
AL-9
AL-10
AL-6
AL-7
FL-1
FL-2
FL-3
FL-4
FL-25
FL-5
FL-6
FL-7
–20
–10010203040
Min
imum
Max
imum
Gray
bar
indi
cate
sm
issi
ng d
ata
or n
o sa
mpl
e
CC1
-alk
ylat
ed c
hrys
enes
in s
edim
ent
C POST
min
us C
PRE >
0 (p
= 0
.003
7)
DC2
-alk
ylat
ed fl
uore
nes
in s
edim
ent
C POST
min
us C
PRE >
0 (p
= 0
.014
4)
Min
imum
Max
imum
Gray
bar
indi
cate
sm
issi
ng d
ata
or n
o sa
mpl
e
Not
e: >
is g
reat
er th
an
Figu
re 5
.—Co
ntin
ued

Results and Discussion 61
sac1
2-04
52_F
igur
e 5e
f
CPOST MINUS CPRE,IN MICROGRAMS PER KILOGRAM
MAP
NUM
BER
(WES
T TO
EAS
T)
TX-56
TX-55
TX-51
TX-53
TX-49
TX-47
LA-46
LA-25
LA-23
LA-28
LA-26
LA-24
LA-31
LA-36
LA-35
LA-32
LA-33
LA-29
LA-22
LA-30
LA-34
MS-43
MS-37
MS-38
MS-39
MS-44
MS-40
MS-41
MS-45
MS-42
AL-1
AL-2
AL-3
AL-4
AL-8
AL-5
AL-9
AL-10
AL-6
AL-7
FL-1
FL-2
FL-3
FL-4
FL-25
FL-5
FL-6
FL-7
–505101520
CPOST MINUS CPRE,IN MICROGRAMS PER KILOGRAM
MAP
NUM
BER
(WES
T TO
EAS
T)
TX-56
TX-55
TX-51
TX-53
TX-49
TX-47
LA-46
LA-25
LA-23
LA-28
LA-26
LA-24
LA-31
LA-36
LA-35
LA-32
LA-33
LA-29
LA-22
LA-30
LA-34
MS-43
MS-37
MS-38
MS-39
MS-44
MS-40
MS-41
MS-45
MS-42
AL-1
AL-2
AL-3
AL-4
AL-8
AL-5
AL-9
AL-10
AL-6
AL-7
FL-1
FL-2
FL-3
FL-4
FL-25
FL-5
FL-6
FL-7
–6–4–2024681012E
C3-a
lkyl
ated
dib
enzo
thio
phen
es in
sed
imen
tC P
OST
min
us C
PRE
> 0
(p =
0.0
164)
FC4
-alk
ylat
ed p
hena
nthr
enes
/ant
hrac
enes
in s
edim
ent
C POS
T m
inus
CPR
E >
0 (p
= 0
.004
1)
Min
imum
Max
imum
Gray
bar
indi
cate
sm
issi
ng d
ata
or n
o sa
mpl
e
Min
imum
Max
imum
Gray
bar
indi
cate
sm
issi
ng d
ata
or n
o sa
mpl
e
Not
e: >
is g
reat
er th
an
Figu
re 5
.—Co
ntin
ued
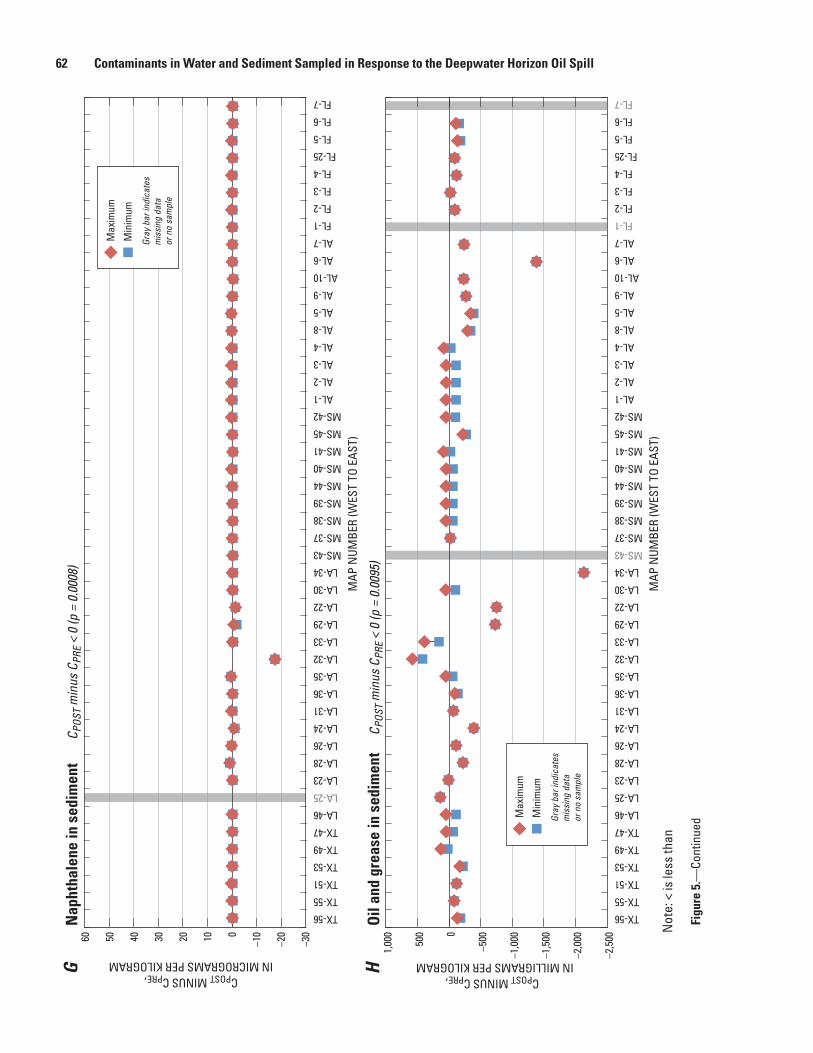
62 Contaminants in Water and Sediment Sampled in Response to the Deepwater Horizon Oil Spill
sac1
2-04
52_F
igur
e 5g
h
CPOST MINUS CPRE,IN MILLIGRAMS PER KILOGRAM
MAP
NUM
BER
(WES
T TO
EAS
T)
TX-56
TX-55
TX-51
TX-53
TX-49
TX-47
LA-46
LA-25
LA-23
LA-28
LA-26
LA-24
LA-31
LA-36
LA-35
LA-32
LA-33
LA-29
LA-22
LA-30
LA-34
MS-43
MS-37
MS-38
MS-39
MS-44
MS-40
MS-41
MS-45
MS-42
AL-1
AL-2
AL-3
AL-4
AL-8
AL-5
AL-9
AL-10
AL-6
AL-7
FL-1
FL-2
FL-3
FL-4
FL-25
FL-5
FL-6
FL-7
–2,5
00
–2,0
00
–1,5
00
–1,0
00
–5000
500
1,00
0
CPOST MINUS CPRE,IN MICROGRAMS PER KILOGRAM
MAP
NUM
BER
(WES
T TO
EAS
T)
TX-56
TX-55
TX-51
TX-53
TX-49
TX-47
LA-46
LA-25
LA-23
LA-28
LA-26
LA-24
LA-31
LA-36
LA-35
LA-32
LA-33
LA-29
LA-22
LA-30
LA-34
MS-43
MS-37
MS-38
MS-39
MS-44
MS-40
MS-41
MS-45
MS-42
AL-1
AL-2
AL-3
AL-4
AL-8
AL-5
AL-9
AL-10
AL-6
AL-7
FL-1
FL-2
FL-3
FL-4
FL-25
FL-5
FL-6
FL-7
–30
–20
–100102030405060
GN
apht
hale
ne in
sed
imen
tC P
OST
min
us C
PRE
< 0
(p =
0.0
008)
HOi
l and
gre
ase
in s
edim
ent
C POS
T m
inus
CPR
E <
0 (p
= 0
.009
5)
Min
imum
Max
imum
Gray
bar
indi
cate
sm
issi
ng d
ata
or n
o sa
mpl
e
Min
imum
Max
imum
Gray
bar
indi
cate
sm
issi
ng d
ata
or n
o sa
mpl
e
Not
e: <
is le
ss th
an
Figu
re 5
.—Co
ntin
ued
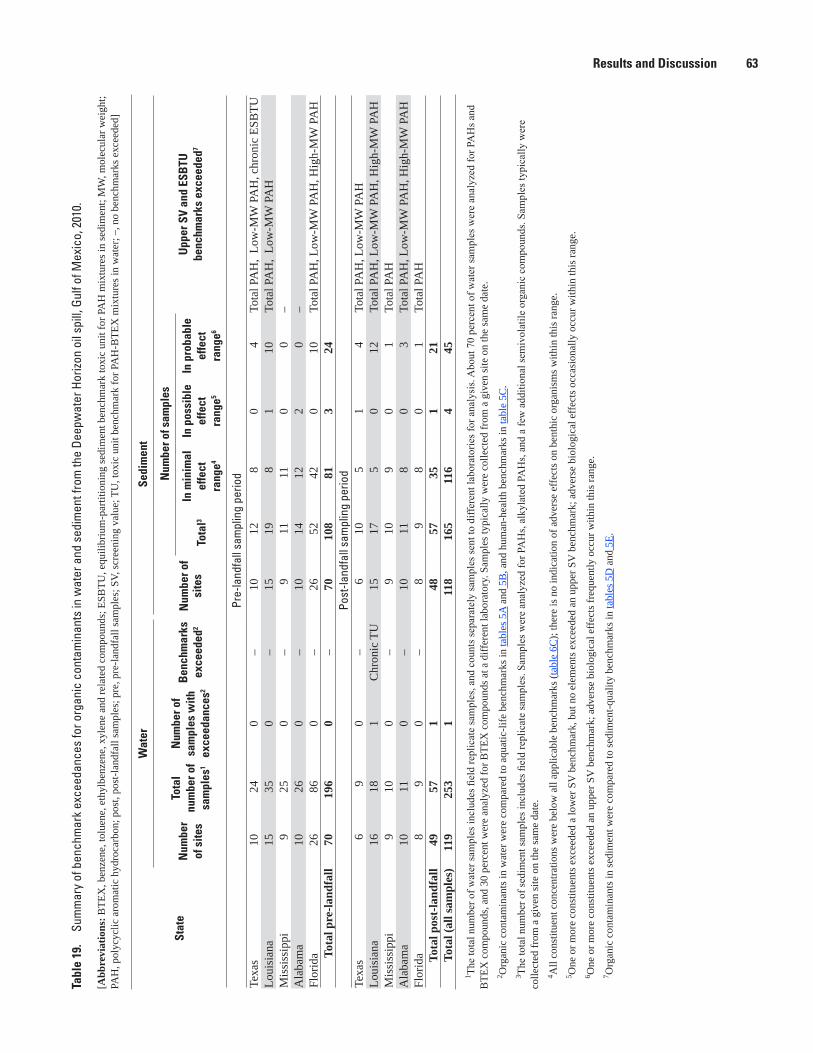
Results and Discussion 63Ta
ble
19.
Sum
mar
y of
ben
chm
ark
exce
edan
ces
for o
rgan
ic c
onta
min
ants
in w
ater
and
sed
imen
t fro
m th
e De
epw
ater
Hor
izon
oil s
pill,
Gul
f of M
exic
o, 2
010.
[Abb
revi
atio
ns: B
TEX
, ben
zene
, tol
uene
, eth
ylbe
nzen
e, x
ylen
e an
d re
late
d co
mpo
unds
; ESB
TU, e
quili
briu
m-p
artit
ioni
ng se
dim
ent b
ench
mar
k to
xic
unit
for P
AH
mix
ture
s in
sedi
men
t; M
W, m
olec
ular
wei
ght;
PAH
, pol
ycyc
lic a
rom
atic
hyd
roca
rbon
; pos
t, po
st-la
ndfa
ll sa
mpl
es; p
re, p
re-la
ndfa
ll sa
mpl
es; S
V, sc
reen
ing
valu
e; T
U, t
oxic
uni
t ben
chm
ark
for P
AH
-BTE
X m
ixtu
res i
n w
ater
; –, n
o be
nchm
arks
exc
eede
d]
Stat
e
Wat
erSe
dim
ent
Num
ber
of s
ites
Tota
l nu
mbe
r of
sam
ples
1
Num
ber o
f sa
mpl
es w
ith
exce
edan
ces2
Ben
chm
arks
ex
ceed
ed2
Num
ber o
f si
tes
Num
ber o
f sam
ples
Upp
er S
V an
d ES
BTU
be
nchm
arks
exc
eede
d7To
tal3
In m
inim
al
effe
ct
rang
e4
In p
ossi
ble
effe
ct
rang
e5
In p
roba
ble
effe
ct
rang
e6
Pre
-land
fall
sam
plin
g pe
riod
Texa
s10
240
–10
128
04
Tota
l PA
H,
Low
-MW
PA
H, c
hron
ic E
SBTU
Loui
sian
a15
350
–15
198
110
Tota
l PA
H,
Low
-MW
PA
HM
issi
ssip
pi9
250
–9
1111
00
–A
laba
ma
1026
0–
1014
122
0–
Flor
ida
2686
0–
2652
420
10To
tal P
AH
, Low
-MW
PA
H, H
igh-
MW
PA
HTo
tal p
re-la
ndfa
ll70
196
0–
7010
881
324
Pos
t-lan
dfal
l sam
plin
g pe
riod
Texa
s6
90
–6
105
14
Tota
l PA
H, L
ow-M
W P
AH
Lo
uisi
ana
1618
1C
hron
ic T
U15
175
012
Tota
l PA
H, L
ow-M
W P
AH
, Hig
h-M
W P
AH
Mis
siss
ippi
910
0–
910
90
1To
tal P
AH
Ala
bam
a10
110
–10
118
03
Tota
l PA
H, L
ow-M
W P
AH
, Hig
h-M
W P
AH
Fl
orid
a8
90
–8
98
01
Tota
l PA
HTo
tal p
ost-
land
fall
4957
148
5735
121
Tota
l (al
l sam
ples
)11
925
31
118
165
116
445
1 The
tota
l num
ber o
f wat
er sa
mpl
es in
clud
es fi
eld
repl
icat
e sa
mpl
es, a
nd c
ount
s sep
arat
ely
sam
ples
sent
to d
iffer
ent l
abor
ator
ies f
or a
naly
sis.
Abo
ut 7
0 pe
rcen
t of w
ater
sam
ples
wer
e an
alyz
ed fo
r PA
Hs a
nd
BTE
X c
ompo
unds
, and
30
perc
ent w
ere
anal
yzed
for B
TEX
com
poun
ds a
t a d
iffer
ent l
abor
ator
y. S
ampl
es ty
pica
lly w
ere
colle
cted
from
a g
iven
site
on
the
sam
e da
te.
2 Org
anic
con
tam
inan
ts in
wat
er w
ere
com
pare
d to
aqu
atic
-life
ben
chm
arks
in ta
bles
5A
and
5B
, and
hum
an-h
ealth
ben
chm
arks
in ta
ble
5C.
3 The
tota
l num
ber o
f sed
imen
t sam
ples
incl
udes
fiel
d re
plic
ate
sam
ples
. Sam
ples
wer
e an
alyz
ed fo
r PA
Hs,
alky
late
d PA
Hs,
and
a fe
w a
dditi
onal
sem
ivol
atile
org
anic
com
poun
ds. S
ampl
es ty
pica
lly w
ere
colle
cted
from
a g
iven
site
on
the
sam
e da
te.
4 All
cons
titue
nt c
once
ntra
tions
wer
e be
low
all
appl
icab
le b
ench
mar
ks (t
able
6C
); th
ere
is n
o in
dica
tion
of a
dver
se e
ffect
s on
bent
hic
orga
nism
s with
in th
is ra
nge.
5 One
or m
ore
cons
titue
nts e
xcee
ded
a lo
wer
SV
ben
chm
ark,
but
no
elem
ents
exc
eede
d an
upp
er S
V b
ench
mar
k; a
dver
se b
iolo
gica
l effe
cts o
ccas
iona
lly o
ccur
with
in th
is ra
nge.
6 One
or m
ore
cons
titue
nts e
xcee
ded
an u
pper
SV
ben
chm
ark;
adv
erse
bio
logi
cal e
ffect
s fre
quen
tly o
ccur
with
in th
is ra
nge.
7 Org
anic
con
tam
inan
ts in
sedi
men
t wer
e co
mpa
red
to se
dim
ent-q
ualit
y be
nchm
arks
in ta
bles
5D
and
5E.
64 Contaminants in Water and Sediment Sampled in Response to the Deepwater Horizon Oil Spill
Benchmark results in appendix table 3-1 and summary statistics in table 17 are footnoted to indicate this. The single observed benchmark exceedance of the chronic TU benchmark for PAH and BTEX compounds by one post-landfall sample from site LA-35 must be considered in light of the QC data for organic contaminants in water. Of the compounds included in this benchmark, one BTEX compound (benzene) and one PAH compound (naphthalene) were detected in field or trip blanks associated with post-landfall samples; therefore, data for these two analytes were censored at five times the blank concentration to minimize the probability that incidental contamination contributed to the reported concentrations and any consequent benchmark exceedances. In the case of the LA-35 sample that exceeded the chronic TU benchmark, however, neither benzene nor naphthalene was detected in the sample; therefore, their concentrations were set to zero when computing the TU values for this sample, following the USEPA’s calculation procedure and examples, which assume that censored values are equivalent to zero (Mount, 2010). Therefore, incidental contamination by benzene or naphthalene did not contribute to the chronic TU benchmark exceedance in the post-landfall sample at site LA-35.
Because there was only one benchmark exceedance, Fisher’s exact test was not performed for organic contaminants in water. When chronic ∑TUi values for all 47 pairs of pre-landfall and post-landfall samples were compared, there was no significant difference between the two sampling periods (sign test, p>0.05). In addition, acute ∑TUi values for PAH and BTEX compound mixtures were not greater than 1 in any water samples, and there was no significant difference in acute ∑TUi values between pre-landfall and post-landfall samples (sign test, p>0.05). Again, these comparisons need to be qualified because reporting levels varied among analytes and between the two sampling periods, and concentrations were not censored to a single detection threshold prior to calculation of benchmark ∑TUi values, which were calculated following the standard USEPA procedure. Because reporting levels for many analytes were higher in post-landfall samples than in pre-landfall samples, setting nondetections equal to zero could underestimate benchmark exceedance rates in post-landfall samples relative to pre-landfall samples. Also, of the 47 sites with paired data, 6 pre-landfall sites were missing data for BTEX compounds, so the benchmark ∑TUi values for these pre-landfall samples were computed for PAHs only.
Organic Contaminants in Sediment
Most organic contaminants in sediment were determined by a single laboratory (TestAmerica Laboratory in Vermont) in samples from both sampling periods. These contaminants
include parent PAHs and alkylated PAH groups, which are of potential concern from the oil spill (U.S. Environmental Protection Agency, 2011b). Fourteen additional organic contaminants, mostly individual alkylated PAH compounds, were analyzed only in pre-landfall samples by the USGS NWQL. Also, 44 miscellaneous SVOCs were analyzed in post-landfall but not pre-landfall samples; these include chlorinated phenols, nitroaromatic compounds, chlorinated alkanes and alkenes, nitroso compounds, and phthalate esters.
Reporting levels for organics in sediment varied somewhat for a given compound, but not as widely as for organics in water, and reporting levels were comparable for pre-landfall and post-landfall samples (appendix 2).
Contaminant OccurrenceThe detection frequencies and percentile concentrations
of organic contaminants in sediment are shown in table 20. Of the 14 organic contaminants analyzed only in pre-landfall samples, excluding TOC, 8 contaminants were detected in 1 to 4 samples each. Six of these were individual alkylated PAH compounds that also were included in determination of alkylated PAH groups (for example, 1,2-dimethylnaphthalene would be included in the C-2 naphthalenes group) by TestAmerica Laboratory in Vermont. The remaining two were 9,10-anthraquinone and the mixture of petroleum hydrocarbons.
There were 52 organic contaminants, plus organic carbon, analyzed in both pre-landfall and post-landfall samples: 19 parent PAHs, 5 individual alkylated PAHs, 22 alkylated PAH groups, 5 SVOCs, and oil and grease. Of the 52 analytes, 49 were detected in pre-landfall samples and 50 in post-landfall samples, with 47 analytes detected in samples from both sampling periods. Only two analytes were not detected in any samples: the SVOCs, hexachlorobenzene and diethyl phthalate. PAH detection frequencies above the optimal censoring threshold for each analyte ranged from 3 to 64 percent for parent PAHs and 0 to 33 percent for alkylated PAH groups; because of variable reporting limits, there were some indeterminate samples (table 20). Figure 4C shows an example of the concentration distribution observed in sediment samples for the alkylated PAH group, C3-alkylated fluorenes. The reporting levels for C3-alkylated fluorene tend to be lower for post-landfall than pre-landfall samples, which means that uncensored detection frequencies will not provide a fair comparison of occurrence in the two sampling periods. After censoring at an optimal threshold of 1.8 µg/kg, the detection frequency for C3-alkylated fluorenes was higher in post-landfall samples at 15 percent than in pre-landfall samples, where it was 1 percent.
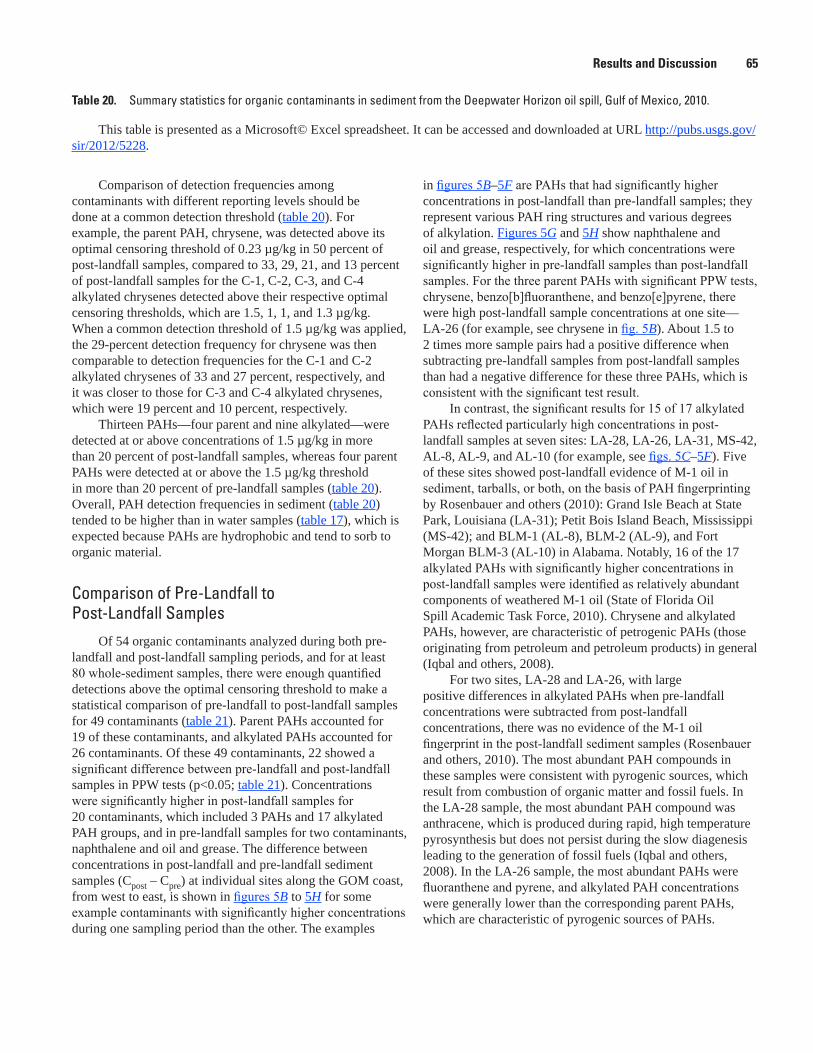
Results and Discussion 65
Comparison of detection frequencies among contaminants with different reporting levels should be done at a common detection threshold (table 20). For example, the parent PAH, chrysene, was detected above its optimal censoring threshold of 0.23 µg/kg in 50 percent of post-landfall samples, compared to 33, 29, 21, and 13 percent of post-landfall samples for the C-1, C-2, C-3, and C-4 alkylated chrysenes detected above their respective optimal censoring thresholds, which are 1.5, 1, 1, and 1.3 µg/kg. When a common detection threshold of 1.5 µg/kg was applied, the 29-percent detection frequency for chrysene was then comparable to detection frequencies for the C-1 and C-2 alkylated chrysenes of 33 and 27 percent, respectively, and it was closer to those for C-3 and C-4 alkylated chrysenes, which were 19 percent and 10 percent, respectively.
Thirteen PAHs—four parent and nine alkylated—were detected at or above concentrations of 1.5 µg/kg in more than 20 percent of post-landfall samples, whereas four parent PAHs were detected at or above the 1.5 µg/kg threshold in more than 20 percent of pre-landfall samples (table 20). Overall, PAH detection frequencies in sediment (table 20) tended to be higher than in water samples (table 17), which is expected because PAHs are hydrophobic and tend to sorb to organic material.
Comparison of Pre-Landfall to Post-Landfall Samples
Of 54 organic contaminants analyzed during both pre-landfall and post-landfall sampling periods, and for at least 80 whole-sediment samples, there were enough quantified detections above the optimal censoring threshold to make a statistical comparison of pre-landfall to post-landfall samples for 49 contaminants (table 21). Parent PAHs accounted for 19 of these contaminants, and alkylated PAHs accounted for 26 contaminants. Of these 49 contaminants, 22 showed a significant difference between pre-landfall and post-landfall samples in PPW tests (p<0.05; table 21). Concentrations were significantly higher in post-landfall samples for 20 contaminants, which included 3 PAHs and 17 alkylated PAH groups, and in pre-landfall samples for two contaminants, naphthalene and oil and grease. The difference between concentrations in post-landfall and pre-landfall sediment samples (Cpost – Cpre) at individual sites along the GOM coast, from west to east, is shown in figures 5B to 5H for some example contaminants with significantly higher concentrations during one sampling period than the other. The examples
in figures 5B–5F are PAHs that had significantly higher concentrations in post-landfall than pre-landfall samples; they represent various PAH ring structures and various degrees of alkylation. Figures 5G and 5H show naphthalene and oil and grease, respectively, for which concentrations were significantly higher in pre-landfall samples than post-landfall samples. For the three parent PAHs with significant PPW tests, chrysene, benzo[b]fluoranthene, and benzo[e]pyrene, there were high post-landfall sample concentrations at one site—LA-26 (for example, see chrysene in fig. 5B). About 1.5 to 2 times more sample pairs had a positive difference when subtracting pre-landfall samples from post-landfall samples than had a negative difference for these three PAHs, which is consistent with the significant test result.
In contrast, the significant results for 15 of 17 alkylated PAHs reflected particularly high concentrations in post-landfall samples at seven sites: LA-28, LA-26, LA-31, MS-42, AL-8, AL-9, and AL-10 (for example, see figs. 5C–5F). Five of these sites showed post-landfall evidence of M-1 oil in sediment, tarballs, or both, on the basis of PAH fingerprinting by Rosenbauer and others (2010): Grand Isle Beach at State Park, Louisiana (LA-31); Petit Bois Island Beach, Mississippi (MS-42); and BLM-1 (AL-8), BLM-2 (AL-9), and Fort Morgan BLM-3 (AL-10) in Alabama. Notably, 16 of the 17 alkylated PAHs with significantly higher concentrations in post-landfall samples were identified as relatively abundant components of weathered M-1 oil (State of Florida Oil Spill Academic Task Force, 2010). Chrysene and alkylated PAHs, however, are characteristic of petrogenic PAHs (those originating from petroleum and petroleum products) in general (Iqbal and others, 2008).
For two sites, LA-28 and LA-26, with large positive differences in alkylated PAHs when pre-landfall concentrations were subtracted from post-landfall concentrations, there was no evidence of the M-1 oil fingerprint in the post-landfall sediment samples (Rosenbauer and others, 2010). The most abundant PAH compounds in these samples were consistent with pyrogenic sources, which result from combustion of organic matter and fossil fuels. In the LA-28 sample, the most abundant PAH compound was anthracene, which is produced during rapid, high temperature pyrosynthesis but does not persist during the slow diagenesis leading to the generation of fossil fuels (Iqbal and others, 2008). In the LA-26 sample, the most abundant PAHs were fluoranthene and pyrene, and alkylated PAH concentrations were generally lower than the corresponding parent PAHs, which are characteristic of pyrogenic sources of PAHs.
Table 20. Summary statistics for organic contaminants in sediment from the Deepwater Horizon oil spill, Gulf of Mexico, 2010.
This table is presented as a Microsoft© Excel spreadsheet. It can be accessed and downloaded at URL http://pubs.usgs.gov/sir/2012/5228.

66 Contaminants in Water and Sediment Sampled in Response to the Deepwater Horizon Oil Spill Ta
ble
21.
Stat
istic
al c
ompa
rison
s of
con
tam
inan
t con
cent
ratio
ns in
pre
-land
fall
sam
ples
and
pos
t-lan
dfal
l sam
ples
from
the
Deep
wat
er H
orizo
n oi
l spi
ll, G
ulf o
f Mex
ico,
201
0:
orga
nic
cont
amin
ants
in s
edim
ent.—
Cont
inue
d
[Sig
nific
ant p
-val
ues a
re sh
aded
yel
low
(p<0
.01)
or o
rang
e (p
<0.0
5). A
bbre
viat
ions
: g/k
g, g
ram
per
kilo
gram
; mg/
kg, m
illig
ram
per
kilo
gram
; n, n
umbe
r of p
re-la
ndfa
ll an
d po
st-la
ndfa
ll sa
mpl
e pa
irs in
PP
W te
st; n
a, O
C-n
orm
aliz
atio
n is
not
app
licab
le; n
d, o
ptim
al th
resh
old
not d
eter
min
ed; n
s, no
t sig
nific
ant a
t 0.0
5 le
vel i
n a
2-si
ded
test
; OC
, org
anic
car
bon;
Pos
t, po
st-la
ndfa
ll pe
riod;
PPW
, pai
red
Pren
tice-
Wilc
oxon
; Pre
, pre
-land
fall
perio
d; µ
g/kg
, mic
rogr
am p
er k
ilogr
am; µ
g/g-
oc, m
icro
gram
per
gra
m o
f sed
imen
t org
anic
car
bon;
–, P
PW te
st w
as n
ot ru
n; <
, les
s tha
n]
Ana
lyte
Dry
-wei
ght c
once
ntra
tions
OC-
norm
aliz
ed c
once
ntra
tions
3
Uni
tsO
ptim
al
cens
orin
g th
resh
old1
Pair
ed P
rent
ice-
Wilc
oxon
test
Uni
tsO
ptim
al
cens
orin
g th
resh
old1
Pair
ed P
rent
ice-
Wilc
oxon
test
2 np-
valu
eSa
mpl
ing
peri
od w
ith
sign
ifica
ntly
hig
her
conc
entr
atio
n
2 np-
valu
eSa
mpl
ing
peri
od
with
sig
nific
antly
hi
gher
con
cent
ratio
n
1-M
ethy
lnap
htha
lene
µg/k
g0.
444
0.60
54ns
µg/g
-oc
0.54
–4–
–1-
Met
hylp
hena
nthr
ene
µg/k
g0.
3845
.50.
0975
nsµg
/g-o
c0.
4440
0.06
96ns
26-D
imet
hyln
apht
hale
neµg
/kg
0.47
45.5
0.53
78ns
µg/g
-oc
0.56
43.5
0.15
73ns
2-M
ethy
lnap
htha
lene
µg/k
g0.
5345
0.97
55ns
µg/g
-oc
0.64
–4–
–A
cena
phth
ene
µg/k
g0.
3644
.50.
5983
nsµg
/g-o
c0.
4845
0.98
75ns
Ace
naph
thyl
ene
µg/k
g0.
3845
.50.
9505
nsµg
/g-o
c0.
4645
.50.
1573
nsA
nthr
acen
eµg
/kg
0.38
45.5
0.65
15ns
µg/g
-oc
0.46
45.5
0.58
1ns
Ben
zo[a
]ant
hrac
ene
µg/k
g0.
2542
.50.
7539
nsµg
/g-o
c0.
4847
0.25
61ns
Ben
zo[a
]pyr
ene
µg/k
g0.
2542
.50.
5311
nsµg
/g-o
c0.
4847
0.11
1ns
Ben
zo[b
]fluo
rant
hene
µg/k
g0.
2347
0.03
33Po
stµg
/g-o
c0.
4443
0.05
12ns
Ben
zo[e
]pyr
ene
µg/k
g0.
3845
0.02
19Po
stµg
/g-o
c0.
7241
.50.
0074
Post
Ben
zo[g
hi]p
eryl
ene
µg/k
g0.
2543
.50.
2264
nsµg
/g-o
c0.
545
0.17
42ns
Ben
zo[k
]fluo
rant
hene
µg/k
g0.
445
.50.
3122
nsµg
/g-o
c0.
7643
0.12
57ns
Bip
heny
lµg
/kg
0.47
450.
3173
nsµg
/g-o
c0.
56–4
––
Bis
(2-e
thyl
hexy
l) ph
thal
ate
µg/k
g80
440.
5816
nsµg
/g-o
c11
044
.50.
3173
nsC
1 C
hrys
ene
µg/k
g1.
546
0.00
37Po
stµg
/g-o
c1.
745
0.00
16Po
stC
1 D
iben
zoth
ioph
enes
µg/k
g1
44.5
0.17
27ns
µg/g
-oc
1.7
450.
1932
nsC
1 Fl
uora
nthe
nes/
pyre
nes
µg/k
g0.
9144
0.01
87Po
stµg
/g-o
c1.
745
0.02
97Po
stC
1 Fl
uore
nes
µg/k
g1.
545
.50.
1573
nsµg
/g-o
c1.
7–4
––
C1
Nap
htha
lene
sµg
/kg
1.3
44.5
0.15
73ns
µg/g
-oc
1.7
–4–
–C
1 Ph
enan
thre
nes/
anth
race
nes
µg/k
g1.
546
0.02
24Po
stµg
/g-o
c1.
745
0.00
82Po
stC
2 C
hrys
enes
µg/k
g1
44.5
0.01
23Po
stµg
/g-o
c1.
745
0.00
27Po
stC
2 D
iben
zoth
ioph
enes
µg/k
g1
44.5
0.03
22Po
stµg
/g-o
c1.
745
0.01
91Po
stC
2 Fl
uora
nthe
nes/
pyre
nes
µg/k
g1.
345
0.03
79Po
stµg
/g-o
c1.
745
0.01
01Po
stC
2 flu
oren
esµg
/kg
1.3
44.5
0.01
44Po
stµg
/g-o
c1.
745
0.02
54Po
stC
2 na
phth
alen
esµg
/kg
0.91
44.5
0.63
12ns
µg/g
-oc
1.7
450.
9875
nsC
2 Ph
enan
thre
nes/
anth
race
nes
µg/k
g1
44.5
0.00
91Po
stµg
/g-o
c1.
745
0.00
27Po
stC
3 C
hrys
enes
µg/k
g1
44.5
0.01
36Po
stµg
/g-o
c1.
745
0.01
44Po
stC
3 D
iben
zoth
ioph
enes
µg/k
g1
44.5
0.01
64Po
stµg
/g-o
c1.
745
0.01
76Po
stC
3 Fl
uora
nthe
nes/
Pyre
nes
µg/k
g1.
546
0.03
58Po
stµg
/g-o
c1.
745
0.01
44Po
stC
3 Fl
uore
nes
µg/k
g1.
846
0.01
44Po
stµg
/g-o
c1.
745
0.02
54Po
stC
3 N
apht
hale
nes
µg/k
g0.
9144
.50.
6595
nsµg
/g-o
c1.
745
0.98
75ns
C3
Phen
anth
rene
s/an
thra
cene
sµg
/kg
144
.50.
0024
Post
µg/g
-oc
1.7
450.
0027
Post
Tabl
e 21
. St
atis
tical
com
paris
ons
of c
onta
min
ant c
once
ntra
tions
in p
re-la
ndfa
ll sa
mpl
es a
nd p
ost-l
andf
all s
ampl
es fr
om th
e De
epw
ater
Hor
izon
oil s
pill,
Gul
f of M
exic
o, 2
010:
or
gani
c co
ntam
inan
ts in
sed
imen
t.
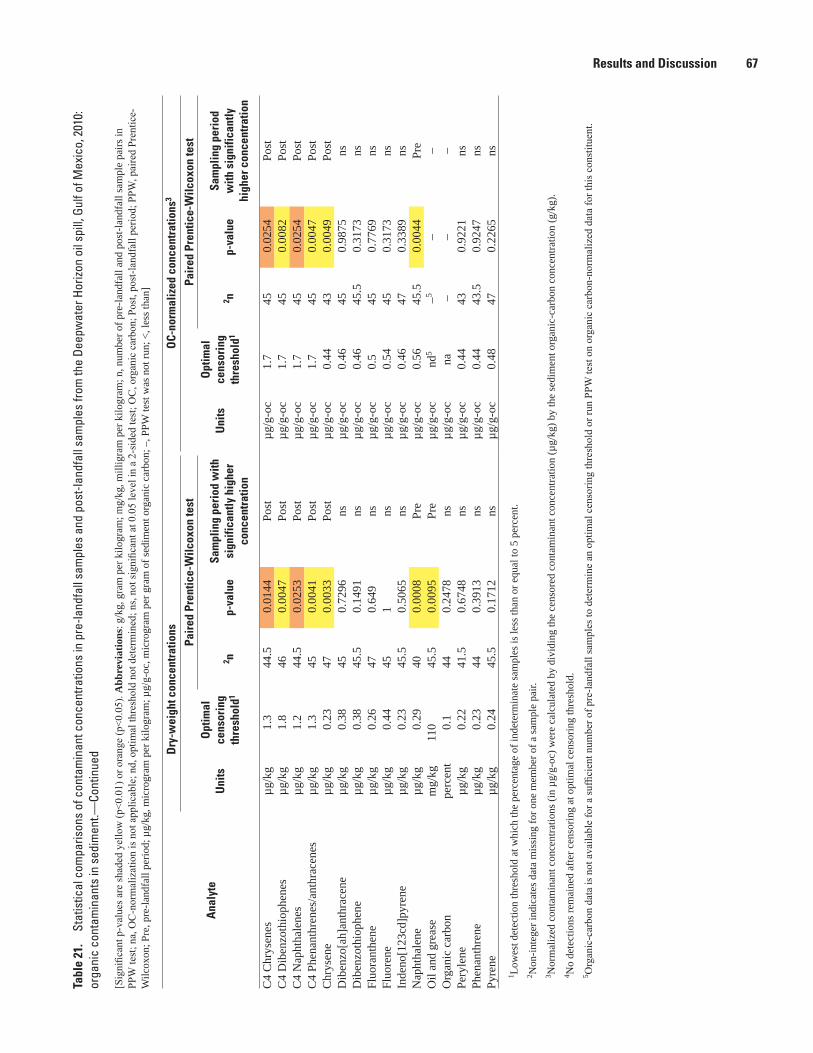
Results and Discussion 67Ta
ble
21.
Stat
istic
al c
ompa
rison
s of
con
tam
inan
t con
cent
ratio
ns in
pre
-land
fall
sam
ples
and
pos
t-lan
dfal
l sam
ples
from
the
Deep
wat
er H
orizo
n oi
l spi
ll, G
ulf o
f Mex
ico,
201
0:
orga
nic
cont
amin
ants
in s
edim
ent.—
Cont
inue
d
[Sig
nific
ant p
-val
ues a
re sh
aded
yel
low
(p<0
.01)
or o
rang
e (p
<0.0
5). A
bbre
viat
ions
: g/k
g, g
ram
per
kilo
gram
; mg/
kg, m
illig
ram
per
kilo
gram
; n, n
umbe
r of p
re-la
ndfa
ll an
d po
st-la
ndfa
ll sa
mpl
e pa
irs in
PP
W te
st; n
a, O
C-n
orm
aliz
atio
n is
not
app
licab
le; n
d, o
ptim
al th
resh
old
not d
eter
min
ed; n
s, no
t sig
nific
ant a
t 0.0
5 le
vel i
n a
2-si
ded
test
; OC
, org
anic
car
bon;
Pos
t, po
st-la
ndfa
ll pe
riod;
PPW
, pai
red
Pren
tice-
Wilc
oxon
; Pre
, pre
-land
fall
perio
d; µ
g/kg
, mic
rogr
am p
er k
ilogr
am; µ
g/g-
oc, m
icro
gram
per
gra
m o
f sed
imen
t org
anic
car
bon;
–, P
PW te
st w
as n
ot ru
n; <
, les
s tha
n]
Ana
lyte
Dry
-wei
ght c
once
ntra
tions
OC-
norm
aliz
ed c
once
ntra
tions
3
Uni
tsO
ptim
al
cens
orin
g th
resh
old1
Pair
ed P
rent
ice-
Wilc
oxon
test
Uni
tsO
ptim
al
cens
orin
g th
resh
old1
Pair
ed P
rent
ice-
Wilc
oxon
test
2 np-
valu
eSa
mpl
ing
peri
od w
ith
sign
ifica
ntly
hig
her
conc
entr
atio
n
2 np-
valu
eSa
mpl
ing
peri
od
with
sig
nific
antly
hi
gher
con
cent
ratio
n
C4
Chr
ysen
esµg
/kg
1.3
44.5
0.01
44Po
stµg
/g-o
c1.
745
0.02
54Po
stC
4 D
iben
zoth
ioph
enes
µg/k
g1.
846
0.00
47Po
stµg
/g-o
c1.
745
0.00
82Po
stC
4 N
apht
hale
nes
µg/k
g1.
244
.50.
0253
Post
µg/g
-oc
1.7
450.
0254
Post
C4
Phen
anth
rene
s/an
thra
cene
sµg
/kg
1.3
450.
0041
Post
µg/g
-oc
1.7
450.
0047
Post
Chr
ysen
eµg
/kg
0.23
470.
0033
Post
µg/g
-oc
0.44
430.
0049
Post
Dib
enzo
[ah]
anth
race
neµg
/kg
0.38
450.
7296
nsµg
/g-o
c0.
4645
0.98
75ns
Dib
enzo
thio
phen
eµg
/kg
0.38
45.5
0.14
91ns
µg/g
-oc
0.46
45.5
0.31
73ns
Fluo
rant
hene
µg/k
g0.
2647
0.64
9ns
µg/g
-oc
0.5
450.
7769
nsFl
uore
neµg
/kg
0.44
451
nsµg
/g-o
c0.
5445
0.31
73ns
Inde
no[1
23cd
]pyr
ene
µg/k
g0.
2345
.50.
5065
nsµg
/g-o
c0.
4647
0.33
89ns
Nap
htha
lene
µg/k
g0.
2940
0.00
08Pr
eµg
/g-o
c0.
5645
.50.
0044
Pre
Oil
and
grea
sem
g/kg
110
45.5
0.00
95Pr
eµg
/g-o
cnd
5–5
––
Org
anic
car
bon
perc
ent
0.1
440.
2478
nsµg
/g-o
cna
––
–Pe
ryle
neµg
/kg
0.22
41.5
0.67
48ns
µg/g
-oc
0.44
430.
9221
nsPh
enan
thre
neµg
/kg
0.23
440.
3913
nsµg
/g-o
c0.
4443
.50.
9247
nsPy
rene
µg/k
g0.
2445
.50.
1712
nsµg
/g-o
c0.
4847
0.22
65ns
1 Low
est d
etec
tion
thre
shol
d at
whi
ch th
e pe
rcen
tage
of i
ndet
erm
inat
e sa
mpl
es is
less
than
or e
qual
to 5
per
cent
. 2 N
on-in
tege
r ind
icat
es d
ata
mis
sing
for o
ne m
embe
r of a
sam
ple
pair.
3 Nor
mal
ized
con
tam
inan
t con
cent
ratio
ns (i
n µg
/g-o
c) w
ere
calc
ulat
ed b
y di
vidi
ng th
e ce
nsor
ed c
onta
min
ant c
once
ntra
tion
(µg/
kg) b
y th
e se
dim
ent o
rgan
ic-c
arbo
n co
ncen
tratio
n (g
/kg)
.4 N
o de
tect
ions
rem
aine
d af
ter c
enso
ring
at o
ptim
al c
enso
ring
thre
shol
d.5 O
rgan
ic-c
arbo
n da
ta is
not
ava
ilabl
e fo
r a su
ffici
ent n
umbe
r of p
re-la
ndfa
ll sa
mpl
es to
det
erm
ine
an o
ptim
al c
enso
ring
thre
shol
d or
run
PPW
test
on
orga
nic
carb
on-n
orm
aliz
ed d
ata
for t
his c
onst
ituen
t.

68 Contaminants in Water and Sediment Sampled in Response to the Deepwater Horizon Oil Spill
Naphthalene and oil and grease concentrations were significantly higher in pre-landfall sediment samples than post-landfall samples (table 21). Twenty-seven sample pairs have negative difference values when pre-landfall concentrations were subtracted from post-landfall concentrations, compared to only 5 pairs with positive difference values. Moreover, one site, LA-32, has a very large naphthalene difference value (fig. 5G). Similarly, oil and grease concentrations at 26 sites along the GOM coast had negative difference values when pre-landfall concentrations were subtracted from post-landfall concentrations, compared to 5 sites with positive difference values; concentrations in pre-landfill samples were substantially higher for sites LA-29, LA-22, LA-34, and AL-6 (fig. 5H). Oil and grease are operationally defined as hexane-extractable material, which includes relatively nonvolatile hydrocarbons, vegetable oils, animal fats, waxes, soaps, and greases (U.S. Environmental Protection Agency, 1998).
Because hydrophobic contaminants such as PAHs tend to be associated with organic carbon, it is possible that differences in the amount of organic carbon in pre-landfall and post-landfall samples could have caused or contributed to the significant differences in PAH concentrations. Therefore, the PPW tests were repeated after normalizing organic contaminant concentrations to the sediment-TOC content (table 21). Of the 20 PAHs with significantly higher concentrations in post-landfall samples, 19 continued to show a significant difference after organic-carbon normalization; the 20th had a p-value of 0.051, which is only slightly greater than the significance criterion of p<0.05. Sediment-TOC data were insufficient to normalize oil and grease concentrations; however, naphthalene concentrations were significantly higher in pre-landfall than in post-landfall samples even after organic-carbon normalization. Moreover, there was no significant difference in sediment-TOC content between the two sampling periods (table 21). These PPW test results indicate that the significant differences are not likely due to differing amounts of sediment-TOC in samples from pre-landfall and post-landfall periods.
The results of the present study, combined with direct evidence from the oil fingerprinting study by Rosenbauer and others (2010), indicate that M-1 oil could have contributed to the higher alkylated PAH concentrations measured at five sites, LA-31, MS-42, AL-8, AL-9, and AL-10, sampled in October 2010, relative to pre-landfall concentrations; however, other PAH sources, including other sources of oil, cannot
be excluded. There are many possible sources of oil-related contaminants in the GOM, including natural oil seepage, which is estimated at about one million barrels of petroleum hydrocarbons each year; various oil spills from production operations, which contribute approximately 74,000 barrels each year; transportation accidents; and unburned engine fuel (Operational Science Advisory Team, 2010). A previous study of PAH sources along the Louisiana coast (Iqbal and others, 2008) reported that approximately 50 percent of PAHs were from petrogenic sources; 36 percent were from pyrogenic sources; and 14 percent were from diagenetic sources, that is, the chemical or biological transformation of natural organic matter.
Comparison with Benchmarks for Aquatic LifeThe USEPA ESBTU benchmarks address the additive
toxicity of PAH and BTEX compound mixtures in sediment (table 5D). As noted previously, ΣESBTUi values were calculated only for PAHs because BTEX compounds were not determined in sediment. One sediment sample exceeded the chronic ESBTU benchmark for PAH mixtures: the pre-landfall sample from Trinity Bay near Beach City, Texas (site TX-52). This site was outside the area of expected oil landfall and was not sampled during the post-landfall period. Notably, sediment-TOC concentrations in the present study were very low, having a median of 0.1 percent, which could affect bioavailability and potential toxicity. As previously noted, equilibrium-partitioning theory predicts PAH toxicity in sediments that have a TOC content of 0.2 percent or above (U.S. Environmental Protection Agency, 2002).
Empirical screening values (table 5E) for 20 individual PAHs, 3 PAH mixtures, and 24 other SVOCs in sediment were used to classify sites into one of three categories: the minimal-effect, possible-effect, and probable-effect ranges. Of 165 sediment samples analyzed for organic contaminants that have benchmarks, 116 samples (70 percent) had no lower or upper screening values exceeded by any of the organic contaminants determined in the sample, so these were in the minimal-effect range where no adverse effects would be expected; 45 samples (27 percent) exceeded one or more upper screening values and so were in the probable-effect range, where there is a high probability of adverse effects on aquatic life; and only 4 samples (2 percent) were in the possible-effect range (table 19; appendix table 3-2).
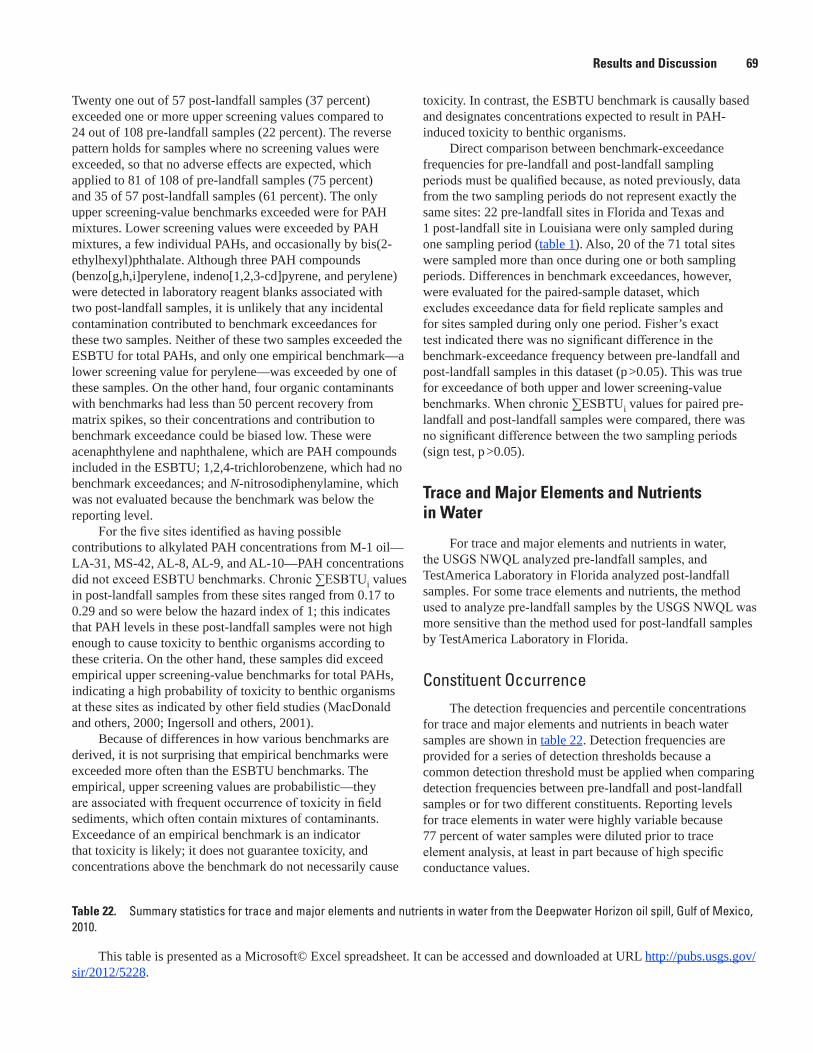
Results and Discussion 69
Twenty one out of 57 post-landfall samples (37 percent) exceeded one or more upper screening values compared to 24 out of 108 pre-landfall samples (22 percent). The reverse pattern holds for samples where no screening values were exceeded, so that no adverse effects are expected, which applied to 81 of 108 of pre-landfall samples (75 percent) and 35 of 57 post-landfall samples (61 percent). The only upper screening-value benchmarks exceeded were for PAH mixtures. Lower screening values were exceeded by PAH mixtures, a few individual PAHs, and occasionally by bis(2-ethylhexyl)phthalate. Although three PAH compounds (benzo[g,h,i]perylene, indeno[1,2,3-cd]pyrene, and perylene) were detected in laboratory reagent blanks associated with two post-landfall samples, it is unlikely that any incidental contamination contributed to benchmark exceedances for these two samples. Neither of these two samples exceeded the ESBTU for total PAHs, and only one empirical benchmark—a lower screening value for perylene—was exceeded by one of these samples. On the other hand, four organic contaminants with benchmarks had less than 50 percent recovery from matrix spikes, so their concentrations and contribution to benchmark exceedance could be biased low. These were acenaphthylene and naphthalene, which are PAH compounds included in the ESBTU; 1,2,4-trichlorobenzene, which had no benchmark exceedances; and N-nitrosodiphenylamine, which was not evaluated because the benchmark was below the reporting level.
For the five sites identified as having possible contributions to alkylated PAH concentrations from M-1 oil—LA-31, MS-42, AL-8, AL-9, and AL-10—PAH concentrations did not exceed ESBTU benchmarks. Chronic ∑ESBTUi values in post-landfall samples from these sites ranged from 0.17 to 0.29 and so were below the hazard index of 1; this indicates that PAH levels in these post-landfall samples were not high enough to cause toxicity to benthic organisms according to these criteria. On the other hand, these samples did exceed empirical upper screening-value benchmarks for total PAHs, indicating a high probability of toxicity to benthic organisms at these sites as indicated by other field studies (MacDonald and others, 2000; Ingersoll and others, 2001).
Because of differences in how various benchmarks are derived, it is not surprising that empirical benchmarks were exceeded more often than the ESBTU benchmarks. The empirical, upper screening values are probabilistic—they are associated with frequent occurrence of toxicity in field sediments, which often contain mixtures of contaminants. Exceedance of an empirical benchmark is an indicator that toxicity is likely; it does not guarantee toxicity, and concentrations above the benchmark do not necessarily cause
toxicity. In contrast, the ESBTU benchmark is causally based and designates concentrations expected to result in PAH-induced toxicity to benthic organisms.
Direct comparison between benchmark-exceedance frequencies for pre-landfall and post-landfall sampling periods must be qualified because, as noted previously, data from the two sampling periods do not represent exactly the same sites: 22 pre-landfall sites in Florida and Texas and 1 post-landfall site in Louisiana were only sampled during one sampling period (table 1). Also, 20 of the 71 total sites were sampled more than once during one or both sampling periods. Differences in benchmark exceedances, however, were evaluated for the paired-sample dataset, which excludes exceedance data for field replicate samples and for sites sampled during only one period. Fisher’s exact test indicated there was no significant difference in the benchmark-exceedance frequency between pre-landfall and post-landfall samples in this dataset (p >0.05). This was true for exceedance of both upper and lower screening-value benchmarks. When chronic ∑ESBTUi values for paired pre-landfall and post-landfall samples were compared, there was no significant difference between the two sampling periods (sign test, p >0.05).
Trace and Major Elements and Nutrients in Water
For trace and major elements and nutrients in water, the USGS NWQL analyzed pre-landfall samples, and TestAmerica Laboratory in Florida analyzed post-landfall samples. For some trace elements and nutrients, the method used to analyze pre-landfall samples by the USGS NWQL was more sensitive than the method used for post-landfall samples by TestAmerica Laboratory in Florida.
Constituent OccurrenceThe detection frequencies and percentile concentrations
for trace and major elements and nutrients in beach water samples are shown in table 22. Detection frequencies are provided for a series of detection thresholds because a common detection threshold must be applied when comparing detection frequencies between pre-landfall and post-landfall samples or for two different constituents. Reporting levels for trace elements in water were highly variable because 77 percent of water samples were diluted prior to trace element analysis, at least in part because of high specific conductance values.
Table 22. Summary statistics for trace and major elements and nutrients in water from the Deepwater Horizon oil spill, Gulf of Mexico, 2010.
This table is presented as a Microsoft© Excel spreadsheet. It can be accessed and downloaded at URL http://pubs.usgs.gov/sir/2012/5228.

70 Contaminants in Water and Sediment Sampled in Response to the Deepwater Horizon Oil Spill
Several patterns of trace-element occurrence were observed. Uncensored detection frequencies for many constituents tended to be higher in pre-landfall samples than in post-landfall samples. For some constituents, however, this simply reflects the lower reporting levels used to analyze these constituents in pre-landfall samples. When data were censored to a common reporting level, detection frequencies and concentrations were similar (table 22). For example, zinc concentrations detected in pre-landfall water samples (filled circles in fig. 4D) were generally below the laboratory reporting levels for post-landfall samples (unfilled squares in fig. 4D). However, after censoring at the optimal censoring threshold of 80 µg/L, the detection frequencies for zinc in water samples from the two sampling periods were the same at about 2 percent (table 22). Additional examples of this pattern were found with lead, which was detected above a threshold of 20 µg/L in 2 to 3 percent of samples from both sampling periods, and iron, which was detected above a threshold of 500 µg/L in 41 to 42 percent of samples from both periods. Molybdenum in water (fig. 4E) showed a different pattern, in which uncensored detection frequencies were higher in pre-landfall samples than post-landfall samples, but the concentration distribution was higher in post-landfall samples. After censoring to the optimal threshold of 20 µg/L, the molybdenum detection frequency was actually higher in post-landfall samples, at 8 percent, than in pre-landfall samples, where it was 0 percent. Aluminum and manganese also showed greater detection frequencies above their respective optimal censoring thresholds in post-landfall than pre-landfall samples. The nutrients, phosphorus and ammonia, were more frequently detected in pre-landfall than post-landfall samples, even after censoring to a common detection threshold. Phosphorus concentrations (fig. 4F) in post-landfall water samples had to be blank-censored first to minimize the possibility that the detected concentrations were the result of incidental contamination. Because the blank-censoring procedure is intentionally conservative, this could have overestimated the extent of incidental contamination and thus lowered the post-landfall sample detection frequency. Similarly, ammonia plus organic nitrogen (fig. 4G) was blank-censored in post-landfall water samples because of detection in each of four field blanks for the post-landfall sampling period. The conservative blank-censoring procedure resulted in censored data with high reporting levels for all post-landfall samples. When detection frequencies were computed at the optimal censoring threshold of 2.4 mg/L as
nitrogen (N), the ammonia detection frequencies were zero in both sampling periods. Barium, calcium, magnesium, potassium, and sodium were detected in 100 percent of both pre-landfall and post-landfall water samples, although some concentrations in post-landfall samples were higher than in pre-landfall samples (for example, potassium in fig. 4H; appendix 2–3).
Comparison of Pre-Landfall to Post-Landfall Samples
Statistical comparisons of trace and major element and nutrient concentrations in water were made for 17 of the 26 constituents determined in water during both study periods (table 23). The other nine constituents had no detections remaining after censoring, so no comparisons were made. The PPW test indicated significant differences between concentrations in pre-landfall and post-landfall water samples for nine constituents: six trace or major elements had higher concentrations in post-landfall samples, and three nutrients had higher concentrations in pre-landfall samples (table 23). Concentrations were higher in post-landfall samples for barium, calcium, magnesium, molybdenum, potassium and sodium. These are all elements in seawater (Turekian, 1968), and barium sulfate is a standard additive in drilling mud (Argonne National Laboratory and others, 2012). By using molybdenum as an example, figure 6A shows the difference in molybdenum concentrations in water between post-landfall and pre-landfall samples at individual sites along the GOM coast from west to east. Many sites had censored data for one or both samples; these are represented by bars that touch or cross the x-axis, that is, where y equals zero. Eighteen sites showed a positive difference when pre-landfall samples were subtracted from post-landfall samples, indicating higher post-landfall sample concentrations than pre-landfall, and six sites showed a negative difference, indicating the opposite.
Three nutrients, ammonia as N, ammonia as NH4, and phosphorus, showed statistically significant differences (table 23), having higher detection frequencies (table 22) and higher concentrations in pre-landfall samples than post-landfall samples (for example, fig. 6B). Data were insufficient to assess ammonia plus organic nitrogen. Statistical comparisons were not significant for organic nitrogen and dissolved nitrogen (table 23).
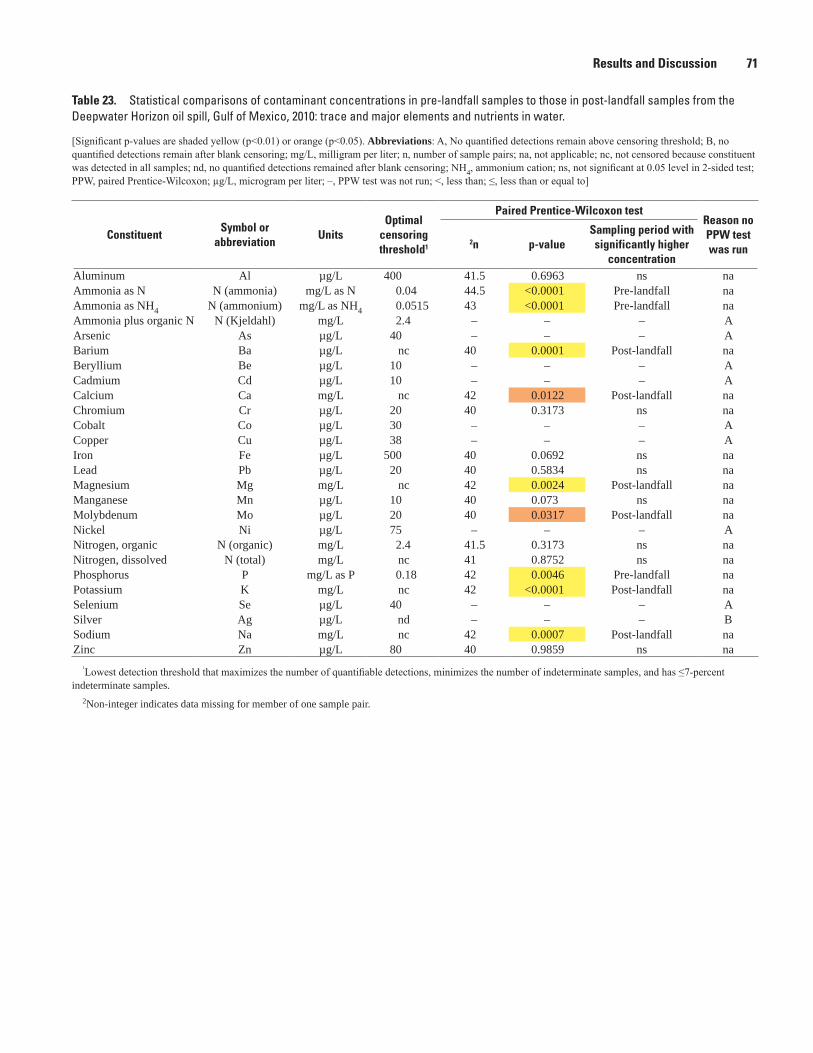
Results and Discussion 71
Table 23. Statistical comparisons of contaminant concentrations in pre-landfall samples to those in post-landfall samples from the Deepwater Horizon oil spill, Gulf of Mexico, 2010: trace and major elements and nutrients in water.
[Significant p-values are shaded yellow (p<0.01) or orange (p<0.05). Abbreviations: A, No quantified detections remain above censoring threshold; B, no quantified detections remain after blank censoring; mg/L, milligram per liter; n, number of sample pairs; na, not applicable; nc, not censored because constituent was detected in all samples; nd, no quantified detections remained after blank censoring; NH4, ammonium cation; ns, not significant at 0.05 level in 2-sided test; PPW, paired Prentice-Wilcoxon; µg/L, microgram per liter; –, PPW test was not run; <, less than; ≤, less than or equal to]
ConstituentSymbol or
abbreviationUnits
Optimal censoring threshold1
Paired Prentice-Wilcoxon testReason no PPW test was run
2n p-valueSampling period with significantly higher
concentrationAluminum Al µg/L 400 41.5 0.6963 ns naAmmonia as N N (ammonia) mg/L as N 0.04 44.5 <0.0001 Pre-landfall naAmmonia as NH4 N (ammonium) mg/L as NH4 0.0515 43 <0.0001 Pre-landfall naAmmonia plus organic N N (Kjeldahl) mg/L 2.4 – – – AArsenic As µg/L 40 – – – ABarium Ba µg/L nc 40 0.0001 Post-landfall naBeryllium Be µg/L 10 – – – ACadmium Cd µg/L 10 – – – ACalcium Ca mg/L nc 42 0.0122 Post-landfall naChromium Cr µg/L 20 40 0.3173 ns naCobalt Co µg/L 30 – – – ACopper Cu µg/L 38 – – – AIron Fe µg/L 500 40 0.0692 ns naLead Pb µg/L 20 40 0.5834 ns naMagnesium Mg mg/L nc 42 0.0024 Post-landfall naManganese Mn µg/L 10 40 0.073 ns naMolybdenum Mo µg/L 20 40 0.0317 Post-landfall naNickel Ni µg/L 75 – – – ANitrogen, organic N (organic) mg/L 2.4 41.5 0.3173 ns naNitrogen, dissolved N (total) mg/L nc 41 0.8752 ns naPhosphorus P mg/L as P 0.18 42 0.0046 Pre-landfall naPotassium K mg/L nc 42 <0.0001 Post-landfall naSelenium Se µg/L 40 – – – ASilver Ag µg/L nd – – – BSodium Na mg/L nc 42 0.0007 Post-landfall naZinc Zn µg/L 80 40 0.9859 ns na
1Lowest detection threshold that maximizes the number of quantifiable detections, minimizes the number of indeterminate samples, and has ≤7-percent indeterminate samples.
2Non-integer indicates data missing for member of one sample pair.

72 Contaminants in Water and Sediment Sampled in Response to the Deepwater Horizon Oil Spill
sac1
2-04
52_F
igur
e 6a
b
CPOST MINUS CPRE,IN MILLIGRAMS PER LITER AS N
MAP
NUM
BER
(WES
T TO
EAS
T)
TX-56
TX-55
TX-51
TX-53
TX-49
TX-47
LA-46
LA-25
LA-23
LA-28
LA-26
LA-24
LA-31
LA-36
LA-35
LA-32
LA-33
LA-29
LA-22
LA-30
LA-34
MS-43
MS-37
MS-38
MS-39
MS-44
MS-40
MS-41
MS-45
MS-42
AL-1
AL-2
AL-3
AL-4
AL-8
AL-5
AL-9
AL-10
AL-6
AL-7
FL-1
FL-2
FL-3
FL-4
FL-25
FL-5
FL-6
FL-7
–0.2
5
–0.2
–0.1
5
–0.1
–0.0
50
0.050.
1
CPOST MINUS CPRE,IN MICROGRAMS PER LITER
MAP
NUM
BER
(WES
T TO
EAS
T)
TX-56
TX-55
TX-51
TX-53
TX-49
TX-47
LA-46
LA-25
LA-23
LA-28
LA-26
LA-24
LA-31
LA-36
LA-35
LA-32
LA-33
LA-29
LA-22
LA-30
LA-34
MS-43
MS-37
MS-38
MS-39
MS-44
MS-40
MS-41
MS-45
MS-42
AL-1
AL-2
AL-3
AL-4
AL-8
AL-5
AL-9
AL-10
AL-6
AL-7
FL-1
FL-2
FL-3
FL-4
FL-25
FL-5
FL-6
FL-7
–15
–10–50510152025
Min
imum
Max
imum
Gray
bar
indi
cate
sm
issi
ng d
ata
or n
o sa
mpl
e
Min
imum
Max
imum
Gr
ay b
ar in
dica
tes
mis
sing
dat
aor
no
sam
ple
AM
olyb
denu
m in
wat
erC PO
ST m
inus
CPR
E > 0
(p =
0.0
317)
BA
mm
onia
(as
N) i
n w
ater
C POST
min
us C
PRE <
0 (p
= 0
.000
1)
Not
e: <
is le
ss th
an; >
is g
reat
er th
an
Figu
re 6
. Fo
r sel
ecte
d an
alyt
es, d
iffer
ence
bet
wee
n tra
ce a
nd m
ajor
ele
men
t and
nut
rient
con
cent
ratio
ns in
sam
ples
col
lect
ed d
urin
g po
st-la
ndfa
ll an
d pr
e-la
ndfa
ll pe
riods
(Cpo
st m
inus
Cpr
e) b
y th
e US
GS a
t Dee
pwat
er H
orizo
n oi
l spi
ll sa
mpl
ing
site
s al
ong
the
Gulf
of M
exic
o co
ast,
2010
, fro
m w
est t
o ea
st: (
A) m
olyb
denu
m in
wat
er,
(B) a
mm
onia
as
N in
wat
er, (
C) le
ad in
who
le s
edim
ent,
and
(D) l
ead
in th
e le
ss th
an 6
3-m
icro
met
er (<
63-µ
m) s
edim
ent f
ract
ion.
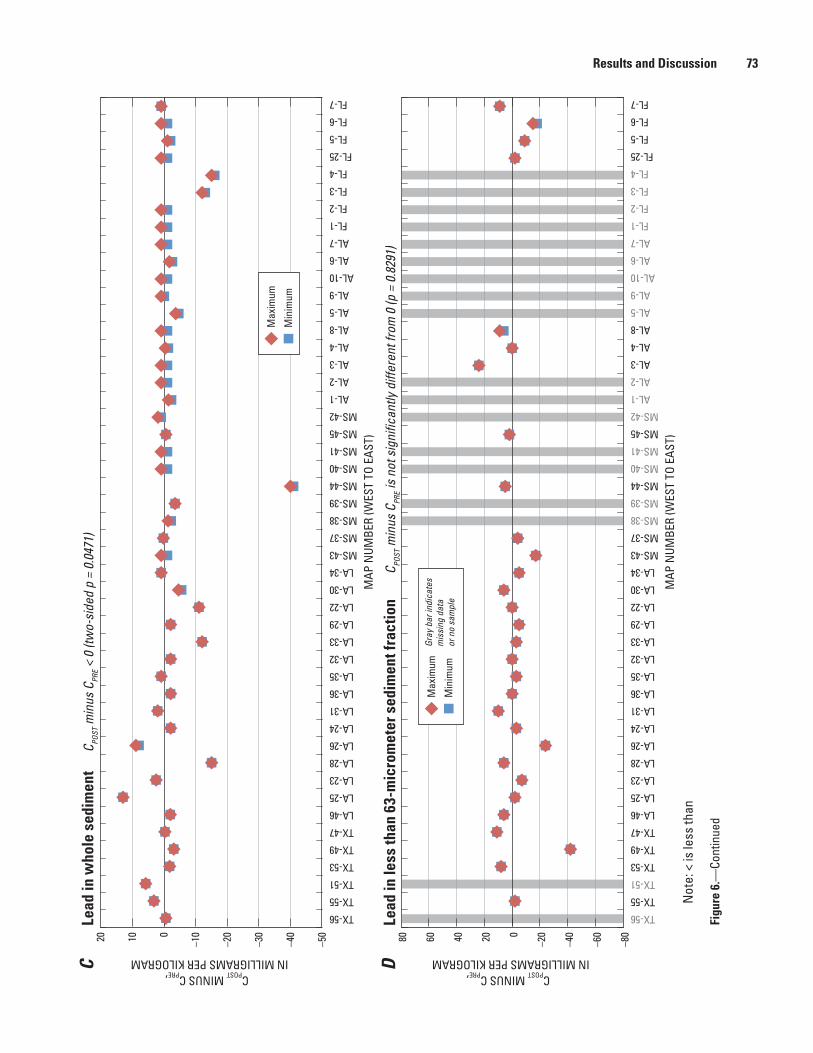
Results and Discussion 73
sac1
2-04
52_F
igur
e 6c
d
CPOST MINUS CPRE,IN MILLIGRAMS PER KILOGRAM
MAP
NUM
BER
(WES
T TO
EAS
T)
TX-56
TX-55
TX-51
TX-53
TX-49
TX-47
LA-46
LA-25
LA-23
LA-28
LA-26
LA-24
LA-31
LA-36
LA-35
LA-32
LA-33
LA-29
LA-22
LA-30
LA-34
MS-43
MS-37
MS-38
MS-39
MS-44
MS-40
MS-41
MS-45
MS-42
AL-1
AL-2
AL-3
AL-4
AL-8
AL-5
AL-9
AL-10
AL-6
AL-7
FL-1
FL-2
FL-3
FL-4
FL-25
FL-5
FL-6
FL-7
–80
–60
–40
–20020406080
CPOST MINUS CPRE,IN MILLIGRAMS PER KILOGRAM
MAP
NUM
BER
(WES
T TO
EAS
T)
TX-56
TX-55
TX-51
TX-53
TX-49
TX-47
LA-46
LA-25
LA-23
LA-28
LA-26
LA-24
LA-31
LA-36
LA-35
LA-32
LA-33
LA-29
LA-22
LA-30
LA-34
MS-43
MS-37
MS-38
MS-39
MS-44
MS-40
MS-41
MS-45
MS-42
AL-1
AL-2
AL-3
AL-4
AL-8
AL-5
AL-9
AL-10
AL-6
AL-7
FL-1
FL-2
FL-3
FL-4
FL-25
FL-5
FL-6
FL-7
–50
–40
–30
–20
–1001020
Min
imum
Max
imum
Gr
ay b
ar in
dica
tes
mis
sing
dat
aor
no
sam
ple
Min
imum
Max
imum
CLe
ad in
who
le s
edim
ent
C POST
min
us C
PRE <
0 (t
wo-
side
d p
= 0.
0471
)
DLe
ad in
less
than
63-
mic
rom
eter
sed
imen
t fra
ctio
nC PO
ST m
inus
CPR
E is n
ot s
igni
fican
tly d
iffer
ent f
rom
0 (p
= 0
.829
1)
Not
e: <
is le
ss th
an
Figu
re 6
.—Co
ntin
ued

74 Contaminants in Water and Sediment Sampled in Response to the Deepwater Horizon Oil Spill
Comparison with Benchmarks for Human Health and Aquatic Life
U.S. Environmental Protection Agency (2010) recommended that concentrations of nickel and vanadium in water be compared to human-health benchmarks for recreational exposure. Neither was exceeded in any water samples collected in the present study, and recreational exposure-based human-health benchmarks were not available for other trace elements.
Aquatic-life benchmarks were available for 18 trace elements in water (table 6A). Benchmarks were identified from a number of sources, including USEPA and NOAA, and included both acute and chronic marine benchmarks. As noted previously, trace-element concentrations were converted from total to dissolved concentrations by the use of marine conversion factors from the U.S. Environmental Protection Agency (2011d). Acute aquatic-life benchmarks for one or more trace elements were exceeded in 23 of 158 water samples (table 24A, appendix table 3-3), of which 22 samples were from the post-landfall period and 1 was from the pre-landfall period; these samples with observed acute benchmark exceedances represent 39 percent of post-landfall samples and 1 percent of pre-landfall samples. The elements responsible for acute benchmark exceedances were copper in all 23 samples, and zinc in 2 samples. The one pre-landfall sample with exceedances was from Louisiana, whereas post-landfall samples with exceedances were found in all five states sampled. In addition, chronic aquatic-life benchmarks were exceeded by concentrations of one or more trace elements in 74 of 158 samples, including 22 of 102 pre-landfall samples and 52 of 56 post-landfall samples; the samples with observed chronic benchmark exceedances represent 22 percent of total pre-landfall samples and 93 percent of total post-landfall samples. Overall, boron exceeded the chronic benchmarks in 50 water samples, manganese in 30, copper in 24, cobalt in 19, nickel in 7, lead in 6, barium in 3, zinc in 2, and vanadium in 1 water sample. The post-landfall sample from site LA-25, Rockefeller Refuge Beach, Louisiana, exceeded chronic benchmarks for eight trace elements, including nickel and vanadium; excluding this sample, the other post-landfall chronic benchmarks exceeded were for boron in 47 water samples, copper in 21, manganese in 11, and barium in 1 water sample.
For trace elements in water, statistical comparison of the proportion of samples exceeding aquatic-life benchmarks between the pre-landfall and post-landfall sampling periods was precluded because of the highly variable reporting levels and the large number of censored values that had reporting levels greater than the applicable benchmarks. For example, of 40 post-landfall samples in the paired-sample dataset, 1 sample exceeded the 8.1 µg/L aquatic-life benchmark for lead, 3 samples were less than this benchmark value,
16 samples were reported as censored values of less than 10 µg/L, and 20 samples were reported as censored values of less than 20 µg/L. The lead concentration could exceed the benchmark in none, some, or all of the 36 samples reported as having less than 10 or less than 20 µg/L of lead. The single benchmark exceedance observed for lead in post-landfall samples in the paired-sample dataset, therefore, represents the minimum number of exceedances of this benchmark for the 40 post-landfall samples, and the actual number of post-landfall samples with lead concentrations higher than 8.1 µg/L in this dataset could be substantially greater—theoretically, as few as 1 sample and as many as 37 of the 40 post-landfall water samples could exceed the benchmark for lead. In this sense, the uncensored benchmark-exceedance frequencies presented in this report are essentially minimum exceedance frequencies; if the analytical methods used for post-landfall samples were more sensitive, it is possible that a greater number of benchmark exceedances would have been identified. For antimony, boron, and vanadium, comparisons to benchmarks were limited because these elements were analyzed largely during only one sampling period. For arsenic, cadmium, cobalt, copper, lead, nickel, and silver, benchmark exceedance could not be ascertained for between 35 and 100 percent of samples during one or both sampling periods because concentrations were censored values at reporting levels that were higher than the applicable benchmarks. For the following analytes and sampling periods, therefore, the exceedance frequencies presented in this report could be substantially underestimated: antimony, boron, and vanadium in the pre-landfall period; arsenic, cadmium, cobalt, lead, nickel, and silver in the post-landfall period; and copper in both sampling periods. This is illustrated in figure 7, which shows the number of aquatic-life benchmark exceedances, by element and sampling period, for the 40 sample pairs in the paired-sample data set. The blue and red bars in figure 7A represent the number of observed benchmark exceedances for a given element in pre-landfall and post-landfall periods, respectively. The height of each bar in figure 7A represents the minimum number of exceedances for that element and sampling period because some samples had missing data or were censored at reporting levels too high to ascertain whether or not the benchmark was exceeded. In figure 7B, samples that are missing data (antimony, boron, and vanadium), or are censored values with reporting levels higher than the applicable benchmark, are assumed to be possible benchmark exceedances and are shown as a lighter colored segment in the stacked bar (lighter blue for pre-landfall samples and lighter red for post-landfall samples); the total height of the stacked bar represents the maximum number of exceedances possible for that element and sampling period. It is clear that several trace elements have reporting levels above the applicable benchmarks in a large number of samples, or were not analyzed in a large number of samples.

Results and Discussion 75Ta
ble
24A
. Su
mm
ary
of b
ench
mar
k an
d ba
selin
e ex
ceed
ance
s fo
r tra
ce a
nd m
ajor
ele
men
ts fr
om th
e De
epw
ater
Hor
izon
oil s
pill,
Gul
f of M
exic
o, 2
010:
ben
chm
ark
exce
edan
ces
in w
ater
.
[Abb
revi
atio
ns: B
, bor
on; B
a, b
ariu
m; C
o, c
obal
t; C
u, c
oppe
r; M
n, m
anga
nese
; Ni,
nick
el; P
b, le
ad; V
, van
adiu
m; Z
n, z
inc;
<, l
ess t
han;
–, n
o be
nchm
arks
exc
eede
d]
Stat
eN
umbe
r of
site
sTo
tal n
umbe
r of
sam
ples
1
Num
ber o
f sam
ples
with
ben
chm
ark
exce
edan
ces
Elem
ents
that
exc
eede
d be
nchm
arks
(num
ber o
f sam
ples
)
Hum
an
heal
thA
quat
ic li
fe:
acut
eA
quat
ic li
fe:
chro
nic
Aqu
atic
life
: ac
ute
Aqu
atic
life
: chr
onic
Pre-
land
fall
sam
plin
g pe
riod
Texa
s10
120
09
–C
o (9
), Pb
(2),
Mn
(9),
Ni (
2)Lo
uisi
ana
1519
01
9C
u (1
), Zn
(1)
Ba
(1),
Co
(9),
Cu
(2),
Pb (3
), M
n (7
), N
i (4)
, Zn
(1)
Mis
siss
ippi
33
00
1–
Co
(1),
Mn
(1)
Ala
bam
a9
130
03
–B
(2),
Mn
(1)
Flor
ida
2655
00
0–
–To
tal p
re-la
ndfa
ll63
102
01
22Po
st-la
ndfa
ll sa
mpl
ing
perio
dTe
xas
68
04
8C
u (4
)B
(8),
Cu
(4),
Mn
(2)
Loui
sian
a16
180
714
Cu
(7),
Zn (1
)B
a (2
), B
(10)
, Cu
(7),
Pb (1
), M
n (7
), N
i (1)
, V (1
), Zn
(1)
Mis
siss
ippi
910
06
10C
u (6
)B
(10)
, Cu
(6),
Mn
(2)
Ala
bam
a10
110
311
Cu
(3)
B (1
1), C
u (3
), M
n (1
)Fl
orid
a8
90
29
Cu
(2)
B (9
), C
u (2
)To
tal p
ost-
land
fall
4956
022
52To
tal (
all s
ampl
es)
112
158
023
741 Th
e to
tal n
umbe
r of s
ampl
es in
clud
es fi
eld
repl
icat
e sa
mpl
es, w
hich
typi
cally
wer
e co
llect
ed fr
om a
giv
en si
te o
n th
e sa
me
date
.
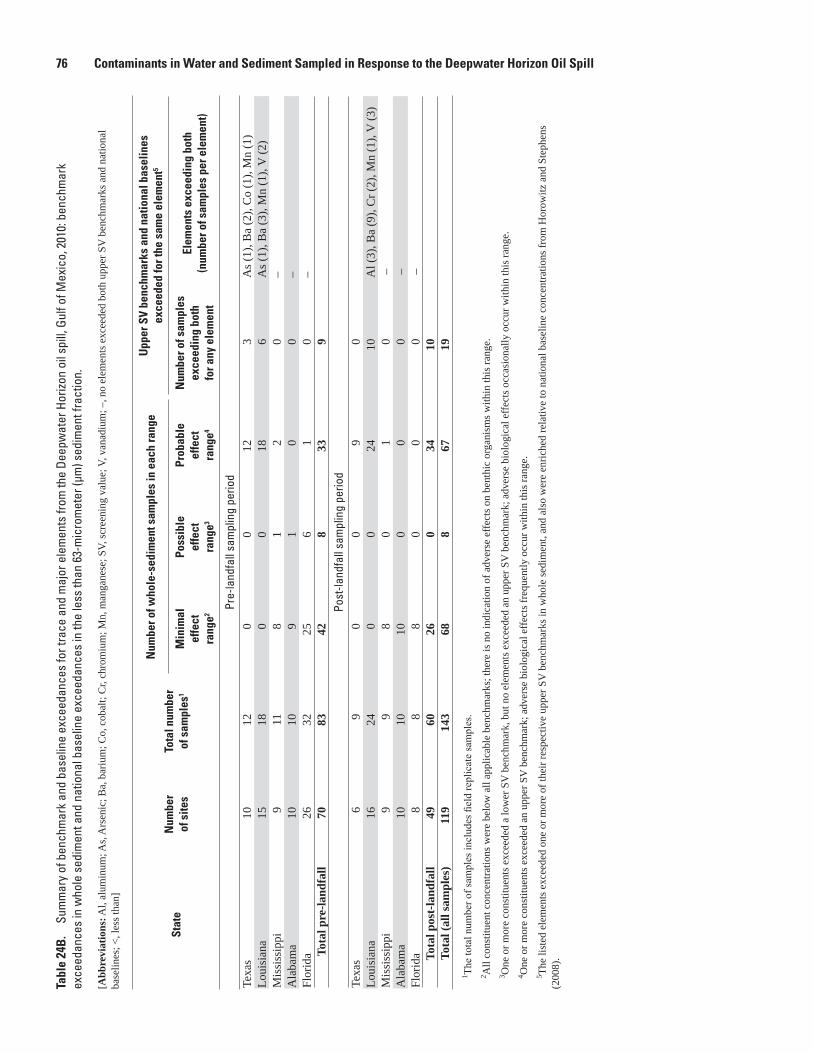
76 Contaminants in Water and Sediment Sampled in Response to the Deepwater Horizon Oil Spill Ta
ble
24B
. Su
mm
ary
of b
ench
mar
k an
d ba
selin
e ex
ceed
ance
s fo
r tra
ce a
nd m
ajor
ele
men
ts fr
om th
e De
epw
ater
Hor
izon
oil s
pill,
Gul
f of M
exic
o, 2
010:
ben
chm
ark
exce
edan
ces
in w
hole
sed
imen
t and
nat
iona
l bas
elin
e ex
ceed
ance
s in
the
less
than
63-
mic
rom
eter
(µm
) sed
imen
t fra
ctio
n.
[Abb
revi
atio
ns: A
l, al
umin
um; A
s, A
rsen
ic; B
a, b
ariu
m; C
o, c
obal
t; C
r, ch
rom
ium
; Mn,
man
gane
se; S
V, sc
reen
ing
valu
e; V
, van
adiu
m; –
, no
elem
ents
exc
eede
d bo
th u
pper
SV
ben
chm
arks
and
nat
iona
l ba
selin
es; <
, les
s tha
n]
Stat
eN
umbe
r of
site
sTo
tal n
umbe
r of
sam
ples
1
Num
ber o
f who
le-s
edim
ent s
ampl
es in
eac
h ra
nge
Upp
er S
V be
nchm
arks
and
nat
iona
l bas
elin
es
exce
eded
for t
he s
ame
elem
ent5
Min
imal
ef
fect
ra
nge2
Poss
ible
ef
fect
ra
nge3
Prob
able
ef
fect
ra
nge4
Num
ber o
f sam
ples
ex
ceed
ing
both
fo
r any
ele
men
t
Elem
ents
exc
eedi
ng b
oth
(num
ber o
f sam
ples
per
ele
men
t)
Pre-
land
fall
sam
plin
g pe
riod
Texa
s10
120
012
3A
s (1)
, Ba
(2),
Co
(1),
Mn
(1)
Loui
sian
a15
180
018
6A
s (1)
, Ba
(3),
Mn
(1),
V (2
)M
issi
ssip
pi9
118
12
0–
Ala
bam
a10
109
10
0–
Flor
ida
2632
256
10
–To
tal p
re-la
ndfa
ll70
8342
833
9Po
st-la
ndfa
ll sa
mpl
ing
perio
dTe
xas
69
00
90
Loui
sian
a16
240
024
10A
l (3)
, Ba
(9),
Cr (
2), M
n (1
), V
(3)
Mis
siss
ippi
99
80
10
–A
laba
ma
1010
100
00
–Fl
orid
a8
88
00
0 –
Tota
l pos
t-la
ndfa
ll49
6026
034
10To
tal (
all s
ampl
es)
119
143
688
6719
1 The
tota
l num
ber o
f sam
ples
incl
udes
fiel
d re
plic
ate
sam
ples
. 2 A
ll co
nstit
uent
con
cent
ratio
ns w
ere
belo
w a
ll ap
plic
able
ben
chm
arks
; the
re is
no
indi
catio
n of
adv
erse
effe
cts o
n be
nthi
c or
gani
sms w
ithin
this
rang
e.3 O
ne o
r mor
e co
nstit
uent
s exc
eede
d a
low
er S
V b
ench
mar
k, b
ut n
o el
emen
ts e
xcee
ded
an u
pper
SV
ben
chm
ark;
adv
erse
bio
logi
cal e
ffect
s occ
asio
nally
occ
ur w
ithin
this
rang
e.4 O
ne o
r mor
e co
nstit
uent
s exc
eede
d an
upp
er S
V b
ench
mar
k; a
dver
se b
iolo
gica
l effe
cts f
requ
ently
occ
ur w
ithin
this
rang
e.5 Th
e lis
ted
elem
ents
exc
eede
d on
e or
mor
e of
thei
r res
pect
ive
uppe
r SV
ben
chm
arks
in w
hole
sedi
men
t, an
d al
so w
ere
enric
hed
rela
tive
to n
atio
nal b
asel
ine
conc
entra
tions
from
Hor
owitz
and
Ste
phen
s (2
008)
.
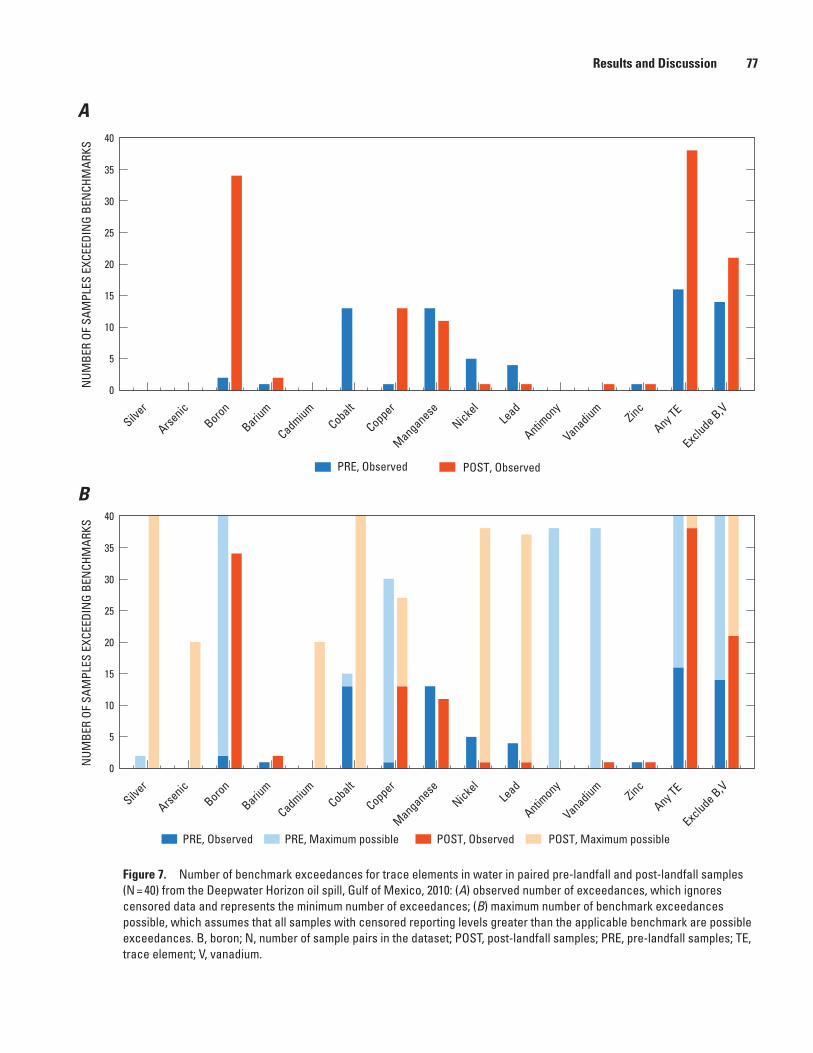
Results and Discussion 77
PRE, Observed PRE, Maximum possible POST, Observed POST, Maximum possible
0
5
10
15
20
25
30
35
40
Silver
Arsenic
Boron
Barium
CadmiumCobalt
Copper
ManganeseNicke
lLe
ad
Antimony
VanadiumZinc
Any TE
Exclude B,V
NUM
BER
OF S
AMPL
ES E
XCEE
DIN
G BE
NCH
MAR
KS
PRE, Observed POST, Observed
A
0
5
10
15
20
25
30
35
40
Silver
Arsenic
Boron
Barium
CadmiumCobalt
Copper
ManganeseNicke
lLe
ad
Antimony
VanadiumZinc
Any TE
Exclude B,V
NUM
BER
OF S
AMPL
ES E
XCEE
DIN
G BE
NCH
MAR
KS
B
sac12-0452_Figure 07ab
Figure 7. Number of benchmark exceedances for trace elements in water in paired pre-landfall and post-landfall samples (N = 40) from the Deepwater Horizon oil spill, Gulf of Mexico, 2010: (A) observed number of exceedances, which ignores censored data and represents the minimum number of exceedances; (B) maximum number of benchmark exceedances possible, which assumes that all samples with censored reporting levels greater than the applicable benchmark are possible exceedances. B, boron; N, number of sample pairs in the dataset; POST, post-landfall samples; PRE, pre-landfall samples; TE, trace element; V, vanadium.
78 Contaminants in Water and Sediment Sampled in Response to the Deepwater Horizon Oil Spill
Therefore, the number of benchmarks exceeded could be substantially higher than what was observed, so the benchmark exceedances observed in 47 percent of water samples represent the minimum number of exceedances for the samples collected in the present study. Furthermore, there is too much uncertainty to do statistical comparisons between sampling periods of benchmark exceedances for antimony, boron, vanadium, cobalt, copper, lead, nickel, arsenic, cadmium, and silver. For barium, manganese, and zinc, which were the only elements with sufficient data to make statistical comparisons, there were no significant differences in benchmark exceedances between paired pre-landfall and post-landfall samples (sign test, p >0.05).
Two of the elements with benchmark exceedances, boron and copper, were detected in one of four field blanks for the study, so their concentrations were blank-censored prior to comparison to benchmarks. The maximum boron concentration of 10 µg/L detected in blanks was less than 1 percent of the benchmark value of 1,200 µg/L, indicating there is reasonable certainty that measured concentrations above the benchmark were not affected by incidental contamination. For copper, however, the maximum concentration of 2.2 µg/L detected in blanks was close to the chronic and acute aquatic-life benchmarks of 3.1 and 4.8 µg/L, respectively. Therefore, measured copper concentrations were considered to be benchmark exceedances only when they exceeded 11 µg/L, or five times the maximum blank concentration.
A total of seven samples exceeded chronic aquatic-life benchmarks for nickel, vanadium, or both, which were specifically identified by U.S. Environmental Protection Agency (2011a) as relevant to the Deepwater Horizon oil spill in the GOM. Of these seven samples, six were from the pre-landfall period and exceeded the chronic benchmark for nickel, and one sample from the post-landfall period exceeded chronic benchmarks for both nickel and vanadium (appendix table 3-3). Nickel benchmark exceedance could be substantially underestimated during the post-landfall period because the reporting level of 15 to 75 µg/L was too high to ascertain whether the chronic aquatic-life benchmark of 8.2 µg/L was exceeded. Vanadium was analyzed in all post-landfall samples but in only two pre-landfall samples.
The frequency at which aquatic-life benchmarks for one or more trace elements were exceeded—47 percent—in GOM water samples indicates there is potential for toxicity to
aquatic life. Because of high and variable analytical reporting levels for trace elements in water, it was not possible to do a rigorous statistical comparison of benchmark exceedances between the pre-landfall and post-landfall sampling periods.
Trace and Major Elements and Nutrients in Sediment
Trace and major elements and the nutrients phosphorus and total nitrogen were analyzed in both whole sediment and the less than 63-µm sediment fraction, by the USGS SCL for both pre-landfall and post-landfall samples. Concentrations in whole sediment were used to assess contaminant occurrence and for comparison to sediment-quality benchmarks. Concentrations in the less than 63-µm fraction of sediment were compared to national baseline concentrations in bed sediments of rivers and streams from Horowitz and Stephens (2008).
Constituent OccurrenceThe detection frequencies and percentile concentrations
for trace and major elements and nutrients in sediment are shown in table 25 for whole sediment and table 26 for the less than 63-µm sediment fraction. Because sediment samples were subjected to strong-acid digestion, which destroys the sediment matrix, the analyses yielded total trace-element concentrations (Horowitz and Stephens, 2008).
Detection frequencies for these constituents in whole sediment ranged from zero for thallium and uranium to over 90 percent for barium, manganese, phosphorus, sodium, strontium, and sulfur in one or both sampling periods at a common detection threshold of 0.1 mg/kg (table 25). For almost all constituents, detection frequencies in pre-landfall and post-landfall samples were separated by about 10 percent or less at their optimal censoring thresholds (table 25). As examples, the concentration distributions in pre-landfall and post-landfall whole-sediment samples are shown for calcium and lead in figures 4I and 4J. Although calcium detection frequencies above the optimum censoring threshold were similar for pre-landfall and post-landfall samples, at 67 to 68 percent, respectively, calcium concentrations appeared to be higher in post-landfall samples (fig. 4I). The opposite was true for lead, which had similar detection frequencies in
Table 25. Summary statistics for trace and major elements and nutrients in whole sediment from the Deepwater Horizon oil spill, Gulf of Mexico, 2010.
Table 26. Summary statistics for trace and major elements and nutrients in the less than 63-micrometer sediment fraction from the Deepwater Horizon oil spill, Gulf of Mexico, 2010.
These tables are presented as Microsoft© Excel spreadsheets. They can be accessed and downloaded at URL http://pubs.usgs.gov/sir/2012/5228.

Results and Discussion 79
both sampling periods but higher concentrations during the pre-landfall period (fig. 4J). Because whole-sediment samples were collected from the swash zone and analyzed without pre-treatment, dried sea salt could have contributed to the sodium, potassium, calcium, and magnesium concentrations measured in whole-sediment samples.
Of nutrients, phosphorus was detected above 0.1 mg/kg in all pre-landfall and post-landfall whole-sediment samples (table 25), and the highest concentrations were in two pre-landfall samples (fig. 4K). Total nitrogen was detected above its optimum threshold of 0.1 percent in 10 to 11 percent of both pre-landfall and post-landfall whole-sediment samples.
Comparison of Pre-Landfall to Post-Landfall Samples
Statistical comparison of trace- and major-element and nutrient concentrations in whole sediment was performed for 33 constituents, including total carbon and organic carbon. Six constituents showed a significant difference between pre-landfall and post-landfall samples in PPW tests (p <0.05) after censoring each element to its specific optimal censoring threshold (table 27). Concentrations were higher in post-landfall samples for calcium (fig. 4I), total carbon, sodium, and strontium, and in pre-landfall samples for lead (fig. 4J) and mercury. Using lead in whole sediment as an example, figure 6C shows the difference in concentrations when pre-landfall concentrations were subtracted from post-landfall ones (Cpost – Cpre) at each sampling site along the GOM coast from west to east. Statistically higher lead concentrations in pre-landfall whole-sediment samples appeared to be influenced in part by a negative difference value, showing higher pre-landfall concentrations, at three sites in Louisiana, one extreme site in Mississippi, and two sites in Florida (fig. 6C). When pre-landfall concentrations were subtracted from post-landfall ones, 50 percent of sites had difference values that were negative; 23 percent had positive difference values; and 27 percent had difference values that equaled or, if the difference value was a range, included zero, so they could not be classified as definitively positive or negative.
Because trace elements tend to be concentrated in the less than 63-µm fraction of sediment, it is possible that substantially different amounts of fine material in pre-landfall and post-landfall samples could have contributed to the few significant differences in trace- and major-element concentrations that were observed. Therefore, the PPW tests were also performed on trace- and major-element and nutrient concentrations measured in the less than 63-µm fraction of sediment (table 27). Of the six elements that showed significant differences between sampling periods in whole sediment, none were significant in the less than 63-µm sediment fraction. Several factors could contribute to the lack of significant relationships in the less than 63-µm sediment data. First, the sample size was much smaller for this fraction,
which had 15 to 16 sample pairs for nutrients and 21 to 35 for other elements, compared to 35 sample pairs for nutrients and 44 to 48 for other elements in whole sediment; this reduced the power of the test for the less than 63-µm sediment fraction. Also, any dried sea salt present on whole-sediment samples would not remain in the less than 63-µm sediment fraction because the sediment samples were rinsed with deionized water during the sieving process. This would affect salts of major ions, such as calcium, sodium, and strontium. Finally, it is possible that significant differences in the constituent concentrations between post-landfall and pre-landfall samples actually were influenced by differences in the amount of fine material in these samples.
Again, by using lead as an example, the difference in post-landfall and pre-landfall concentrations (Cpost – Cpre) at individual sampling sites for the less than 63-µm sediment fraction (fig. 6D) can be compared to the difference for whole sediment (fig. 6C). First, the most extreme difference value for lead in whole sediment (MS-44; fig. 6C) was no longer extreme in the less than 63-µm sediment fraction (fig. 6D). Both datasets had 50 percent of sites with a negative difference value when pre-landfall concentrations were subtracted from post-landfall ones; however, the less than 63-µm sediment fraction had a positive difference value at 37 percent of sites compared to 23 percent of sites for whole sediment, and difference values were indistinguishable from zero for 13 and 27 percent of sites for the less than 63-µm fraction and whole sediment, respectively. The smaller sample size for the less than 63-µm fraction is illustrated in figures 6C and 6D also. Fine sediment data were missing for several sites, especially in Florida and Alabama (fig. 6D), because the sediment samples collected at these sites had insufficient mass in the less than 63-µm fraction to run the trace-element analysis.
Overall, there was no significant difference in the percent of fine material contained in pre-landfall and post-landfall samples (table 27). To test whether site-specific differences in the percent of fine material contributed to differences in contaminant concentrations, the differences in contaminant concentrations in whole sediment between sampling periods (Cpost – Cpre) were regressed against the differences in the percentage of sediment that was less than 63 µm (LT63) between sampling periods (LT63post – LT63pre), in both cases subtracting pre-landfall values from post-landfall values. For lead and mercury, which had significantly higher concentrations in whole sediment pre-landfall samples than in post-landfall samples, the difference in constituent concentrations was significantly (p <0.05) related to the difference in fine material between the samples. Although not conclusive, this supports the hypothesis that site-specific differences in the amount of fine material in sediment samples could have contributed to the significantly higher concentrations of lead and mercury in pre-landfall compared to post-landfall whole-sediment samples.
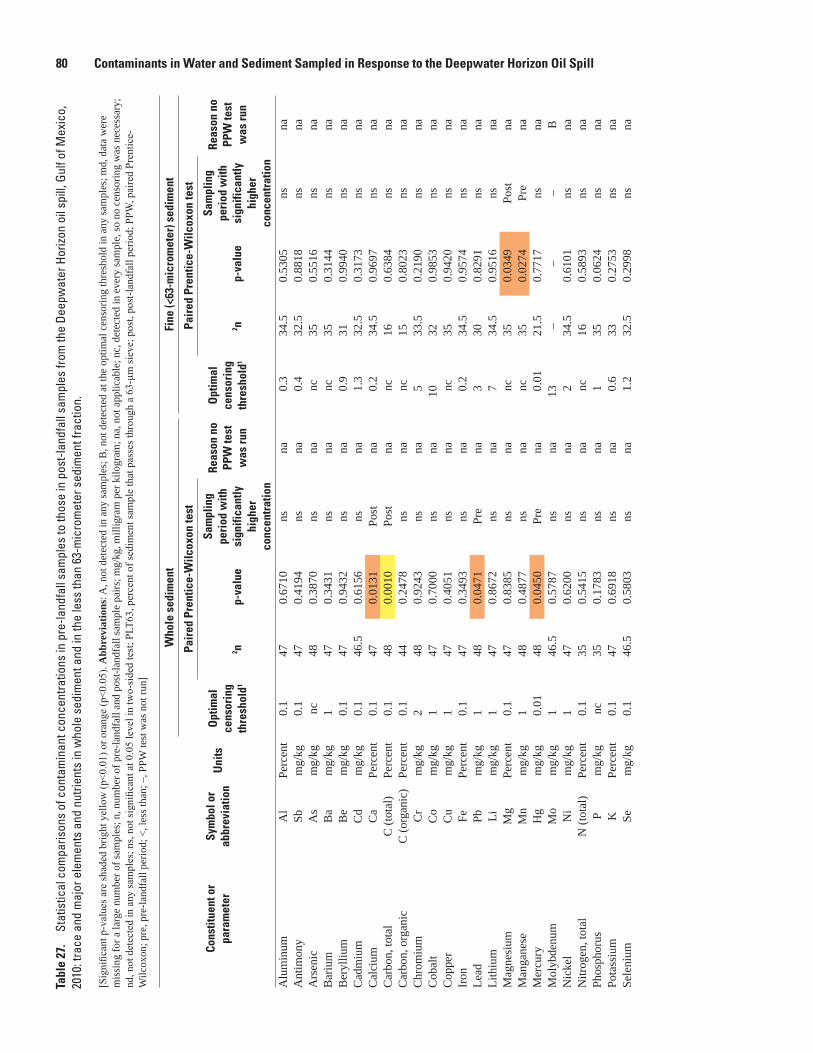
80 Contaminants in Water and Sediment Sampled in Response to the Deepwater Horizon Oil Spill Ta
ble
27.
Stat
istic
al c
ompa
rison
s of
con
tam
inan
t con
cent
ratio
ns in
pre
-land
fall
sam
ples
to th
ose
in p
ost-l
andf
all s
ampl
es fr
om th
e De
epw
ater
Hor
izon
oil s
pill,
Gul
f of M
exic
o,
2010
: tra
ce a
nd m
ajor
ele
men
ts a
nd n
utrie
nts
in w
hole
sed
imen
t and
in th
e le
ss th
an 6
3-m
icro
met
er (µ
m) s
edim
ent f
ract
ion.
—Co
ntin
ued
[Sig
nific
ant p
-val
ues a
re sh
aded
brig
ht y
ello
w (p
<0.0
1) o
r ora
nge
(p<0
.05)
. Abb
revi
atio
ns: A
, not
det
ecte
d in
any
sam
ples
; B, n
ot d
etec
ted
at th
e op
timal
cen
sorin
g th
resh
old
in a
ny sa
mpl
es; m
d, d
ata
wer
e m
issi
ng fo
r a la
rge
num
ber o
f sam
ples
; n, n
umbe
r of p
re-la
ndfa
ll an
d po
st-la
ndfa
ll sa
mpl
e pa
irs; m
g/kg
, mill
igra
m p
er k
ilogr
am; n
a, n
ot a
pplic
able
; nc,
det
ecte
d in
eve
ry sa
mpl
e, so
no
cens
orin
g w
as n
eces
sary
; nd
, not
det
ecte
d in
any
sam
ples
; ns,
not s
igni
fican
t at 0
.05
leve
l in
two-
side
d te
st; P
LT63
, per
cent
of s
edim
ent s
ampl
e th
at p
asse
s thr
ough
a 6
3-μm
siev
e; p
ost,
post
-land
fall
perio
d; P
PW, p
aire
d Pr
entic
e-W
ilcox
on; p
re, p
re-la
ndfa
ll pe
riod;
<, l
ess t
han;
–, P
PW te
st w
as n
ot ru
n]
Cons
titue
nt o
r pa
ram
eter
Sym
bol o
r ab
brev
iatio
nU
nits
Who
le s
edim
ent
Fine
(<63
-mic
rom
eter
) sed
imen
t
Opt
imal
ce
nsor
ing
thre
shol
d1
Pair
ed P
rent
ice-
Wilc
oxon
test
Reas
on n
o PP
W te
st
was
run
Opt
imal
ce
nsor
ing
thre
shol
d1
Pair
ed P
rent
ice-
Wilc
oxon
test
Reas
on n
o PP
W te
st
was
run
2 np-
valu
e
Sam
plin
g pe
riod
with
si
gnifi
cant
ly
high
er
conc
entr
atio
n
2 np-
valu
e
Sam
plin
g pe
riod
with
si
gnifi
cant
ly
high
er
conc
entr
atio
nA
lum
inum
Al
Perc
ent
0.1
470.
6710
nsna
0.3
34.5
0.53
05ns
naA
ntim
ony
Sbm
g/kg
0.1
470.
4194
nsna
0.4
32.5
0.88
18ns
naA
rsen
icA
sm
g/kg
nc48
0.38
70ns
nanc
350.
5516
nsna
Bar
ium
Ba
mg/
kg1
470.
3431
nsna
nc35
0.31
44ns
naB
eryl
lium
Be
mg/
kg0.
147
0.94
32ns
na0.
931
0.99
40ns
naC
adm
ium
Cd
mg/
kg0.
146
.50.
6156
nsna
1.3
32.5
0.31
73ns
naC
alci
umC
aPe
rcen
t0.
147
0.01
31Po
stna
0.2
34.5
0.96
97ns
naC
arbo
n, to
tal
C (t
otal
)Pe
rcen
t0.
148
0.00
10Po
stna
nc16
0.63
84ns
naC
arbo
n, o
rgan
icC
(org
anic
)Pe
rcen
t0.
144
0.24
78ns
nanc
150.
8023
nsna
Chr
omiu
mC
rm
g/kg
248
0.92
43ns
na5
33.5
0.21
90ns
naC
obal
tC
om
g/kg
147
0.70
00ns
na10
320.
9853
nsna
Cop
per
Cu
mg/
kg1
470.
4051
nsna
nc35
0.94
20ns
naIr
onFe
Perc
ent
0.1
470.
3493
nsna
0.2
34.5
0.95
74ns
naLe
adPb
mg/
kg1
480.
0471
Pre
na3
300.
8291
nsna
Lith
ium
Lim
g/kg
147
0.86
72ns
na7
34.5
0.95
16ns
naM
agne
sium
Mg
Perc
ent
0.1
470.
8385
nsna
nc35
0.03
49Po
stna
Man
gane
seM
nm
g/kg
148
0.48
77ns
nanc
350.
0274
Pre
naM
ercu
ryH
gm
g/kg
0.01
480.
0450
Pre
na0.
0121
.50.
7717
nsna
Mol
ybde
num
Mo
mg/
kg1
46.5
0.57
87ns
na13
––
–B
Nic
kel
Ni
mg/
kg1
470.
6200
nsna
234
.50.
6101
nsna
Nitr
ogen
, tot
alN
(tot
al)
Perc
ent
0.1
350.
5415
nsna
nc16
0.58
93ns
naPh
osph
orus
Pm
g/kg
nc35
0.17
83ns
na1
350.
0624
nsna
Pota
ssiu
mK
Perc
ent
0.1
470.
6918
nsna
0.6
330.
2753
nsna
Sele
nium
Sem
g/kg
0.1
46.5
0.58
03ns
na1.
232
.50.
2998
nsna
Tabl
e 27
. St
atis
tical
com
paris
ons
of c
onta
min
ant c
once
ntra
tions
in p
re-la
ndfa
ll sa
mpl
es to
thos
e in
pos
t-lan
dfal
l sam
ples
from
the
Deep
wat
er H
orizo
n oi
l spi
ll, G
ulf o
f Mex
ico,
20
10: t
race
and
maj
or e
lem
ents
and
nut
rient
s in
who
le s
edim
ent a
nd in
the
less
than
63-
mic
rom
eter
sed
imen
t fra
ctio
n.
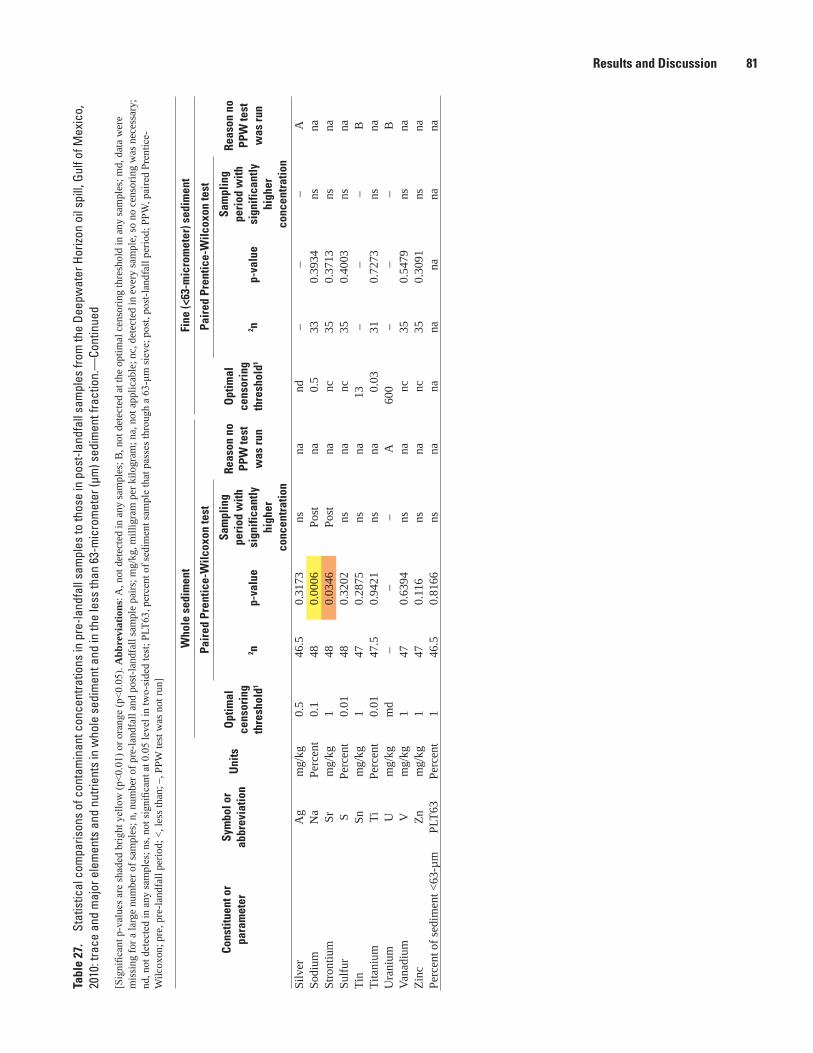
Results and Discussion 81Ta
ble
27.
Stat
istic
al c
ompa
rison
s of
con
tam
inan
t con
cent
ratio
ns in
pre
-land
fall
sam
ples
to th
ose
in p
ost-l
andf
all s
ampl
es fr
om th
e De
epw
ater
Hor
izon
oil s
pill,
Gul
f of M
exic
o,
2010
: tra
ce a
nd m
ajor
ele
men
ts a
nd n
utrie
nts
in w
hole
sed
imen
t and
in th
e le
ss th
an 6
3-m
icro
met
er (µ
m) s
edim
ent f
ract
ion.
—Co
ntin
ued
[Sig
nific
ant p
-val
ues a
re sh
aded
brig
ht y
ello
w (p
<0.0
1) o
r ora
nge
(p<0
.05)
. Abb
revi
atio
ns: A
, not
det
ecte
d in
any
sam
ples
; B, n
ot d
etec
ted
at th
e op
timal
cen
sorin
g th
resh
old
in a
ny sa
mpl
es; m
d, d
ata
wer
e m
issi
ng fo
r a la
rge
num
ber o
f sam
ples
; n, n
umbe
r of p
re-la
ndfa
ll an
d po
st-la
ndfa
ll sa
mpl
e pa
irs; m
g/kg
, mill
igra
m p
er k
ilogr
am; n
a, n
ot a
pplic
able
; nc,
det
ecte
d in
eve
ry sa
mpl
e, so
no
cens
orin
g w
as n
eces
sary
; nd
, not
det
ecte
d in
any
sam
ples
; ns,
not s
igni
fican
t at 0
.05
leve
l in
two-
side
d te
st; P
LT63
, per
cent
of s
edim
ent s
ampl
e th
at p
asse
s thr
ough
a 6
3-μm
siev
e; p
ost,
post
-land
fall
perio
d; P
PW, p
aire
d Pr
entic
e-W
ilcox
on; p
re, p
re-la
ndfa
ll pe
riod;
<, l
ess t
han;
–, P
PW te
st w
as n
ot ru
n]
Cons
titue
nt o
r pa
ram
eter
Sym
bol o
r ab
brev
iatio
nU
nits
Who
le s
edim
ent
Fine
(<63
-mic
rom
eter
) sed
imen
t
Opt
imal
ce
nsor
ing
thre
shol
d1
Pair
ed P
rent
ice-
Wilc
oxon
test
Reas
on n
o PP
W te
st
was
run
Opt
imal
ce
nsor
ing
thre
shol
d1
Pair
ed P
rent
ice-
Wilc
oxon
test
Reas
on n
o PP
W te
st
was
run
2 np-
valu
e
Sam
plin
g pe
riod
with
si
gnifi
cant
ly
high
er
conc
entr
atio
n
2 np-
valu
e
Sam
plin
g pe
riod
with
si
gnifi
cant
ly
high
er
conc
entr
atio
nSi
lver
Ag
mg/
kg0.
546
.50.
3173
nsna
nd–
––
ASo
dium
Na
Per
cent
0.1
480.
0006
Post
na0.
533
0.39
34ns
naSt
ront
ium
Srm
g/kg
148
0.03
46Po
stna
nc35
0.37
13ns
naSu
lfur
SPe
rcen
t0.
0148
0.32
02ns
nanc
350.
4003
nsna
Tin
Snm
g/kg
147
0.28
75ns
na13
––
–B
Tita
nium
TiPe
rcen
t0.
0147
.50.
9421
nsna
0.03
310.
7273
nsna
Ura
nium
Um
g/kg
md
––
–A
600
––
–B
Vana
dium
Vm
g/kg
147
0.63
94ns
nanc
350.
5479
nsna
Zinc
Znm
g/kg
147
0.11
6ns
nanc
350.
3091
nsna
Perc
ent o
f sed
imen
t <63
-µm
PLT6
3Pe
rcen
t1
46.5
0.81
66ns
nana
nana
nana

82 Contaminants in Water and Sediment Sampled in Response to the Deepwater Horizon Oil Spill
Comparison with Sediment-Quality Benchmarks and National Baseline Concentrations
About 18 trace elements have one or more empirical sediment-quality benchmarks for protection of benthic organisms in whole sediment. Of 143 whole sediment samples, 67 samples (table 24B) from 28 sites exceeded one or more upper screening values for trace elements, placing these samples in the probable effect range; therefore, these samples have a high probability of adverse effects on benthic organisms. These samples included 33 of 83 pre-landfall samples and 34 of 60 post-landfall samples. Eight pre-landfall samples exceeded one or more lower screening values for trace elements, but no upper screening values, so were in the possible-effect range. The remaining 68 samples were in the minimal-effect range, indicating no adverse effects on benthic organisms would be expected. These results could be conservatively high estimates of potential toxicity because the present study measured total trace-element concentrations in sediment, rather than the bioavailable concentrations.
The trace elements with one or more upper screening-level benchmark exceedances in whole-sediment samples were barium in 66 samples, aluminum in 34, manganese in 24, vanadium in 17, cobalt in 7, arsenic in 2, and chromium in 2 samples. Trace-element concentrations exceeded one or more upper screening values in 40 percent of pre-landfall samples and 57 percent of post-landfall samples. Fisher’s exact test indicated no significant difference in benchmark-exceedance frequencies between pre-landfall and post-landfall sampling periods for whole-sediment samples in the paired dataset. This was true for both upper and lower screening-value benchmarks.
There were no blank or matrix spike QC data available for trace elements in sediment. However, the QC replicate data indicate high variability in the concentrations of four elements: magnesium, mercury, sodium, and tin. Summary statistics in table 25 and benchmark comparisons in table 23 are footnoted accordingly.
Appendix table 3-4 also lists trace and major elements for which enrichment was found in the less than 63-µm sediment fraction, relative to national maximum baseline conditions. As noted previously, elements were considered to be enriched if their maximum baseline quotients exceeded 2 for samples with less than 1 percent material in the less than 63-µm sediment fraction, or 1 for all other samples. About 20 samples with less than 1 percent material in the less than 63-µm sediment fraction had insufficient material to do trace-element determinations. Of 124 samples analyzed for trace elements in the less than 63-µm sediment fraction, 81 had less than 1 percent material in the less than 63-µm fraction and were compared to the quotient threshold of 2. All but one of these samples were enriched in at least one element.
The use of national baselines to assess anthropogenic enrichment is based on the observation by Horowitz and Stephens (2008) that the upstream or underlying rock type had a minimal effect on trace- and major-element concentrations in streambed sediment nationally compared to the effects of land use or population density. There are regional differences in soil composition, however, that likely affect trace- and major-element concentrations in the less than 63-µm sediment fraction in the present study. Gustavsson and others (2001) reported total concentrations of trace and major elements in fine soil, defined as the less than 75-µm fraction of soil, across the U.S. These authors observed much lower concentrations in the less than 75-µm soil fraction for many elements in the Gulf Atlantic–Coastal Flats, which includes the Florida sites from the present study, than in many other parts of the country; this was attributed to an abundance of quartz sand in surficial soil, combined with the wet climate, which causes leaching of many elements from the upper soil horizons. These elements include arsenic, chromium, copper, lead, manganese, nickel, vanadium, and zinc. On the basis of the soil distributions observed by Gustavsson and others (2001), we would expect concentrations of these elements to be lower at Florida sites and some Alabama and Mississippi sites in the present study compared to sites in Texas and Louisiana. In fact, the concentrations of these elements reported by Gustavsson and others (2001) for most coastal soils in Florida, Alabama, and Mississippi were below the minimum baseline concentrations (that is, below the range of natural geochemical variation) in U.S. river sediment from Horowitz and Stephens (2008). In contrast, Gustavsson and others (2001) reported that soils in the Mississippi River Alluvial Plain contained the same elements at concentrations within their national baseline ranges from Horowitz and Stephens (2008); this area corresponds to the Louisiana and Texas sites in the present study. This indicates that comparison with maximum baseline concentrations will underestimate the degree of enrichment for our study sites in Florida and parts of Alabama and Mississippi, but is generally appropriate for sites in Louisiana and Texas.
The baseline exceedance results can be considered, together with upper screening-value benchmark exceedances, to identify samples that combine enrichment above baseline with potential for toxicity (table 24B and appendix table 3-4). There were 122 sediment samples with trace-element data for both whole sediment and the less than 63-µm sediment fraction. Of these, 19 samples (16 percent) exceeded upper screening-value benchmarks for, and were enriched in, one or more of these elements: barium in 14 samples, vanadium in 5, aluminum in 3, manganese in 3, arsenic in 2, chromium in 2, and cobalt in 1 sample. These samples were evenly divided between sampling periods, with 9 pre-landfall samples and 10 post-landfall samples, and were collected from 8 sites in Louisiana and 3 sites in Texas.
Results and Discussion 83
Contaminant Concentrations at Sites with Macondo-1 Well Oil Fingerprint Evidence
As noted previously, sediment and tarballs sampled by the USGS at 49 post-landfall sites and 69 pre-landfall sites were analyzed for diagnostic geochemical biomarkers by Rosenbauer and others (2010, 2011). In the Rosenbauer study, extracts from tarballs and from subsamples of the same composite sediment samples analyzed in the present study were compared to the chemical “fingerprint” of BP M-1 oil. The identification of M-1 well oil in the extracts was based on a combination of the interpretation of compounds identified in the mass spectra of sample extracts and a multivariate statistical analysis of the biomarker ratios by using hierarchal cluster analyses and principal component analyses.
At pre-landfall sites, residues of oil—any oil—were found in sediment from 45 of 69 sites (65 percent of sites). None of these sediment samples correlated with the M-1 oil, although a tarball collected from site FL-18 at Coco Plum Beach near Marathon, Florida, was similar to M-1 oil (Rosenbauer and others, 2011). This pre-landfall tarball sample from site FL-18 was collected on May 24, which was 6 days after NOAA reported on May 18 that a small tendril of M-1 well oil was in close proximity to the loop current (Lubchenco, 2010).
In post-landfall samples, Rosenbauer and others (2010) found at least a trace amount of oil at 44 of 49 sites (90 percent), with evidence of M-1 oil in sediment, tarballs, or both, from 19 of the 49 sampled sites (39 percent). Of 20 tarballs collected from 19 sites, all but 2 contained M-1 oil. Five of the post-landfall sites likely contained a mixture of M-1 oil plus one or more other oils. These results indicate a high incidence of oil contamination at the post-landfall sites, with direct evidence of M-1 oil in sediment, tarballs, or both, at 19 sites. These 19 sites are identified in table 1 and figure 1.
When PPW tests were run for all contaminants on the “fingerprint-sample” dataset, which was composed of pre-landfall and post-landfall samples from only those 19 sites that had M-1 oil fingerprint evidence during the post-landfall period, the results were very similar to results for the paired-sample dataset. A few analytes with significant differences when using the paired-sample dataset were no longer significant when the fingerprint-sample data subset was used. Specifically, toluene, calcium, and molybdenum in water, and calcium in sediment, were no longer significantly higher in post-landfall samples when the smaller fingerprint-sample dataset was used. Similarly, lead had significantly higher concentrations in sediment during the pre-landfall period when using the paired-sample dataset, but not when using the fingerprint-sample dataset. The loss of significance for some analytes could be a result of the much smaller sample size in the fingerprint-sample dataset, which typically had 14 to 18 sample pairs, compared to the entire dataset, which typically had 40 to 48 sample pairs. Although the 19 sites with direct evidence of M-1 oil landfall could be expected to show significantly higher contaminant concentrations
in post-landfall samples for more analytes than in the full paired-sample dataset, this was not the case; again, the small sample size of the fingerprint-sample dataset limits the power of the test. There were three analytes for which the post-landfall concentrations were significantly higher than pre-landfall concentrations in the fingerprint-sample dataset but not in the full paired-sample dataset: two alkylated PAHs (1-methylphenanthrene and C1-alkylated dibenzothiophenes) and sulfur in sediment. In terms of potential toxicity, the most important difference between the two datasets is that toluene was no longer significant in the subset of 19 sites in the fingerprint-sample dataset. The principal conclusion from the PPW analysis, however, remains unchanged—concentrations of 20 PAHs, especially alkylated PAHs, were higher overall in post-landfall samples than pre-landfall sediment samples. Of the 19 post-landfall sites with M-1 oil, 5 sites had the largest difference in post-landfall minus pre-landfall concentrations for several PAHs. These sites are Grand Isle Beach at State Park, Louisiana (LA-31); Petit Bois Island Beach, Mississippi (MS-42); and BLM-1 (AL-8), BLM-2 (AL-9), and Fort Morgan BLM-3 (AL-10) in Alabama.
Data Issues, Data Censoring, and Quality Control
Because of the nature of this project—especially the emergency timing and the involvement of multiple agencies and organizations—there were a number of data issues that had to be resolved in order to do a technically sound analysis of the resulting data. This occurred because the pre-landfall sampling had to be done soon after the oil spill, before oil made landfall, and there were not yet recommendations in place concerning what analytes should be targeted and what methods should be used. Later, between the pre-landfall and post-landfall sampling periods, changes were made to the target analyte list and the chemical analysis methods used (Operational Science Advisory Team, 2010, appendix F), and these changes improved the number of oil-related contaminants with data for the post-landfall period. Data issues faced during the data analysis required for this report included large amounts of censored data, highly variable reporting levels for a given contaminant and sampling medium, duplicate analyses of the same sample that were either verifications by the same laboratory or re-analysis by a different laboratory, systematic differences in reporting levels between pre-landfall and post-landfall sampling periods, and differences between the two sampling periods in the contaminants that were analyzed. The complexity of data types and sources also created difficulties for database management that had to be resolved before data analysis could proceed; for example, there was incomplete information on parameters, methods, and data precision from contract laboratories. The importance of database management cannot be overemphasized, and the expertise and efforts of the USGS database managers were essential to compiling a dataset of optimized and documented data quality. All of the data issues
84 Contaminants in Water and Sediment Sampled in Response to the Deepwater Horizon Oil Spill
affecting this report were resolved, and are detailed in the sections on data analysis and data censoring.
One primary tool for dealing with many of these issues was strategic data censoring, which was necessary so that the data coming from different sources and representing different sampling periods, sites, or laboratories were comparable and could be evaluated on equal grounds. Unfortunately, post-laboratory data censoring resulted in loss of information for some samples.
Consistency of methods. The fact that, for some contaminants, different laboratories were used to analyze different samples contributed to a number of data issues. Different laboratories can use different methods and often have different reporting levels for the same analyte. The latter was especially problematic when there were systematic differences in reporting levels between the two sampling periods, as occurred in this study for both organic contaminants and trace elements in water. To compare results from pre-landfall and post-landfall sampling periods, data had to be censored at a common threshold, which resulted in loss of information from the sampling period with the more sensitive method. Different laboratories also had different analyte lists, and all contaminants that were determined in only one of the sampling periods had to be dropped from the comparison between sampling periods.
Sample dilution. For trace elements in water, 77 percent of samples were diluted prior to analysis because the water samples exceeded the specific conductance or total dissolved solids thresholds for analysis by ICP-OES or ICP-MS. The dilution factor used for each sample depended on the degree to which the specific conductance or total dissolved solids threshold was exceeded. Because the reporting level increased proportionally with the sample-specific dilution factor, the sample dilution process resulted in high and variable reporting levels for trace elements in water in this study. This precluded statistical comparison between pre-landfall and post-landfall samples, and in many cases censored values were higher than the applicable aquatic-life benchmarks, which made it impossible to ascertain whether benchmarks were exceeded. The use of sample dilution could have been minimized, although not eliminated altogether, by better communication with the analyzing laboratories so that operating protocols were optimized for analysis of seawater.
Quality control. Blank censoring was used to ensure that reported contaminant concentrations in environmental water samples were not affected by incidental contamination during sample collection, processing, or analysis. Because a limited number of blanks were collected during this study, a conservative approach had to be taken when censoring environmental-sample results on the basis of contamination in blanks. Detection of an analyte in any field or trip blank resulted in censoring of concentrations of that analyte in all environmental samples collected during the same sampling period. For some analytes, such as ammonia plus organic
nitrogen and benzene in water, this resulted in the censoring of all quantified detections from the post-landfall sampling period. If more blank samples had been collected, perhaps the potential for incidental contamination in an individual environmental sample could have been represented by the concentration in a single corresponding blank, and fewer samples would have been subject to blank censoring.
Target analytes. To obtain the most complete information on contaminant benchmark exceedances, water and sediment samples should be analyzed for trace elements and organic compounds, including PAHs, alkylated PAHs, and BTEX compounds. USEPA benchmarks for total PAH mixtures in water and sediment were designed to assess cumulative potential toxicity of 41 oil-related contaminants: 18 parent PAHs, 16 alkylated PAH groups, and 7 BTEX compounds (U.S. Environmental Protection Agency, 2011a and 2011b). To obtain the most complete estimate of potential PAH toxicity, all 41 target analytes that go into this benchmark should be determined. In the present study, alkylated PAHs were not analyzed in water samples or, initially, in pre-landfall sediment samples. Although alkylated PAHs can be estimated from parent PAH concentrations by using multipliers (Mount, 2010), this method can underestimate the total PAH benchmark toxic-unit value (∑ESBTU or ∑TU) when parent PAHs are not detected. The Operational Science Advisory Team (2010; appendix table C-3) tested the efficacy of the multiplier-based estimation method by calculating toxic-unit benchmarks in two different ways for samples with a full suite of analytes measured: they compared the results obtained by using data for 16 parent PAHs plus multipliers to the results obtained by using data for all 41 analytes. Although the toxic-unit benchmarks obtained these two ways were correlated positively to each other, the relationship was not statistically significant (p >0.05). In the present study, this means that ∑TU benchmarks for total PAH mixtures in water could be underestimated. For organic compounds in sediment, this omission was corrected by reanalyzing pre-landfall sediment samples for all 34 parent and alkylated PAHs. A second target analyte omission in the present study is that BTEX compounds included in the ∑ESBTU benchmark were not analyzed in sediment; therefore, ∑ESBTU values for sediment could be underestimated to some extent. At least for weathered oil, this low bias is likely to be minimal because the BTEX compounds are volatile and were not detected in a sample of weathered M-1 crude oil (State of Florida Oil Spill Academic Task Force, 2010) or in surface oil samples approaching the near shore environment after the spill (Atlas and Haven 2011).
These factors—use of different laboratories for pre-landfall and post-landfall sampling periods, high and variable reporting levels, missing data for analytes that should be included in benchmark calculations, and collection of only a limited number of blanks—led to difficulties in data analysis and interpretation. These are lessons learned that can be the basis for improvements in the agency response to future oil spills or similar environmental emergencies.
Summary and Conclusions 85
Summary and ConclusionsIn response to the British Petroleum (BP) Deepwater
Horizon Macondo-1 (M-1) oil spill on April 20, 2010, the U.S. Geological Survey (USGS) sampled beach water and sediment at 70 sites along the Gulf of Mexico (GOM) coast from May 7 to July 7, 2010, in order to establish baseline contaminant levels in potentially vulnerable locations before the oil made landfall. After the oil made landfall, a subset of 48 sites was resampled from October 4 to 14, 2010, and one new site was sampled on August 23, 2010, to assess the existence of actionable levels of M-1 oil contamination after the extensive clean-up efforts of coastal areas by BP (Wilde and Skrobialowski, 2011). This report characterizes the water and sediment chemistry in pre-landfall and post-landfall samples, evaluates whether there were significant differences between the two sampling periods, and compares measured concentrations to applicable benchmarks for human health and aquatic life.
Organics in Water
For organic contaminants in water, detection frequencies and concentrations were generally low and were similar in pre-landfall and post-landfall samples. Of the 11 compounds with enough quantified detections to statistically compare pre-landfall and post-landfall samples, concentrations were significantly higher for only one organic contaminant—toluene—primarily as a result of detections in four post-landfall samples from Florida and one from Mississippi. No samples exceeded any human-health benchmarks for organic contaminants in water, which were available for 11 compounds. Aquatic-life benchmarks, which were available for 73 compounds or mixtures of related compounds, were exceeded in only one water sample. The aquatic-life benchmarks for polycyclic aromatic hydrocarbons (PAHs) and benzene, toluene, ethylbenzene, xylene and related volatile (BTEX) compounds were exceeded in the post-landfall sample from the Mississippi River at South Pass, Louisiana (site LA-35); no exceedance was observed in the corresponding pre-landfall sample for this site.
Organics in Sediment
Most PAHs and alkylated PAHs, and a few additional semivolatile organic compounds (SVOCs), were detected in one or more samples during both pre-landfall and post-landfall periods. Nine alkylated PAHs and five parent PAHs were detected at concentrations greater than or equal to 1.5 microgram per kilogram (µg/kg) in sediment at over 20 percent of sites during one or both sampling periods, despite very low organic carbon content (for example, a median of 0.1 percent) in the sampled sediments.
Concentrations were significantly higher (p<0.05) in post-landfall sediment samples than pre-landfall samples for 20 of the 49 organic contaminants with enough quantified detections to make statistical comparisons, consisting of 3 PAHs and 17 alkylated PAH groups. Two analytes, naphthalene and oil and grease, had higher concentrations in pre-landfall than post-landfall samples. The same results were obtained when PAH concentrations were normalized by sediment total organic carbon (TOC), indicating that the significant differences observed were not caused simply by differences in the sediment-TOC content between the two sampling periods.
Only one sediment sample exceeded the chronic equilibrium-partitioning sediment benchmark toxic-unit concentration (ESBTU) for PAH mixtures—a pre-landfall sample from Trinity Bay near Beach City, Texas (site TX-52). This indicates that aggregate PAH concentrations were potentially toxic to benthic organisms at this site at the time of sampling. Because no post-landfall sample was collected at this site, no comparison can be made between sampling periods. Empirical benchmarks—upper screening values—for PAHs were exceeded in 27 percent of sediment samples overall, indicating a high probability of toxicity to benthic organisms at the time of sampling, although not necessarily due to PAHs. These empirical benchmarks are based on past field studies in which similar PAH concentrations in sediments were associated with toxicity (MacDonald and others, 2000); because field sediments typically contain mixtures of contaminants, however, toxicity in these studies was not necessarily due to PAHs. The percentage of sediment samples that exceeded upper screening-value benchmarks was 37 percent for post-landfall samples and 22 percent for pre-landfall samples; there was no significant difference, however, in the proportion of sediment samples that exceeded one or more benchmarks for organic contaminants in sediment between paired pre-landfall and post-landfall samples. About 70 percent of all sediment samples were below all empirical sediment-quality benchmarks for organic contaminants, indicating that no adverse effects on benthic organisms would be expected. Sediment sampled in this study typically had low organic carbon content, which could affect bioavailability and potential toxicity.
For 15 of the 17 alkylated PAHs with statistically higher concentrations in post-landfall samples, 7 sites stood out as having the largest concentration differences. For five of these seven sites, M-1 oil was identified in post-landfall sediments, tarballs, or both, on the basis of diagnostic geochemical biomarkers (Rosenbauer and others, 2010): Grand Isle Beach at State Park, Louisiana (LA-31); Petit Bois Island Beach, Mississippi (MS-42); and BLM-1, BLM-2, and Fort Morgan BLM-3 in Alabama (AL-8, AL-9, and AL-10). These results indicate that M-1 oil could have contributed to the higher PAH concentrations measured in post-landfall samples at these five sites. For the seven post-landfall sediment samples
86 Contaminants in Water and Sediment Sampled in Response to the Deepwater Horizon Oil Spill
collected at these five sites, the chronic ∑ESBTU values calculated for PAH mixtures ranged from 0.2 to 0.3, and six samples, including at least one from each site, exceeded multiple upper screening-level benchmarks for total PAHs. In contrast, the nine pre-landfall sediment samples that were collected from these five sites had chronic ∑ESBTU values of less than 0.005, and no empirical screening-value benchmarks were exceeded.
Trace and Major Elements and Nutrients in Water
Detection frequencies ranged from 0 to 100 percent, depending on the element or nutrient. It was essential to censor data to a common detection threshold prior to comparing concentrations and detection frequencies for different constituents or sampling periods because reporting levels varied by constituent and by laboratory. Of the 17 trace and major elements with enough quantified values to make statistical comparisons, concentrations in water were significantly higher (p <0.05) in post-landfall samples for barium, calcium, magnesium, molybdenum, potassium, and sodium. These are all elements in seawater, and barium sulfate is a standard additive in drilling mud. Ammonia and phosphorus concentrations were significantly higher (p <0.05) in pre-landfall samples.
Aquatic-life benchmarks were available for 18 trace elements in water. Acute and chronic benchmarks were exceeded in 1 percent and 29 percent, respectively, of pre-landfall water samples. Post-landfall water samples exceeded acute and chronic benchmarks in 21 percent and 93 percent of samples, respectively. The elements that exceeded acute benchmarks in one or more water samples from either sampling period were copper in 23 samples and zinc in 2 samples. The elements that exceeded chronic benchmarks were boron in 50 water samples, manganese in 30, copper in 24, cobalt in 19, nickel in 7, lead in 6, barium in 3, zinc in 2, and vanadium in 1 water sample. One or more exceedances occurred in every state except Florida during the pre-landfall period, and in all five states during the post-landfall period. Of the 56 post-landfall samples, 52 exceeded one or more chronic aquatic-life benchmarks for trace elements in water, with exceedances for boron in 48 post-landfall samples, copper in 22, manganese in 12, barium in 2, and lead, nickel, vanadium, and zinc in 1 post-landfall water sample each. Because of high and variable analytical reporting levels for several trace elements in water, it was not possible to rigorously compare benchmark exceedances between the pre-landfall and post-landfall sampling periods. Overall, the frequency at which aquatic-life benchmarks for
trace elements were exceeded in GOM water samples was 47 percent, which indicates there is potential for toxicity to aquatic life. Moreover, exceedance frequencies for several trace elements could be substantially underestimated because either the element was analyzed during only one sampling period or exceedance could not be ascertained for samples that were censored at reporting levels higher than the applicable benchmark. Aquatic-life benchmark exceedance could not be ascertained for at least 35 percent of samples within a sampling period for boron and vanadium in the pre-landfall period; for arsenic, cadmium, cobalt, lead, nickel, and silver in the post-landfall period; and for copper in both sampling periods. Nickel and vanadium, which were specifically identified by U.S. Environmental Protection Agency (2011a) as relevant to the oil spill, were responsible for exceedances in only 1 of the 52 post-landfall samples with exceedances, although the results for nickel could be underestimated because of high reporting levels during the post-landfall period.
Trace and Major Elements and Nutrients in Sediment
Detection frequencies for trace and major elements and nutrients in whole sediment ranged from 0 to 100 percent, depending on the constituent, and they were similar for pre-landfall and post-landfall samples. Because sediment samples were subjected to strong acid digestion, concentrations represent total concentrations in sediment, which are defined as greater than or equal to 95 percent of the amount present.
A few trace and major elements had significant differences in concentration in whole sediment between post-landfall and pre-landfall samples; however, these differences were not significant when tests were run on the less than 63-micrometer (µm) sediment fraction. This is likely due, at least in part, to the smaller sample size of the less than 63-µm sediment-sample dataset, although other factors also could have contributed to the lack of significance in tests on the less than 63-µm fraction. Sediment samples were rinsed with water during the 63-µm sieving process, which could have removed dried sea salt present in the whole-sediment samples; if so, this would decrease concentrations of calcium, sodium, and strontium. For lead and mercury, which were significantly higher in pre-landfall than post-landfall samples for whole sediment, but not for the 63-µm sediment fraction, a larger proportion of fine material (that is, less than 63 µm) in pre-landfall sediment samples compared to post-landfall samples at some sites could have contributed to the significant difference observed for whole-sediment samples.
Acknowledgements 87
Empirical sediment-quality benchmarks were available for 18 trace elements in sediment. Overall, 47 percent of whole, unsieved sediment samples exceeded one or more upper screening values for trace elements (table 24B), putting these samples in the probable effect range. These samples included 33 of 83 pre-landfall samples and 34 of 60 post-landfall samples . These results could be conservatively high estimates of benchmark exceedance because they are based on measurements of total trace-element concentrations in sediment. For trace elements in whole sediment, there was no significant difference in the proportion of samples exceeding one or more aquatic-life benchmarks between the pre-landfall and post-landfall sampling periods. For the less than 63-µm sediment fraction, all but 1 of 124 samples were anthropogenically enriched in one or more trace or major elements, relative to national baseline values for U.S. streams (Horowitz and Stephens, 2008). Sixteen percent of sediment samples exceeded upper screening-value benchmarks for, and were enriched in, one or more of these elements: barium in 14 samples, vanadium in 5, aluminum in 3, manganese in 3, arsenic in 2, chromium in 2, and cobalt in 1 sample. These samples were divided evenly between the pre-landfall and post-landfall periods, and they were collected from 8 sites in Louisiana and 3 sites in Texas. However, because many trace elements have lower concentrations in soils from Florida, Alabama, and Mississippi than in soils from Louisiana and Texas (Gustavsson and others, 2001), the baseline comparison analysis probably underestimates the degree of enrichment at Florida, Alabama, and Mississippi sites.
Comparison of Pre-Landfall to Post-Landfall Samples
Considering all the information evaluated in this report, there were significant differences between post-landfall and pre-landfall samples for PAH concentrations in sediment. With a few exceptions, pre-landfall and post-landfall samples did not differ significantly in concentrations or benchmark exceedances for most organics in water or trace elements in sediment. The one exception is toluene, which had significantly higher concentrations in post-landfall than pre-landfall water samples, although this difference was not necessarily related to landfall M-1 oil. Toluene is volatile and was not detected in weathered M-1 crude oil (State of Florida Oil Spill Academic Task Force, 2010) or in surface-oil samples approaching the near shore environment after the spill (Atlas and Haven, 2011). For trace elements in water, aquatic-life benchmarks were exceeded in 47 percent of samples overall, but the high and variable analytical reporting levels
precluded statistical comparison of benchmark exceedances between sampling periods. Of the organic contaminants in sediment, 3 parent PAHs and 17 alkylated PAH groups had significantly higher concentrations in post-landfall samples than in pre-landfall samples. Concentrations above the upper screening-value benchmarks put 37 percent of post-landfall samples and 22 percent of pre-landfall samples in the probable-effect range. However, the proportion of samples exceeding empirical upper screening-value benchmarks for PAHs in sediment were not significantly different in paired post-landfall and pre-landfall samples.
For 15 of the 17 alkylated PAHs with statistically higher concentrations in post-landfall samples, the greatest concentration differences were observed at seven sites. These results corroborate the results of Rosenbauer and others (2010), who found diagnostic geochemical evidence of Deepwater Horizon M-1 oil in post-landfall sediment and tarballs from five of these seven sites. The five sites are Grand Isle Beach at State Park, Louisiana (LA-31); Petit Bois Island Beach, Mississippi (MS-42); and BLM-1, BLM-2, and Fort Morgan BLM-3 in Alabama (AL-8, AL-9, and AL-10).
AcknowledgementsThe USGS initiated the pre-landfall sampling and
analytical study, and additional funding was later provided by the U.S. Coast Guard for both the pre-landfall and post-landfall work. We gratefully acknowledge the efforts of the staffs of the USGS Water Science Centers in Alabama, Florida, Georgia, Louisiana, Mississippi, and Texas in sample collection and processing. We thank Marge Davenport, Charles Demas, Yvonne Stoker, Donna Myers, and Terry Schertz for their coordination efforts; Franceska Wilde and Stan Skrobialowski for development of the sampling protocol and other assistance; and Gary Cottrell for his efforts in coordinating the laboratory contracts. We thank Arthur Horowitz, Geoffrey Plumlee, and Ruth Wolf for data and technical assistance. We also thank Robert Burgess, Christopher Ingersoll, Donald MacDonald, and David Mount for technical guidance on benchmarks. We are grateful to four anonymous reviewers for their thoughtful reviews of an earlier version of the manuscript that greatly improved this report. We thank David Strong and Gregory Wetherbee for their work on the map in this report, and Wes Stone for technical assistance. We also thank the USGS Tacoma Publishing Service Center, and Carol Sanchez, Robin Miller, Larry Schneider, and Susan Davis of the USGS Sacramento Publishing Service Center, for their support in the publication of this report.

88 Contaminants in Water and Sediment Sampled in Response to the Deepwater Horizon Oil Spill
References Cited
American Petroleum Institute, 2003, High Production Volume Chemical Challenge Program, test plan, crude oil category: Submitted to the U.S. Environmental Protection Agency, November 21, 2003: American Petroleum Institute Petroleum HPV Testing Group, accessed August 12, 2011, at URL http://www.petroleumhpv.org/docs/crude_oil/2011_jan14_Crude%20oil%20category%20Final%20CAD%20-%2014%20January%202011.pdf
American Petroleum Institute, 2011, High Production Volume Chemical Challenge Program, crude oil category, category assessment document: Submitted to the U.S. Environmental Protection Agency, January 14, 2011: American Petroleum Institute Petroleum HPV Testing Group, accessed September 23, 2011, at URL http://www.petroleumhpv.org/docs/crude_oil/2011_jan14_Crude%20oil%20category%20Final%20CAD%20-%2014%20January%202011.pdf
Apodaca, L.E., Mueller, D.K., and Koterba, M.T., 2006, Review of trace element blank and replicate data collected in ground and surface water for the National Water-Quality Assessment Program, 1991–2002: U.S. Geological Survey Scientific Investigations Report 2006-5093, accessed September 23, 2011, at URL http://pubs.usgs.gov/sir/2006/5093/sir_2006-5093.pdf
Argonne National Laboratory, ChevronTexaco, and Marathon, 2012, Drilling waste management information system: Fact sheet–Using muds and additives with lower environmental impacts: Washington, D.C., U.S. Department of Energy’s Natural Gas & Oil Technology Partnership, accessed June 11, 2012, at URL http://web.ead.anl.gov/dwm/techdesc/lower/index.cfm
Atlas, R.M. and Hazen, T.C., 2011, Oil biodegradation and bioremediation: A tale of the two worst spills in U.S. history: Environmental Science and Technology, v. 45, no. 16, p. 6709–6715.
Australian and New Zealand Environment and Conservation Council, 2000, Aquatic Ecosystems, chap. 3 in The Guidelines, v.1 of Australian and New Zealand Guidelines for Fresh and Marine Water Quality, accessed January 20, 2011, at URL http://www.mincos.gov.au/__data/assets/pdf_file/0019/316126/wqg-ch3.pdf
Barrick, Robert; Becker, Scott; Brown, Lorraine; Beller, Harry; and Pastorok, Robert, 1988, Sediment quality values refinement: Vol. 1-1988, Update and evaluation of Puget Sound AET: Bellevue, WA, PTI Environmental Services, prepared for U.S. Environmental Protection Agency, Region 10, Seattle, WA, 193 p.
British Columbia Ministry of Environment, 2010, Water quality guideline reports: Environmental Protection Division, British Columbia Ministry of Environment, accessed April 20, 2011, at URL http://www.env.gov.bc.ca/wat/wq/wq_guidelines.html
Buchman, M.F., 2008, NOAA Screening quick reference tables: Seattle, WA, National Oceanic and Atmospheric Administration, Office of Response and Restoration Division Report 08-1, accessed November 22, 2010, current URL: http://archive.orr.noaa.gov/book_shelf/122_NEW-SQuiRTs.pdf
Burgess, R.M., Ahrens, M.J., and Hickey, C.W., 2003, Geochemistry of PAHs in aquatic environments: source, persistence and distribution, in Douben, P.E.T., ed., PAHs: An Ecotoxicological Perspective: Sussex, U.K., John Wiley & Sons Ltd., 376 p.
Canadian Council of Ministers of the Environment, 1995, Protocol for the derivation of Canadian sediment quality guidelines for the protection of aquatic life: Ottawa, Canada, Environment Canada, Guidelines Division, Technical Secretariat of the CCME task Group on Water Quality Guidelines, Canadian Council of Ministers of the Environment, CCME EPC-98E, [Reprinted in Canadian Council of Ministers of the Environment, ed., 1999, Canadian environmental quality guidelines, chap. 6], accessed March 31, 2011, at URL http://www.ccme.ca/assets/pdf/pn_1176_e.pdf
Canadian Council of Ministers of the Environment, 1999, Introduction, in Canadian water quality guidelines for the protection of aquatic life, in Canadian Environmental Quality Guidelines, 1999: Winnipeg, Manitoba, Canada, Canadian Council of Ministers of the Environment, accessed September 23, 2011, at URL http://ceqg-rcqe.ccme.ca/download/en/312
Canadian Council of Ministers of the Environment, 2001, Introduction, in Canadian sediment quality guidelines for the protection of aquatic life, in Canadian Environmental Quality Guidelines, 1999: Winnipeg, Manitoba, Canada, Canadian Council of Ministers of the Environment, accessed April 20, 2011, at URL http://ceqg-rcqe.ccme.ca/download/en/317
Canadian Council of Ministers of the Environment, 2011, Canadian environmental quality guidelines, Summary table: Canadian Council of Ministers of the Environment (CCME), accessed April 20, 2011, at URL http://st-ts.ccme.ca/

References Cited 89
Connor, B.F., Rose, D.L., Noriega, M.C., Murtagh, L.K., and Abney, S.R., 1998, Methods of analysis by the U.S. Geological Survey National Water Quality Laboratory–Determination of 86 volatile organic compounds in water by gas chromatography/mass spectrometry, including detections less than reporting limits: U.S. Geological Survey Open-File Report 97-829, accessed April 14, 2011, at URL http://wwwnwql.cr.usgs.gov/USGS/pubs/OFR/OFR-97-829.pdf
Continental Shelf Associates, Inc., 1997, Gulf of Mexico Produced Water Bioaccumulation Study, Executive summaries, prepared for Offshore Operators Committee, New Orleans, LA, accessed August 6, 2012, at URL http://www.deq.louisiana.gov/portal/Portals/0/permits/lpdes/pdf/EPA%20Platform_Survey_report.pdf
Di Toro, D.M., Zarba, C.S., Hansen, D.J., Berry, W.J., Swartz, R.C., Cowan, C.E., Pavlou, S.P., Allen, H.E., Thomas, N.A., and Paquin, P.R., 1991, Technical basis for the equilibrium partitioning method for establishing sediment quality criteria: Environmental Toxicology and Chemistry, v. 11, p. 1541–1583.
Field, L.J., MacDonald, D.D., Norton, S.B., Ingersoll, C.G., Severn, C.G., Smorong, Dawn, and Lindskoog, Rebekka, 2002, Predicting amphipod toxicity from sediment chemistry using logistic regression models: Environmental Toxicology and Chemistry, v. 21, no. 9, p. 1993–2005.
Fishman, M.J., ed., 1993, Methods of analysis by the U.S. Geological Survey National Water Quality Laboratory–Determination of inorganic and organic constituents in water and fluvial sediments: U.S. Geological Survey Open-File Report 93-125, 217 p., accessed September 23, 2011, at URL http://pubs.er.usgs.gov/publication/ofr93125
Fishman, M.J., and Friedman, L.C., 1989, Methods for determination of inorganic substances in water and fluvial sediments: U.S. Geological Survey Techniques of Water-Resources Investigations, book 5, chap. A1, 545 p.
Garbarino, J.R., 1999, Methods of analysis by the U.S. Geological Survey National Water Quality Laboratory–Determination of dissolved arsenic, boron, lithium, selenium, strontium, thallium, and vanadium using inductively coupled plasma-mass spectrometry: U.S. Geological Survey Open-File Report 99-093, 31 p., accessed September 18, 2011, at URL http://pubs.usgs.gov/of/1999/0093/report.pdf
Garbarino, J.R., Kanagy, L.K., and Cree, M.E., 2006, Determination of elements in natural-water, biota, sediment, and soil samples using collision/reaction cell inductively coupled plasma–mass spectrometry: U.S. Geological Survey Techniques and Methods, book 5, sec. B, chap. 1, 88 p., accessed September 23, 2011, at URL http://pubs.usgs.gov/tm/2006/tm5b1/PDF/TM5-B1.pdf
Garbarino, J.R., and Struzeski, T.M., 1998, Methods of analysis by the U.S. Geological Survey National Water Quality Laboratory–Determination of elements in whole-water digests using inductively coupled plasma–optical emission spectrometry and inductively coupled plasma–mass spectrometry: U.S. Geological Survey Open-File Report 98-165, 101 p., accessed September 23, 2011, at URL http://wwwnwql.cr.usgs.gov/USGS/pubs/OFR/OFR-98-165.pdf
Georgia Coastal Research Council, 2010, Oil spill summit II: Chemical considerations: Jacksonville, FL, University of North Florida, South Atlantic Sea Grant, 15 p., accessed August 12, 2011, at URL http://www.gcrc.uga.edu/PDFs/SA_SG_oil_summit2_report.pdf
Gries, T.H., and Waldow, K.H., 1994, Progress re-evaluating Puget Sound apparent effects thresholds (AETs): 1994 Amphipod and Echinoderm Larval AETs, vol. 1: Olympia, Washington, Washington Department of Ecology, 88 p.
Gustavsson, N., Bølvike, B., Smith, D.B., and Severson, R.C., 2001, Geochemical landscapes of the conterminous United States–New map presentations for 22 elements: U.S. Geological Survey Professional Paper 1648, 38 p., accessed August 17, 2011, at URL http://pubs.usgs.gov/pp/p1648/
Helsel, D.R., 2005, Nondetects and data analysis: statistics for censored environmental data: Hoboken, NJ, Wiley-Interscience, 268 p.
Helsel, D.R., and Hirsch, R.M., 2002, Statistical methods in water resources, chap. A3, Book 4 in Techniques of Water Resources Investigations: U.S. Geological Survey, TWRI 4-A3, 522 p., accessed November 15, 2011, at URL http://pubs.usgs.gov/twri/twri4a3/
Horowitz, A.J., and Stephens, V.C., 2008, The effects of land use on fluvial sediment chemistry for the conterminous U.S.–Results from the first cycle of the NAWQA Program: Trace and major elements, phosphorus, carbon, and sulfur: Science of the Total Environment, v. 400, p. 290–314.
Hyland, J.L., Balthis, W.L., Engle, V.D., Long, E.R., Paul, J.F., Summers, J.K., and Van Dolah, R.F., 2003, Incidence of stress in benthic communities along the U.S. Atlantic and Gulf of Mexico Coasts within different ranges of sediment contamination from chemical mixtures: Environmental Monitoring and Assessment, v. 81, p. 149–161.
Ingersoll, C.G., MacDonald, D.D., Wang, N., Crane, J.L., Field, L.J., Haverland, P.S., Kemble, N.E., Lindskoog, R.A., Severn, C.G., Smorong, D.E., 2001, Predictions of sediment toxicity using consensus-based freshwater sediment quality guidelines. Archives of Environmental Contamination and Toxicology, v. 41, p. 8–21.
90 Contaminants in Water and Sediment Sampled in Response to the Deepwater Horizon Oil Spill
Iqbal, Javed, Overton, E.B., and Gisclair, David, 2008, Polycyclic aromatic hydrocarbons in Louisiana rivers and coastal environments: source fingerprinting and forensic analysis: Environmental Forensics, v. 9, no. 1, p. 63–74.
Leung, K.M.Y.; Bjorgesaeter, Anders; Gray, J.S.; Li, W.K.; Lui, G.C.S.; Wang, Yuan; and Lam, P.K.S., 2005, Deriving sediment quality guidelines from field-based species sensitivity distributions: Environmental Science and Technology, v. 39, p. 5148–5156.
Long, E.R., MacDonald, D.D., Smith, S.L., and Calder, F.D., 1995, Incidence of adverse biological effects within ranges of chemical concentrations in marine and estuarine sediments: Environmental Management, v. 19, no. 1, p. 81–97.
Long, E.R., and Morgan, L.G., 1991, The potential for biological effects of sediment-sorbed contaminants tested in the National Status and Trends Program: Seattle, Washington, National Oceanic and Atmospheric Administration Technical Memorandum NOS OMA 52, 235 p.
Lorenz, D.L., Ahearn, E.A., Carter, J.M., Cohn, T.A., Danchuk, W.J., Frey, J.W., Helsel, D.R., Lee, K.E., Leeth, D.C., Martin, J.D., McGuire, V.L., Neitzert, K.M., Robertson, D.M., Slack, J.R., Starn, Jeffrey, Vecchia, A.V., Wilkison, D.H., and Williamson, J.E., 2011, USGS library for S-PLUS for Windows–Release 4.0: U.S. Geological Survey Open-File Report 2011-1130.
Lubchenco, Jane, 2010, Transcript loop current conference call May 18, 2010, Deepwater Horizon response, National Oceanic and Atmospheric Administration press briefing: accessed November 28, 2012., at URL http://www.restorethegulf.gov/release/2010/05/19/transcript-loop-current-conference-call-may-18-2010
MacDonald, D.D., Carr, R.S., Calder, F.D., Long, E.R., and Ingersoll, C.G., 1996, Development and evaluation of sediment quality guidelines for Florida coastal waters: Ecotoxicology, v. 5, no. 4, p. 253–278.
MacDonald, D.D., Ingersoll, C.G., and Berger, T.A., 2000, Development and evaluation of consensus-based sediment quality guidelines for freshwater ecosystems: Archives of Environmental Contamination and Toxicology, v. 39, p. 20–31.
Martin, J.D., 2002, Variability of pesticide detections and concentrations in field replicate water samples collected for the National Water-Quality Assessment Program, 1992–97: U.S. Geological Survey Water-Resources Investigations Report 2001-4178, 84 p., accessed September 23, 2011, at URL http://pubs.usgs.gov/wri/2001/wri01_4178/pdf/wri01-4178.pdf
Meays, Cindy, 2010, Derivation of water quality guidelines to protect aquatic life in British Columbia: Science and Information Branch, Ministry of Environment, 32 p., accessed April 28, 2011, at URL http://www.env.gov.bc.ca/wat/wq/pdf/wq-derivation.pdf
Mount, Dave, 2010, Explanation of PAH benchmark calculations using EPA PAH ESB approach: U.S. Environmental Protection Agency, 6 p., available online at URL http://www.epa.gov/bpspill/water/explanation-of-pah-benchmark-calculations-20100622.pdf
Mueller, D.K., and Titus, C.J., 2005, Quality of nutrient data from streams and ground water sampled during water years 1992–2001: U.S. Geological Survey Scientific Investigations Report 2005–5106, 27 p., accessed September 23, 2011, at URL http://pubs.usgs.gov/sir/2005/5106/pdf/sir2005-5106.pdf
Nadkarni, R.A., 1991, A review of modern instrumental methods of elemental analysis of petroleum related material: Part 1–occurrence and significance of trace metals in petroleum and lubricants, in Nadkarni, R.A., ed., Modern instrumental methods of elemental analysis of petroleum products and lubricants: Philadelphia, American Society of Testing and Materials, ASTM STP 1109, p. 5–18.
Nagpal, N.K., Pommen, L.W., and Swain, L.G., 2006, A compendium of working water quality guidelines for British Columbia: Science and Information Branch, Ministry of Environment, accessed April 28, 2011, at URL http://www.env.gov.bc.ca/wat/wq/BCguidelines/working.html
National Oceanic and Atmospheric Administration, 2010, Deepwater Horizon / BP oil spill response, accessed June 6, 2012, at URL http://archive.orr.noaa.gov/dwh.php?entry_id809#downloads
Neff, J.M., 2002, Bioaccumulation in marine organisms: Effect of contaminants from oil well produced water: Elsevier Inc., San Diego, Calif, 452 p.
Neff, J., Lee, K., and DeBlois, E.M., 2011, Produced water: overview of composition, fates, and effects, in Lee, K. and Neff, J., eds. Produced water: environmental risks and advances in mitigation technologies: Springer, New York, NY, p. 3–56.
Operational Science Advisory Team, 2010, Summary report for sub-sea and sub-surface oil and dispersant detection–Sampling and monitoring: New Orleans, Unified Area Command, prepared for the U.S. Coast Guard, December 17, 2010, variously paged, accessed June 2, 2011, at URL http://www.restorethegulf.gov/sites/default/files/documents/pdf/OSAT_Report_FINAL_17DEC.pdf90

References Cited 91
Operational Science Advisory Team, 2011, Summary report for sub-sea and sub-surface oil and dispersant detection: Ecotoxicity addendum: prepared for the U.S. Coast Guard, July 8, 2011, 35 p., accessed September 9, 2011, at URL http://www.restorethegulf.gov/sites/default/files/u306/FINAL%20OSAT%20Ecotox%20Addendum.pdf
Patton, C.J., and Kryskalla. J.R., 2003, Methods of Analysis by the U.S. Geological Survey National Water Quality Laboratory–Evaluation of alkaline persulfate Digestion as an alternative to Kjeldahl digestion for determination of total and dissolved nitrogen and phosphorus in water: U.S. Geological Survey Water-Resources Investigations Report 03-4174, 33 p.
Patton, C.J., and Truitt, E.P., 1992, Methods of analysis by the U.S. Geological Survey National Water Quality Laboratory–Determination of total phosphorus by a Kjeldahl digestion method and an automated colorimetric finish that includes dialysis: U.S. Geological Survey Open-File Report 92-146, 39 p., accessed September 23, 2011, at URL http://pubs.usgs.gov/of/1992/0146/report.pdf
Patton, C.J., and Truitt, E.P., 2000, Methods of analysis by the U.S. Geological Survey National Water Quality Laboratory–Determination of ammonium plus organic nitrogen by a Kjeldahl digestion method and an automated photometric finish that includes digest cleanup by gas diffusion: U.S. Geological Survey Open-File Report 00-170, 31 p., accessed September 23, 2011, at URL http://pubs.usgs.gov/of/2000/0170/report.pdf
Reddy, C.M., Arey, S.J., Seewald, J.S., Sylva, S.P., Lemkau, K.L., Nelson, R.K., Carmichael, C.A., McIntyre, C.P., Fenwick, J., Ventura, G.T., Van Mooy, B.A.S., and Camilli, R., 2012. Composition and fate of gas and oil released to the water column during the Deepwater Horizon oil spill. Proceedings of the National Academy of Sciences, www.pnas.org/cgi/doi/10.1073/pnas.1101242108
Rosenbauer, R.J., Campbell, P.L., Lam, A., Lorenson, T.D., Hostettler, F.D., Thomas, B., and Wong, F.L., 2010, Reconnaissance of Macondo-1 well oil in sediment and tarballs from the Northern Gulf of Mexico shoreline, Texas to Florida: U.S. Geological Survey Open-File Report 2010-1290, 22 p., accessed August 4, 2011, at URL http://pubs.usgs.gov/of/2010/1290/of2010-1290.pdf
Rosenbauer, R.J., Campbell, P.L., Lam, Angela, Lorenson, T.D., Hostettler, F.D., Thomas, Burt, and Wong, F.L., 2011, Petroleum hydrocarbons in sediment from the Northern Gulf of Mexico shoreline, Texas to Florida: U.S. Geological Survey Open-File Report 2011-1014, 22 p., accessed April 6, 2011, at URL http://pubs.usgs.gov/of/2011/1014/of2011-1014.pdf
SAS Institute Inc., 2009a, Base SAS 9.2 procedures guide: Cary, NC, SAS Institute Inc, 1,680 p.
SAS Institute Inc., 2009b, SAS/Stat 9.2 user’s guide: Cary, NC, SAS Institute Inc, 7,869 p.
State of Florida Oil Spill Academic Task Force, 2010, Description of the MC252 crude oil: Florida, Florida State University, accessed August 11, 2011, at URL http://oilspill.fsu.edu/images/pdfs/mc-252crude-oil-desc.pdf
TIBCO Software, Inc., 2008, TIBCO Spotfire S+® 8.1 for Windows®, [Computer Software], available online at URL http://spotfire.tibco.com/en.aspx
Turekian, K.K., 1968, Oceans: Engelwood Cliffs, NJ, Prentice-Hall, 120 p.
Unified Area Command, 2010, Deepwater Horizon MC 252 Response–Strategic plan for the sub-sea and sub-surface oil and dispersant detection, sampling and monitoring: Unified Area Command, 95 p.
U.S. Environmental Protection Agency, 1986 (revised December 1996), Test methods for evaluating of solid waste, physical/chemical methods: Office of Solid Waste and Emergency Response, U.S. Environmental Protection Agency, EPA-SW-846 (3rd ed.), subsequent updates, variously paged, accessed August 1, 2012, at URLs http://www.caslab.com/EPA-Methods/PDF/8270c.pdf, http://www.epa.gov/wastes/hazard/testmethods/sw846/pdfs/6010c.pdf, http://www.epa.gov/wastes/hazard/testmethods/sw846/pdfs/7470a.pdf, http://www.caslab.com/EPA-Methods/PDF/8015b.pdf, http://www.epa.gov/wastes/hazard/testmethods/sw846/pdfs/8015c.pdf, http://www.epa.gov/osw/hazard/testmethods/sw846/pdfs/8260b.pdf, http://www.caslab.com/EPA-Methods/PDF/8270c.pdf, http://www.epa.gov/wastes/hazard/testmethods/sw846/pdfs/8270d.pdf
U.S. Environmental Protection Agency, 1989, Data evaluation, chap. 5 in Risk assessment guidance for Superfund: Volume I–Human health evaluation manual (Part A): Washington, D.C., Office of Emergency and Remedial Response, U.S. Environmental Protection Agency Report EPA/540/1-89/002, 30 p., accessed September 23, 2011, at URL http://www.epa.gov/oswer/riskassessment/ragsa/pdf/ch5.pdf
U.S. Environmental Protection Agency, 1996, Ecotox thresholds, EPA EcoUpdate, v. 3, no. 2, EPA 540/F-95/038, accessed January 27, 2011, at URL http://www.epa.gov/oswer/riskassessment/ecoup/pdf/v3no2.pdf
U.S. Environmental Protection Agency, 1998, Method 9071B–n-Hexane extractable material (HEM) for sludge, sediment, and solid samples: Method 9071B, accessed on September 15, 2011, at URL http://www.epa.gov/epawaste/hazard/testmethods/sw846/pdfs/9071b.pdf
92 Contaminants in Water and Sediment Sampled in Response to the Deepwater Horizon Oil Spill
U.S. Environmental Protection Agency, 1999, Method 1664, revision A: N-hexane extractable material (HEM; oil and grease) and silica gel treated N-hexane extractable material (SGT-HEM; non-polar material) by extraction and gravimetry, February 1999: Office of Water, U.S. Environmental Protection Agency, EPA 821/R-98-002, 28 p.
U.S. Environmental Protection Agency, 2002, Procedures for the derivation of equilibrium partitioning sediment benchmarks (ESBs) for the protection of benthic organisms: PAH mixtures: Office of Research and Development, U.S. Environmental Protection Agency, EPA-600-R-02-013.
U.S. Environmental Protection Agency, 2004, The incidence and severity of sediment contamination in surface waters of the United States, National Sediment Quality Survey (2d ed.): Office of Science and Technology, U.S. Environmental Protection Agency, EPA 823-R-04-007, accessed September 23, 2011, at URL http://water.epa.gov/polwaste/sediments/cs/report2004_index.cfm
U.S. Environmental Protection Agency, 2008, Procedures for the derivation of equilibrium partitioning Sediment Benchmarks (ESBs) for the protection of benthic organisms: Compendium of Tier 2 values for nonionic organics: U.S. Environmental Protection Agency, EPA/600/R-02/016, accessed September 23, 2011, at URL http://www.epa.gov/nheerl/download_files/publications/ESB_Compendium_v14_final.pdf
U.S. Environmental Protection Agency, 2009, National Recommended Water Quality Criteria: U.S. Environmental Protection Agency, accessed September 23, 2011, at URL http://www.epa.gov/ost/criteria/wqctable/
U.S. Environmental Protection Agency, 2010, Human health benchmarks for chemicals in water, EPA response to BP spill in the Gulf of Mexico: U.S. Environmental Protection Agency, accessed January 27, 2011, at URL http://www.epa.gov/bpspill/health-benchmarks.html
U.S. Environmental Protection Agency, 2011a, Water quality benchmarks for aquatic life, EPA response to BP spill in the Gulf of Mexico: U.S. Environmental Protection Agency, accessed January 27, 2011, at URL http://www.epa.gov/bpspill/water-benchmarks.html
U.S. Environmental Protection Agency, 2011b, Sediment benchmarks for aquatic life, EPA response to BP spill in the Gulf of Mexico: U.S. Environmental Protection Agency, accessed January 27, 2011, at URL http://www.epa.gov/bpspill/sediment-benchmarks.html
U.S. Environmental Protection Agency, 2011c, Coastal water sampling, EPA response to BP spill in the Gulf of Mexico: U.S. Environmental Protection Agency, accessed January 27, 2011, at URL http://www.epa.gov/bpspill/water.html#understanding
U.S. Environmental Protection Agency, 2011d, National Recommended Water Quality Criteria, Appendix A—Conversion factors for dissolved metals: U.S. Environmental Protection Agency, accessed September 23, 2011, at URL http://water.epa.gov/scitech/swguidance/standards/criteria/current/index.cfm
U.S. Environmental Protection Agency, 2012, Approved general-purpose methods, accessed August 1, 2012, at URL http://water.epa.gov/scitech/methods/cwa/methods_index.cfm
U.S. Geological Survey, variously dated, National field manual for the collection of water-quality data: U.S. Geological Survey Techniques of Water-Resources Investigations, book 9, chaps. A1–A9, accessed September 23, 2011, at URL http://pubs.water.usgs.gov/twri9A
Wershaw, R.L., Fishman, M.J., Grabbe, R.R., and Lowe, L.E., eds., 1987, Methods for the determination of organic substances in water and fluvial sediments: U.S. Geological Survey Techniques of Water-Resources Investigations, book 5, chap. A3.
Wilde, F.D., and Skrobialowski, S.C., 2011, U.S. Geological Survey protocol for sample collection in response to the Deepwater Horizon Oil Spill, Gulf of Mexico, 2010, Sampling methods for water, sediment, benthic invertebrates, and microorganisms in coastal environments: U.S. Geological Survey Open-File Report 2010-1098, 178 p., accessed June 1, 2011, at URL http://pubs.usgs.gov/of/2011/1098/
Zaugg, S.D., Burkhardt, M.R., Burbank, T.L., Olson, M.C., Iverson, J.L., and Schroeder, M.P., 2006, Determination of semivolatile organic compounds and polycyclic aromatic hydrocarbons in solids by gas chromatography/mass spectrometry: U.S. Geological Survey Techniques and Methods, book 5, chap. B3, 44 p., accessed April 14, 2011, at URL http://pubs.usgs.gov/tm/2006/tm5b3/
Censored data A set of one or more censored values.Censored value An analytical result determined to be below a specified threshold concentration and reported as a less-than value (for example, less than 3 when 3 is the threshold; see Censoring).Censoring Application of a threshold to data such that concentrations above that threshold are quantified values and concentrations below that threshold are reported as less-than values (for example, less than 3, when 3 is the threshold). Censoring may be done at two stages of chemical data analysis: (1) by the laboratory because of high uncertainty in quantifying concentrations near the method detection limit, in which case the threshold is a reporting level, although for some methods, values that are below the reporting level but above the detection level could be quantified, but coded as estimates; (2) during data analysis because of blank contamination, in order to avoid interpreting incidental contamination in a sample as environmental contamination or to eliminate bias when comparing data, such as bias due to different method sensitivities, in which cases the threshold is a censoring level. This report describes three kinds of censoring levels: raised censoring levels, which are applied to contaminants detected in quality control blank samples; optimum censoring thresholds, which are applied for comparison of pre-landfall and post-landfall sample groups; and common detection thresholds, which are applied for comparison among contaminants with different laboratory reporting levels.Censoring level A concentration threshold that is applied to data such that concentrations above that threshold are quantified values and concentrations below that threshold are reported as less-than values (for example, less than 3).Common detection threshold A censoring level applied to a group of analytes for the purpose of comparing among the analytes. This eliminated bias due to differences in method sensitivities for different contaminants.
Detection level A generic term for the lowest concentration that can be reliably quantified by a certain method at a certain laboratory.Indeterminate sample A sample with an indeterminate value for a specified analyte.Indeterminate value A censored value, that is, a result reported as less than a specified reporting level, where the reporting level is higher than the applied censoring threshold, so the value cannot be classified as either a detection or nondetection at that threshold. For example, an analyte concentration reported as less than 1 would be indeterminate at a censoring threshold of 0.2 because it is unknown whether the analyte is present at levels above 0.2.Method detection limit (MDL) The minimum concentration of a substance that can be measured and reported with 99-percent confidence that the value is greater than zero (40 CFR Part 136).Optimal censoring threshold The lowest censoring level that converts no more than 5 percent of results from censored to indeterminate values, maximizes the number of quantifiable detections and, if possible, also minimizes the number of indeterminate values. This was applied to concentrations of a given contaminant for the purpose of comparing pre-landfall and post-landfall sample groups.Quantified value An analytical result measured above the reporting level and reported as a specific concentration. For some methods, such as those in which there is corroborative evidence of analyte presence in a mass spectrogram, an analytical result measured below the reporting level but above the detection level would be quantified, but coded as an estimate.Parameter code Code for parameters in the USGS National Water Information System database (http://nwis.waterdata.usgs.gov/usa/nwis/pmcodes); also called USGS parameter code.
Glossary
Raised censoring level For contaminants detected in quality-control blanks, a censoring level higher than the reporting level that is applied to censor data in those environmental samples associated with the contaminated blanks, which minimizes the likelihood that detections of those contaminants in environmental samples are the result of incidental contamination. Typically, the raised censoring level is set at five times the maximum concentration determined in the applicable blanks or, for common laboratory contaminants, 10 times.
Reporting level The concentration, set by a laboratory, used for reporting analytical results that are determined to be less than the detection level. This could be higher than the detection level because analytical results at or near the detection level can have high uncertainty. The reporting level can vary because of factors such as matrix interference, low sample mass, or sample dilution.
94 Contaminants in Water and Sediment Sampled in Response to the Deepwater Horizon Oil Spill
Appendix 1. Methods, Reporting Levels, and Laboratories Used for Chemical Analysis for the Deepwater Horizon Oil Spill, Gulf of Mexico, 2010 Appendix tables and references are available for download in PDF format at http://pubs.usgs.gov/sir/2012/5228/.
Table 1-1. Methods, reporting levels, and laboratories used for chemical analysis for the Deepwater Horizon oil spill, Gulf of Mexico, 2010: organic contaminants in water
Table 1-2. Methods, reporting levels, and laboratories used for chemical analysis for the Deepwater Horizon oil spill, Gulf of Mexico, 2010: organic contaminants in whole sediment
Table 1-3. Methods, reporting levels, and laboratories used for chemical analysis for the Deepwater Horizon oil spill, Gulf of Mexico, 2010: trace and major elements and nutrients in water
Table 1-4. Methods, reporting levels, and laboratories used for chemical analysis for the Deepwater Horizon oil spill, Gulf of Mexico, 2010: trace and major elements and nutrients in whole sediment
Table 1-5. Methods, reporting levels, and laboratories used for chemical analysis for the Deepwater Horizon oil spill, Gulf of Mexico, 2010: trace and major elements and nutrients in the less than 63-micrometer sediment fraction
Table 1-6. Methods used for chemical analysis in the Deepwater Horizon oil spill, Gulf of Mexico, 2010, study
Appendix 1. References Cited
Appendix 2. Data Distributions for Contaminants in Water and Sediment Sampled in Response to the Deepwater Horizon Oil Spill, 2010 Appendix figures are available for download in PDF format at http://pubs.usgs.gov/sir/2012/5228/.
Appendix 2.1. Graphs showing data distributions for organic contaminants in water sampled in response to the Deepwater Horizon oil spill, 2010
Appendix 2.2 Graphs showing data distributions for organic contaminants in whole sediment sampled in response to the Deepwater Horizon oil spill, 2010
Appendix 2.3. Graphs showing data distributions for trace and major elements, nutrients, and specific conductance in water sampled in response to the Deepwater Horizon oil spill, 2010
Appendix 2.4. Graphs showing data distributions for trace and major elements in whole sediment sampled in response to the Deepwater Horizon oil spill, 2010
Appendix 2.5. Graphs showing data distributions for trace and major elements in the less than 63-micrometer fraction of sediment sampled in response to the Deepwater Horizon oil spill, 2010
96 Contaminants in Water and Sediment Sampled in Response to the Deepwater Horizon Oil Spill
Appendix 3. Benchmark Exceedances for Contaminants in Water and Sediment Sampled in Response to the Deepwater Horizon Oil Spill, 2010
Appendix tables are presented as Microsoft© Excel spreadsheets. They can be accessed and downloaded at http://pubs.usgs.gov/sir/2012/5228/.
Appendix 3.1. Benchmark exceedances for organic contaminants in water, by sample, from the Deepwater Horizon oil spill, Gulf of Mexico, 2010
Appendix 3.2 Benchmark exceedances for organic contaminants in sediment, by sample, from the Deepwater Horizon oil spill, Gulf of Mexico, 2010
Appendix 3.3. Benchmark exceedances for trace elements in water, by sample, from the Deepwater Horizon oil spill, Gulf of Mexico, 2010
Appendix 3.4. Benchmark exceedances for trace elements in whole sediment and national baseline comparisons for trace and major elements and nutrients in the less than the 63-micrometer sediment fraction, by sample, from the Deepwater Horizon oil spill, Gulf of Mexico, 2010

Publishing support provided by the U.S. Geological Survey SciencePublishing Network, Sacramento and TacomaPublishing Service Centers
For more information concerning the research in this report, contact the Director, California Water Science Center
U.S. Geological Survey 6000 J Street, Placer Hall Sacramento, California 95819 http://ca.water.usgs.gov

Printed on recycled paper