orderbook visualization & analysis -...
TRANSCRIPT

by Pavel Schön & Sebastian Neusüß
Orderbook Visualization & Analysis
1
Open Source in Quantitative Finance, 5th June 2015 Orderbook Visualization & Analysis
2
Agenda
• Introduction & Motivation
• Orderbook Player
• 2D/3D Orderbook Viewer
• Implementation Details
Open Source in Quantitative Finance, 5th June 2015 Orderbook Visualization & Analysis
3
Motivation • Initially driven by discussions about HFT participation at EUREX
• Public data is enriched with private data
• Get (fast) insights into market structure and member participation
• Integrated into the existing monitoring tools (browser based)
• Eurex order by order feed (EOBI) as primary data source
• Three modes
• Orderbook player
• 2D (everything at a glance)
• 3D (showcase)

Open Source in Quantitative Finance, 5th June 2015 Orderbook Visualization & Analysis
4
Introduction• ‘(Limit) order book’: A list of unexecuted buy and sell orders for a
specific financial instrument.
• Usually organized by price level, pioritized by time
• Key figures: best bid / best offer (volume,price), spread, total bid/offer
volume, liquidity measures etc
• Two Market Data feeds available on Eurex
• Price Level Aggregate (EMDI)
• Order by Order (EOBI, available for benchmark futures only)
Open Source in Quantitative Finance, 5th June 2015 Orderbook Visualization & Analysis
5
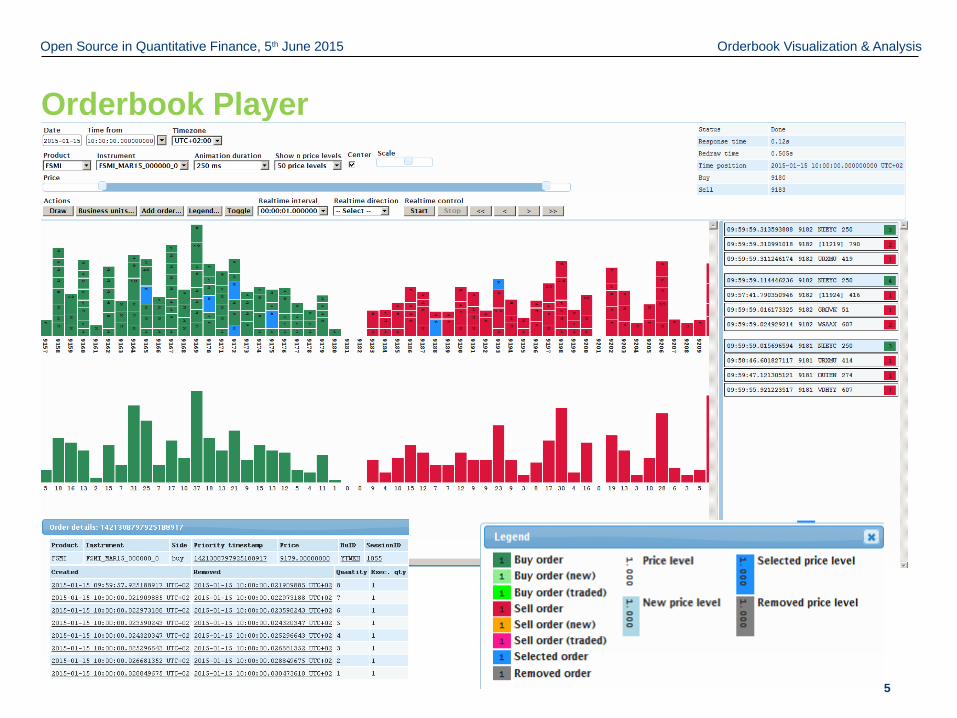
Orderbook Player
Open Source in Quantitative Finance, 5th June 2015 Orderbook Visualization & Analysis
6
Orderbook Player• Display orderbook ‘order by order’ and aggregated at a certain time
• ‘Play’ orderbook in configurable steps
• Animations show changes to the orderbook
• Trades of last two time steps are shown in ‘tradebox’
• Highlighting of orders based on ownership (or groups of owners), e.g.
‘HFT’ ‘non HFT’ participation
• Detailed information for each order in context menu, tracking of
individual orders
Open Source in Quantitative Finance, 5th June 2015 Orderbook Visualization & Analysis
7
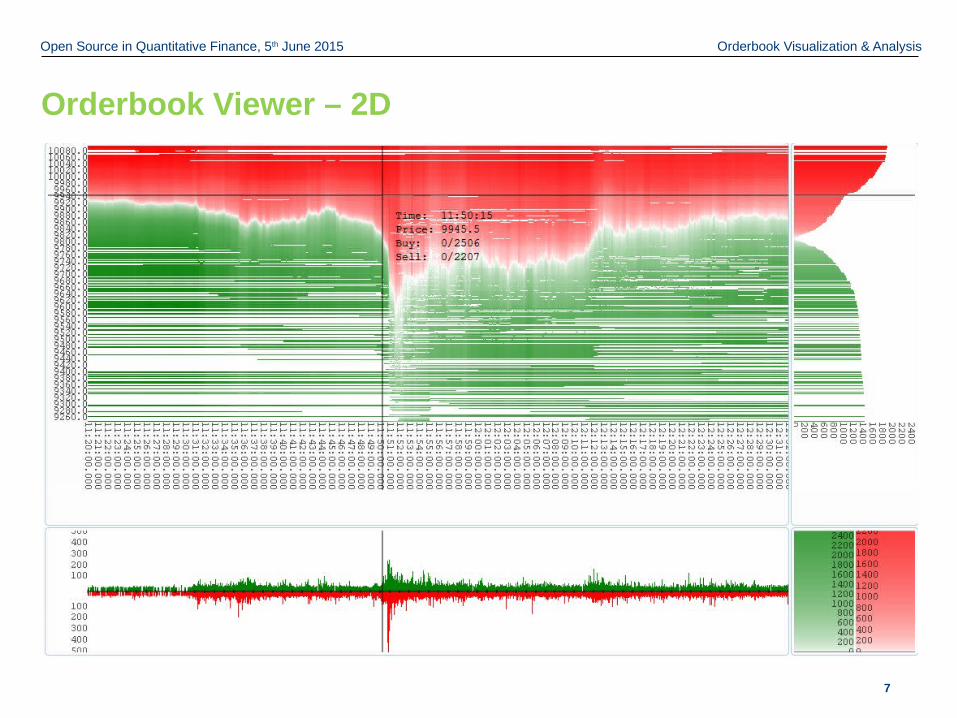
Orderbook Viewer – 2D
FDAX 15-Jan 2015 11:20-13:20
Open Source in Quantitative Finance, 5th June 2015 Orderbook Visualization & Analysis
8
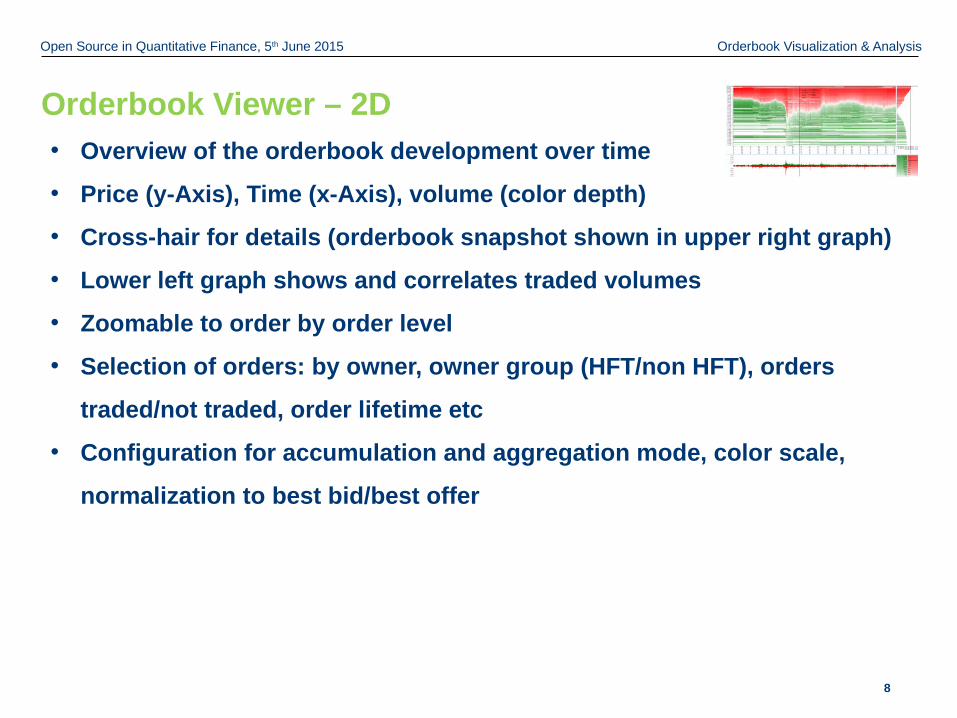
Orderbook Viewer – 2D• Overview of the orderbook development over time
• Price (y-Axis), Time (x-Axis), volume (color depth)
• Cross-hair for details (orderbook snapshot shown in upper right graph)
• Lower left graph shows and correlates traded volumes
• Zoomable to order by order level
• Selection of orders: by owner, owner group (HFT/non HFT), orders
traded/not traded, order lifetime etc
• Configuration for accumulation and aggregation mode, color scale,
normalization to best bid/best offer

Open Source in Quantitative Finance, 5th June 2015 Orderbook Visualization & Analysis
9
2D• Normalized, linear color-scale
• Individual contributions
Open Source in Quantitative Finance, 5th June 2015 Orderbook Visualization & Analysis
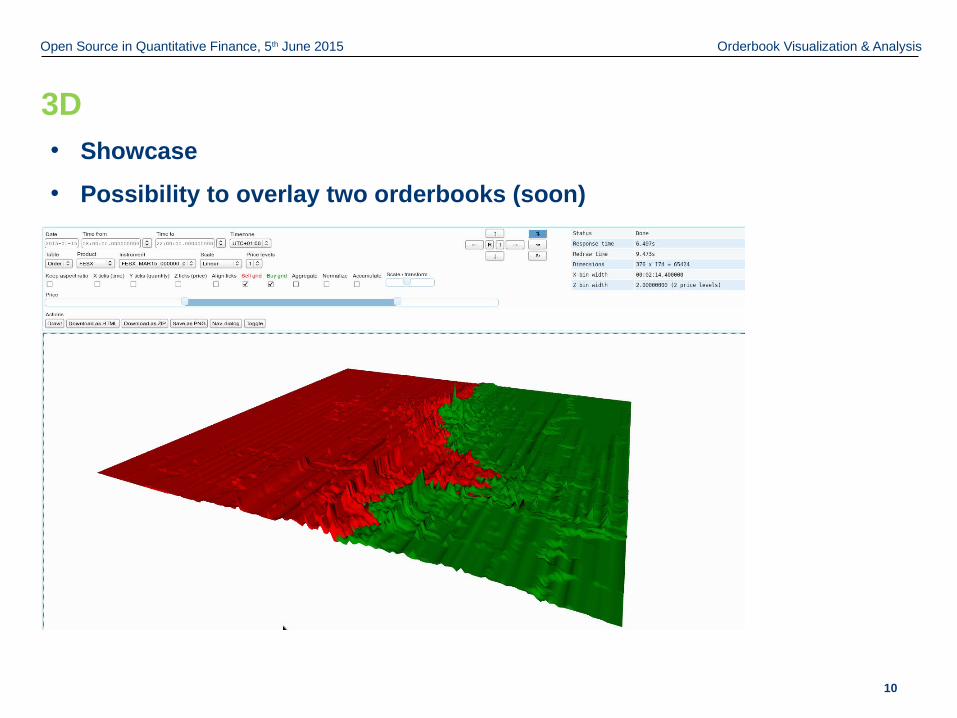
• Showcase
• Possibility to overlay two orderbooks (soon)
10
3D
Open Source in Quantitative Finance, 5th June 2015 Orderbook Visualization & Analysis
11
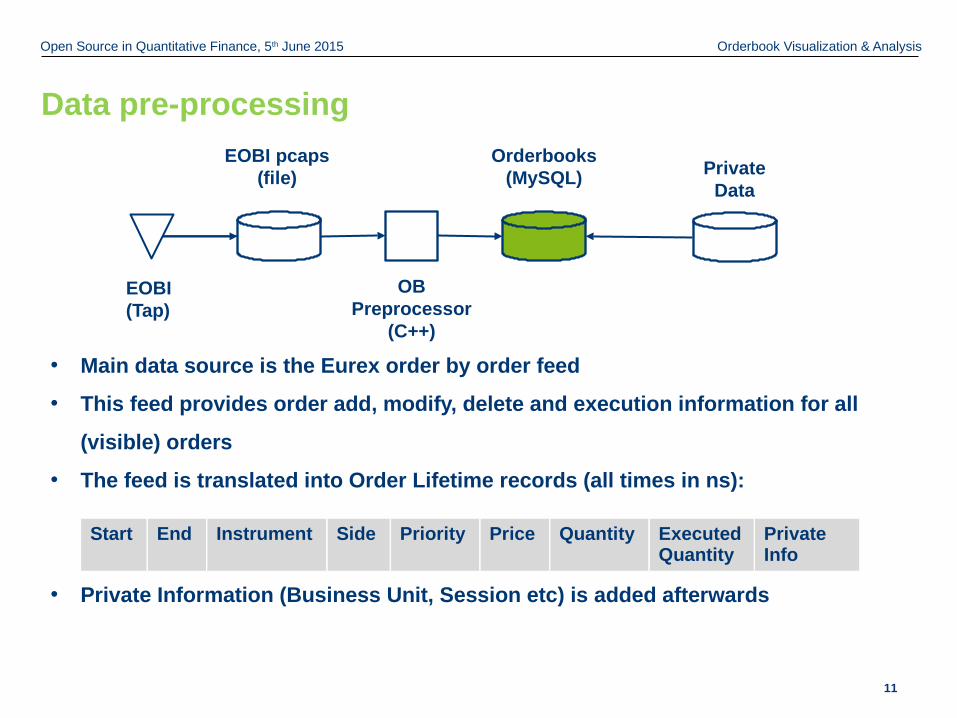
Data pre-processing
• Main data source is the Eurex order by order feed
• This feed provides order add, modify, delete and execution information for all
(visible) orders
• The feed is translated into Order Lifetime records (all times in ns):
• Private Information (Business Unit, Session etc) is added afterwards
EOBI (Tap)
EOBI pcaps(file)
OBPreprocessor
(C++)
Orderbooks(MySQL)
Start End Instrument Side Priority Price Quantity ExecutedQuantity
Private Info
PrivateData

Open Source in Quantitative Finance, 5th June 2015 Orderbook Visualization & Analysis
12
Front End – Tech Overview• FE served by webserver using Apache + mod_wsgi
• Python modules partly using C++ modules (boost::python)
• SQLAlchemy as database abstraction layer
• We combine both SA Core and SA ORM
• Jinja2 as templating engine
• JavaScript libraries: jquery(-UI), D3.js, X3DOM.js, Flot.js, canvas API
• Official support only for firefox (reduces testing efforts)
Open Source in Quantitative Finance, 5th June 2015 Orderbook Visualization & Analysis
13
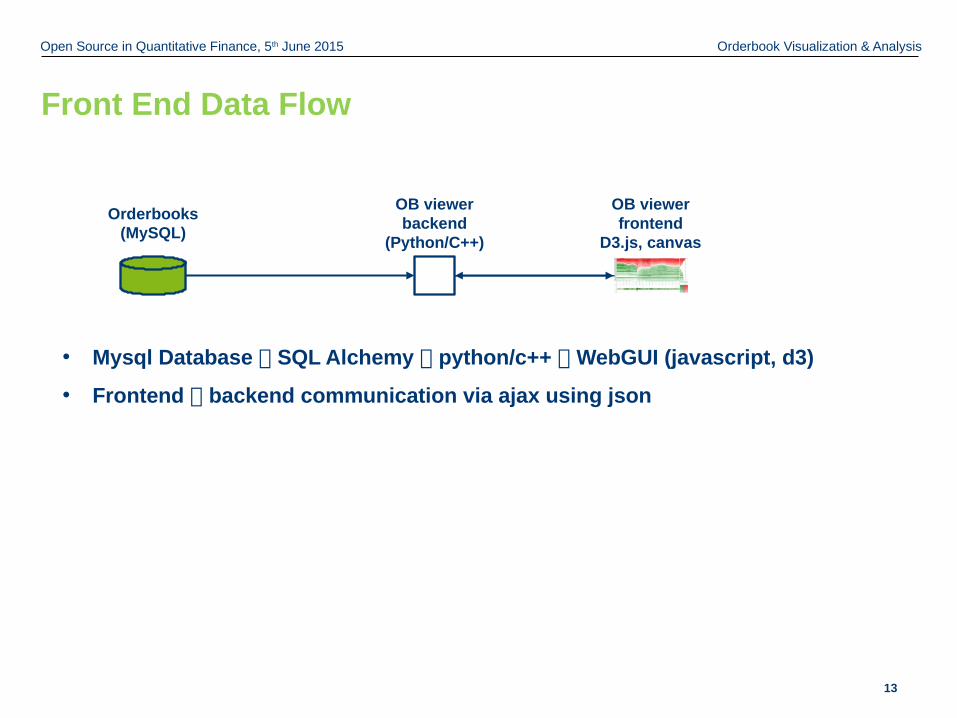
Front End Data Flow
• Mysql Database SQL Alchemy python/c++ WebGUI (javascript, d3)
• Frontend backend communication via ajax using json
Orderbooks(MySQL)
OB viewer backend
(Python/C++)
OB viewer frontend
D3.js, canvas

Open Source in Quantitative Finance, 5th June 2015 Orderbook Visualization & Analysis
14
Orderbook Player – Technical Overview
Open Source in Quantitative Finance, 5th June 2015 Orderbook Visualization & Analysis
15
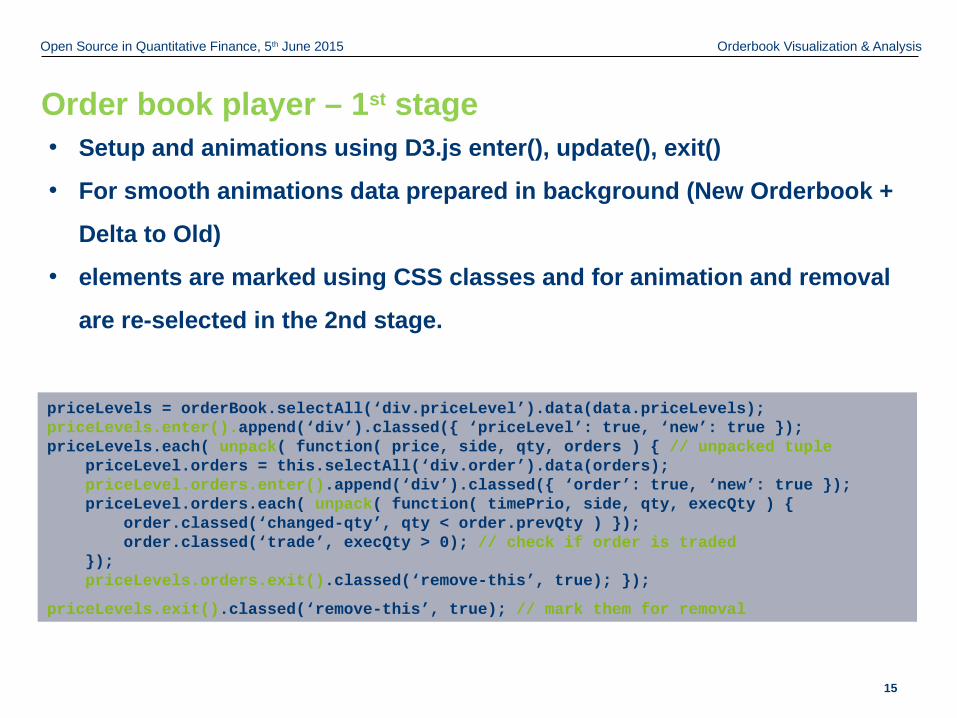
Order book player – 1st stage • Setup and animations using D3.js enter(), update(), exit()
• For smooth animations data prepared in background (New Orderbook +
Delta to Old)
• elements are marked using CSS classes and for animation and removal
are re-selected in the 2nd stage.
priceLevels = orderBook.selectAll(‘div.priceLevel’).data(data.priceLevels);priceLevels.enter().append(‘div’).classed({ ‘priceLevel’: true, ‘new’: true });priceLevels.each( unpack( function( price, side, qty, orders ) { // unpacked tuple priceLevel.orders = this.selectAll(‘div.order’).data(orders); priceLevel.orders.enter().append(‘div’).classed({ ‘order’: true, ‘new’: true }); priceLevel.orders.each( unpack( function( timePrio, side, qty, execQty ) { order.classed(‘changed-qty’, qty < order.prevQty ) }); order.classed(‘trade’, execQty > 0); // check if order is traded }); priceLevels.orders.exit().classed(‘remove-this’, true); });
priceLevels.exit().classed(‘remove-this’, true); // mark them for removal

Open Source in Quantitative Finance, 5th June 2015 Orderbook Visualization & Analysis
16
Order book player – 2nd stage • Animate divs marked as new/trade/changed-qtyorderBook.selectAll(‘div.priceLevel.new’)
orderBook.selectAll(‘div.order.new’)
orderBook.selectAll(‘div.order.changed-qty’)
orderBook.selectAll(‘div.order.trade’) // after animation mark as remove-this
• Remove divs (orders and price levels) marked as remove-thisorderBook.selectAll(‘div.order.remove-this, div.trade.remove-this’).remove()
• No d3.transitions, just simple setTimeout()
• No d3.layouts and behaviours

Open Source in Quantitative Finance, 5th June 2015 Orderbook Visualization & Analysis
17
Orderbook Viewer – Technical Overview
FDAX 15-Jan 2015 11:20-13:20

Open Source in Quantitative Finance, 5th June 2015 Orderbook Visualization & Analysis
18
2D / 3D: Input Parameters• Product ID, Instrument ID
• Time and Price interval
• Available display area (X-Y in pixels)
• Aggregation, accumulation and normalization mode
• User permission (public/private)

Open Source in Quantitative Finance, 5th June 2015 Orderbook Visualization & Analysis
19
Output for (2D and 3D)• Array of contracts on offer in price-time matrix [xDim * yDim]
• Best Bid/Ask kept separately in ‘top-of-book’ array [ 2 * xDim ]
• Used for ‘normalization’: price_norm(t) = price(t) – midpoint(t)
var buyScale = d3.scale.sqrt().domain([ 0, maxBuy ]).range([ “white”, “green” ]);var sellScale = d3.scale.sqrt().domain([ 0, maxSell ]).range([ “white”, “red” ]);
time
pri
ce
• [minBuy, maxBuy],[minSell,maxSell] used as domain for d3.scale
• Color scales: sqrt(), linear(), log()
Open Source in Quantitative Finance, 5th June 2015 Orderbook Visualization & Analysis
20
X3D, X3DOM.js• SVG is 2D
• <rect>, <circle>, <line>, <path>, <a>, <g>, ...
• Supported in modern browsers, part of HTML5
• X3D is 3D
• <box>, <sphere>, <cylinder>, <elevationgrid>, <material>...
• X3D is unsupported in browsers (yet), so we need to use library
X3DOM.js, which renders the scene using WebGL API
• If HW acceleration is not available (e.g. when accessing via remote
desktop), then X3DOM.js renders using Flash plugin (included)
• X3DOM.js is officially in beta stage, but works pretty well
Open Source in Quantitative Finance, 5th June 2015 Orderbook Visualization & Analysis
21
Time for questions
?
Open Source in Quantitative Finance, 5th June 2015 Orderbook Visualization & Analysis
22
Pavel Schö[email protected]
Sebastian Neusüß[email protected]
Contact

Open Source in Quantitative Finance, 5th June 2015 Orderbook Visualization & Analysis
23
Backup- Orderbook Analysis• Additional orderbook statics prepared in separate tables:
• Spreads, total volume, liquidity indicators (soon)

Open Source in Quantitative Finance, 5th June 2015 Orderbook Visualization & Analysis
24
Backup: Order book player – JSON data formatArray of objectspriceLevels = [{ 'price': 1000, 'side': 1, 'qty': 10, 'orders': [ { 'timePrio': 1421313372687320862, 'side': 1, 'qty': 2, 'execQty': 0, }, … ], },{ 'price': 1500, 'side': 1, 'qty': 20, 'orders': [...],}, ... ]
+ Human readable- Large JSON size- Slow (de)serialization- Objects are noticeably slower
than arrays when dealing with hundreds of items
Array of tuplespriceLevels = [ [ 1000, 1, 10, [ [1421313372687320862, 1, 2, 0 ], …], [ 1500, 1, 20, [ … ], …]
+ Compact JSON size+ Faster (de)serialization- Not easily readable by human- Need to remember index of
price, side, qty, etc...- More work when adding new
properties
We decided to use array of tuples.Structures are assembled in C++ / boost::python module.
Open Source in Quantitative Finance, 5th June 2015 Orderbook Visualization & Analysis
25
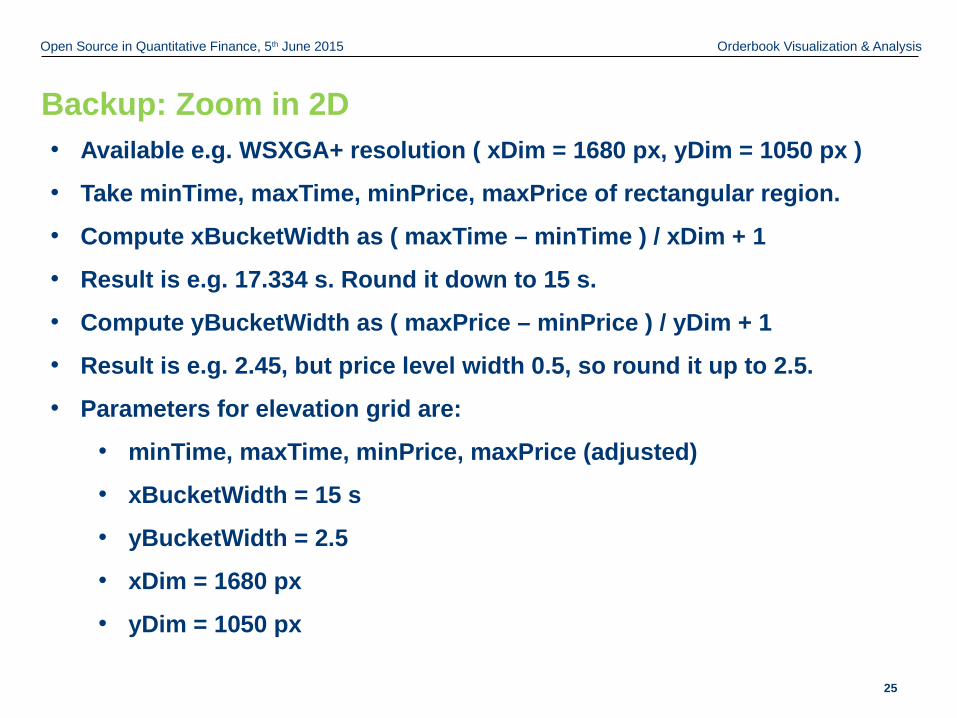
Backup: Zoom in 2D• Available e.g. WSXGA+ resolution ( xDim = 1680 px, yDim = 1050 px )
• Take minTime, maxTime, minPrice, maxPrice of rectangular region.
• Compute xBucketWidth as ( maxTime – minTime ) / xDim + 1
• Result is e.g. 17.334 s. Round it down to 15 s.
• Compute yBucketWidth as ( maxPrice – minPrice ) / yDim + 1
• Result is e.g. 2.45, but price level width 0.5, so round it up to 2.5.
• Parameters for elevation grid are:
• minTime, maxTime, minPrice, maxPrice (adjusted)
• xBucketWidth = 15 s
• yBucketWidth = 2.5
• xDim = 1680 px
• yDim = 1050 px

Open Source in Quantitative Finance, 5th June 2015 Orderbook Visualization & Analysis
26
Backup: X3D: sample scene<x3d id="x3dArea" xmlns="http://www.x3dom.org/x3dom"> <scene id="x3dScene"> <navigationinfo transitionType="linear" transitionTime="0"></navigationinfo>
<shape> <appearance> <twosidedmaterial diffusecolor="0.2 0.6 0.9"></twosidedmaterial> </appearance>
<!-– value for each vertex --> <elevationgrid solid="true" xdimension="329" zdimension="199" height="4 8 8 8 4 4 4 4 5 4 4 4….“>
<!–- computed color for each vertex ( positive-green, negative-red ) --> <color color="0.9 0 0 0.9 0 0……..”></color> </elevationgrid> </shape> </scene></x3d>
• ElevationGrid has limit maximum of 65536 vertices, else scene may
render with deffects
• We need to adjust bin-widths and dimensions to fit this limitation
• When computing best dimensions, we try to be close as possibble to
65536, but not over.
• Max xDim, yDim can be 256x256, 300x218, 335x195, ..., 500x131

Open Source in Quantitative Finance, 5th June 2015 Orderbook Visualization & Analysis
27
Backup: X3D, <ElevationGrid>
http://www.web3d.org/documents/specifications/19775-1/V3.2/Part01/components/geometry3D.html#f-ElevationGridnode