optimizing low-temperature biogas production from biomass by anaerobic digestion
TRANSCRIPT

lable at ScienceDirect
Renewable Energy 69 (2014) 219e225
Contents lists avai
Renewable Energy
journal homepage: www.elsevier .com/locate/renene
Optimizing low-temperature biogas production from biomass byanaerobic digestion
Marek Markowski a,*, Ireneusz Bia1obrzewski a, Marcin Zieli�nski b, Marcin Debowski b,Miros1aw Krzemieniewski b
a Faculty of Engineering, University of Warmia and Mazury in Olsztyn, 10-718 Olsztyn, Heweliusza 14, Polandb Faculty of Environmental Sciences, University of Warmia and Mazury in Olsztyn, 10-719 Olsztyn, Oczapowskiego 5, Poland
a r t i c l e i n f o
Article history:Received 7 November 2012Accepted 21 March 2014Available online
Keywords:Biogas productionAnaerobic digestionContinuous-flow bioreactorMathematical modelingOptimization
* Corresponding author. Tel.: þ48 89 523 3413; faxE-mail address: [email protected] (M. Markows
http://dx.doi.org/10.1016/j.renene.2014.03.0390960-1481/� 2014 Elsevier Ltd. All rights reserved.
a b s t r a c t
The influence of selected geometric bioreactor parameters on the performance of continuous-flow-typelow-temperature biogas production from biomass by anaerobic digestion was studied to determine theoptimal geometric parameters of the digester. A continuous-mode two-stage bioreactor was applied toproduce biogas by anaerobic digestion using model dairy wastewater sludge as substrate. The Monodapproach was used to find the optimal diameter of the two cylinder-separated stages of the reactor thatmaximizes the amount of biogas produced per unit of time. Total biogas production derived from thetheoretically optimized reactor in the calculation model was 1.6 times higher than that derived for theexperimental bioreactor. The methane fraction in biogas increased from 64.5% to 71.2% after optimiza-tion, whereas the carbon dioxide fraction in biogas decreased from 34.5% to 27.8%. The optimization ofthe intermediate cylinder of the digester significantly increased total biogas production (by up to 160%)in comparison with the output noted before optimization.
� 2014 Elsevier Ltd. All rights reserved.
1. Introduction
In the absence of air, biogas is produced by micro-organismsthrough anaerobic digestion. Biogas production from wastewaterand different kinds of organic residues in anaerobic digesters hasbeen studied experimentally and theoretically for six decades [1].Anaerobic digestion is used to treat and recover energy from sludgein wastewater [2], municipal solid wastes [3], agricultural residuesand food processing waste [4e6]. The anaerobic digestion tech-nology offers great potential for rapid disintegration of organicmatter to produce biogas and conserve fossil energy resources [7].There is a growing interest in biogas production, and the number ofbiogas production plants and average plant size continue to in-crease [8].
Mathematical modeling and optimization techniques have tobe applied to increase the profitability of large-scale plants,generate significant benefits without excessive energy use orchemical demand and to scale-up laboratory installations [9,10].Mathematical model-based simulations of bioreactor runs canexplain changes in process variables e biomass, substrate and
: þ48 89 523 4469.ki).
product concentrations e accompanied by temperature changesinside an apparatus. They can also describe the influence of thenutrient feeding rate on substrate digestion and explain howprocess parameters, including time, concentration and composi-tion, should be controlled to guarantee the desired response [11].The models found in scientific literature differ in structure andlevel of complexity [8,11e14]. Different optimization techniquescan be used to improve the performance of the digestion process[15,16]. If a bioreactor (laboratory or technical) is operated in batchmode (unsteady state), the optimization goal is to maximize globalbiogas production at the end of each batch. In the continuousmode of bioreactor operation (steady state), the goal is to maxi-mize the amount of biogas produced in the apparatus per unit oftime.
Bolle et al. [17] and Singhal et al. [18] described hydrodynamicprocesses in laboratory-scale plug-flow UASB reactors. They stud-ied process behavior using two-compartment [18] and multiplemixed-compartmentmodels [17]. Laboratory-scale installations areoften used to study process kinetics before scaling-up to full-scaleapplications. Batstone et al. [19] demonstrated that the hydraulicsof laboratory-scale plug flow-type bioreactors may differ signifi-cantly from that of full-scale digesters. They recommended thatmixed flow-type models should be used instead of plug-flow re-actors for modeling full-scale bioreactors.

Fig. 1. Experimental design diagram: a) two-stage mixed flow reactor; 1. Chamberhydrolyzer, with full mixing, 2. Methanogenic chamber with downside flow, 3.Methanogenic chamber with upside flow, arrows indicate flow direction in the reactor;
M. Markowski et al. / Renewable Energy 69 (2014) 219e225220
In the present study, a continuous-mode two-stage bioreactorwas applied to produce biogas by anaerobic digestion using modeldairy wastewater sludge as substrate. The flow rate of the liquidphase at the inlet was kept constant, therefore, liquid flow veloc-ities in each stage of the digester were constant and determined bythe cylinders’ internal-to-external diameter ratios in each stage ofthe reactor. As part of a mechanistic framework for investigatingmass and energy balances, a set of model equations was adapted todetermine the optimal value of the cylinder’s diameter with twoseparate reaction stages to maximize the amount of biogas pro-duced per unit of time. Optimization methods were also used toestimate the parameters in model equations, and simulation pa-rameters, which were elaborated by simple experiment or found inliterature, were applied. Therefore, the aim of this study was todetermine the influence of a bioreactor’s geometric parameters oncontinuous-flow-type low-temperature biogas production frombiomass by anaerobic digestion and to determine the optimalvalues of the digester’s selected geometric parameters. The benefitsof applying the general ADM1 model for the optimization ofanaerobic digestion are obvious. The ADM1model consists of manydifferential equations and various coefficients need to be accuratelydetermined, therefore, vast efforts (laboratory and programmingwork) are required to ensure the model’s effectiveness [20,21].Since the main aim of the present study was to investigate thepossibility of optimizing methane production based on selectedgeometrical characteristics (radius of the internal cylinder) of thebioreactor as the decision variables, a simplified version of well-established anaerobic digestion models was used in the study.The main aim of this study was to develop a simple but effectivemathematical model of anaerobic biomass digestion and to use thatmodel to optimize biogas production efficiency. A similar attemptcould be made with the application of a full ADM1 model.
2. Materials and methods
2.1. Raw materials and sample preparation
The studywas conducted on anaerobic sludge from an anaerobicdairy wastewater treatment plant. Anaerobic sludgewas adapted toprocess conditions over a period of 60 days. The sampled dairywastewater was produced from milk powder in the amount of 1 gof milk powder per 1 l of water. The organic compound load onreactor volume was C ¼ 1 g COD/l, and the adopted hydraulicretention time (HRT) was 1 day. The main indicators of rawwastewater pollution were determined at: COD ¼ 1000 � 22 mg/l,BOD5 ¼ 676 � 14 mg/l, Ntot ¼ 65 � 4 mg N/l, Ptot ¼ 19 � 2 mg P/l.
The most important and most sensitive fermenting micro-organisms include Archaea of the methanogenic phase. They areresponsible for the vast part of methane production, mainly fromacetic acid. The predominant microbial species in the testedsludge belonged to the generaMethanosarcina andMethanosaeta.
2.2. Experimental setup
The study was conducted in a two-stage variable flow reactorshown in Fig. 1. The reactor consisted of concentric chambersserving as the internal hydrolyzer, and two other chambers actedas methanogenic reactors. An intermediate cylinder-separateddownflow and upflow suspension zones in the methanogenic partof the bioreactor. Raw sewage was pumped to the hydrolyzer(volume of 20 l). A recirculating pump was used to ensure
b) diagram of liquid flow and velocity distribution inside a methanogenic chamber; c)computational model of the methanogenic part of the bioreactor.

M. Markowski et al. / Renewable Energy 69 (2014) 219e225 221
complete mixing in the hydrolyzer. The suction pump pipe waslocated 5 cm below liquid level in the tank. Recycled sludge andraw substrate were placed at the bottom. The inflow to meth-anogenic chambers was located at the top of the hydrolyzer. Thispart of the reactor was characterized by top-down flow: substrateflowed from top to bottom and from bottom to top. This part ofthe reactor relied on plug flow. Methanogenic chambers had thevolume of 40 l each. The bioreactor was operated continuously atconstant mass flow rate at the inlet of the flow meter. Thedescending and ascending parts of the hydrolyzer had differentcross-sections, and different flow rates were observed in eachsection of the reactor.
2.3. Instrumentation
Biogas production efficiency was measured on-line using theAALBORG flow meter (USA). The qualitative composition ofbiogas was determined with the use of the 430 LXi Gas Dataanalyzer (UK). The content of methane, CH4, carbon dioxide, CO2,nitrogen N2 and oxygen, O2 was analyzed. Gas quality measure-ments were performed automatically eight times a day. Thequality of effluent flowing out of the reactor was analyzed daily.COD (HacheLange tests, dichromate oxidation method accordingto AWWA standards), total suspended solids (gravimetricmethod; OX 35 moisture analyzer) and pH were determined(WTW 340 pH analyzer). The changes in biomass concentrationsinside the reactor and the depth of individual reactor chamberswere measured every 10 days. Mesophilic temperature of33 � 2 �C was maintained in the outer chamber. The study wasconducted for 60 days after the determination of the quality ofliquid effluent produced by the bioreactor. The operating pa-rameters remained stable throughout the study, and COD valuesdid not differ by more than 5% between three consecutivemeasurements.
2.4. Calculations
In recent decades, the field of microbial growth kinetics hasbeen dominated by the semi-empirical model proposed by Monod[22]. The Monod model introduced the concept of growth-controlling or limiting substrate. In analyses of microbial growthdynamics, the Monod model is applied to determine the lineardependency between the microbial growth rate and the concen-trations of bacteria with specific growth rates as the proportioncoefficient written in exponential form:
dXdt
¼ mX (1)
where:
m ¼ mmaxS
KM þ S(2)
where: parameter m is the specific growth rate, mmax can be definedas the increase in biomass per unit of time under optimal feedingconditions (no limiting nutrients), and KM is the substrate con-centration at which the growth rate of organisms is substrate-limited to half the prevailing maximum value. Many differentmodels for predicting anaerobic digestion have been proposed inrecent years [23e28]. This study investigates the ability of theMonodmodel to predict bacterial growth during anaerobic biomassdigestion.
The link between microbial growth and substrate consumptiondue to mass formation can be described by formulas (3) and (4).
dSdt
¼ � 1YX=S
dXdt
(3)
where yield coefficient YX/S is defined as:
YX=S ¼ dXdS
(4)
and is assumed to be constant.The end product of the analyzed process is biogas. The kinetics
of product formation can be calculated based on the kinetics ofsubstrate degradation and bacterial growth, respectively. Differentbiogas production models [29,30] rely on the assumption made byGaden [31] that the product results mainly from primary energymetabolism and is generated when the substrate is degraded.Consequently, kinetic equation (5) can be used to describe productformation:
dPdt
¼ YP=XdXdt
(5)
where yield coefficient YP/X is defined as:
YP=X ¼ dPdX
(6)
It was also assumed that the generation of heat from microbialgrowth can be described with the use of formula (7):
dEdt
¼ YE=XdXdt
(7)
where:
YE=X ¼ dEdX
(8)
A macroscopic analysis of the energy balance and the terms forconduction and generation of heat from microbial growth pro-duced formula (9):
rCpvTvt
¼ divðl$gradðTÞÞ þ YE=XdXdt
(9)
It was assumed that microbial growth was an adiabatic process,therefore, the energy balance equation (9) was simplified asfollows:
rCpvTvt
¼ YE=XdXdt
(10)
In a continuous-flow-type bioreactor, it can be assumed thatsimultaneous microbial growth, substrate consumption, productformation and the temperature inside the apparatus are deter-mined by location along the axial coordinate of a bioreactor. Ifthis is the case, the time derivatives in kinetic equations may bereplaced by the product of spatial derivatives and flow rates,which is valid if the system behaves like a plug-flow system. Themathematical model of continuous-flow-type biogas productionfrom biomass by anaerobic digestion was derived from equa-tions (1)e(10) and formulated by accounting for Monod-typespecific microbial growth rate. The model is described byformula (11):
M. Markowski et al. / Renewable Energy 69 (2014) 219e225222
8>>>>>>>>>>>>>><>>>>>>>>>>>>>>:
dXdz
¼ mmax1u
SKM þ S
X
dSdz
¼ �YS=Xmmax1u
SKM þ S
X
dPdz
¼ YP=Xmmax1u
SKM þ S
X
dTdz
¼ YE=Xmmax1u
1rCp
SKM þ S
X
(11)
The following empirical equations were used to describe theeffect of temperature on the specific growth rate, mmax [32]:
mmax ¼
8>>>><>>>>:
mopt if T � Topt�bþ Tmax � Topt
Tmax � Topt
��moptðTmax � TÞbþ Tmax � T
�if Topt � T � Tmax
0 if T � Tmax
(12)where mopt is the specific growth rate at the optimal temperaturefor growth, Topt and Tmax are the maximum temperatures at whichgrowth can occur, and b is the sensitivity of growth kinetics to anincrease in temperature (K). Formula (12) is an empirical equationthat was used to describe different sensitivities to temperatureincrease by modifying a single parameter, b [32]. Kinetic equations(11) and (12) supplemented by boundary conditions (13) were usedto perform computer simulations of low-temperature biogas pro-duction from biomass by anaerobic digestion in a continuous-flow-type column.
8>><>>:
Xðz ¼ 0Þ ¼ XinSðz ¼ 0Þ ¼ SinPðz ¼ 0Þ ¼ 0Tðz ¼ 0Þ ¼ Tin
(13)
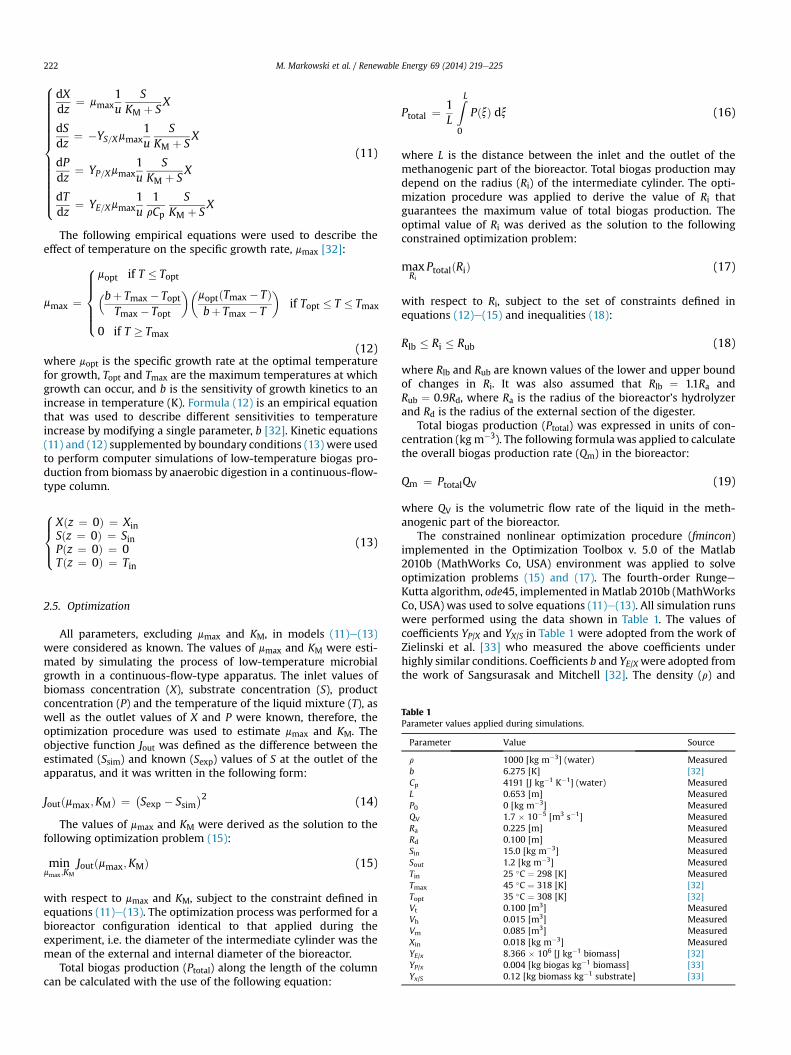
Table 1Parameter values applied during simulations.
Parameter Value Source
r 1000 [kg m�3] (water) Measuredb 6.275 [K] [32]Cp 4191 [J kg�1 K�1] (water) MeasuredL 0.653 [m] MeasuredP0 0 [kg m�3] MeasuredQV 1.7 � 10�5 [m3 s�1] MeasuredRa 0.225 [m] MeasuredRd 0.100 [m] MeasuredSin 15.0 [kg m�3] MeasuredSout 1.2 [kg m�3] MeasuredTin 25 �C ¼ 298 [K] MeasuredTmax 45 �C ¼ 318 [K] [32]Topt 35 �C ¼ 308 [K] [32]Vt 0.100 [m3] MeasuredVh 0.015 [m3] MeasuredVm 0.085 [m3] MeasuredXin 0.018 [kg m�3] MeasuredYE/x 8.366 � 106 [J kg�1 biomass] [32]YP/x 0.004 [kg biogas kg�1 biomass] [33]Yx/S 0.12 [kg biomass kg�1 substrate] [33]
2.5. Optimization
All parameters, excluding mmax and KM, in models (11)e(13)were considered as known. The values of mmax and KM were esti-mated by simulating the process of low-temperature microbialgrowth in a continuous-flow-type apparatus. The inlet values ofbiomass concentration (X), substrate concentration (S), productconcentration (P) and the temperature of the liquid mixture (T), aswell as the outlet values of X and P were known, therefore, theoptimization procedure was used to estimate mmax and KM. Theobjective function Jout was defined as the difference between theestimated (Ssim) and known (Sexp) values of S at the outlet of theapparatus, and it was written in the following form:
Joutðmmax;KMÞ ¼ �Sexp � Ssim
�2 (14)
The values of mmax and KM were derived as the solution to thefollowing optimization problem (15):
minmmax;KM
Joutðmmax;KMÞ (15)
with respect to mmax and KM, subject to the constraint defined inequations (11)e(13). The optimization process was performed for abioreactor configuration identical to that applied during theexperiment, i.e. the diameter of the intermediate cylinder was themean of the external and internal diameter of the bioreactor.
Total biogas production (Ptotal) along the length of the columncan be calculated with the use of the following equation:
Ptotal ¼1L
ZL
0
PðxÞ dx (16)
where L is the distance between the inlet and the outlet of themethanogenic part of the bioreactor. Total biogas production maydepend on the radius (Ri) of the intermediate cylinder. The opti-mization procedure was applied to derive the value of Ri thatguarantees the maximum value of total biogas production. Theoptimal value of Ri was derived as the solution to the followingconstrained optimization problem:
maxRi
PtotalðRiÞ (17)
with respect to Ri, subject to the set of constraints defined inequations (12)e(15) and inequalities (18):
Rlb � Ri � Rub (18)
where Rlb and Rub are known values of the lower and upper boundof changes in Ri. It was also assumed that Rlb ¼ 1.1Ra andRub ¼ 0.9Rd, where Ra is the radius of the bioreactor’s hydrolyzerand Rd is the radius of the external section of the digester.
Total biogas production (Ptotal) was expressed in units of con-centration (kg m�3). The following formulawas applied to calculatethe overall biogas production rate (Qm) in the bioreactor:
Qm ¼ PtotalQV (19)
where QV is the volumetric flow rate of the liquid in the meth-anogenic part of the bioreactor.
The constrained nonlinear optimization procedure (fmincon)implemented in the Optimization Toolbox v. 5.0 of the Matlab2010b (MathWorks Co, USA) environment was applied to solveoptimization problems (15) and (17). The fourth-order RungeeKutta algorithm, ode45, implemented inMatlab 2010b (MathWorksCo, USA) was used to solve equations (11)e(13). All simulation runswere performed using the data shown in Table 1. The values ofcoefficients YP/X and YX/S in Table 1 were adopted from the work ofZielinski et al. [33] who measured the above coefficients underhighly similar conditions. Coefficients b and YE/Xwere adopted fromthe work of Sangsurasak and Mitchell [32]. The density (r) and

Table 2Experimentally determined wastewater treatment efficiency.
Parameters Units Raw sewage Treated wastewater Efficiency [%]
COD mg l�1 1000.0 � 22.4 110.0 � 25.7 89.0 � 3.1BOD mg l�1 676.5 � 14.2 40.6 � 11.2 94.0 � 4.3Ntot mgN l�1 65.2 � 4.3 62.0 � 1.6 4.6 � 1.3Ptot mgP l�1 19.1 � 2.0 18.8 � 0.6 1.2 � 0.9
M. Markowski et al. / Renewable Energy 69 (2014) 219e225 223
thermal capacity (Cp) of the liquid at the inlet and outlet did notdiffer significantly from those observed for water. The remainingparameters given in Table 1 were measured.
Fig. 3. Concentrations of organic compounds in the filtrate before and afteroptimization.
3. Results and discussion
The performance of the bioreactor was analyzed, and theexperimental results of effluent quality and wastewater treatmentefficiency are shown in Table 2. The efficiency of organic compoundremoval was estimated at 89% for COD and 94% for BOD. The dia-gram of the experimental bioreactor is presented in Fig. 1. Thediameter of the intermediate cylinder inside themethanogenic partof the digester (Fig. 1) was equal to 35 cm. The aim of the experi-ment was to determine a diameter of the intermediate cylinder thatwould increase bioreactor efficiency and total biogas production incomparison with that observed before the improvement of biore-actor geometry.
Parameters mmax and KM were estimated as the solution to theconstrained optimization problem (15) where the constraints weredescribed with the use of the Monod approach in formulas (11) and(12). The values of mmax and KM were estimated at 3.527 s�1 and0.5636 kg m�3, respectively. The derived values of mmax and KMwere used to simulate the steady state behavior of a plug-flowdigester. In the first step of the process, the geometrical dimensionsof the experimental bioreactor were used to determine the valuesof mmax and KM. In the second step, optimization problems (16) and(17) were solved to derive the optimal value of the diameter of theintermediate cylinder in the methanogenic part of the digester(Fig. 1). The “improved” value of the diameter was applied tosimulate the behavior of an “optimized” bioreactor.
The changes in the concentrations of biomass, substrate andbiogas production, calculated along the axis of the methanogenicpart of the digester, are shown in Figs. 2e4. Changes in temperatureinside the bioreactor are presented in Fig. 5. The curves displayed in
Fig. 2. Biomass concentrations before and after optimization.
Figs. 2e5 were derived for the diameter of the intermediate cyl-inder before (in black) and after (in red, in the web version) opti-mization (improvement) performed according to formulas (16) and(17). Non-smooth sections of the optimized curves shown inFigs. 2e5 (corresponding to the value of 0.64 on the x-axis) resultfrom changes in the area of cross-sections (transition betweenchambers with different diameters in the methanogenic part of thereactor, Fig. 1c) and rapid changes in the velocity of pumped liquid.The above was not observed in curves representing the experi-mental setup where the applied barrier setting guaranteed equalcross-sectional areas.
Substrate concentrations at the outlet of the methanogenic partof the digester were determined at 1.20 � 0.18 kg m�3. The simu-lated value of the diameter of the intermediate cylinder beforeoptimization did not differ significantly from that noted afteroptimization and was equal to 1.14 kg m�3. The above confirms thelow level of discrepancy between measured and simulated values.Total biogas production rates and the percent distribution of gasesin the biogas, calculated for experimental and optimized values ofthe intermediate cylinder in the methanogenic part of the digester,are presented in Table 3. The optimized diameter was equal to40.5 cm and was derived as the solution to optimization problems
Fig. 4. Product (biogas) concentration before and after optimization.

Fig. 5. Temperature in the methanogenic part of the bioreactor before and afteroptimization.
M. Markowski et al. / Renewable Energy 69 (2014) 219e225224
(16) and (17). The measured rate of total biogas production wasequal to 0.125 g h�1, whereas the rate predicted from themodel wasdetermined at 0.0897 g h�1 (Table 3). The simulated rate of totalbiogas production was underestimated by 28% in comparison withthe measured rate. Selected model parameters were cited fromliterature (e.g. parameter b in equation (12)), which explains thediscrepancy between measured and calculated results. Those dif-ferences were regarded as acceptable, and the calculated andmeasured values were consistent. Therefore, the described modelwas positively validated. Total biogas production derived for anoptimized bioreactor was equal to 0.147 g h�1 and was significantlyhigher than that reported in the experimental configuration at0.125 g h�1. Our results indicate that total biogas productionderived from formulas (11)e(13) for a hypothetic bioreactor withan optimized radius of the cylinder separating downflow andupflow suspension zones in the methanogenic part of the biore-actor was 1.6 times higher than that reported for the experimentalsetup. The modeling process supported the determination of anintermediate cylinder diameter that increases biogas productionabove the level reported in a non-optimized bioreactor. Furtherexperiments are required to validate those results.
The optimal radius of the cylinder, Ri, dividing themethanogenicpart of the bioreactor into descending and ascending zones wasderived by solving the optimization problem described by formulas(16) and (17). The optimal radius of the intermediate cylinder, Ri,was equal to the upper bound and was determined at 40.5 cm. Thedata shown in Fig. 1b clearly indicates that the higher the radius ofthe intermediate cylinder, Ri, the higher the cross-sectional area ofthe descending zone of the methanogenic part of the bioreactor.The above results indicate that the cross-sectional area of thedescending zone of the methanogenic part of the bioreactor shouldbe as high as possible to guarantee maximum biogas production ina laboratory-scale two-stage mixed flow reactor.
Table 3Total biogas production rates and percent distribution of gases in biogas, calculatedfor experimental (Exp) and optimized (Opt) variants of the intermediate cylinder ofthe bioreactor.
Bioreactorgeometry
Qm (g h�1) CH4 (%) CO2 (%) H2S þ NH4 þ O2 (%)
Exp 0.0897 64.5 � 2.3 34.5 � 2.5 1.0 � 0.5Opt 0.147 71.2 � 1.6 27.8 � 1.5 1.0 � 0.3
The qualitative composition of biogas derived for the experi-mental and the optimized configuration of the digester is presentedin Table 3 in terms of percent distribution of gases in the biogas. Themethane fraction of biogas for the experimental digester wasdetermined at 64.5% before optimization and 71.2% after optimi-zation. An inverse relationship was observed for the carbon dioxidefraction of biogas, which was determined at 34.5% in the experi-mental digester and 27.8% in the optimized digester. The datashown in Table 3 confirms that it is possible to find a diameter ofthe intermediate cylinder in the methanogenic part of the biore-actor that enhances methane production in an optimized digester(higher total biogas production) and improves biogas compositionby increasing its methane content and decreasing its carbon diox-ide content.
The results of a performance analysis of an upgraded digesterare not discussed in this paper. Our findings indicate that abioreactor should be characterized by an optimal diameter of theintermediate cylinder in the methanogenic part of the digester.The main purpose of a digester is to treat wastewater andgenerate biogas, but the reduction in the COD or BOD load ofwastewater and the amount of gas produced by a commercialdigester and a scaled digester are not given in this paper. Thoseparameters were measured in the experiment, but the results arenot provided.
In our opinion, the proposed optimization process can beapplied in bioreactors of any size (laboratory, semi-industrial, in-dustrial scale), but since it relies on a simplified mathematicalmodel, the values of the analyzed coefficients have to be deter-mined separately for every optimized bioreactor. The theoreticalflow inside the methanogenic part of the bioreactor can bedescribed with the use of the presented model, but real flow dy-namics will be different because the hydraulic diameter of theconcentric part of the reactor differs from that of a hollow purecylinder. In future work, this problem can be addressed byanalyzing real flow dynamics inside a reactor with the use of theCFD approach.
4. Conclusions
This study presented arguments for optimizing the constructionof anaerobic bioreactors to determine the optimal geometric pa-rameters of the digester. The experiments were conducted onanaerobic sludge from an anaerobic dairy wastewater treatmentplant. The Monod model was applied to describe microbial growthin a digester during low-temperature anaerobic digestion. Our re-sults indicate that the cross-sectional area of the descending zoneof the methanogenic part of the bioreactor should be as high aspossible to maximize total biogas production and optimize thedistribution of different gas fractions in biogas. The optimization ofthe diameter of the intermediate cylinder in an upgraded digestersignificantly increased total biogas production (by up to 160%) incomparison with the output noted before optimization. The di-mensions of the digester should be optimized during bioreactorconstruction to improve total biogas production efficiency.
Mathematical modeling and optimization techniques havemany potential applications for the construction of continuous-flow bioreactors in the biogas industry. An in-depth knowledge ofbiochemical processes in the bioreactor is required to guaranteeoptimal biogas production and stable plant operation. Mathemat-ical models can be used to expand our knowledge of the processand describe the effect of a bioreactor’s parameters, including itsgeometric characteristics, on its performance. The results of thisstudy suggest that bioreactor performance can be enhanced notonly by modifying the digestion control strategy, but also by opti-mizing a digester’s geometrical characteristics.

M. Markowski et al. / Renewable Energy 69 (2014) 219e225 225
Acknowledgments
This study received support from National ProjectPOIG.01.01.02-00-016/08 entitled “Model agro-energy complexesas an example of distributed cogeneration based on local renewableenergy sources” as part of the Innovative Economy OperationalProgram 2007e2013, as well as from the European RegionalDevelopment Fund.
Nomenclature
A organic compound load on reactor volume (1 g COD/l)b sensitivity of growth kinetics to increase in
temperature (K)Cp thermal capacity (J kg�1 k�1)E thermal energy (J m�3)KM saturation constantL total column length (m)P, Ptotal actual total concentration of biogas (product) (kg m�3)Qm total gas production rate in a bioreactor (kg s�1)QV volumetric flow rate of liquid in a bioreactor (m3 s�1)Ra radius of the bioreactor’s hydrolyzer part (m)Rd radius of the bioreactor’s external part (m)Ri radius of the intermediate cylinder (m)Rlb, Rub lower and upper bound of changes in Ri (m)S substrate (general suspensions) concentration (kg m�3)t time (s)T temperature (K)Tmax maximum temperature at which bacterial growth can
occur (K)Topt optimum temperature for bacterial growth (K)u velocity of liquid in a column (m s�1)Vt, Vh, Vmvolume: total, hydrolyzer, methanogenic part (m3)X biomass concentration (kg m�3)YE/X metabolic heat yield coefficient (J kg�1 biomass)YP/X biomass-to-product (kg biogas kg�1 biomass) yield
coefficientYX/S substrate-to-biomass (kg biomass kg�1 substrate) yield
coefficientz coordinate measured along liquid stream inside the
bioreactor (m)
Greek symbolsm specific growth rate (s�1)mmax maximum value of the specific growth rate (s�1)mopt specific growth rate at the optimal temperature (s�1)r density (kg m�3)l thermal conductivity (W m�1 K�1)
Subscripts0 initialexp measuredopt optimalin bioreactor inletout bioreactor outletsim simulated
References
[1] Buswell AM, Mueller HF. Mechanisms of methane fermentation. Ind Eng Chem1952;44:550e2.
[2] Kalloum S, Bouabdessalem H, Touzi A, Iddou A, Ouali MS. Biogas productionfrom the sludge of the municipal wastewater treatment plant of Adrar city(southwest of Algeria). Biomass Bioenergy 2011;35(7):2554e60.
[3] Dhar BR, Youssef E, Nakhla G, Ray MB. Pretreatment of municipal wasteactivated sludge for volatile sulfur compounds control in anaerobic digestion.Bioresour Technol 2011;102:3776e82.
[4] Andara AR, Esteban JML. Kinetic study of the anaerobic digestion of the solidfraction of piggery slurries. Biomass Bioenergy 1999;17:435e43.
[5] Linke B. Kinetic study of thermophilic anaerobic digestion of solid wastes frompotato processing. Biomass Bioenergy 2006;30:892e6.
[6] Menardo S, Balsari P. An analysis of the energy potential of anaerobic diges-tion of agricultural by-products and organic waste. Bioenergy Res 2012;5:759e67.
[7] Mataalvarez J, Mace S, Llabres P. Anaerobic digestion of organic solid waste-sdan overview of research achievements and perspectives. Bioresour Technol2000;74:3e16.
[8] Gerber M, Span R. An analysis of available mathematical models for anaerobicdigestion of organic substances for production of biogas. In: Proceedings ofthe international gas union research conference (IGRC 2008), Paris. http://www.ruhr-uni-bochum.de/thermo/Forschung/pdf/IGRC_Full_Paper_Paris.pdf[accessed 21.10.12.].
[9] Salomoni C, Caputo A, Bonoli M, Francioso O, Rodriguez-Estrada MT,Palenzona D. Enhanced methane production in a two-phase anaerobicdigestion plant, after CO2 capture and addition to organic wastes. BioresourTechnol 2011;102(11):6443e8.
[10] Zhao X, Liu D. Kinetic modeling and mechanisms of acid-catalyzed delignifi-cation of sugarcane bagasse by aqueous acetic acid. Bioenergy Res; 2012.http://dx.doi.org/10.1007/s12155-012-9265-4.
[11] Julien C, Whitford W. Bioreactor monitoring, modeling, and simulation. Bio-process Int Suppl 2007;5(1):10e7.
[12] Husain A. Mathematical models of the kinetics of anaerobic digestion eselected review. Biomass Bioenergy 1998;14(5/6):561e71.
[13] Chen YR, Hashimoto AG. Kinetics of methane fermentation. Biotechnol BioengSymp 1978;8:269e82.
[14] Chen YR, Hashimoto AG. Substrate utilization kinetic model for biologicaltreatment processes. Biotechnol Bioeng 1980;22(10):2081e95.
[15] Cavinato C, Bolzonella D, Fatone F, Cecchi F, Pavan P. Optimization of two-phase thermophilic anaerobic digestion of biowaste for hydrogen andmethane production through reject water recirculation. Bioresour Technol2011;102(18):8605e11.
[16] Shanmugam P, Horan NJ. Optimising the biogas production from leather flesh-ing waste by co-digestion with MSW. Bioresour Technol 2009;100:4117e20.
[17] Bolle WL, van Breugel J, van Eybergen G, Kossen N, van Gils W. An integraldynamic model for the UASB reactor. Biotechnol Bioeng 1986;28:1621e36.
[18] Singhal A, Gomes J, Praveen VV, Ramachandran KB. Axial dispersion model forupflow anaerobic sludge blanket reactors. Biotechnol Prog 1998;14:645e8.
[19] Batstone DJ, Hernandez JLA, Schmidt EJ. Hydraulics of laboratory and full-scaleupflow anaerobic sludge blanket (UASB) reactors. Biotechnol Bioeng2005;91(3):387e91.
[20] Copp JB, Jeppsson U, Vanrolleghem PA. The benchmarks simulation modelse avaluable collection of modelling tools. In: Proceedings international congresson environmental assessment and decision making; 2008. Barcelona, Spain.
[21] Rosen C, Jeppsson U. Aspects on ADM1 implementation within the BSM2framework. Tech. report no. LUTEDX/(TEIE-7224)/1-35/(2006). Lund: Dept ofIndustrial Electrical Engineering and Automation, Lund University; 2006.,http://www.benchmarkwwtp.org [accessed 08.11.12.].
[22] Monod J. Recherches sur la croissance des cultures bacteriennes. Paris: Her-mann; 1942.
[23] Batstone DJ, Keller J, Angelidaki I, Kalyuzhnyi SV, Pavlostathis SG, Rozzi A,et al. The IWA anaerobic digestion model no. 1 (ADM1). Water Sci Technol2002;45(10):65e73.
[24] Amon T, Amon B, Kryvoruchko V, Machmüller A, Hopfner-Sixt K, Bodiroza V,et al. Methane production trough anaerobic digestion of various energy cropsgrown in sustainable crop rotations. Bioresour Technol 2007;98(17):3204e12.
[25] Rao MS, Singh SP. Bioenergy conversion studies of organic fraction of MSW:kinetic studies and gas yield-organic loading relationships for process opti-misation. Bioresour Technol 2004;95(2):173e85.
[26] Angelidaki I, Ellegaard L, Ahring BK. A mathematical model for dynamicsimulation of anaerobic digestion of complex substrates: focusing onammonia inhibition. Biotechnol Bioeng 1993;42:159e66.
[27] Angelidaki I, Ellegaard L, Ahring BK. A comprehensive model of anaerobicbioconversion of complex substrates to biogas. Biotechnol Bioeng 1999;63(3):363e72.
[28] Mosey FE. Mathematical modelling of the anaerobic digestion process: reg-ulatory mechanisms for the formation of short-chain volatile acids fromglucose. Water Sci Technol 1983;15:209e32.
[29] Bryers JD. Structured modelling of the anaerobic digestion of biomass par-ticulates. Biotechnol Bioeng 1985;27:638e49.
[30] Denac M, Griffin K, Lee PL, Greenfleld PF. Selection of controlled variables for ahigh rate anaerobic reactor. Environ Technol Lett 1988;9:1029e40.
[31] Gaden EL. Fermentation process kinetics. J Biochem Microbiol Technol Eng1959;1(4):413e29.
[32] Sangsurasak P, Mitchell DA. Validation of a model describing two-dimensionalheat transfer during solid-state fermentation in packed bed bioreactors. Bio-technol Bioeng 1998;60(6):739e49.
[33] Zieli�nski M, Krzemieniewski M, Debowski M. Technological effects of dairywastewater treatment on anaerobic bed with activated medium. Pol J EnvironStud Ser Monogr 2009;5:83e7.