optimizing biohydrogen production from mushroom cultivation waste using anaerobic mixed cultures
TRANSCRIPT

ww.sciencedirect.com
i n t e r n a t i o n a l j o u r n a l o f h y d r o g e n en e r g y 3 7 ( 2 0 1 2 ) 1 6 4 7 3e1 6 4 7 8
Available online at w
journal homepage: www.elsevier .com/locate/he
Optimizing biohydrogen production from mushroomcultivation waste using anaerobic mixed cultures
Chyi-How Lay a,b, I-Yuan Sung a, Gopalakrishnan Kumar a, Chen-Yeon Chu b,c,d,Chin-Chao Chen e, Chiu-Yue Lin a,b,c,d,*aDepartment of Environmental Engineering and Science, Feng Chia University, TaiwanbGreen Energy Development Center, Feng Chia University, TaiwancDepartment of Chemical Engineering, Feng Chia University, TaiwandMaster’s Program of Green Energy Science and Technology, Feng Chia University, TaiwaneDepartment of Landscape Architecture, Chungchou University of Science and Technology, Taiwan
a r t i c l e i n f o
Article history:
Received 7 December 2011
Received in revised form
19 February 2012
Accepted 23 February 2012
Available online 1 April 2012
Keywords:
Biohydrogen
Mushroom cultivation waste
Anaerobic mixed cultures
* Corresponding author. Department of EnvTaichung, Taiwan 40724, Taiwan. Tel.: þ886
E-mail address: [email protected] (C.-Y. L0360-3199/$ e see front matter Copyright ªdoi:10.1016/j.ijhydene.2012.02.135
a b s t r a c t
The mushroom bag is a polypropylene bag stuffed with wood flour and bacterial nutrients.
After being used for growing mushroom for one to two weeks this bag becomes mushroom
cultivation waste (MCW). About 150 million bags (80,000 tons) of MCW are produced
annually in Taiwan and are usually burned or discarded. The cellulosic materials and
nutrients in MCW could be used as the feedstock and nutrients for anaerobic biohydrogen
fermentation. This study aims to select the inoculum from various waste sludges (sewage
sludge I, sewage sludge II, cow dung and pig slurry) with or without adding any extra
nutrients. A batch test was operated at a MCW concentration of 20 g COD/L, temperature
55 �C and an initial cultivation pH of 8. The results show that extra nutrient addition
inhibited hydrogen production rate (HPR) and hydrogen production yield (HY) when using
cow dung and pig slurry seeds. However, nutrient addition enhanced the HPR and HY in
case of using sewage sludge inoculum and without inoculum. This related to the inhibition
caused by high nutrient concentration (such as nitrogen) in cow dung and pig slurry. Peak
HY of 0.73 mmol H2/g TVS was obtained with no inoculum and nutrient addition. However,
peak HPR and specific hydrogen production rate (SHPR) of 10.11 mmol H2/L/d and
2.02 mmol H2/g VSS/d, respectively, were obtained by using cow dung inoculum without
any extra nutrient addition.
Copyright ª 2012, Hydrogen Energy Publications, LLC. Published by Elsevier Ltd. All rights
reserved.
1. Introduction as clean, efficient, renewable, and does not generate any toxic
Today’s energy system is mainly based on the fossil fuels
which are depleting and cannot be sustainable. In view of the
alternative fuels to overcome the future energy demand,
hydrogen is an attractive fuel because of various features such
ironmental Engineering a4 24517250x6200; fax: þ8in).2012, Hydrogen Energy P
by product on its combustion [1]. Biological hydrogen
production process is one of the main alternative methods.
Producing H2 via fermentative route is more environmental
friendly and less energy intensive, thereby being competitive
to conventional H2 production methods such as thermo-
nd Science, Feng Chia University, 100 Wenhwa Road, Seatwen,86 4 35072114.
ublications, LLC. Published by Elsevier Ltd. All rights reserved.

i n t e rn a t i o n a l j o u r n a l o f h y d r o g e n en e r g y 3 7 ( 2 0 1 2 ) 1 6 4 7 3e1 6 4 7 816474
chemical means [2]. The substrates used in fermentative
hydrogen production are generally rich in carbohydrates like
glucose, sucrose and starch [3]. Currently, biohydrogen and
other biofuels are produced from various agricultural and
bioenergy-generation residues.
At present the biomass from crops like sweet sorghum,
potatoes, sugarcane, soybean and palm oil have been used as
rawmaterials for bioethanol or biohydrogen production [4e8].
The mushroom waste has attained considerable attention
because it is available abundantly and easy to collect and use
as feedstock for the biohydrogen process. Mushroom bag is
a polypropylene bag stuffed with wood flour and nutrients.
After being used for growing mushroom for one to two weeks
this bag becomes mushroom cultivation waste (MCW) About
150 million bags (80,000 tons) of MCW are produced annually
in Taiwan and are usually burned or discarded. Therefore,
proper treatment or usage of this waste could avoid the
environmental problems. Moreover, recent studies show that
this waste could be a feedstock for biohydrogen production in
effective way [11]. The advantages of usingMCW feedstock for
hydrogen production include cost effective because of this
waste being needed to be treated for reducing environmental
pollution problems. However, it has disadvantages such as
further disposal of fermentation residue and solid fermenta-
tion is different from liquid fermentation in operation.
Fermentative hydrogen production process is a tedious
process and requires optimization of inoculums type,
pretreatment, substrate nature and composition, pH and
temperature to scale-up the process. Inoculum selection and
pretreatment are important. Several types of inoculum have
been reported such as sewage sludge [9] and cow dung [10].
Pretreatment of the mushroom cultivation waste by using
acid was also studied [11].
2. Materials and methods
2.1. Seed inocula and substrate
The seed inocula were collected from two municipal waste-
water treatment plants (SS1and SS2), cow dung compost (CD)
and pig slurry (PS) located in central Taiwan. The pH, total
COD (chemical oxygen demand), soluble COD, total carbohy-
drate, volatile suspended solids (VSS, to express the biomass
concentrations), total solids and NH3eN concentrations of the
seed inoculaums are listed in Table 1. The collected sludges
Table 1 e Characteristics of seed inoculms.
Seed pH Total COD Soluble COD
(mg COD/L)
S1 6.9 � 0.1 54,400 � 226 2020 � 28
S2 7.1 � 0.1 70,480 � 1471 2027 � 46
C 7.4 � 0.1 65,680 � 113 7200 � 339
P 7.0 � 0.1 77,200 � 1018 17,280 � 339
S1, Sewage sludge1 (C.H.); S2, Sewage sludge2 (L.M.); C, Cow dung; P, Pig
were heat pretreated at 95 �C for 1 h to inhibit hydrogen-
consuming bacteria.
MCW was collected from a mushroom farm in Changhwa
(central Taiwan). The waste was dried at 105 �C for zero
moisture and then powdered to pass 0.297 mm-mesh sieve.
The characteristics of the mushroom waste are shown in
Table 2.
2.2. Experimental design and procedure
Batch hydrogen production experiments were performed
using serum bottles (125 mL) with anaerobic head space. The
vials were first purged with argon gas followed by adding
10 mL of seed inocula, 40 mL of de-ionized water or nutrient
solution, 10 mL of pH adjustment solution (1 N HCl or 1 N
NaOH) and tested dried MCW agricultural powder ranging
1.2 g per 60 mL working volume (20 g/L). These vials were
placed in a reciprocal air-bath shaker (150 rpm) with a culti-
vation temperature of 55 � 1 �C. The tested initial pH value
was 8.0. The nutrient solution contained inorganic supple-
ments (mg/L): NH4HCO3 5240, K2HPO4 125, MgCl2$6H2O 100,
MnSO4$6H2O 15, FeSO4$7H2O 25, CuSO4$5H2O 5, CoCl2$5H2O
0.125 and NaHCO3 6720 [12]. Each experimental condition was
carried out with duplicate.
2.3. Analytical method
The analytical procedures of APHA Standard Methods [13]
were used to determine pH, oxidation-reduction potential
(ORP), total chemical oxygen demand (TCOD), ammonia
nitrogen (NH3eN), suspended solids (SS) and volatile SS (VSS).
Biogas volume was determined by a gas tight syringe at room
temperature (20 �C) and a pressure of 760 mm Hg. The biogas
composition in the batch enrichment assays was measured
with a CHINA Chromatography 8700T gas chromatograph
equipped with a packed (packing, Porapak Q), stainless steel
column and a thermal conductivity detector. Oven, injector
and detector temperatures were 40, 40 and 40 �C, respectivelyand argon as the carrier gas. Same methods are indicated in
our previous studies [14]. Anthrone-sufuric acid method was
used to measure total carbohydrate concentration [14].
Cellulose, hemicelluloses and lignin were determined by
FIBERTECTM 1020 (M6). Elemental analysis was performed on
an Elemental Analyzer (Model: Vario EL).
Hydrogen production potential (P, mL), maximum
hydrogen production rate (Rm, mL/h) and lag phase time (l, h)
obtained from the modified Gompertz equation (Eq. (1)) [14]
Total carbohydrate(mg/L as glucose)
VSS(g/L)
NH3eN(mg/L)
6424 � 92 21 75
7054 � 215 32 124
10,641 � 226 22 276
2380 � 31 17 243
dung; COD, chemical oxygen demand.

Table 2 e Characteristics of mushroom waste.
TS*(g/L)
VSa
(g/L)TCODa
(G-COD/L)Total
Carbohydratea
(g/L)
Celluloseb
(%)Hemicelluloseb
(%)Ligninb
(%)Ultimate analysis wt % b C/N
ratiobC H N S
0.84 0.78 1.01 0.46 31.2 6.9 14 40.2 5.0 1.4 0.2 28.7
a Tested by the agricultural waste solution with 1 g dried biomass in 1 L solution.
b Tested by dried biomass.
i n t e r n a t i o n a l j o u r n a l o f h y d r o g e n en e r g y 3 7 ( 2 0 1 2 ) 1 6 4 7 3e1 6 4 7 8 16475
were used as the response variable. STATISTIC software
(version 6.0, Statsoft Inc., USA) and Sigmaplot software (trial
version 9.0, Systat Software Inc., USA) were used for regres-
sion and graphical analyses of the data, respectively.
HðtÞ ¼ P$exp
�� exp
�Rm$eP
ðl� tÞ þ 1
��(1)
H(t) is the cumulative hydrogen production (mL); P is the
hydrogen production potential (mL); Rm is the maximum
hydrogen production rate (mL/h); e is 2.71828; l is the lag
phase time (h) and t is the cultivation time (h). The maximum
hydrogen production rate (HPRmax, mmol H2/L-d) was defined
as hydrogen production per working volume per cultivation
time and calculated based on the maximum hydrogen
production rate (Rm, mL/h) obtained from Gompertz equation.
Specific hydrogen production rate (SHPRmax, mmol H2/g VSS-
d) was defined as HPR divided by initial VSS of seed inocu-
lums (5 g/L). Hydrogen production yield (HY, mmol H2/g TVS)
was defined as hydrogen production per gram of dried MCW.
3. Results and discussion
3.1. Hydrogen generation
Table 3 shows that the nutrient addition could enhance the
total biogas production comparingwithwithout extra nutrient
for the same seed inoculum. On the contrary, the hydrogen
contents in biogas of no nutrient addition were higher than
that of with extra nutrients for the same seed inoculum. The
Table 3 e Biogas production using various seed inocula witho
Seed Nutrientformulation
Totalbiogas(mL)
H2
conc.(%)
H2
(mL)Modified Gompertequation paramete
P(mL)
R(mL/h)
l
(h)
SS1 Without 21.0 38.1 8.0 7.8 0.20 3.8 0
With 67.3 25.6 17.2 17.7 0.21 3.8 0
SS2 Without 19.7 38.1 7.5 7.5 0.15 4.6 0
With 73.0 27.1 19.8 20.4 0.20 4.3 0
CD Without 51.5 47.0 24.2 24.3 0.68 26.2 0
With 72.3 16.7 12.1 12.1 0.21 18.1 0
PS Without 20.0 32.0 6.4 6.8 0.05 3.2 0
With 34.3 7.0 2.4 2.3 0.03 9.9 0
EB Without 13.7 30.7 4.2 4.4 0.07 5.9 0
With 150.0 26.3 39.5 40.5 0.27 21.5 0
S1, Sewage sludge1 (C.H.); S2, Sewage sludge2 (L.M.); C, Cow dung; P, Pig
peak hydrogen production of 24.2 mL was obtained using
cow dung seed inoculum without any Endo nutrient
(Fig. 1a and Table 3). However, the hydrogen production was
less than 10 mL for other seed inoculum. Moreover, the
maximum biogas and hydrogen production were 150 mL and
39.5 mL, respectively, with nutrient addition and no seed
inoculum (EB, Endogenous bacteria) (Fig. 2b and Table 3).
A peak HY of 0.73 mmol H2/g TVS was obtained with no
inoculum at nutrient addition (Table 3). This HY value was
about 3 times of HY 0.28 mmol H2/g TVS which was obtained
in beer lees fermentation at 36 �C and pH 7.0 by cow dung
compost [15]. However, peak HPR and SHPR of 10.11 mmol H2/
L/d and 2.02 mmol H2/g VSS/d, respectively, were obtained by
using cow dung inoculum without extra nutrients. This value
is higher than that of converting other agricultural wastes into
hydrogen (Table 4). Fig. 3 depicts that nutrient addition
inhibited HPR and HY when using cow dung and pig slurry
seeds. Biohydrogen production requires certain essential
micro-nutrients such as nitrogen (N), phosphate (P), and some
trace elements for bacterial metabolism, growth and activity
[16]. A proper C/N-ratio value for mixed microflora is neces-
sary to optimize anaerobic hydrogen production from organic
wastewater. The reason of low HY for cow dung and pig slurry
might be that too high nutrient concentration (such as
nitrogen) which inhibited the fermentation (Fig. 3). However,
nutrient addition elevated HPR and HY in the case of using
sewage sludge inoculum and without inoculum. Using cow
dung seed has themost significant increase (240%) in HPR and
SHPR. On the other hand, the HY increased from 0.04 mmol
H2/g TVS with extra nutrients to 0.12 mmol H2/g TVS without
ut and with nutrients.
zr
HPR(mmol H2/L/d)
SHPR(mmol H2/g VSS/d)
HY(mmol H2/g TVS)
R2
.9707 2.97 0.59 0.15
.9795 3.12 0.62 0.32
.9785 2.23 0.45 0.14
.9831 2.97 0.59 0.37
.992 10.11 2.02 0.45
.9981 3.12 0.62 0.22
.9834 0.74 0.15 0.12
.9789 0.45 0.09 0.04
.9674 1.04 N.A 0.08
.9966 4.02 N.A 0.73
dung, EB, Endogenous bacteria.

HY
(m
mol
H2/
g T
VS)
0.0
0.2
0.4
0.6
0.8
1.0
WithoutWith
HP
R (
mm
ol H
2/L
-d)
0
2
4
6
8
10
12
seed
SS1 SS2 CD PS EB
SHP
R (
mm
ol H
2/g
VSS
-d)
0.0
0.5
1.0
1.5
2.0
2.5
Fig. 2 e HY, HPR, and SHPR using various seed inocula (SS1,
Sewage sludge 1 (C.H.); SS2, Sewage sludge 2 (L.M.); C, Cow
dung; PS, Pig dung; EB, endogenous bacteria) without and
with nutrient.
Time (h)
0 50 100 150 200 250 300 350
Acc
umul
ativ
e H
2 pr
oduc
tion
(m
L)
0
10
20
30
40
50
Acc
umul
ativ
e H
2 pr
oduc
tion
(m
L)
0
10
20
30
40
50
SS1 SS2CD PD EB
a
b
Fig. 1 e Hydrogen production using various seed
inoculaums (SS1, Sewage sludge 1 (C.H.); SS2, Sewage
sludge 2 (L.M.); CD, Cow dung; PS, Pig slurry; EB, endogens
bacteria) (a) without and (b) with nutrient formulation.
i n t e rn a t i o n a l j o u r n a l o f h y d r o g e n en e r g y 3 7 ( 2 0 1 2 ) 1 6 4 7 3e1 6 4 7 816476
extra nutrient (Table 3 and Fig. 3). Table 3 also indicates that
long lag phase time (l) values were obtained for the fermen-
tation using pig dung seed with and without extra nutrients
and endogenous bacteria with extra nutrients. Therewere low
C/N ratios because of low carbohydrate concentration and
high NH3eN concentration in these conditions.
Table 4 e Biohydrogen production from various rawagriculture wastes.
Feedstock HPR(mmol H2/L/d)
HY(mmol H2/g TVS)
Reference
Mushroom
waste
10.11 0.45 This study
Mushroom
waste
4.02 0.73 This study
Polar leaves 24.01 0.61 [17]
Beer Lees 46.53 0.13 [20]
Beer lees NA 0.28 [15]
Cornstalk NA 0.13 [21]
3.2. Productions of ethanol and volatile fatty acids
Fig. 3 indicates that the main soluble metabolic product (SMP)
was acetate (1440e4570 mg COD/L, 60.4e86.8% of SMP) from
mushroom MCW wastes substrate after 308 h cultivation.
Similar results were reported during cellulosic materials
fermentation [17,18]. Propionate concentration was high
(1142 mg COD/L, 20.0% of SMP) using pig slurry inoculumwith
low hydrogen production performance (0.04 mmol H2/g TVS)
(Table 5). The reason was that hydrogen production was
inhibited by the cumulated propionate. Similar results were
reported by Vavilin et al. [19]. The peak SMP concentration of
5708mg COD/Lwithout any extra nutrient was obtained using
pig slurry inoculum. However, cow dung and pig slurry seed
inoculum and endogenous bacteria seed could convert the
MCW into high SMP concentrations ranging from 5437 to
5807 mg COD/L.
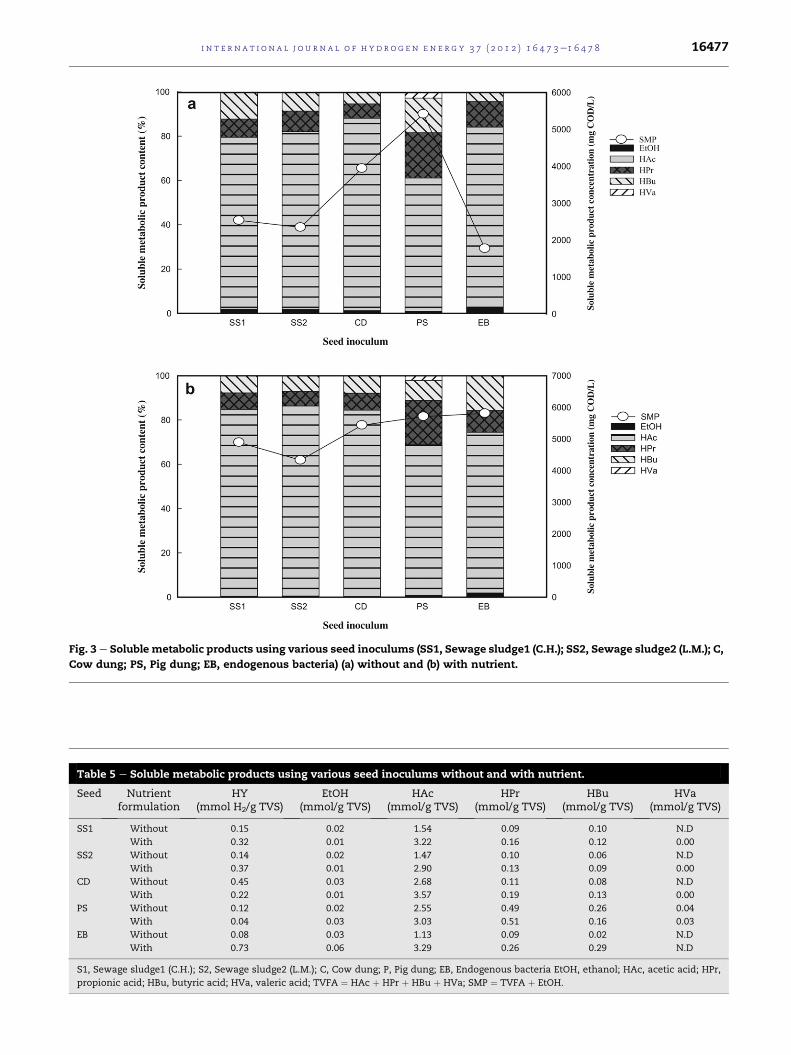
Fig. 3 e Soluble metabolic products using various seed inoculums (SS1, Sewage sludge1 (C.H.); SS2, Sewage sludge2 (L.M.); C,
Cow dung; PS, Pig dung; EB, endogenous bacteria) (a) without and (b) with nutrient.
Table 5 e Soluble metabolic products using various seed inoculums without and with nutrient.
Seed Nutrientformulation
HY(mmol H2/g TVS)
EtOH(mmol/g TVS)
HAc(mmol/g TVS)
HPr(mmol/g TVS)
HBu(mmol/g TVS)
HVa(mmol/g TVS)
SS1 Without 0.15 0.02 1.54 0.09 0.10 N.D
With 0.32 0.01 3.22 0.16 0.12 0.00
SS2 Without 0.14 0.02 1.47 0.10 0.06 N.D
With 0.37 0.01 2.90 0.13 0.09 0.00
CD Without 0.45 0.03 2.68 0.11 0.08 N.D
With 0.22 0.01 3.57 0.19 0.13 0.00
PS Without 0.12 0.02 2.55 0.49 0.26 0.04
With 0.04 0.03 3.03 0.51 0.16 0.03
EB Without 0.08 0.03 1.13 0.09 0.02 N.D
With 0.73 0.06 3.29 0.26 0.29 N.D
S1, Sewage sludge1 (C.H.); S2, Sewage sludge2 (L.M.); C, Cow dung; P, Pig dung; EB, Endogenous bacteria EtOH, ethanol; HAc, acetic acid; HPr,
propionic acid; HBu, butyric acid; HVa, valeric acid; TVFA ¼ HAc þ HPr þ HBu þ HVa; SMP ¼ TVFA þ EtOH.
i n t e r n a t i o n a l j o u r n a l o f h y d r o g e n en e r g y 3 7 ( 2 0 1 2 ) 1 6 4 7 3e1 6 4 7 8 16477

i n t e rn a t i o n a l j o u r n a l o f h y d r o g e n en e r g y 3 7 ( 2 0 1 2 ) 1 6 4 7 3e1 6 4 7 816478
The liquid product analysis shows that the major metab-
olites determined after fermentation were ethanol, acetic,
propionic and butyric acids. Peak hydrogen yieldwas obtained
at nutrient addition using endogenous bacteria seed because
the substrate was efficiently utilized for hydrogen production
by the endogenous bacteria. The possible metabolic pathway
of soluble sugar (mainly glucose) to produce hydrogen at the
maximum yield is shown as Eq. (2):
C6H12O6/0:285H2 þ 1:310CO2 þ 0:023C2H5OH
þ 1:287CH3COOHþ 0:101C2H5COOHþ 0:113C3H7COOH (2)
As shown in Eq. (2), the metabolic pathway was mainly
acetic acid fermentation, and the conversion efficiency of H
element in glucose into H2 was 4.75%.
Theoretically the metabolic pathways of producing acetic
acid from glucose and xylose are as follows:
C5H10O5 þ 1:67H2O/3:33H2 þ 1:67CH3COOHþ 1:67CO2 (3)
C6H12O6þ2H2O/4H2þ2CH3COOHþ 2CO2 (4)
The theoretical metabolic pathway followed mainly acetic
acid fermentation which favors high hydrogen production.
Comparing Eqs. (2)e(4), the acetic acid production from
mushroom wastes was 77.1% and 64.4% from glucose and
xylose. Shifting the metabolic pathway to acetate-butyrate
fermentation could lead to higher hydrogen production.
4. Conclusions
Mushroom cultivation waste could be used as the feedstock
for hydrogen production using waste sludges (sewage sludge,
cow dung and pig slurry) with or without adding any extra
nutrients. Peak HY of 0.73 mmol H2/g TVS was obtained with
nutrient addition by the endogenous bacteria of mushroom
waste. Cow dung inoculum could directly degrade mushroom
waste without any extra nutrients and has peak HPR of
10.11 mmol H2/L/d and SHPR of 2.02 mmol H2/g VSS/d. The
main soluble metabolic product was acetate (1440e4570 mg
COD/L, 60.4e86.8% of SMP) after 308 h cultivation.
Acknowledgments
The authors gratefully acknowledge the financial support by
Taiwan’s Bureau of Energy (grant no. 99-D0204-3), Taiwan’s
National Science Council (NSC-99-2221-E-035-024-MY3, NSC-
99-2221-E-035-025-MY3, NSC-99-2632-E-035-001-MY3), Feng
Chia University (FCU-10G27101) and APEC Research Center for
Advanced Biohydrogen Technology.
r e f e r e n c e s
[1] Hansel A, Lindblad P. Towards optimization of cyanobacteriaas biotechnologically relevant producers of molecularhydrogen, a clean and renewable energy source. ApplMicrobiol Biotechnol 1998;5:153e60.
[2] Das D, Veziroglu TN. Hydrogen production by biologicalprocesses: a survey of literature. Int J Hydrogen Energy 2001;26:13e28.
[3] Lin CY, Lay CH. Research and development of biohydrogenproduction in Taiwan. In: Fang HHP, editor. Environmentalanaerobic technology. London: Imperial College Press; 2010.p. 331e44.
[4] Antoni D, Zverlov V, Schwarz W. Biofuels from microbes.Appl Microbiol Biotechnol 2007;77:23e35.
[5] Antonopoulou G, Gavala HN, Skiadas IV, Angelopoulos K,Lyberatos G. Biofuels generation from sweet sorghum:fermentative hydrogen production and anaerobic digestionof the remaining biomass. Bioresour Technol 2008;99:110e9.
[6] Ivanova G, Rakhely G, Kovacs KL. Thermophilic biohydrogenproduction from energy plants by Caldicellulosiruptorsaccharolyticus and comparison with related studies. Int JHydrogen Energy 2009;34:3659e70.
[7] Kim S, Dale BE. Global potential bioethanol production fromwasted crops and crop residues. Biomass Bioenergy 2004;26:361e75.
[8] Xie B, Cheng J, Zhou J, Song W, Liu J, Cen K. Production ofhydrogen and methane from potatoes by two-phaseanaerobic fermentation. Bioresour Technol 2008;99:5942e6.
[9] Lay CH, Wu JH, Hsiao CL, Chang JJ, Chen CC, Lin CY.Biohydrogen production from soluble condensed molassesfermentation using anaerobic fermentation. Int J HydrogenEnergy 2010;35:13445e51.
[10] Vijayaraghavan K, Ahmad D, Bin Ibrahim MK. Biohydrogen.Generation from jackfruit peel using anaerobic contact filter.Int J Hydrogen Energy 2006;31:569e79.
[11] Li YC, Wu SY, Chu CY, Huang HC. Hydrogen production frommushroom farm waste with a two step acid hydrolysisprocess. Int J Hydrogen Energy 2011;36:14245e51.
[12] Endo G, Noike T, Matsumoto T. Characteristics of celluloseand glucose decomposition in acidogenic phase of anaerobicdigestion (In Japanese). Proc Soc Civ Eng 1982;325:61e8.
[13] APHA. Standard methods for the examination of water andwastewater. New York, USA: American Public HealthAssociation; 1995.
[14] Lay CH, Chang FY, Chu CY, Chen CC, Chi YC, Hsieh TT, et al.Enhancement of anaerobic biohydrogen/methaneproduction from cellulose using heat-treated activatedsludge. Water Sci Technol 2011;63:1849e54.
[15] Fan YT, Zhang GS, Guo XY, Xing Y, Fan MH. Biohydrogen-production from beer lees biomass by cow dung compost.Biomass Bioenergy 2006;30:493e6.
[16] Lin CY, Lay CH. Effects of carbonate and phosphateconcentrations on hydrogen production using anaerobicsewage sludge microflora. Int J Hydrogen Energy 2004;29:275e81.
[17] Cui M, Yuan Z, Zhi X, Wei L, Shen J. Biohydrogen productionfrom poplar leaves pretreated by different methods usinganaerobic mixed bacteria. Int J Hydrogen Energy 2010;35:4041e7.
[18] Sugaya K, Tuse D, Jones JL. Production of acetic acid byClostridium thermoaceticum in batch and continuousfermentations. Biotechnol Bioengg 1986;28:678e83.
[19] Vavilin VA, Rytow SV, Lokshina LY. Modelling hydrogenpartial pressure change as a result of competition betweenthe butyric and propionic groups of acidogenic bacteria.Bioresour Technol 1995;54(2):171e7.
[20] Cui M, Yuan Z, Zhi X, Shen J. Optimization of biohydrogenproduction from beer lees using anaerobic mixed bacteria.Int J Hydrogen Energy 2009;34:7971e8.
[21] Zhang ML, Fan YT, Xing Y, Pan CM, Zhang GS, Lay JJ.Enhanced biohydrogen production from cornstalk wasteswith acidification pretreatment by mixed anaerobic cultures.Biomass Bioenergy 2007;31:250e4.